

In May 1988, the Regional Expert Consultation of the Asia-Pacific Network for Food and Nutrition (RECANFN) proposed the desirable dietary pattern (DDP) score to evaluate the nutritional quality of diets( 1 ). Based on foods, the DDP score of a group of foods is its energy percentage multiplied by a rating. The rating is defined by the nutrient content and nutritional quality of the group of foods. The total score of a diet is the sum of the DDP scores of all groups of foods( 1 ). The DDP score is popular because it is simpler and more convenient than methods evaluated on the basis of nutrients. RECANFN revised the model of the DDP score in 2003( 2 ). Chen proposed a DDP-China for 2000( Reference Chen 3 ) (using the traditional DDP (T-DDP) score model) in 1991. Chinese dietary patterns have changed greatly since then; some residents consume too few cereals, tubers and vegetables, and too much oil and animal foods, which may lead to overweight or obesity( Reference Wang 4 ). As one tool to evaluate dietary patterns, the DDP score also needs to be changed to help Chinese residents improve their dietary patterns to prevent both nutritional deficiencies and chronic non-communicable diseases.
Based on nutrients to encourage (including six to fifteen nutrients) and nutrients to limit (including saturated fat, added sugars and Na), a family of nutrient-rich foods (NRF) indices developed by Drewnowski et al.( Reference Drewnowski and Fulgoni 5 , Reference Fulgoni, Keast and Drewnowski 6 ) focused on the total nutritive value of foods within and among all food groups. For American diets, the index that was most closely correlated with the US Department of Agriculture's 2005 Healthy Eating Index (HEI-2005) was the NRF9·3 index, which contained nine nutrients to encourage and three nutrients to limit( Reference Fulgoni, Keast and Drewnowski 6 ). The NRF9·3 index is a scoring system that objectively evaluates the nutritional quality of foods, that better ranks foods on the basis of their nutrient content, and that can be applied to individual foods, meals, menus and even daily diets( Reference Drewnowski 7 , Reference Drewnowski 8 ). Therefore, the NRF9·3 index is considered a good indicator to validate the DDP score as well.
A diet with a DDP score of 100 points, which is high in nutrients to encourage and low in nutrients to limit, is best beneficial for human health. The aim of the present study was to develop a new model of DDP score (N-DDP score) for evaluating the nutritional quality of Chinese diets. For this purpose, we tried to follow the principles of the T-DDP score and of food grouping in the dietary pagoda for Chinese residents in 2007 (DPCR), to make detailed ratings expressing the food weight coefficient, reasonable maximum limit of the score and an algorithm of the deserved score for each group of foods. Moreover, the efficiency of evaluating the N-DDP score model was validated by means of the NRF9·3 index in as many dietary records as we could possibly collect and compared with the T-DDP score model.
Materials and methods
Data collection
Dietary data set 1 was extracted from the diets recommended by the DPCR( 9 ), the report of the Chinese Residents’ Nutrition and Health Survey (CRNHS) in 2002( Reference Wang 4 ) and the literature on dietary surveys all around the country in China( Reference Fu, Zhang and Wang 10 – Reference Zhang, Yang and Xiang 58 ). Dietary data set 2 was obtained in our dietary history survey on individuals including a fatty liver group, a control group and total subjects in 2011 (L Shi, unpublished results). Dietary data set 3 was from the weighed food records of healthy adults in our energy metabolism study in 2011 (C Huang, unpublished results).
The mean energy and nutrient contents of thirteen groups of common foods were calculated based on data of the energy and nutrient contents of common foods from the China food composition tables( Reference Yang, Wang and Pan 59 ) (see Table 1). The thirteen groups of common foods were: (i) cereals (including wheat, rice, yellow corn grain); (ii) tubers (including potato, sweet potato (white flesh), sweet potato (red flesh)); (iii) meat (including pork (lean and fat), beef, mutton (lean and fat), chicken, duck); (iv) fish and shrimp (including grass carp, eel, common carp, goldfish carp, fatheaded carp, sardine, lobster); (v) eggs (including chicken eggs, duck eggs); (vi) milk (including liquid milk, yoghurt); (vii) beans and products (including soyabean, black soyabean, green soyabean); (viii) nuts and seeds (including walnut, chestnut, pine nut, almond kernel, cashew nut, hazelnut, peanut, sunflower seed); (ix) vegetables (including white radish, carrot, kidney bean, aubergine, tomato, hot pepper (red, small), hot pepper (pale green, sharp top), cucumber, pumpkin, garlic bulb, bok choi, rape, spinach, celery stem, lettuce stem, lotus root); (x) fruit (including apple, pear, peach, grape, orange, banana, watermelon); (xi) added oil and fat (including beef tallow, lard, rapeseed oil, peanut oil, salad oil, corn oil, sesame oil); (xii) sugars and sweeteners (including beet sugar, honey, peanut toffee, toffee, chocolate, peanut brittle); and (xii) beverages and wine (including carbonated beverages, tea beverages, fruit and vegetable juice beverages, protein beverages, coffee beverages, special usage beverages, beer, distilled spirit).
Energy and nutrient contents per 100 g in thirteen groups of common foods
DF, dietary fibre; VA, vitamin A; RE, retinol equivalents; VE, vitamin E; α-TE, α-tocopherol equivalents; VC, vitamin C; SF, saturated fat; AS, added sugar.
Development of N-DDP score model
Table 2 shows the DDP-China for 2000 (T-DDP score model) proposed by Chen in 1991( Reference Chen 3 ). Adhering to the principles of DDP scoring in Table 2, the N-DDP score model was developed according to the following points: (i) the food grouping was defined based on the diets recommended by the DPCR( 9 ) and the thirteen groups of common foods mentioned above were included in the N-DDP score model; (ii) the energy percentage was defined based on the energy percentage of each group of foods at the 9205 kJ (2200 kcal) level of daily diet recommended by the DPCR( 9 ); (iii) the rating of foods ranged from 0·5 to 2·5 and was identified by considering both nutrients to encourage and nutrients to limit; and (iv) the maximum limit of the score and the algorithm of the deserved score for each group of foods were defined after considering current nutritional problems of Chinese residents. It was defined that the total score was <60 points for a poor dietary pattern, ranged from 60 to 80 points for a good dietary pattern, and was >80 points for a desirable dietary pattern.
The T-DDP score model proposed by Chen( Reference Chen 3 )
T-DDP score, traditional DDP score (DDP-China for 2000); DDP, desirable dietary pattern.
Example for calculation of the scores for food items: (i) energy percentage from the food × rating = score; (ii) add all scores of food items = total score; (iii) when the score for a food item exceeds the maximum limit of the score, the score must be counted at the limit. For example: when the energy percentage from cereals = 85, 85 × 0·5 = 42·5; since the maximum limit for cereals is 40 the score must be limited to 40, not 42·5 as calculated.
Validation of N-DDP score model against NRF9·3 index
The validation was conducted by comparing the coefficients of determination (R 2) and regression coefficients (β) in regression analyses of DDP scores v. NRF9·3 indices among the two models. The DDP scores in the three dietary data sets were calculated with the N-DDP score model and the T-DDP score model, separately. The NRF9·3 indices in the three dietary data sets were calculated as the sum of the per cent nutrient reference value (NRV)( Reference Yin and Yang 60 ) per 418·4 kJ (100 kcal) of nutrients to encourage minus the sum of the per cent NRV per 418·4 kJ (100 kcal) of three nutrients to limit, as follows:
 $$\[--><$$l> { {\rm{NRF}}\;{\rm{9}} \cdot {\rm{3}}\;{\rm{index}}\, \cr & \quad= \,{\rm{\big\{ [protein}}\;({\rm{g}}/{\rm{418}} \cdot {\rm{4}}\;{\rm{kJ}}){\rm{]}}/({\rm{60}}\;{\rm{g}}) \cr & \quad\quad+ \,[{\rm{dietary}}\;{\rm{fibre}}\;({\rm{g}}/{\rm{418}} \cdot {\rm{4}}\;{\rm{kJ}})]/({\rm{25}}\;{\rm{g}})\, \cr & \quad\quad+ \, [{\rm{vitamin}}\;{\rm{A}}\;({\rm{\rmu g}}\;{\rm{RE}}/{\rm{418}} \cdot {\rm{4}}\;{\rm{kJ}})]/({\rm{800}}\;{\rm{\rmu g}}\;{\rm{RE}}) \cr & \quad\quad+ \,[{\rm{vitamin}}\;{\rm{C}}\;({\rm{mg}}/{\rm{418}} \cdot {\rm{4}}\;{\rm{kJ}})]/({\rm{100}}\;{\rm{mg}})\, \, \cr & \quad\quad +\,[{\rm{vitamin}}\,{\rm{E}}\;({\rm{mg}}\;{\rm{\alpha {\hbox-} TE}}/{\rm{418}} \cdot {\rm{4}}\;{\rm{kJ}})]/({\rm{14}}\;{\rm{mg}}\;{\rm{\alpha {\hbox-} TE}}) \cr & \quad\quad+ \,[{\rm{Ca}}\;({\rm{mg}}/{\rm{418}} \cdot {\rm{4}}\;{\rm{kJ}})]/({\rm{800}}\;{\rm{mg}})\, \, \cr & \qquad+ \,[{\rm{Fe}}\;({\rm{mg}}/{\rm{418}} \cdot {\rm{4}}\;{\rm{kJ}})]/({\rm{15}}\;{\rm{mg}})\, \cr\qquad+ \,[{\rm{Mg}}\;({\rm{mg}}/{\rm{418}} \cdot {\rm{4}}\;{\rm{kJ}})]/({\rm{300}}\;{\rm{mg}}) \cr & \qquad + \,[{\rm{K}}\;({\rm{mg}}/{\rm{418}} \cdot {\rm{4}}\;{\rm{kJ}})]/({\rm{2000}}\;{\rm{mg}})\, \, \cr & \qquad-\,[{\rm{saturated}}\;{\rm{fat}}\;({\rm{mg}}/{\rm{418}} \cdot {\rm{4}}\;{\rm{kJ}})]/({\rm{20}}\;{\rm{g}}) \cr & \qquad - \,[{\rm{added}}\;{\rm{sugars}}\;({\rm{mg}}/{\rm{418}} \cdot {\rm{4}}\;{\rm{kJ}})]/({\rm{50}}\;{\rm{g}}) \cr & \qquad- \,[{\rm{Na}}\;({\rm{mg}}/{\rm{418}} \cdot {\rm{4}}\;{\rm{kJ}})]/({\rm{2000}}\;{\rm{mg}}){\rm{\big\} }}\,\times \,{\rm{100,}} \cr} \eqno\rm$$
where RE is retinol equivalents and α-TE is α-tocopherol equivalents.
In the present study the Chinese NRV( Reference Yin and Yang 60 ) were used for calculating the NRF9·3 index suitable for Chinese diets. The value for added sugars was based on ∼10 % of a 8368 kJ (2000 kcal)/d diet, or 50 g/d( Reference Drewnowski and Fulgoni 5 ), which was one of the reference values of nutrients to limit( Reference Fulgoni, Keast and Drewnowski 6 ). Because there is no criterion for added sugars in Chinese NRV, 50 g of added sugars/d was adopted to calculate the NRF9·3 index.
Statistical analyses were performed with the statistical software package SPSS17·0 for Windows. Analyses of the difference in DDP scores between the T-DDP score model and the N-DDP score model were conducted using the paired-samples t test (two-sided). Linear regression analyses were conducted using DDP scores as the dependent variable and NRF9·3 indices as the independent variable. The regression model was: DDP score = α + β·NRF9·3 index. The percentage of the variation explained (coefficient of determination, R 2), regression coefficient (β) and P value of the models were used to assess validation of all models of DDP score( Reference Fulgoni, Keast and Drewnowski 6 ). P values < 0·01 were considered statistically significant.
Results
Table 3 shows the N-DDP score model developed in the present study and an example to calculate N-DDP score.
The N-DDP score model and example to calculate N-DDP score
N-DDP score, a new model of DDP score; DDP, desirable dietary pattern.
Cereals and tubers were scored separately. In animal products, meat was scored alone, but fish and shrimp and eggs were combined to score. Milk, beans and products, nuts and seeds were united to score. Vegetables and fruit were integrated to score. Pure-energy foods, including added oil and fat, sugars and sweeteners, beverages and wine, were scored as a whole.
Example for calculation of the scores for food items: B = A × energy (kJ/100 g) shown in Table 1; C = energy percentage; D = rating; E = calculated score. If the calculated score for a food item is less than or equal to the maximum limit of the score, the deserved score = the calculated score. If the calculated score for a food item is greater than the maximum limit of the score, the deserved score = maximum limit of the score – [(calculated score – maximum limit of the score)/2]. *G = F – [(E – F)/2] = 4·00 − [(5·35 – 4·00)/2] = 3·33. Add all scores of food items = total score.
Table 4 describes the DDP scores and NRF9·3 indices in the three dietary data sets. The NRF9·3 indices among the three dietary data sets ranged from 39·31 (se 0·28) to 48·11 (se 0·40). The DDP scores ranged from 90·27 (se 0·70) to 95·79 (se 0·50) by the T-DDP score model, and from 66·06 (se 0·87) to 81·13 (se 0·57) by the N-DDP score model. Paired-samples t tests showed that the DDP score obtained by the N-DDP score model was significantly lower than that obtained by the T-DDP score model for each dietary data set (P = 0·000, two-sided), and that both the NRF9·3 index and the DDP scores obtained by the T-DDP score model and the N-DDP score model for the fatty liver group were significantly lower than those of the control group (P = 0·000, two-sided) in dietary data set 2.
The description of DDP scores and NRF9·3 indices of the three dietary data sets
DDP, desirable dietary pattern; NRF, nutrient-rich foods; N-DDP score, a new model of DDP score; T-DDP score, traditional DDP score (DDP-China for 2000).
*The DDP scores obtained by the N-DDP score model were significantly lower than those obtained by the T-DDP score model (P = 0·000, two-sided) for each dietary data set.
†Both the NRF9·3 index and DDP scores obtained by the T-DDP score model and the N-DDP score model of the fatty liver group were significantly lower than those of the control group (P = 0·000, two-sided) in dietary data set 2.
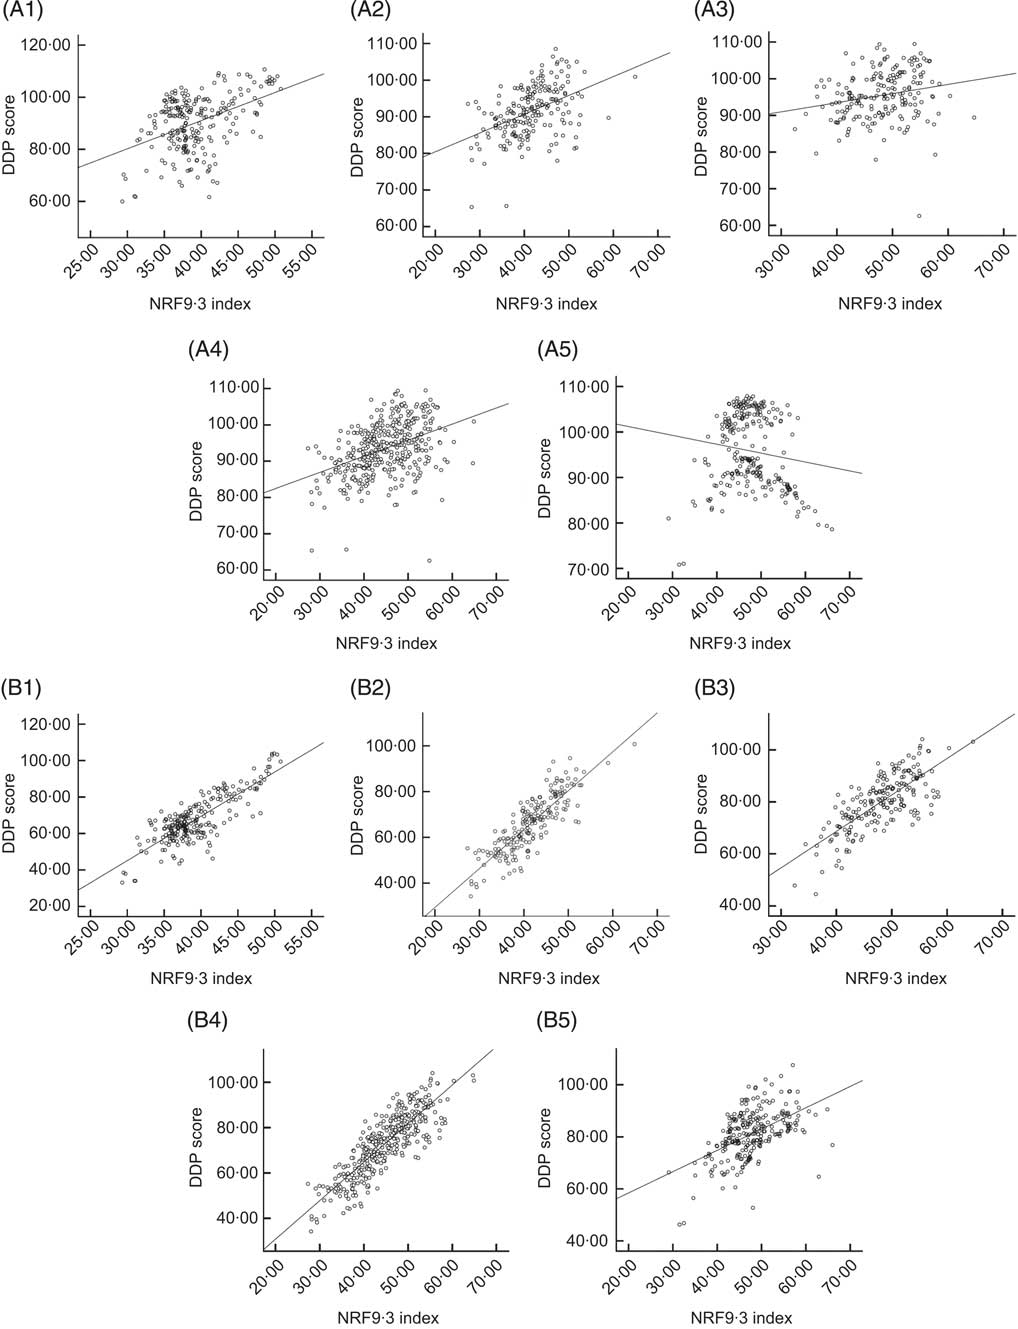
Linear regression analyses of DDP score v. NRF9·3 index were conducted for the three dietary data sets for each of the two models (see Fig. 1). All DDP scores were positively correlated (P < 0·01) with NRF9·3 indices except that by the T-DDP score model in dietary data set 3 (P = 0·024; see Table 5). The N-DDP score model had higher R 2 values with the NRF9·3 index than the T-DDP score model in the three dietary data sets (0·668 v. 0·194 respectively for dietary data set 1, 0·713 v. 0·204 respectively for dietary data set 2 (fatty liver group), 0·556 v. 0·044 respectively for dietary data set 2 (control group), 0·723 v. 0·177 respectively for dietary data set 2 (total subjects), 0·273 v. 0·020 respectively for dietary data set 3), as well as higher β values (correspondingly: 2·431 v. 1·081, 1·700 v. 0·514, 1·400 v. 0·249, 1·699 v. 0·443, 0·818 v. −0·195).
Linear regression of desirable dietary pattern (DDP) score v. nutrient-rich foods (NRF9·3) index for Chinese diets. (A1), (A2), (A3), (A4) and (A5) show the linear regression of DDP scores obtained by the traditional DDP (T-DDP) score model v. NRF9·3 indices in dietary data set 1, dietary data set 2 (fatty liver group), dietary data set 2 (control group), dietary data set 2 (total subjects) and dietary data set 3, respectively. (B1), (B2), (B3), (B4) and (B5) show the linear regression of DDP scores obtained by the new DDP (N-DDP) score model v. NRF9·3 indices in dietary data set 1, dietary data set 2 (fatty liver group), dietary data set 2 (control group), dietary data set 2 (total subjects) and dietary data set 3, respectively
Results from the linear regression analyses of DDP scores v. NRF9·3 indices of the three dietary data sets
DDP, desirable dietary pattern; NRF, nutrient-rich foods; T-DDP score, traditional DDP score (DDP-China for 2000); β, regression coefficient; R 2, coefficient of determination.
Regression equation: DDP score = α + β·NRF9·3 index.
As shown in Table 6, the diets (A to G) recommended by DPCR in 2007 had higher NRF9·3 indices (range 47·20–50·33) and DDP scores (range 95·69–103·92) calculated by the N-DDP score model that were within the range of a desirable dietary pattern defined in the current paper. The urban, rural and total diets (H to I) for Chinese residents in 2002 had lower NRF9·3 indices (range 35·93–37·09) and lower DDP scores (range 64·75–67·45) calculated by the N-DDP score model.
DDP scores and NRF9·3 indices of Chinese diets

DDP, desirable dietary pattern; NRF, nutrient-rich foods; T-DDP score, traditional DDP score (DDP-China for 2000); N-DDP score, a new model of DDP score; DPCR, the dietary pagoda for Chinese residents in 2007( 9 ).
The energy of diets A–G recommended by DPCR were 6694 kJ (1600 kcal), 7531 kJ (1800 kcal), 8368 kJ (2000 kcal), 9205 kJ (2200 kcal), 10 042 kJ (2400 kcal), 10 878 kJ (2600 kcal) and 11 715 kJ (2800 kcal), respectively. Diets H–J were urban, rural and total diets for Chinese residents in 2002( Reference Wang 4 ).
Discussion
Designation of energy percentage and rating of each group of foods
DPCR( 9 ) recommended the intake of each group of foods at seven levels of total daily energy (6694 kJ, 7531 kJ, 8368 kJ, 9205 kJ, 10 042 kJ, 10 878 kJ, 11 715 kJ) for Chinese residents. CRNHS in 2002 reported that the average energy intake for Chinese residents was 9421 kJ (2251·6 kcal) per standardized individual and day( Reference Wang 4 ). So in the present study, the energy percentage was defined based on the energy percentage of each group of foods at the 9205 kJ level of diet recommended by DPCR( 9 ).
The report of the CRNHS in 2002 showed that Chinese residents had universally insufficient intakes of vitamin A, vitamin B2, Ca, Fe, Zn and dietary fibre, and that some residents had low intakes of cereals, tubers and vegetables, and excessive intakes of oil and animal foods which led to excessive energy. The prevalence of chronic non-communicable diseases including overweight, obesity, hypertension, hyperlipidaemia and diabetes mellitus related to unreasonable diets was growing quickly( Reference Wang 4 ). The N-DDP score model designated a larger rating to foods rich in vitamin A, vitamin B2, Ca, Fe, Zn or dietary fibre (1·5 to milk; 2·0 to tubers and eggs; 2·5 to vegetables and fruit), and increased the maximum limit of the score for these groups of food. On the other hand, the N-DDP score model gave a smaller rating to foods rich in saturated fat, Na, added sugars and energy (0·5 to meat, nuts and seeds, and pure-energy foods), and strictly restricted the maximum limit of the score for these groups.
Cereals and tubers in scoring
Rich in dietary fibre, vitamin A, vitamin C, K and Mg( Reference Yang, Wang and Pan 59 ), tubers are encouraged for greater consumption among Chinese residents by Chinese dietary guidelines( 9 ); tubers ought to contribute to the total score. In the T-DDP score model, if cereals supply so much energy that their score exceeds the maximum limit, cereals will conceal tubers’ contribution to the total score. Consequently, tubers were better to be separated from cereals for scoring in the N-DDP score model. The maximum limit of the scores for ‘cereals’ and ‘tubers’ was increased greatly because these groups of foods were reported to have low intake among Chinese residents in the 2002 CRNHS( Reference Wang 4 ) and were encouraged for increased daily consumption by the 2007 Chinese dietary guideline( 9 ).
Animal products, nuts and seeds in scoring
In the N-DDP score model, animal products were split into three parts for scoring. Scoring ‘meat’ alone was undertaken to limit its contribution to the total score, which was expected to guide Chinese residents to decrease their intake of meat, especially red meat (pork, beef and mutton). The maximum limit of the score for ‘meat’ was strictly restricted because intake of this group of foods was reported to be excessive among Chinese residents in the 2002 CRNHS( Reference Wang 4 ) and it was recommended to consume meat properly every day by the 2007 Chinese dietary guideline( 9 ). Chinese dietary guidelines recommend Chinese residents to often eat ‘fish and shrimp’( 9 ) because they are high in excellent protein and low in fat and cholesterol( Reference Yang, Wang and Pan 59 ). Similarly, Chinese dietary guidelines recommend Chinese residents often to eat ‘eggs’( 9 ), which are rich in vitamins like vitamin A and minerals like Fe and Zn in spite of their high cholesterol content( Reference Yang, Wang and Pan 59 ). So ‘fish and shrimp’ and ‘eggs’ were better combined for scoring. Chinese dietary guidelines encourage Chinese residents to drink ‘milk’ and eat ‘beans and products’ every day( 9 ) in order to supplement Ca and for their excellent protein. Despite high energy content, ‘nuts and seeds’ are rich in MUFA, PUFA, vitamins and minerals( Reference Yang, Wang and Pan 59 ). Hence ‘nuts and seeds’ were better united with ‘milk’ and ‘beans and products’ to score, rather than to be classified as ‘pure-energy foods’. The combined maximum limit of the score for ‘fish and shrimp’ and ‘eggs’, as well as for ‘milk’, ‘beans and products’ and ‘nuts and seeds’, was properly restricted because these groups of foods were recommended to be consumed properly every day by the 2007 Chinese dietary guideline( 9 ).
Pure-energy foods in scoring
The report of the CRNHS in 2002( Reference Wang 4 ) showed that Chinese urban residents ingested up to 85·5 g of lipids per reference individual daily, which was up to 35 % of total daily energy and surpassed the upper limit of energy percentage. The results of the survey also showed that drinking alcohol had become a common behaviour( Reference Ma, Zhu and Hu 61 ). The overall heavy drinking rate of adults in China was 4·7 %, of which 8·4 % among males and 0·8 % among females( Reference Ma, Du and Hao 62 ). The epidemiological and experimental evidence indicated that a greater consumption of sugar-sweetened beverages was associated with weight gain (i.e. overweight, obesity, or both)( Reference Malik, Schulze and Hu 63 ). Most of the beverages for sale in China contain mainly added sugars or sweeteners that supply a lot of energy( Reference Li, Piao and Yang 64 ). In conclusion, the pure-energy foods including ‘added fats and oils’, ‘sugars and sweeteners’ and ‘beverages and wine’ were scored as a whole, and strictly restricted to a maximum limit score of 6 points, which was expected to guide Chinese residents to reduce their intake of pure-energy foods.
The Chinese nutrient reference values and the American daily values
The NRF9·3 index was calculated based on the reference values of the American daily values (DV)( Reference Drewnowski and Fulgoni 5 , Reference Fulgoni, Keast and Drewnowski 6 ). According to the food labelling guide revised by the US Food and Drug Administration( 65 ), DV were established for reporting nutrients in nutrition labelling of food products. Similarly, the Chinese Nutrition Society established NRV for the same purpose( Reference Yin and Yang 60 ). The Chinese NRV were established in the light of two indices of Chinese dietary reference intakes: (i) recommended nutrient intake (RNI) and (ii) adequate intake (AI). The values of some nutrients are different between American DV and Chinese NRV. For instance, vitamin A is 1665 μg RE (1 μg RE = 3 IU for vitamin A) for American DV, but 800 μg RE for Chinese NRV; and Ca is 1000 mg for American DV, but 800 mg for Chinese NRV. Without question, the American DV were proposed for American foods eaten by American residents and the Chinese NRV were established for Chinese foods eaten by Chinese residents. So the Chinese NRV may be more appropriately used in the NRF9·3 index for evaluating the nutritional quality of Chinese diets in the present study.
Validation with three dietary data sets
In the present study, the three dietary data sets used to validate the N-DDP score model were collected from dietary surveys conducted between 2002 and 2011. The average DDP score was ranked as a ‘desirable’ dietary pattern by the T-DDP score model and ranked as a ‘good’ dietary pattern by the N-DDP score model for each dietary data set. Paired-samples t tests showed that the DDP scores obtained by the N-DDP score model were significantly lower than those obtained by the T-DDP score model, which indicates that the N-DDP score might be more reasonable to evaluate current diets. The N-DDP score model might reflect and adapt to the great change in dietary patterns of Chinese residents. Both the NRF9·3 index and the DDP score obtained by the N-DDP score model of the fatty liver group were significantly lower than those of the control group in dietary data set 2, which indicates that the N-DDP score model could be used to evaluate the dietary patterns of groups as well as individuals.
In summary, the N-DDP score model detailed the rating coefficients, the maximum limit of the scores and the algorithm of the deserved score on the basis of the nutritional value of each group of foods and current nutritional problems of Chinese residents. The regression analysis with higher coefficient of determination (R 2) and regression coefficient (β) validated that the N-DDP score model was more accurate and sensitive to evaluate the dietary pattern for Chinese residents. Moreover, it was simple and convenient to calculate the total score of diets based on the energy percentage of each group of foods.
Conclusion
It can be considered that the N-DDP score model is a more accurate and convenient tool to evaluate current individual and group diets for Chinese residents.
Acknowledgements
Sources of funding: The present study was supported by the projects of the Ministry of Education (2010SCU21002) and of the Department of Science and Technology of Sichuan Province (09ZC1270). Conflicts of interest: None of the authors have a known conflict of interest. Ethics: Ethical approval was not required. Authors’ contributions: The study was designed by C.H. and Z.Z. The dietary data were collected and sorted by Z.Z., W.H., R.X. and L.S. The data analyses were performed by Z.Z. and M.L. The manuscript was written, edited and reviewed by Z.Z. and C.H.


