




1. Introduction
2022 was the fiftieth anniversary of an important milestone in the study of Canadian English: the publication in 1972 of M. H. Scargill and H. J. Warkentyne’s Survey of Canadian English (SCE; Warkentyne Reference Warkentyne1971, Scargill and Warkentyne Reference Scargill and Warkentyne1972, Scargill Reference Scargill1974). The SCE was the first effort to study Canadian English on a national scale, from coast to coast, and was remarkably successful: it produced data on 104 linguistic variables from 14,228 respondents in every province of Canada, including both Grade 9 students and their parents, of both sexes. These data can support analyses of regional and social variation as well as change over “apparent time”, measured by generational differences between parents and students, which was the major concern of the authors (Warkentyne Reference Warkentyne1971: 195, Scargill and Warkentyne Reference Scargill and Warkentyne1972: 103). Despite this achievement, the SCE fell into undeserved obscurity: publication well before the digital age in English Quarterly, a journal aimed at English teachers rather than linguists and no longer in print, made its data inaccessible to many scholars. Even Scargill and Warkentyne themselves did not publish further analyses beyond the above-cited original reports in the early 1970s (but see Rodman Reference Rodman1974 and Kinloch Reference Kinloch1975 for analyses of the British Columbia and New Brunswick data, respectively). Today, therefore, five decades later, the SCE’s legacy represents a unique opportunity to study language change over “real time”, by asking the same questions to representatives of the contemporary Canadian population and comparing the answers. This article presents the results of such a replication, allowing us to examine the long-term trajectory of Canadian English over two generations of its speakers.
In particular, the new survey reveals:
• whether the regional differences of 1972 have increased or decreased;
• whether the speech of the 1972 generations – now in their 60s and 80s, respectively – has shifted since they were originally surveyed;
• how the speech of today’s parents and teenagers differs from their analogues in 1972; and
• whether Canadian English is converging with American English (as suspected or feared by many) or following an independent path, thereby preserving its “linguistic autonomy” (Chambers and Trudgill Reference Chambers and Trudgill1980, Dollinger and Clarke Reference Dollinger and Clarke2012).
These are important issues for scholars interested in the study of Canadian English in particular, but they also relate to broader concerns: questions of linguistic variation and change in general and, beyond the linguistic domain, of Canadian history, society, and cultural identity.
The SCE exemplifies the dialectological tradition of using self-administered written questionnaires (filled out by respondents themselves) to investigate variation in words, pronunciation and grammatical forms over large territories, rather than employing fieldworkers to elicit data from informants. This tradition begins in at least some respects with Georg Wenker’s work in the late 19th century on the Deutscher Sprachatlas, or German Linguistic Atlas (Wenker et al. Reference Wenker, Wrede, Mitzka and Martin1927–1956); subsequent surveys, such as the English Dialect Dictionary (Wright Reference Wright1898–1905) and the Linguistic Survey of Scotland (Mather and Speitel Reference Mather and Speitel1975–1986), have further developed and modified the method (see Dollinger Reference Dollinger2015 for a review of this history). Written surveys have been especially productive in the study of Canadian English (Chambers Reference Chambers1998a, Reference Chambers, Boberg, Nerbonne and Watt2018; Dollinger Reference Dollinger2012, Reference Dollinger2015; Boberg Reference Boberg, Mallinson, Childs and Van Herk2018): while they involve limitations connected with the nature of self-reporting and the use of conventional spelling, which puts phonetic variation (such as sub-phonemic differences in vowel quality) beyond the reach of investigators (Avis Reference Mather and Speitel1954–1956), they also afford many advantages, not least the ability to survey thousands of speakers over a large territory relatively quickly and at relatively little cost. It is difficult to imagine, for instance, the time and expense that would be involved in extending the traditional sociolinguistic interviews carried out by Gregg et al. (Reference Gregg, de Wolf, Esling, Hasebe-Ludt, Murdoch, Richards, Rodman, de Wolf, Fee and McAlpine2004) in Vancouver, Woods (Reference Woods1999) in Ottawa, Boberg (Reference Boberg2014) in Montreal, or Tagliamonte (Reference Tagliamonte2006) in Toronto, to a cross-country sample of thousands.
The types of data gathered by written surveys typically involve variation in vocabulary, morphosyntax, and the pronunciation of individual words (or phonemic incidence, i.e., the distribution of phonemes across the lexicon). Many of the variables investigated in the present survey have a high public profile, like the choice between zed and zee as the last letter of the alphabet, or the alternate pronunciations of words like new and student, with or without the palatal glide. Such variables play an important role in dialect ideology, or public attitudes connected with dialect variation, and more broadly in national, regional, and social identity. Other variables are the subject of debate among people with strong views about “correct” grammar and pronunciation: between you and I versus between you and me; or it was laying on the floor versus it was lying on the floor; pronouncing or omitting the first c in arctic or the l in almond, or choosing one of several pronunciations of vase. Still other survey questions focus on variables that are less well known in the public sphere but are valuable to dialectologists because of their connection to settlement history and modern regional variation: whether cot and caught or whine and wine sound the same; whether people put frosting or icing on a cake, and wipe it from their mouths with a napkin or a serviette.
Such variables are largely complementary to those studied by other methods, thereby helping to round out our picture of how language varies across both geographic space and social groups. For instance, sociophonetic studies like those of Clarke et al. (Reference Clarke, Elms and Youssef1995), the Atlas of North American English (Labov et al. Reference Labov, Ash and Boberg2006), Roeder et al. (Reference Roeder, Onosson and D’Arcy2018), and Boberg (Reference Boberg2008, Reference Boberg2019, Reference Boberg2021, Reference Boberg2025) examine a largely separate set of phenomena from those investigated by written surveys, including phonetic variables like Canadian Raising and the Canadian or Low-Back-Merger Shift, which operate below rather than at or above the structural level of the phoneme and therefore cannot easily be represented using conventional orthography. The same could be said of other types of recent research on Canadian English, such as studies of archival or corpus data (Poplack et al. Reference Poplack, Walker and Malcolmson2006; Levey and Hill Reference Levey and Hill2013; Denis Reference Denis2015, Reference Denis2020) or of computer-mediated language (Tagliamonte and Denis Reference Tagliamonte and Denis2008, Tagliamonte Reference Tagliamonte2016), which have revealed variability in discourse markers and grammatical elements that are not as effectively studied with written surveys. It is only through an inclusive approach that values the benefits and compensates for the disadvantages of a diverse set of distinct methodologies that we can arrive at a holistic and comprehensive understanding of a subject as complex as the English language in Canada. Research using surveys like the SCE is a well-established and important part of that mix.
The questionnaire method was first used in Canada in the 1950s, with a small survey by Avis (Reference Avis1954–1956) of cross-border differences between Ontario and the United States (see also Scargill Reference Scargill1954, Reference Scargill1955 for Alberta; Hamilton Reference Hamilton1958 for Montreal), and reached its peak with the publication of the SCE in 1972. From its beginnings, this approach concerned itself especially with the alternation in Canadian English of British versus American forms, as well as a few uniquely Canadian features, reflecting Canada’s history of English-speaking settlement and more recent cultural influences (Avis Reference Avis and Sebeok1973: 50, Reference Avis1983: 7; Boberg Reference Boberg2010: 50). Subsequent work in this tradition produced many important insights, but never matched the size or national scope of the SCE’s sample. In the 1990s, J. K. Chambers, inspired partly by the work of Zeller (Reference Zeller and Clarke1993), instigated a new self-administered, written survey, called Dialect Topography (DT), which reprised some of the SCE variables and added several new ones. Data from large sociolinguistic samples were collected in several metropolitan areas, including Toronto, Montreal, and Vancouver, but less urbanized sections of the country, as well as major cities on the Prairies and in Atlantic Canada, remained unstudied (Chambers Reference Chambers1994, Chambers and Pi Reference Chambers and Pi2004). Unlike the SCE, the DT project produced several journal articles by Chambers and his collaborators, which addressed a broad range of sociolinguistic questions, including interregional comparisons and change over apparent time (Chambers Reference Chambers1995a, Reference Chambers1998a, Reference Chambers1998b, Reference Chambers2000; Chambers and Heisler Reference Chambers and Heisler1999; Boberg Reference Boberg2004a, Reference Boberg2004b; Burnett Reference Burnett2006); its data are now available online (see Chambers and Pi Reference Chambers and Pi2004). In the late 1990s, Boberg developed a new survey of vocabulary variation across North America, the North American Regional Vocabulary Survey (NARVS), which included several of the SCE and DT variables, alongside many new questions that had never before been investigated (Boberg Reference Boberg2005, Reference Boberg2010). Its dataset of several thousand responses did cover most of Canada, but sampling was not systematic and the questions were limited to vocabulary items. Most recently, Boberg developed a similar survey in collaboration with a nationwide newspaper (Metro News), which generated yet another set of data on regional variation, but with similar limitations (Boberg Reference Boberg2016).
The limited comparisons that have so far been possible with the SCE data of 1972 suggested that a more comprehensive replication would reveal major changes in some variables but stability in others. For instance, as reported in Boberg (Reference Boberg2010: 194), a comparison of the SCE with the NARVS data indicates that the use of chesterfield, a Canadianism for couch or sofa, has declined from around 75% in 1972 to less than 5% among younger people today, a trend also studied by Chambers (Reference Chambers1995a). Another Canadianism, eavestroughs, a word for gutters along the edge of a roof, was declining less sharply, from majority to minority usage. There was also some erosion of young Canadians’ use of zed rather than zee as the last letter of the alphabet, though whether this was a lasting change at the community level required more study (Chambers Reference Chambers1995b: 188–190). By contrast, the use of British tap instead of American faucet for the device that controls the flow of water into a sink was holding steady. Moreover, the SCE was not limited to vocabulary: it also examined variables of pronunciation, grammar or usage, and spelling, domains of language that have received less attention in subsequent survey work. The DT survey did include some pronunciation and grammatical variables, some of which first appeared in the SCE, and a comparison of the SCE’s Quebec data with DT data from Montreal revealed a wide variety of diachronic patterns (Boberg Reference Boberg2004b). A broader, nationwide replication of the SCE therefore presented the opportunity to see whether different types of variables respond differently to the influences on Canadian English that have become more important since 1972. These include the rise of satellite TV and, later, the internet, facilitating the flow of American English into Canada, though the linguistic influence of mass media is not straightforward and has been questioned, as discussed by Stuart-Smith (Reference Stuart-Smith, Llamas, Mullany and Stockwell2007) and Boberg (Reference Boberg2021: 22–28). Other potential influences involve long-term social and demographic developments, such as rising levels of post-secondary education, changing gender roles, shifting sources of immigration, an aging population, and increasing urbanization.
In particular, a replication of the SCE allows us to examine the most pressing question for many researchers working on Canadian English, as well as many members of the general public: is Canadian English becoming more American? (Nylvek Reference Nylvek1992; Clarke Reference Clarke and Clarke1993; Chambers Reference Chambers1995a, Reference Chambers1998b). The discussion of this question in Boberg (Reference Boberg2010) finds “no evidence for a general, ongoing Americanization of Canadian vocabulary, beyond its already-established North American character” (195–196), and Warkentyne’s (Reference Warkentyne1971: 195) report on the SCE also points out counterexamples to the apparent Americanization seen in many variables. The new data made available by the SCE replication presented here – a dataset larger than that of Boberg (Reference Boberg2005, Reference Boberg2010) and more recent than that of the original SCE – shed new light on this important question, which is connected in many people’s minds with the survival of an independent cultural identity in English-speaking Canada: At a time when American and Canadian cultures are similar in many ways, dialect differences still reliably distinguish the two nations. Owing to this connection, data generated by a new SCE are of interest not only to linguists, scholars of Canadian English, and other language professionals, like first- and second-language teachers and those who edit Canadian dictionaries and usage guides, but also to scholars in other fields and to many members of the general public across the country.
2. Method
2.1 The questionnaire
The SCE involved several important methodological innovations that made possible the collection and analysis of around 15,000 questionnaire responses in just a few months, from late 1970 to early 1971. Most importantly, beyond relying on a self-administered questionnaire rather than in-person data collection by fieldworkers, it used institutional channels of distribution and computerized analysis of the data, at the time a relatively new tool. The former strategy involved collaboration with the Canadian Council of Teachers of English and with school boards, which facilitated distribution of questionnaires to Grade 9 classes in schools across the country. Each student received three copies of the questionnaire: one for the student and two to take home to their parents. Completed questionnaires were then returned by mail by teachers and regional directors to the project office at the University of Victoria, where they were subjected to quantitative analysis by computer (Scargill and Warkentyne Reference Scargill and Warkentyne1972: 47–50).
The SCE questionnaire presented respondents with a description of each variable and a list of variants from which they could choose, often including an “other” or “either” choice. For example, Question 2 dealt with the pronunciation of lever, using a rhyming approach:
Q2) Lever rhymes with (A) beaver; (B) never; (C) either way.
Where the rhyming approach was not practical, the sound in question was identified:
Q17) The u in student is pronounced like (A) oo in too; (B) u in use; (C) either way.
Questions about grammatical usage often dealt with verb forms, asking “which do you say?”, for example:
Q12) (A) He dove into the pool; (B) He dived into the pool; (C) Either one.
Vocabulary questions supplied a definition, for example:
Q108) Devices attached to the roof of a house to catch rain are called: (A) eavestroughs; (B) gutters; (C) by another name.
Finally, spelling questions, which focused on British-American differences, asked respondents to choose between two forms, for example:
Q10) (A) color; (B) colour; (C) either one.
For the present replication, 45 of the SCE questions, in their original form, were chosen for restudy, representing a little under half of the original set. By category, there were 22 pronunciation, 12 grammar, six vocabulary, and five spelling items. Selection was based on relevance to contemporary speakers of Canadian English and to the likelihood that a question will produce interesting variation. Variables that are now obsolete, such as some 1960s slang terms, old British dialect forms, and words connected with traditional rural lifestyles, or that displayed very little variation in 1972, were set aside. To these 45 items were added five similar variables from the earlier Avis (Reference Avis1954–1956) survey: the timespan for comparison with the Avis data, collected in 1949-50 and published in 1954-56, is even longer, approaching three rather than two generations. Beyond these 50 older questions, the more recent survey work by Chambers and Boberg suggested that many of the most regionally variable words in modern Canadian English were not included in the original survey, so a selection of 29 new vocabulary questions was added to the new survey, mostly reprised from Boberg’s (Reference Boberg2005) NARVS survey, along with one new pronunciation question and five new spelling questions. This made a total of 85 questions, which was judged to approach the limit of most potential survey respondents’ time and interest (though this judgment was admittedly impressionistic rather than evidence-based). The language questions are prefaced by a set of demographic questions relating to respondents’ native language, residential history and current residence, birth year, and sex. The residential history questions focus on location of schooling, not birthplace, which is irrelevant to dialect formation, as regional speech norms are easily altered or replaced in infancy and are acquired mostly from the childhood peer group; parents’ schooling locations were also requested, though they are not considered in the present analysis. A print version of the new questionnaire can be consulted in the appendix.
The present report will confine itself to the 45 replication questions; the new variables will be analyzed in a separate report (Boberg et al. Reference Boberg, Henderson and Mundieto appear). Two of the replication questions are not strictly comparable; in both these cases, Scargill and Warkentyne included one of the possible responses in the text of the question, a choice we saw as an error and wished to correct. In V5, they ask, “An upholstered couch is called: (A) a sofa; (B) a chesterfield; (C) a davenport; (D) by another name.” In V37, they ask, “A small fresh-water stream is called: (A) brook; (B) creek; (C) tributary; (D) by another name.” Our sense was that many Canadians would use the term couch in V5 and the term stream in V37, so we included these as possible answers and rephrased the questions. We also removed davenport from V5 and tributary from V37, as these garnered only two percent of responses or less in 1972; nevertheless, we can still track the evolution of the individual comparable variants, sofa–chesterfield and brook–creek. In seven other cases (P14, P15, P19, P20, G5, G7, V16), we found we wanted to be more consistent than Scargill and Warkentyne were in offering an “either” or “other” response. This is a minor problem, as the frequency of such responses was generally very small; when comparing these cases with the 1972 data, we removed the “either” and “other” responses and adjusted the main variant percentages to total 100%, respecting the proportion between them (for example, if the variant proportions for a question were 60% A, 30% B and 10% “either”, the adjusted proportions would be 67% A and 33% B). With this modification, we have 43 questions for direct comparison between 1972 and today.
The 1972 study, naturally, was administered using questionnaire forms printed on paper. Though paper questionnaires sent through the mail continued to be used as recently as Chambers’ DT project and the first years of Boberg’s NARVS research, in the present replication it was clear that switching to an online survey would accord with the current standard method of survey research and provide many advantages. A survey project website was therefore established (https://www.mcgill.ca/canadianenglish/), featuring a link to a survey form hosted on the LimeSurvey platform administered by McGill University.
2.2 The sample
Important changes since 1972 also demanded a modified approach to participant recruitment and questionnaire distribution and collection. To begin with, the Canadian Council of Teachers of English no longer exists, and an effort to identify a similar national body of language arts teachers today was unsuccessful. Today’s public schools, moreover, emphasize different subjects in their language arts curricula and have become far more bureaucratic in terms of granting approval for student participation in external research. It was therefore decided to retain the idea of institutional dissemination but approach it from the opposite end of the age spectrum: retirement homes. Just as Grade 9 students were asked to share the survey with their parents in 1972, retirement home residents today would be asked to share the survey with their children and grandchildren, thereby recruiting participants from a broad age spectrum. Unfortunately, this initiative proved a failure: efforts to engage retirement home staff as local collaborators who might share the survey with their residents garnered very few responses. Instead, therefore, an appeal was made to colleagues in Linguistics and English departments at universities across Canada to share the survey link with students in their classes, which many generously did. Staff at cultural institutions like community and heritage groups, libraries, and museums were also approached, as were government departments in the culture and heritage domain, again with some success. Finally, in order to attract respondents in the general population beyond institutional channels, we posted announcements of the survey on social media platforms, particularly the online discussion platform Reddit. These also met with considerable initial success, before running into restrictions imposed by group moderators. Eventually, the survey attracted the attention of the media, particularly the CBC but also writers in several local newspapers, who produced print, radio and television coverage that stimulated even more responses.
As a result of all these efforts, between the time the survey was launched in the summer of 2023 and the first half of 2024, a total of approximately 14,000 responses was received, roughly matching the sample size of the original SCE (which collected 15,575 usable responses but analyzed 14,228 from people born in Canada). The vast majority of these were from Canada, but the dataset also includes about 200 responses from the United States and 40 from the United Kingdom (most of these from Canadians living abroad), with a few from other countries. The results analyzed here focus on the responses from Canada. To allow a comparison with the original study, these have been classified by province (a disappointingly small number of responses from Canada’s three northern territories, which were not included in the 1972 study, are therefore set aside in this analysis). The original study gives very little information about its participants: its results tables indicate only their province of residence, sex, and age, the latter a generational division between students in Grade 9 English classes, who would mostly have been 14 years old, and their parents.
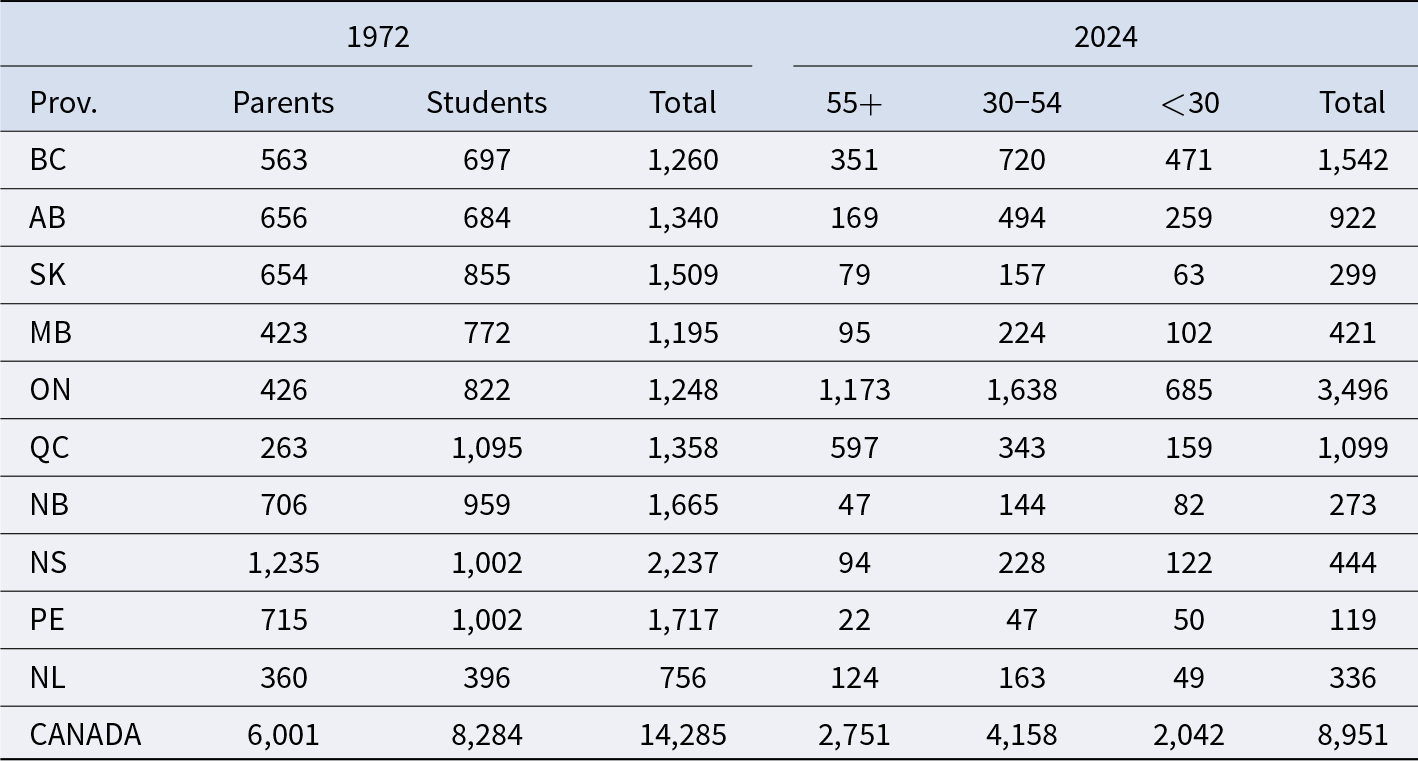
To make the new regional analysis as informative as possible, for the purposes of the present analysis the new dataset has been restricted to those respondents who are native speakers of Canadian English and who still live in the province where they grew up. These criteria substantially reduce the sample to 8,951 responses. Though this restriction may lessen the strict comparability of the two samples, the scale and consequences of this problem are unknown, given a lack of information about the residential history of the 1972 participants. More importantly, while the restricted sample is substantially smaller than the whole dataset and less broadly representative of the general Canadian population, from a dialectological point of view it is more informative, particularly with regard to regional variation, as the potential influence of international and interprovincial migrants on regional patterns is greatly reduced, making the responses more closely reflective of local speech. In assessing a linguistic difference between British Columbia and Ontario, for example, a sample including British Columbians who have moved to Ontario and Ontarians who have moved to British Columbia, as well as other non-local people and non-native speakers of English who have moved to both provinces, can only obscure the regional differences we wish to identify. If non-local segments of the population are to be included in a regional comparison, this must be done in a controlled way, with an independent variable like the Regionality Index of Chambers (Reference Chambers2000), supporting a quantitative analysis of the effect of residential history on variant proportions in each place. Such an analysis is beyond the scope of the present article, but responses from people who now live in a different province from where they grew up, as well as those who are second-language speakers of English, are nevertheless a valuable resource and have therefore been retained for future analyses, which can examine the linguistic effects of language and dialect mixture and interregional migration, important factors in a highly diverse and mobile population like Canada’s.
The new sample also comprises a much wider age range than the students and parents of 1972 and has therefore been divided into three age groups: those 55 and older, 30-54 years old, and under 30. These divisions were motivated by the age distribution of the data, which are concentrated more in the middle than at either end of the age range (the mean year of birth was 1976, or 48 years old in 2024), in order to preserve adequate samples of older and younger respondents. A comparison of the oldest group with the original study indicates whether the speech of the 1972 generations has changed over the last five decades, as they have grown older; a comparison of the youngest group with the original study, especially with the students, indicates how youth speech has changed since 1972.
While both surveys collected information on the sex of respondents, and the report on the original survey displays separate data for male and female respondents in each generational group, these differences are generally small, involving one or two percentage points, and Warkentyne (Reference Warkentyne1971) does not discuss them in his summary of the original study, presumably because he saw sex differences as less interesting than the variations according to age, region, and education that he does discuss. The possible influence of sex and of socially constructed gender identities on variant choice is, of course, an important sociolinguistic question, but addressing it here would expand both the data tables and their analysis well beyond the space available. To offer a concise analysis that focuses clearly on age and regional differences and especially on the comparison across real time between the two surveys, which is our main concern, we have therefore set sex aside as a variable to be examined in future research: for present purposes, the proportions given for 1972 are a mean of the male and female proportions for each group. A comparison of the two samples is shown in Table 1. That of the new survey is labelled 2024, to reflect the period of data collection from 2023 to 2024.
Sample of respondents for original Survey of Canadian English (1972) and New Survey of Canadian English (2024), the latter restricted to native speakers of Canadian English who still live in the province where they grew up

3. Results
The complete results of the survey, tabulated by province and age group and compared with parallel data from 1972, can be found online at https://www.mcgill.ca/canadianenglish/results. With 45 comparisons to analyze, the most important patterns of variation can easily get lost in a sea of details. In the present analysis, we seek to avoid this problem by 1) identifying the variables that best exemplify general patterns and 2) developing an overall or aggregate view of the data that rises above the often contradictory trends exhibited by individual variables, along the lines recommended by Nerbonne (Reference Nerbonne2009).
3.1 How has Canadian English changed (or not changed) since 1972?
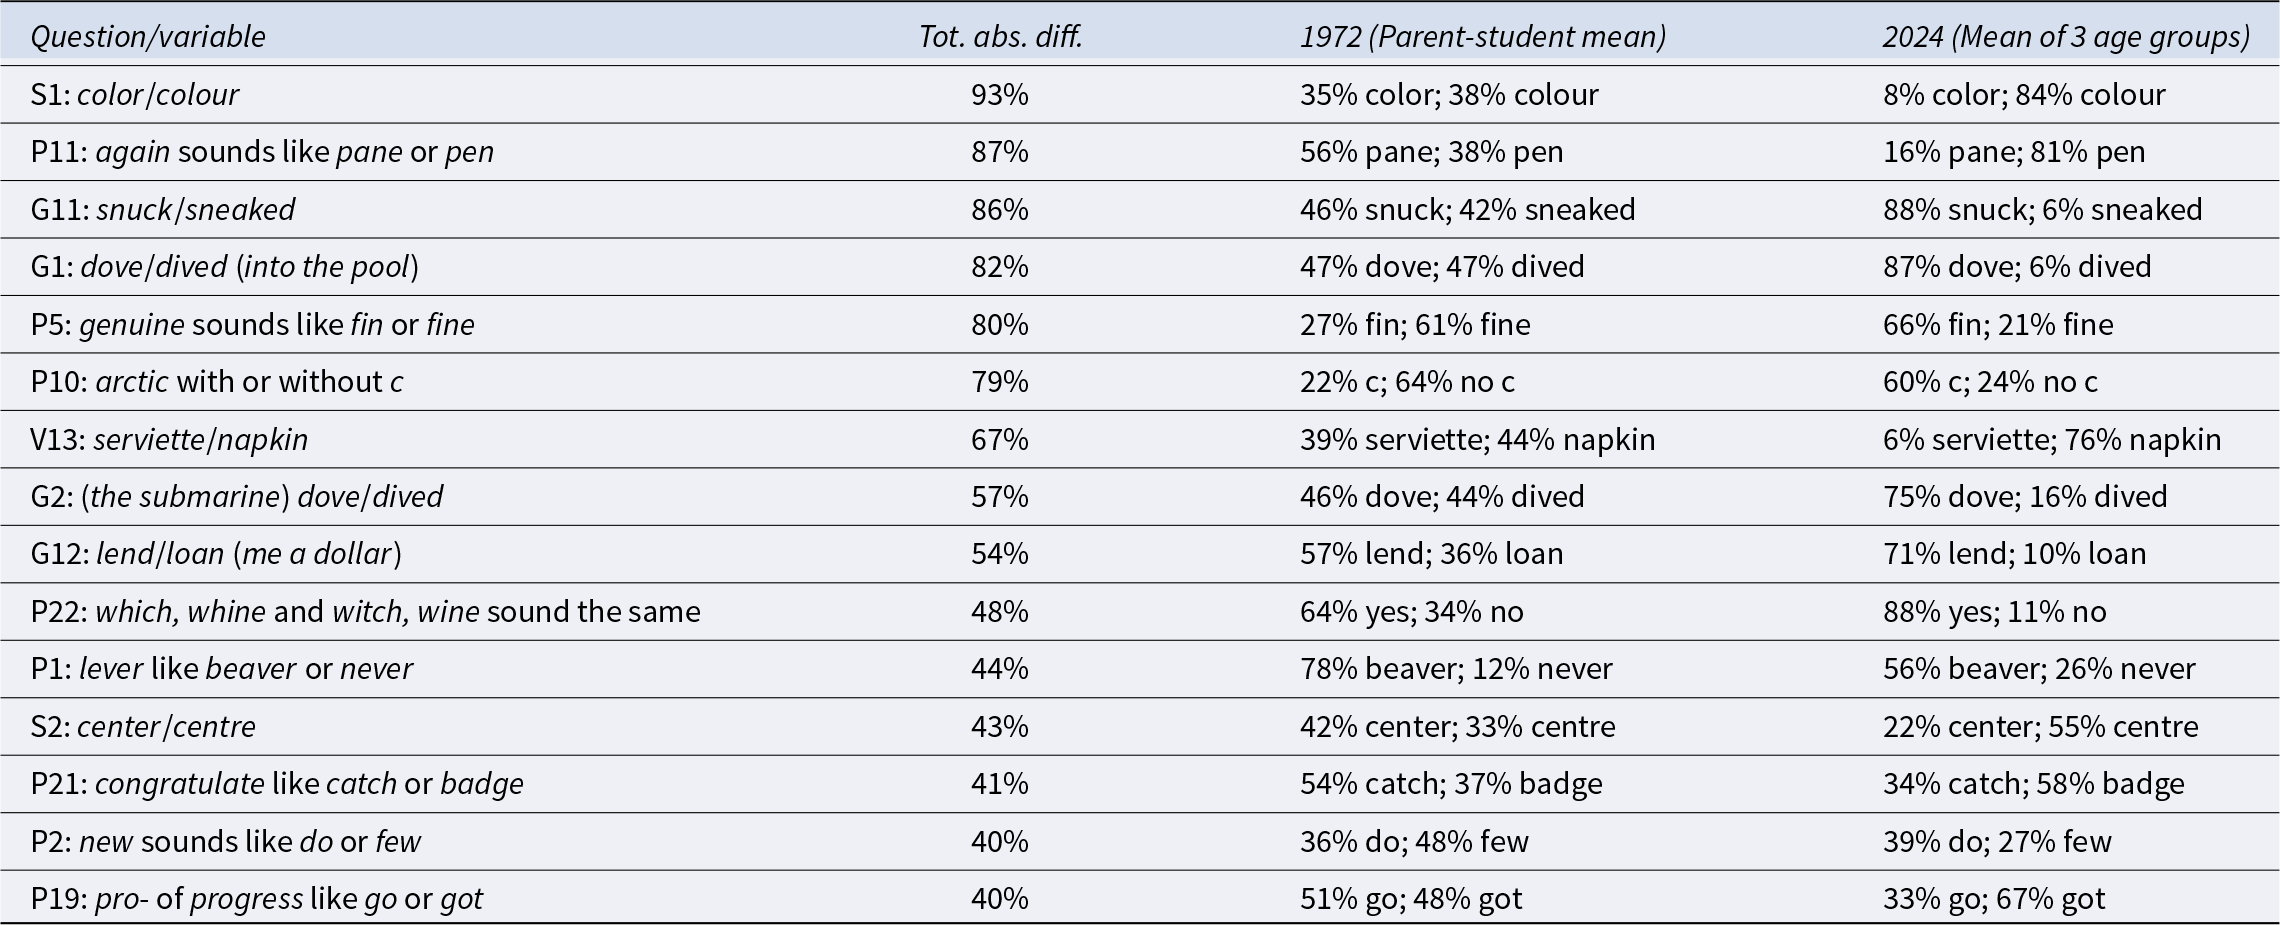
We begin by answering perhaps the most obvious question arising from this kind of study: how – and how much – has Canadian English changed since 1972? The answer, of course, depends on which variables we examine, but a natural choice is to focus on the most dramatic changes. To identify these, for each of the 43 directly comparable questions (45 minus the two problematic cases discussed above), we calculate the total absolute difference in variant proportions (the sum of the differences in proportion, positive or negative, for all variants of each variable) between the mean of the parents (both sexes) and students (both sexes) in 1972 and the mean of the three age groups in 2024. Setting aside regional variation for now, this analysis examines Canada as a whole, as a national mean of the data for the ten provinces. The top fifteen variables, ranked by total absolute difference, are displayed in Table 2.
Fifteen biggest changes in Canadian English, by total absolute difference in Canadian variant proportions of 1972 and 2024 (mean of age groups)

To the fifteen variables in Table 2 should be added question V5, which asks about words for the piece of upholstered furniture that seats three people in a row. Unfortunately, as mentioned above, Scargill and Warkentyne used the word couch, the standard American term, in their question text, rather than including it as a possible answer: they were interested in the prevalence of what was then the standard Canadian term, chesterfield, as opposed to the more general international term, sofa. As the new survey included couch as an answer option, the two surveys are not directly comparable for this question, but the frequency of chesterfield declines from 75% of 1972 parents and students to only 9% of the three age groups today, while that of couch rises from 58% of today’s older respondents to 84% of the younger group, a change previously observed by Chambers (1995, Reference Chambers1998b: 8–11) and Boberg (Reference Boberg2010: 191).
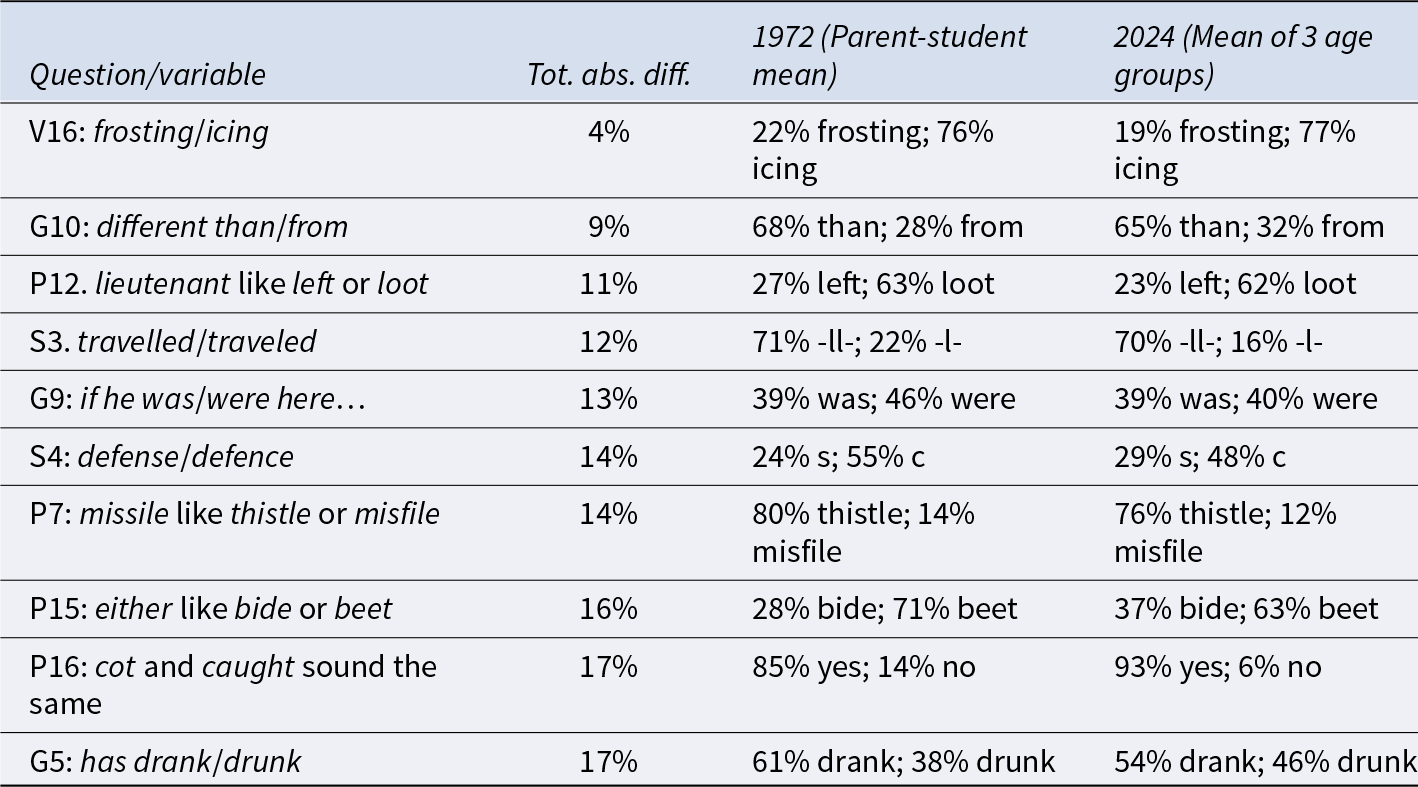
We could equally ask, what is not changing in Canadian English? The variables with the lowest total absolute difference measures are shown in Table 3. In some cases, the intergenerational means in Table 3 suggest diachronic stability between the two studies, but obscure generational differences within one or both samples that suggest change in progress over apparent time, thus complicating the real-time comparison. For example, the data on G5 show stable proportions of drank and drunk as past participles between parents and students in 1972, but a dramatic increase of (non-standard) drank at the expense of (standard) drunk across the three generations in 2024. The British pronunciation of lieutenant like left declines in both samples, but the parents of 1972 and older respondents of 2024 start with similar proportions (39% and 34%, respectively), so the cross-age means are similar; among the younger groups, the left pronunciation slips to 15% in 1972 and 14% in 2024.
Ten smallest changes in Canadian English, by total absolute difference in Canadian variant proportions of 1972 and 2024 (mean of age groups)

3.2 Changes in the frequency of British, American, and Canadian forms
The variables in Table 2 display many individual patterns of change. There is no space here to examine each variable in detail, but, taken together, they can be grouped into three more general trends. Consulting standard dictionaries, in particular The Concise Oxford Dictionary, Ninth Edition (1995) for Standard British English, Merriam-Webster’s Collegiate Dictionary, Eleventh Edition (2004) for Standard American English, and the Gage Canadian Dictionary, Revised and Expanded Edition (1997) and Canadian Oxford Dictionary, First Edition (1998) for Standard Canadian English, as well as the interpretive notes made by Scargill and Warkentyne below each data table in their report, it is possible to analyze most of the variables in Table 2 in terms of alternation between forms that are predominantly British, American, and Canadian, even if in many cases both forms occur to at least some extent in one or more of these national varieties. Though any form that occurs with some regularity in Canada could, in that respect, be considered Canadian (and might therefore be included in a dictionary of Canadian English), given that our interest, like that of our predecessors, Scargill and Warkentyne, is in exploring the shifting proportions of British, American, and Canadian forms in Canadian English, for this analysis we consider only forms that are more frequent in Canada than elsewhere, like eavestroughs (Table 6), to be Canadian, whereas those that Canadians share with speakers of British or American English are considered British or American, respectively. For example, even if most Canadians say zed rather than zee, zed is clearly a British form prevalent in Canada (and other places around the world), not an independent Canadian innovation or uniquely Canadian form. Labelling it as British can help to indicate the position of Canadian English on a spectrum between what are now the two major international standards of English, British and American, whereas calling it Canadian is uninformative in this respect.
To begin with an obvious case of British-American opposition, the British spellings colour and centre, which compete with the American spellings color and center in 1972, increase to become the dominant choice of Canadians in 2024. Other British forms, however, tend to decrease, giving way to greater use of American forms. This is true of the (British) pronunciation of lever like beaver, congratulate like catch, new like few, and progress like go, of the verbal past forms sneaked and dived (also analyzed by Chambers Reference Chambers1998b: 19–25, Reference Chambers2007: 31), and of the word serviette (see also Chambers Reference Chambers1998b: 14–17). The corresponding American forms of these variables (i.e., forms associated more with American than with British English) are increasing. On the other hand, we see some counterevidence to these trends in Table 3: the American pronunciation of missile to rhyme with thistle, American use of frosting instead of icing, and American spellings traveled and defense remain minority forms in Canada and do not increase in frequency between the two surveys. Returning to Table 2, however, three forms traditionally associated more with Canadian than with either British or American English, the pane pronunciation of again and the c-less pronunciation of arctic, along with the word chesterfield discussed below the table, are also being replaced by forms associated more with British and especially, in the case of couch taking over from chesterfield, American English.
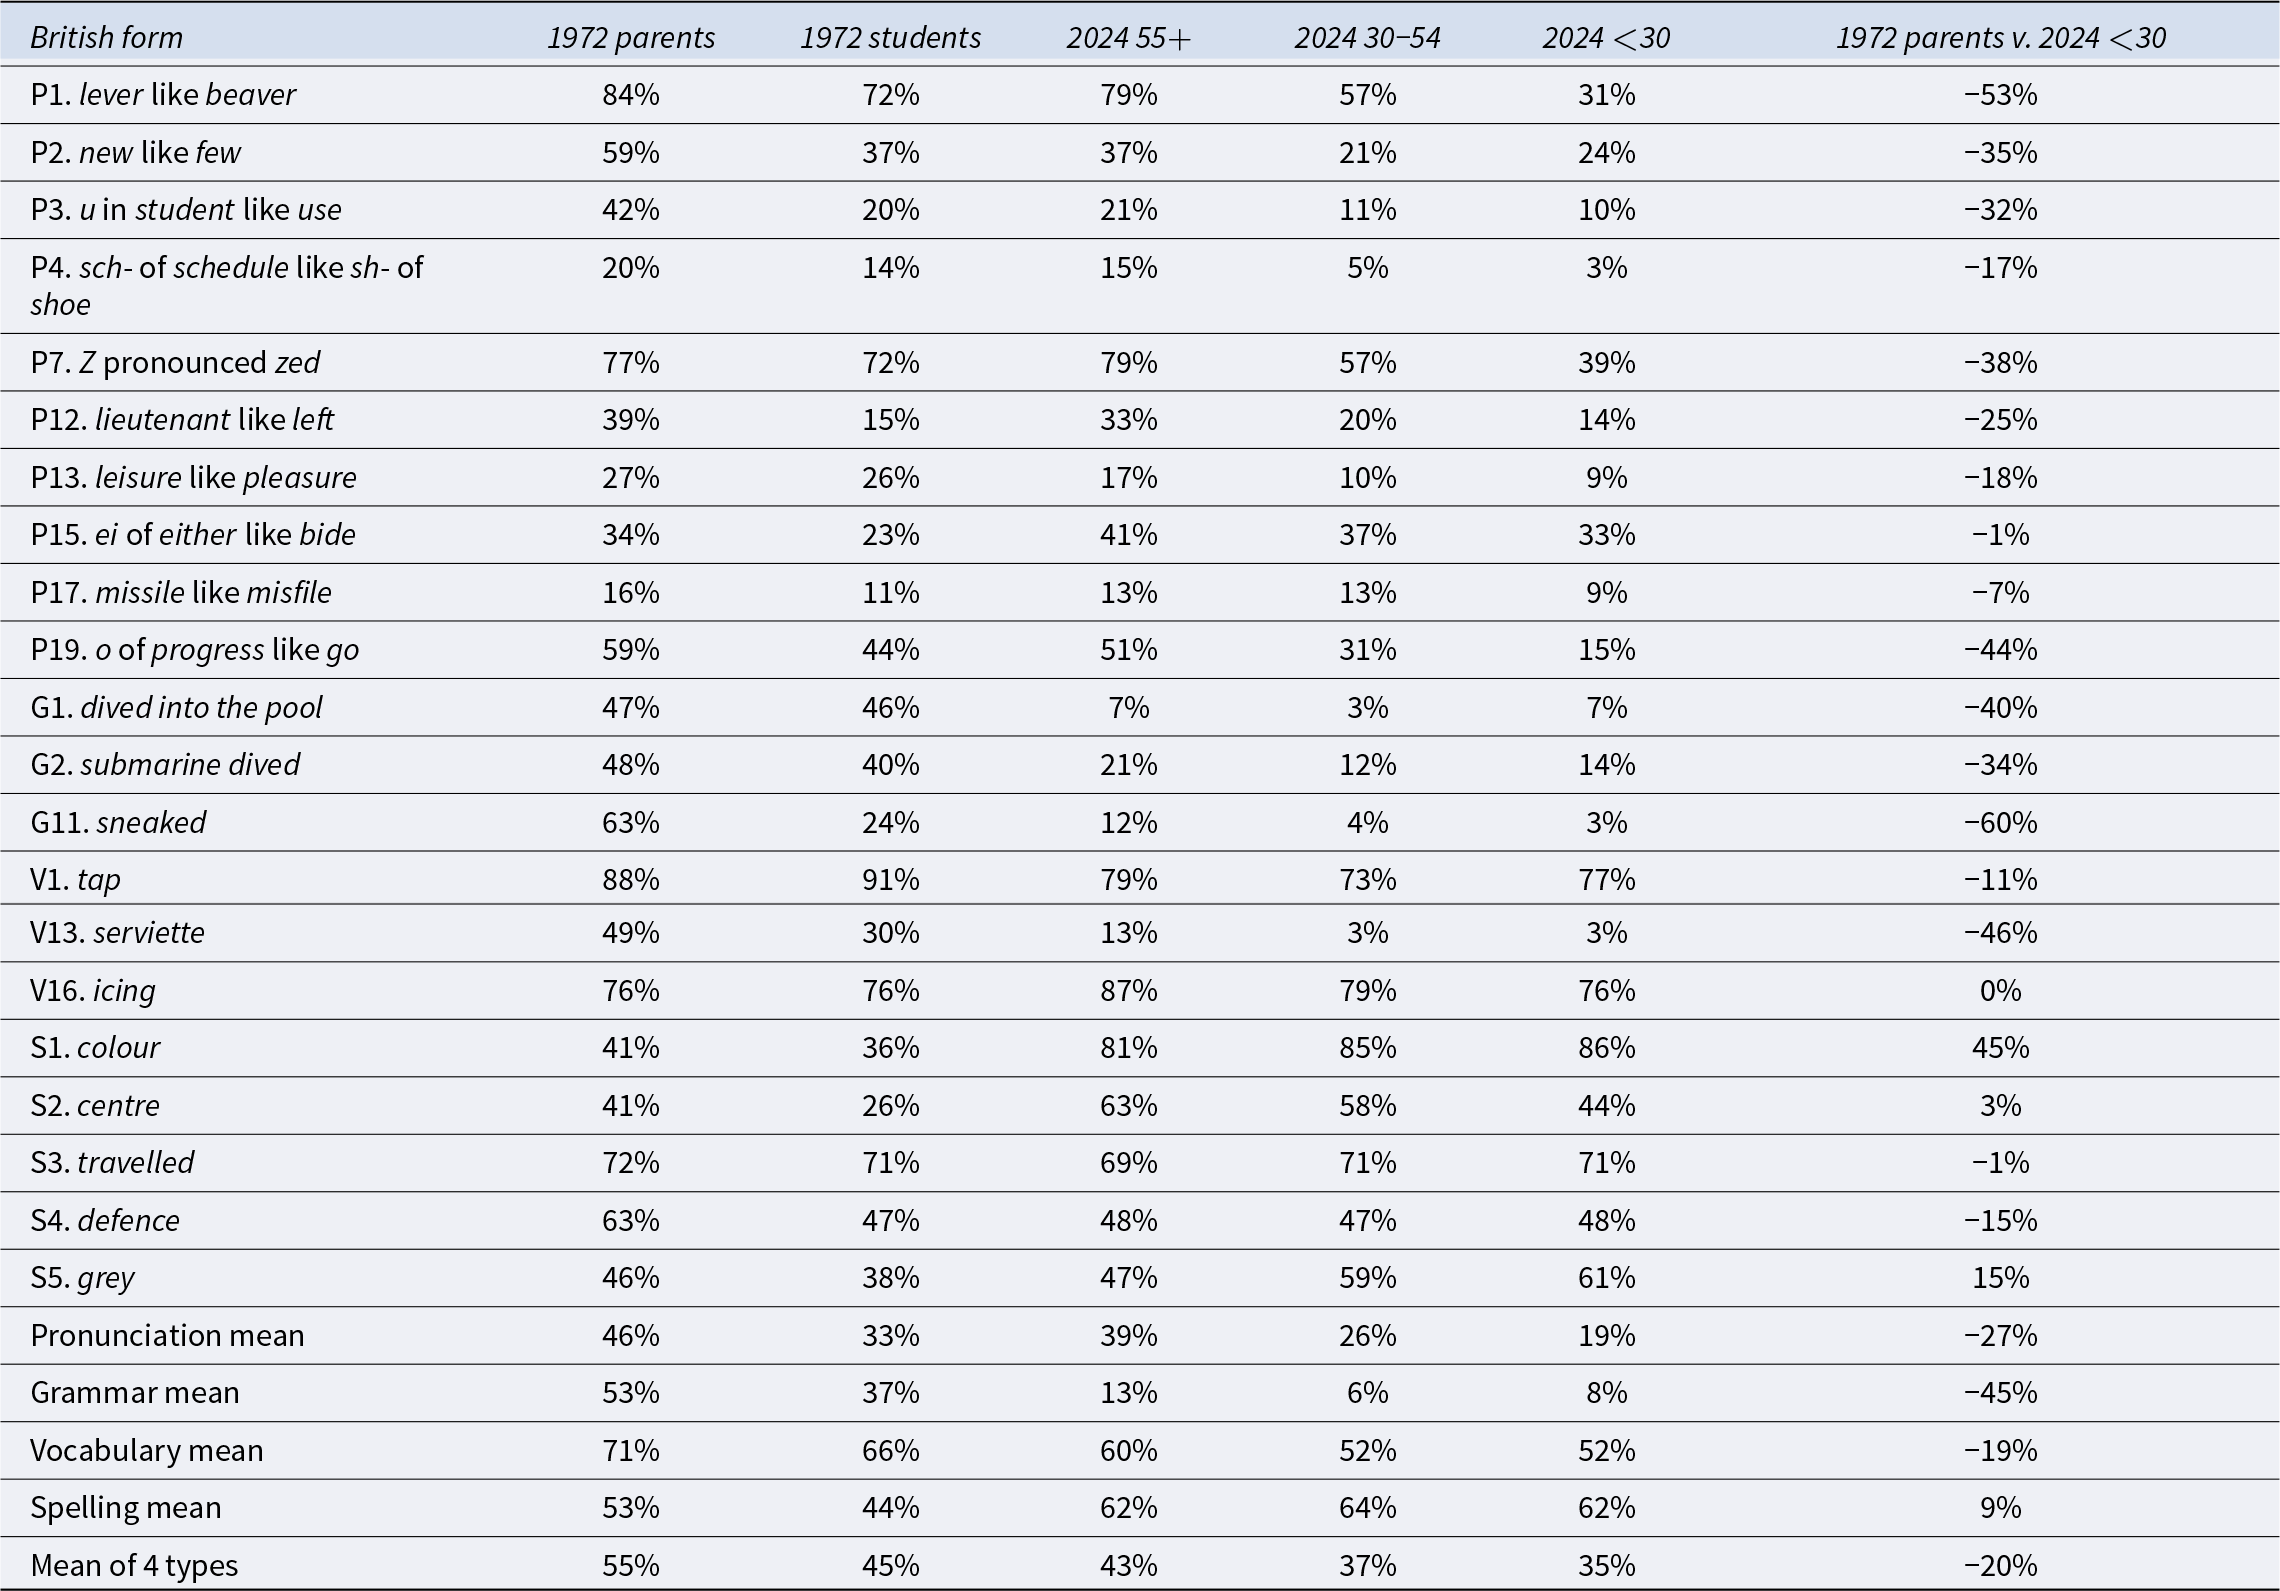
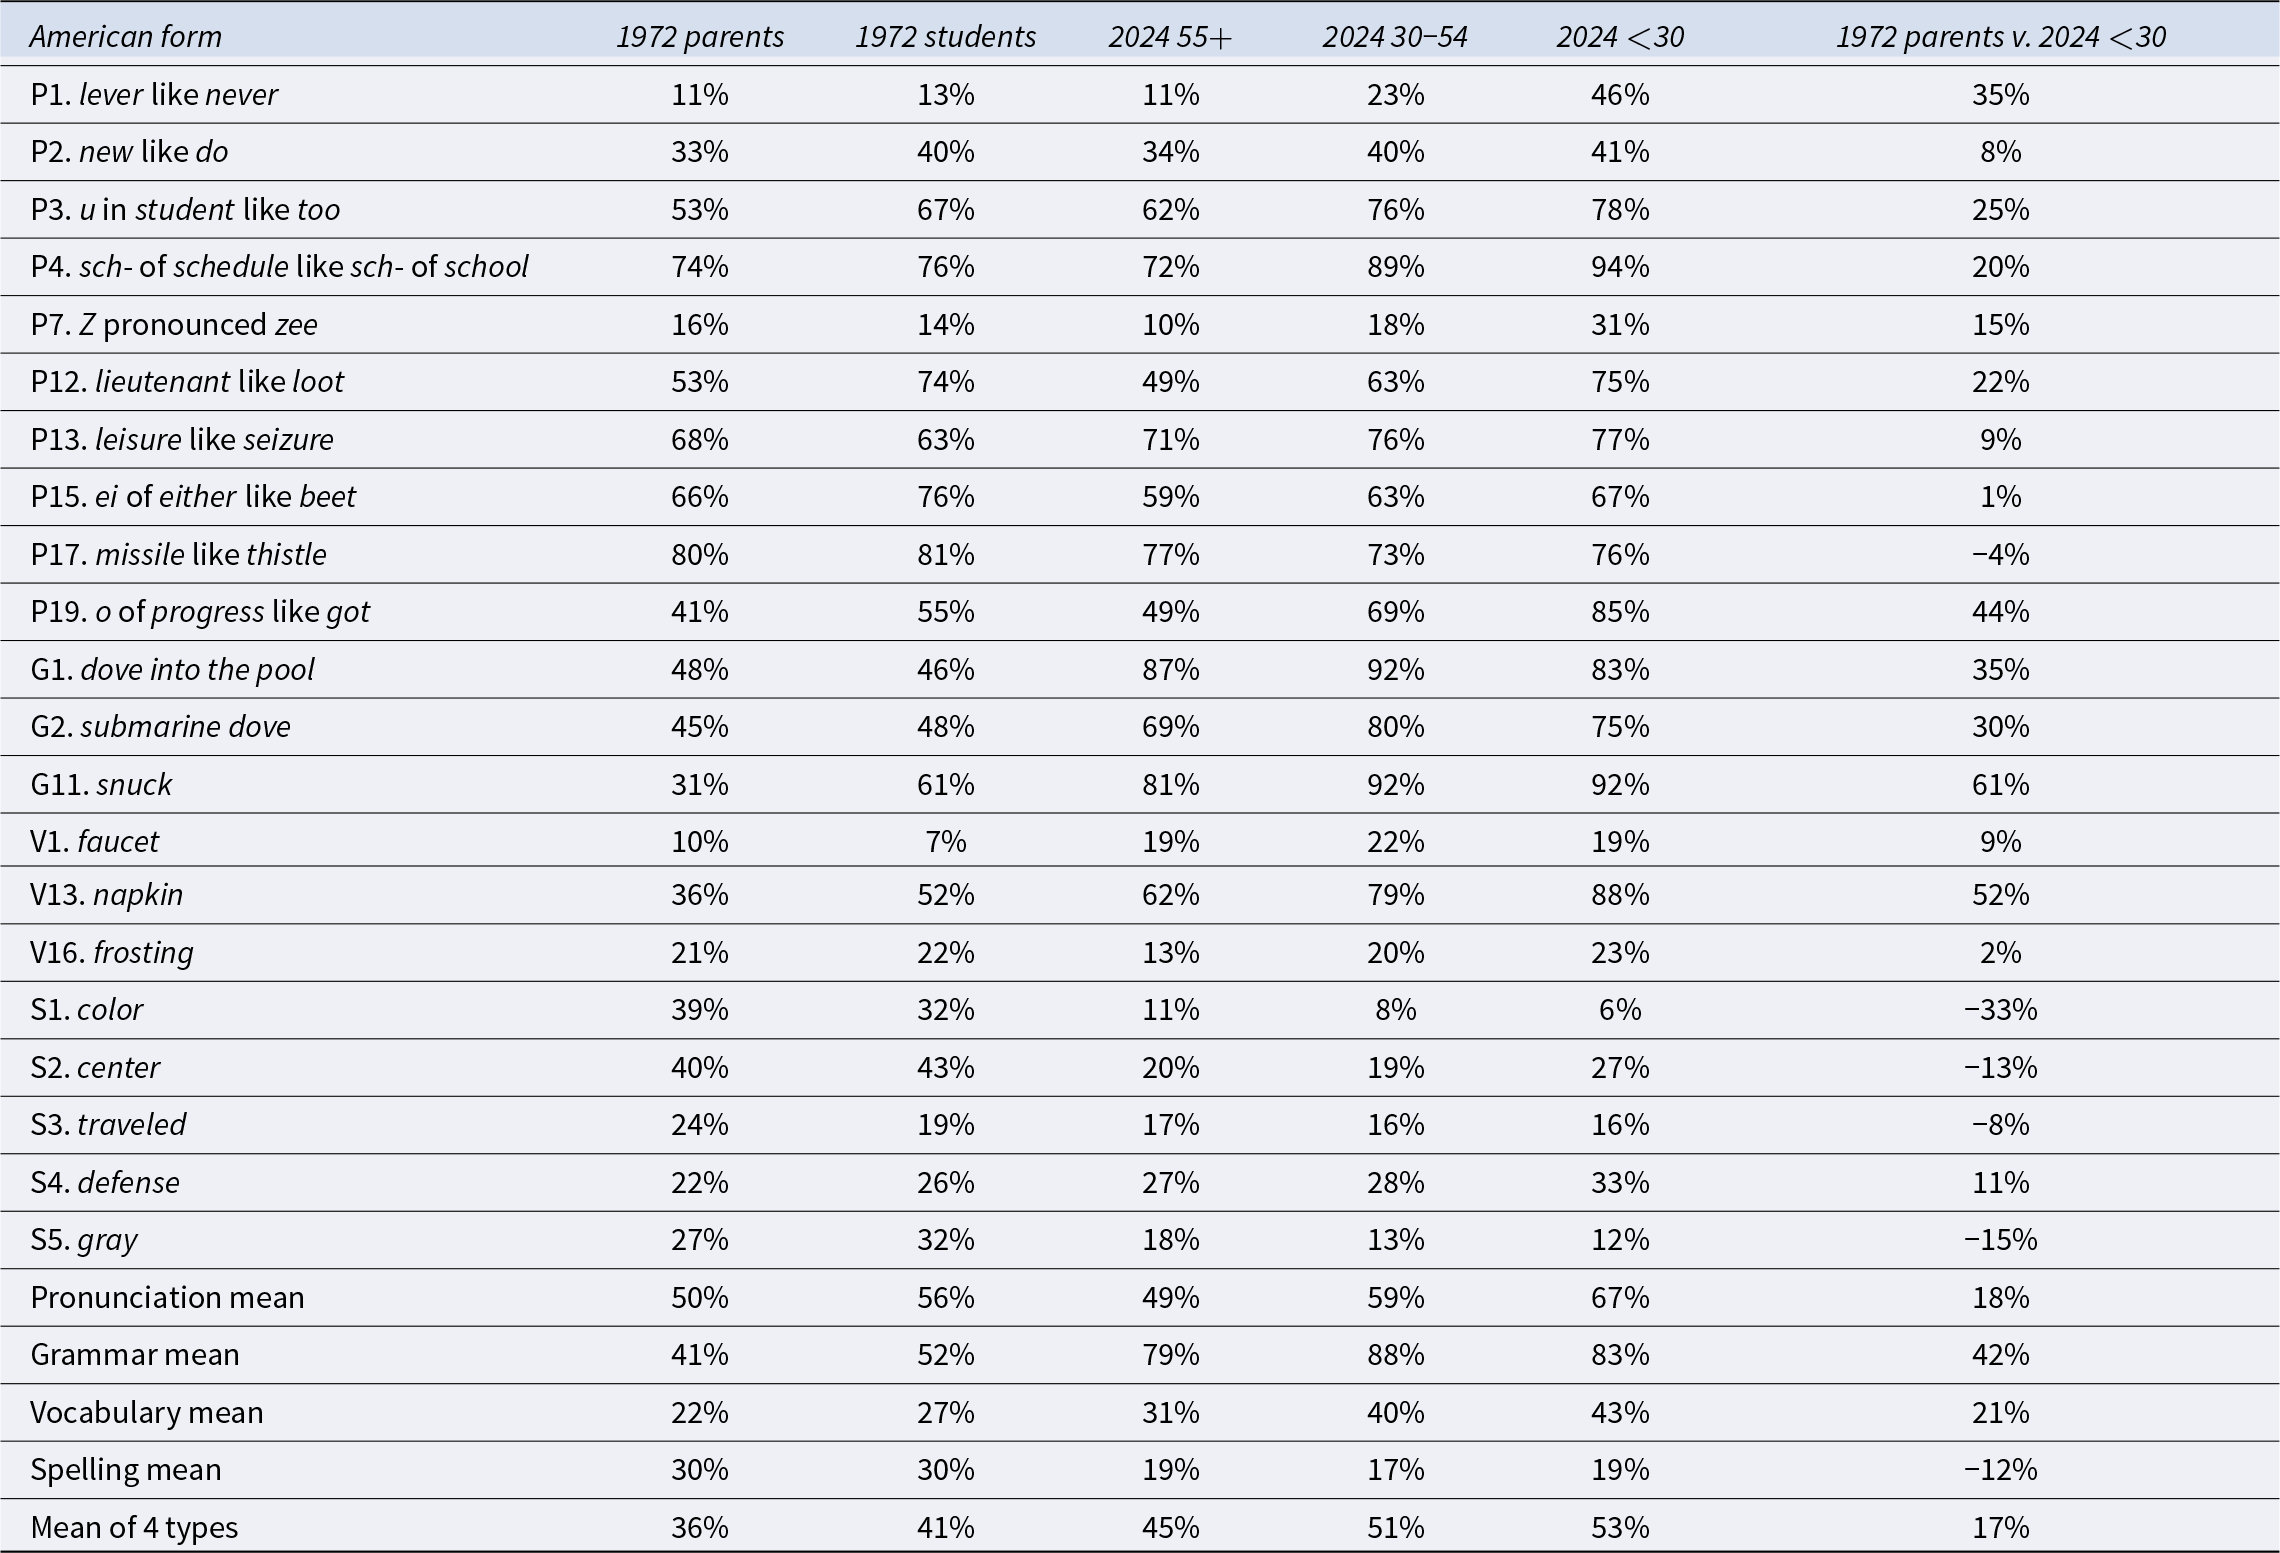
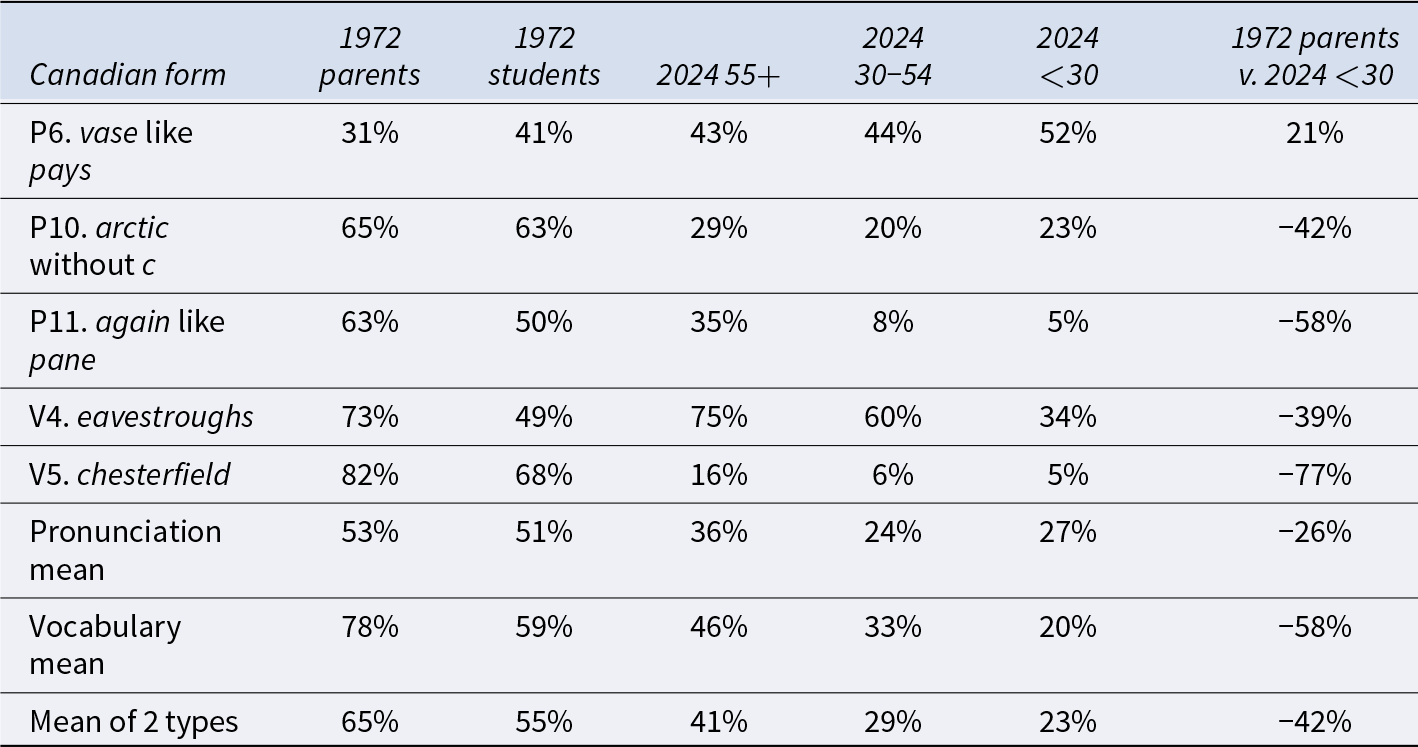
How general are these patterns, beyond the variables featured in Tables 2 and 3? To determine this, we assigned British, American, and Canadian labels to as many variants as possible across the whole dataset and combined them in a multi-variant index, measuring adherence to each national variety. The index of opposing British and American variants comprised 21 variables, while that of Canadian variants comprised only five. These are shown in Tables 4–6, with the cross-Canada proportions (interprovincial means) for each of the five age groups: parents and students in 1972 and the three generations in 2024. The bottom rows of the tables show the mean proportions for each variable type and the combined mean of the four variable types. The change in proportions, positive or negative (increase or decrease), between the two extremes of the age range, the parents of 1972 and the <30 generation of 2024, is shown in the last column of each table.
Proportions of predominantly British variants of 21 variables for five age groups

At the most general level, the aggregate patterns in Tables 4–6 indicate a gradual shift away from British toward American forms and away from distinctively Canadian forms toward those associated with either or both of British and American English. The bottom rows of Table 4 show that the overall proportion of British forms drops from 55% for 1972 parents to 35% for younger respondents in 2024, a slow but steady decline, though the oldest respondents in 2024 retain approximately the same proportion as the students of 1972, before the proportion continues to drop in the middle and younger generations today, which suggests that in at least some respects, the 1972 generation has maintained its linguistic patterns as it has grown older. In fact, at this aggregate level, with the opposing trends displayed by individual variables in Tables 2 and 3 counteracting each other in the larger dataset, the changes between the generations within each sample and between the students of 1972 and the oldest respondents of 2024 are not large enough to be statistically significant. This reminds us that any overall shift in the character of Canadian English is bound to be gradual at the aggregate level. Nevertheless, the difference shown in the last column between the parents of 1972 and the youngest respondents of 2024 does attain strong significance (by t-test: p < 0.001) and supports the general conclusion that Canadian English, particularly among today’s youth, has become somewhat less British and more American since 1972, at least in terms of the variables studied here.
In contrast with this general trend, the second-last row notably shows a major exception to Americanization: spelling, which actually becomes slightly more British between the two surveys and stabilizes at just under two thirds of Canadians today choosing British spellings. On the level of individual words, however, the British proportion varies widely, from 86% for colour to only 44% for centre among the youngest respondents today, down from a high of 63% of the oldest 2024 respondents. Travelled is stable and defence also declines from its maximum among the 1972 parents, so the iconic but not entirely representative example of British spelling in Canadian English today is colour. (The new survey added five more spelling questions to those of 1972, one of which, dealing with labor and labour, confirms that preference for -our is a general pattern, not confined to the word colour: preference for labour is around 90% across all three generations.)
Apart from spelling, the three other variable categories in Table 4 all show a decline in British forms, with that of the grammatical forms sneaked and dived twice as steep as those of pronunciation or vocabulary variants: only around 10% of Canadians use these past tense forms today. It is not clear why the real-time change between the survey years should be so precipitous in the case of dived in particular, which showed no apparent-time change in 1972, compared with the similar case of sneaked, which shows a larger but more gradual decline; at the level of individual variables, there is still much to be investigated (for further discussion of these forms, see Chambers Reference Chambers1998b, Reference Chambers2007). The other categories are more variable, with a greater mixture of British and American forms: pronunciation is 19% British and vocabulary – at least in terms of the three words in Table 4, a problematically small sample – is 52% British. Perhaps the most notable trend in Table 4 is the decline of zed, which shifts from majority use in 1972 to minority use among younger Canadians today, though Table 5 will show that this is not as alarming as it might seem to readers concerned about Canadian cultural autonomy. Nevertheless, the comparison between youth speech in 1972 and 2024 suggests that this is not simply a case of age grading, in which young people initially attracted to American zee abandon it as they grow older, as suggested by Chambers (Reference Chambers1995b: 189); however, only a future survey could verify this.
Proportions of predominantly American variants of 21 variables for five age groups

Complementary to the decline of British forms in Table 4, the bottom rows of Table 5 show an increase of American forms of 17%. In this case, the increase is linear across all five generational groups, with the oldest group in 2024 showing a slightly higher proportion of American forms than the students of 1972, though, as with the British forms, these changes are gradual and involve a good deal of variation among individual variables, so that they only attain statistical significance at the aggregate level when the parents of 1972 are compared with the youngest respondents of 2024 (p < 0.001). As with the British forms, spelling is mostly an exception to the general increase in American forms, with all American spellings except defense receding. In regard to zee, the data in Table 5 indicate that the decline in zed seen in Table 4 was not entirely a decisive shift to zee: among the youngest respondents today, zed is preferred by 39% but zee by only 31%, while just as many (30%) now respond with “either way”. An interesting question for future research is whether the increase in “either way” responses is a general development applying to other variables as well, perhaps reflecting a generational shift toward a more permissive or ambivalent and disinterested attitude about linguistic standards.
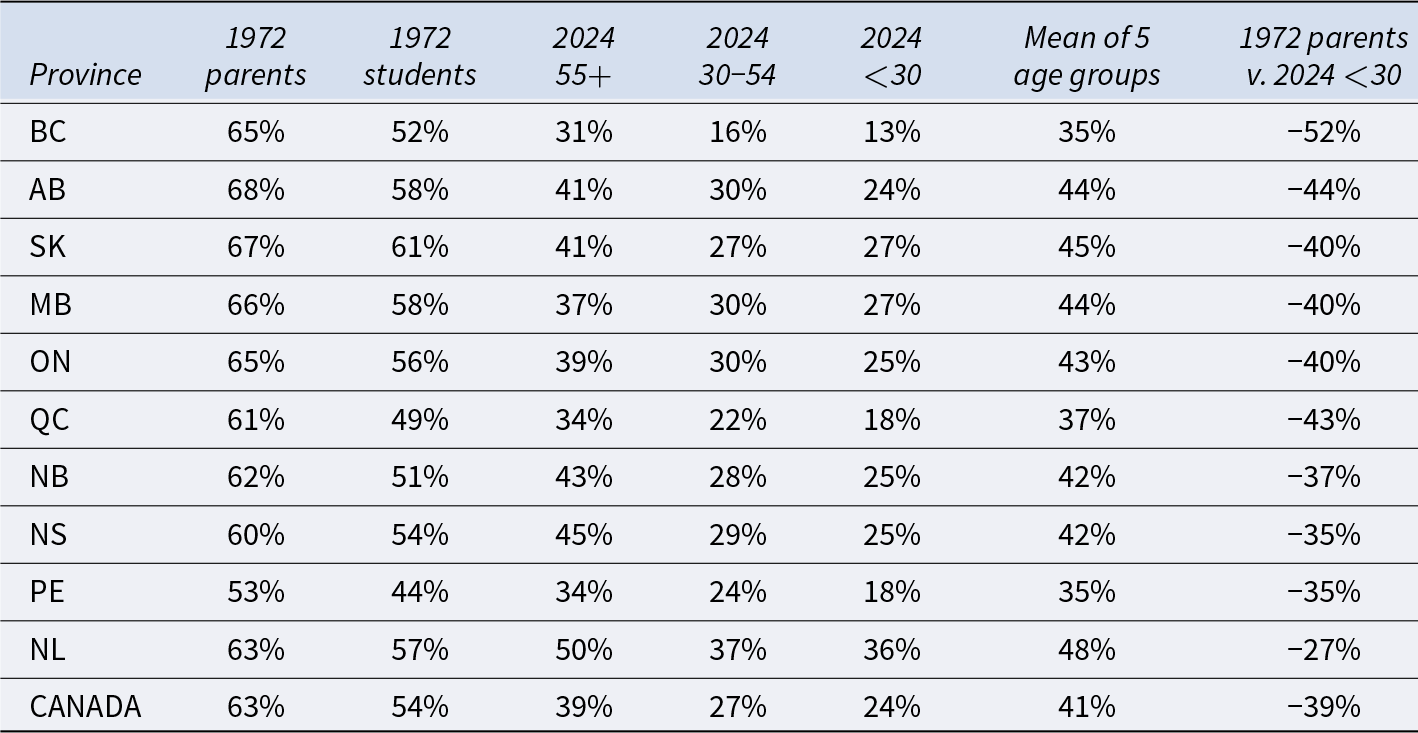
Finally, Table 6 shows that the forms associated predominantly (but not exclusively) with Canadian English are all declining except for the pays pronunciation of vase, which actually grows. The two other pronunciation items and the two vocabulary items all show sharp declines, shifting from a majority of responses among 1972 parents to a minority today, with the pane pronunciation of again and the word chesterfield all but disappearing among the middle and younger groups in 2024. It should be noted that the evidence of Canadian forms in Table 6 is limited by Scargill and Warkentyne’s choice of variables for their survey, but the pattern of decline is corroborated by several of the new vocabulary questions added to the NSCE. Of the Canadianisms established by Boberg (Reference Boberg2010: 116), declines across the 2024 generations are also seen in the frequency of bachelor apartment for studio apartment (64% among the 55+ group to 33% among the <30 group), bank machine for ATM (38% to 12%), and scribbler for notebook (38% to 15%), though other examples, like grade one for first grade, parkade for parking garage, runners and running shoes for sneakers, and washroom for restroom, are stable. These Canadianisms, among many others, are also documented in the new online edition of the Dictionary of Canadianisms on Historical Principles (Dollinger and Fee Reference Dollinger and Fee2017).
Proportions of predominantly Canadian variants of 5 variables for five age groups

3.3 Regional variation in the prevalence of British, American, and Canadian forms
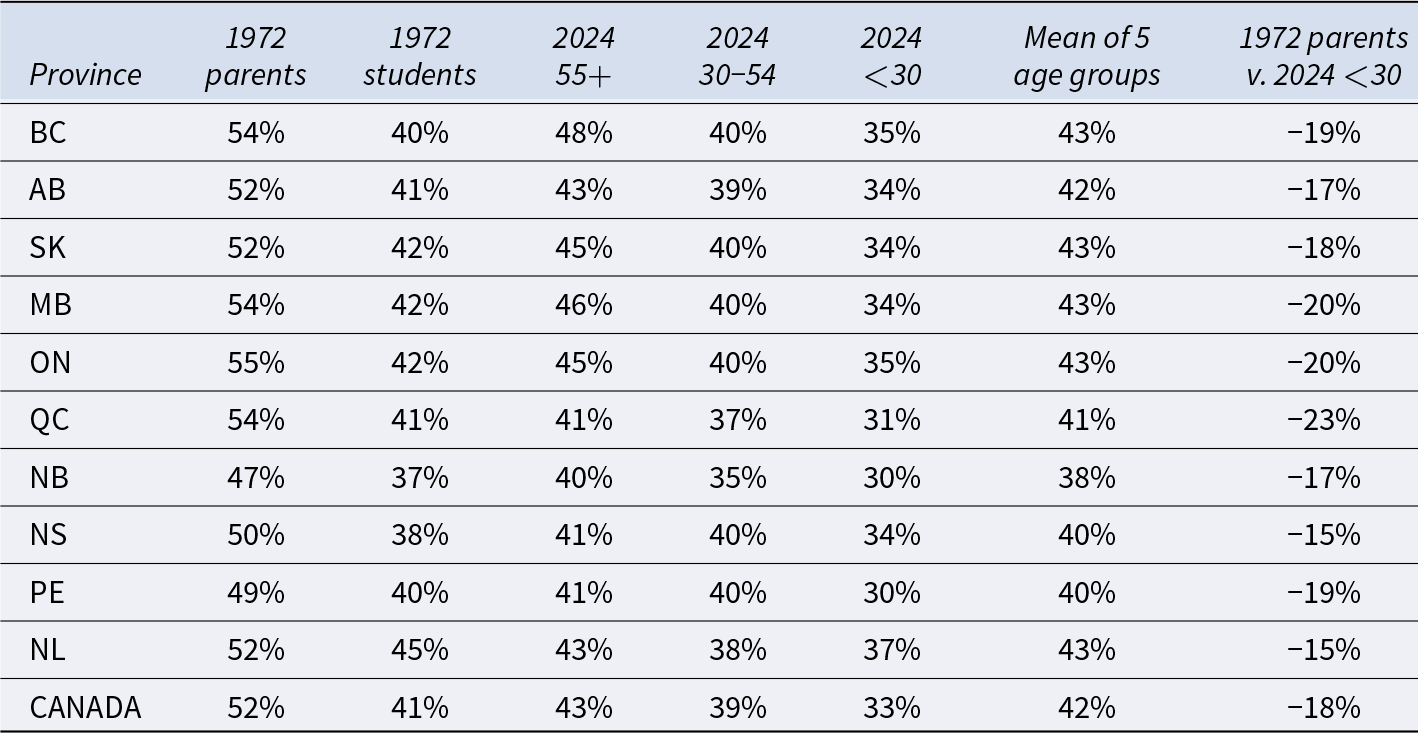
As indicated in Table 1, respondents to both surveys have been categorized by province, with the 2024 data analyzed here restricted to those respondents who still live in the province where they grew up (the residential history of the 1972 respondents is unknown). This makes it possible to see how the British, American, and Canadian index trends displayed in Tables 4–6 vary by province, as well as age group, an analysis presented in Tables 7–9.
Mean proportions of 21 predominantly British variants by age group and province

Mean proportions of 21 predominantly American variants by age group and province

Mean proportions of five predominantly Canadian variants by age group and province

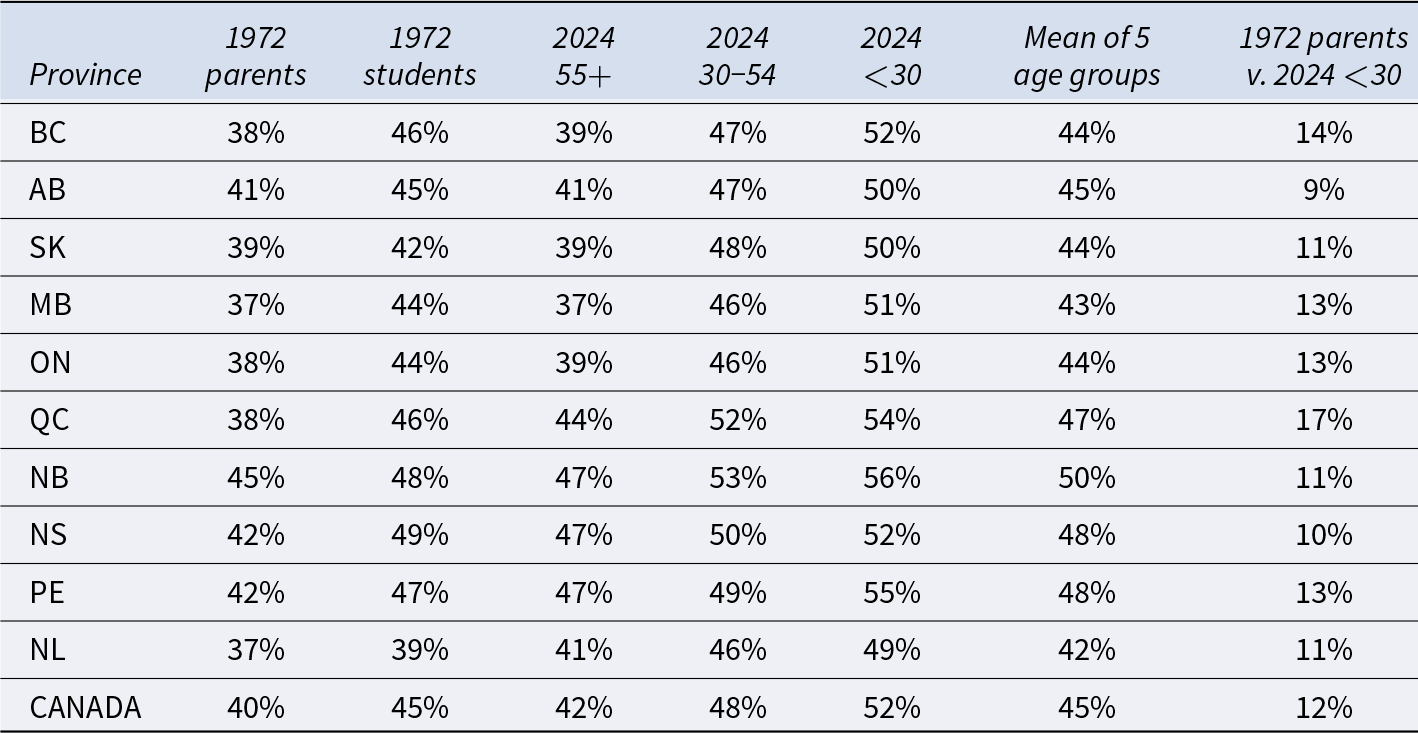
Like Tables 4–6, Tables 7–9 reveal a gradual increase in the proportions of American forms at the expense of both British and Canadian forms, but the rise in American forms (12%) is not as strong as the fall of British (-18%) and Canadian forms (-39%), owing to the growth of “either” responses, as in the case of zed and zee discussed above. The provinces do vary, both in their index scores and in how those scores change between surveys and age groups, but the regional variation is generally small. The highest British index score, across the five groups, is 43%; this is shared by half of the provinces, but is generally higher in Western Canada and Ontario, as well as Newfoundland and Labrador, and slightly lower in Quebec and the Maritimes; the lowest British index score is 38%, in New Brunswick. That province also has the highest American index score, 50%, while the lowest is 42%, in Newfoundland; American forms tend to be more predominant in the East than in the West, the converse of British forms. Newfoundland also has the highest mean proportion of Canadian forms, 48%, while the lowest, 38%, is in Quebec. Turning to the last column of Tables 7–9, Quebec also shows the sharpest decline of British forms (-23%), Nova Scotia and Newfoundland the lowest (-15%); Quebec shows the greatest rise in American forms (17%) and Alberta the lowest (9%); for Canadian forms, the sharpest decline is in British Columbia (-52%), the smallest in Newfoundland (-27%).
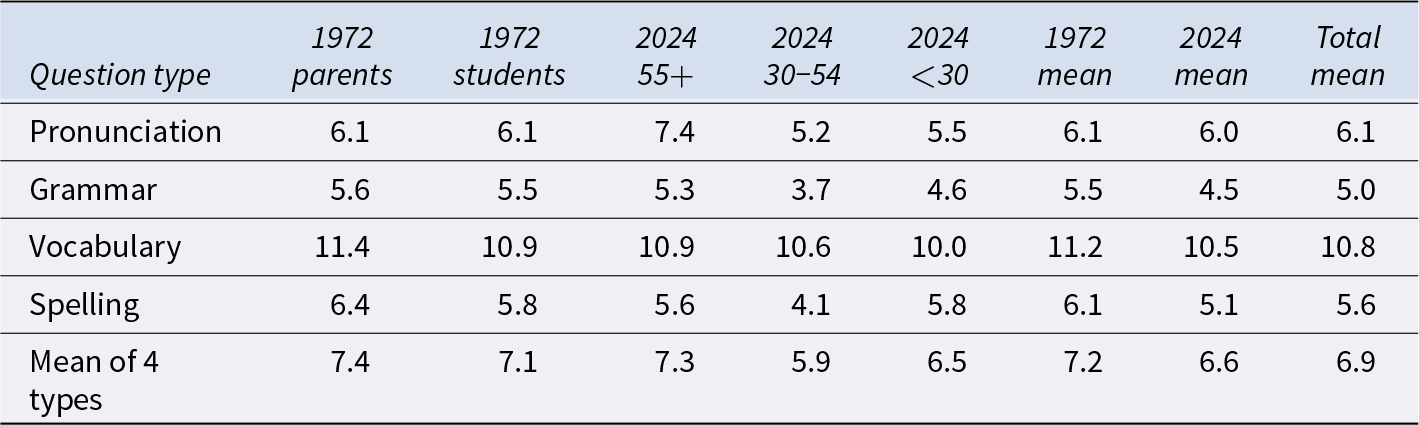
Regional (in this case interprovincial) variation can be examined in a more general way by calculating the standard deviation in the provincial variant proportions for each age group, for each question or variable, a measure of how much regional variation each survey and age group shows, across the 43 directly comparable questions. Table 10 shows the mean regional standard deviation for each question category, for each age group, and the mean across the four categories.
Mean standard deviation of regional variant proportions (in percent) by question category for five age groups, with grand mean across categories

The last column of Table 10 shows that the vocabulary variables involve much more regional variation (a mean standard deviation of 10.8) than the other types of variables (5.0-6.1). This was one of the motivations for adding a large set of vocabulary questions to the new survey which were not asked in 1972. The regional variation displayed by these newer variables (at both provincial and sub-provincial levels) will be examined in a separate article (Boberg et al. Reference Boberg, Henderson and Mundieto appear), but they reinforce the view, supported by the 1972 data analyzed here, that Canadians in different provinces are comparatively uniform in their pronunciation, grammar, and spelling, and differ mostly in terms of vocabulary.
Table 10 also offers an overall view of whether the amount of regional variation in Canadian English has changed over the last fifty years, or between generational groups. The mean standard deviation of the four variable types across age groups is 7.2 for the 1972 survey and 6.6 for the new survey, a small difference that is not, in fact, significant (by t-test, p = 0.292). The biggest change in the bottom row of the table occurs not between the surveys but between the oldest and middle age groups in the new survey: from a mean of 7.3 for the oldest 2024 group, who have approximately the same value as the 1972 groups, to a mean of 5.9 for the middle 2024 group; the mean then rises again to 6.5 for the youngest group. These differences do reach statistical significance: middle vs. old in 2024 (p = 0.012) and middle and young in 2024 vs. all the other groups (p = 0.011); the rise between middle and young in 2024 is not significant (p = 0.455). This indicates that regional variation in Canadian English is diminishing over time, a change that began during the childhoods of the middle generation of 2024 respondents, the oldest of whom would have grown up in the mid-1970s. This may be part of a larger continental trend toward trans-regional convergence in local speech, at least at higher social levels, as noted by Boberg (Reference Boberg2021: 24), among many others.
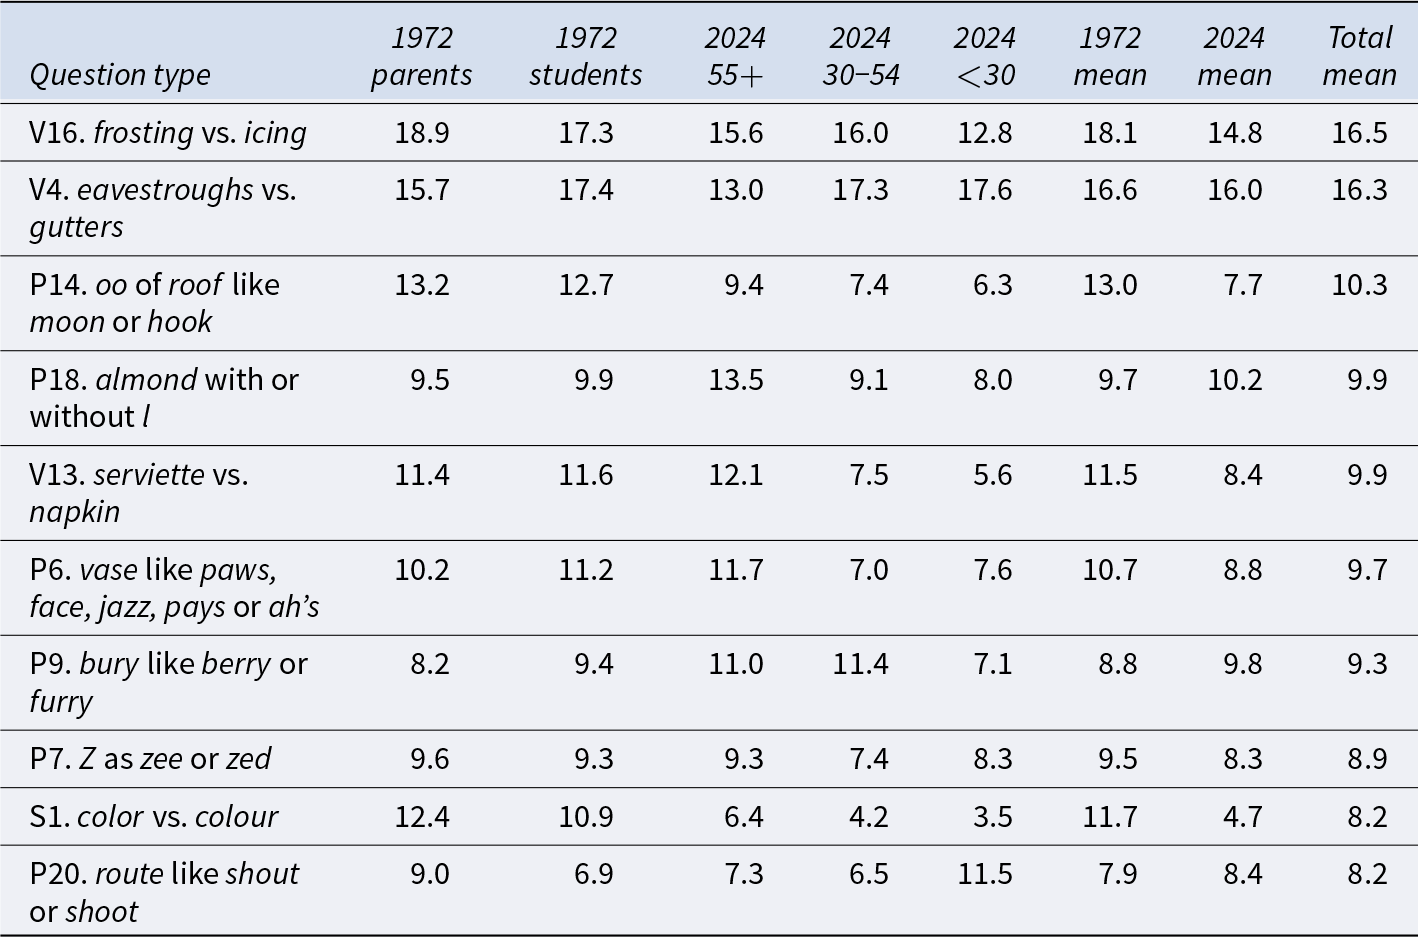
Finally, we can use the interprovincial standard deviation measure to identify the individual variables that show the most regional variation across the two surveys. The top ten are shown in Table 11.
Ten questions with the greatest amount of regional variation, ranked by standard deviation in provincial variant proportions

There is no space to analyze these cases of regional variation in detail (for complete regional data for all questions, see https://www.mcgill.ca/canadianenglish/results), but their basic character can be briefly summarized as follows:
V16: Most of Canada shows a strong preference for the British term icing, but American frosting challenges it in the Maritimes, especially New Brunswick.
V4: As shown in Table 6, eavestroughs is a declining Canadianism, but it hangs on best on the Prairies and in Ontario, while the general non-Canadian term gutters is strongest in British Columbia, Quebec, and the Maritimes.
P14: Most of Canada shows a strong preference for roof with the vowel of moon, also the standard pronunciation in other national varieties, but the regional variant with the vowel of hook, never the majority form and now rare in Canada, was once strongest in Atlantic Canada, especially Newfoundland, where it was chosen by half of both age groups in 1972.
P18: Canadians in 2024 strongly prefer pronouncing almond with the l, but the l-less variant was more popular in 1972, especially on the Prairies and in Ontario and Nova Scotia.
V13: Serviette has now almost vanished from Canadian English, but it was still used by half of the 1972 parents and a third of their children, with particular strength in Manitoba, Ontario, and Newfoundland, while napkin was strongest in New Brunswick and Prince Edward Island.
P6: Its many variants make the pronunciation of vase a complex variable, with most Canadians alternating among an approximately British paws-like variant (the true British quality is closer to ah’s, but these are in fact merged for most Canadians), a more American face-like variant, and a more Canadian pays-like variant; paws is strongest from the West to Quebec, face in the Maritimes, and pays in all of Atlantic Canada.
P9: Most Canadians say bury sounds like berry, but a persistent third or so, across surveys and age groups, prefer to rhyme it with furry; these live mostly on the Prairies, in Quebec, and in Newfoundland, with the highest proportion in Saskatchewan.
P7: The main exception to the national predominance of zed in 1972 was Newfoundland, where half of parents preferred zee, and that province retains the highest proportion of zee today (59% among the youngest group), whereas zed offers the most resistance to zee in the West and Ontario.
S1: The remarkable growth of the British spelling of colour to become the Canadian standard today was spearheaded by Ontario, where 75% of parents already used it in 1972, compared to only 23% of parents in Alberta and Saskatchewan; today, Ontario still has the highest proportion of colour (92%), but the rest of the country has almost caught up.
P20: Most Canadians rhyme route with shoot, but the shout-like pronunciation shows a curvilinear development, from 31% of parents in 1972 to only 12% of the oldest respondents in 2024, then growing again to 29% of the youngest group in 2024; throughout this development, its strongest regional presence has always been on the Prairies.
4. Discussion
In summarizing the results of the original survey, Warkentyne (Reference Warkentyne1971: 195) explains that “one of the primary aims of the Survey was to compare the speech of the young with that of their parents […] to show how Canadian English is faring as generation gives way to generation.” Other than the five spelling variables, the 104 questions “were not designed to show American or British influence”, yet many of them do involve differences between British and American variants, something which has understandably been a major preoccupation for linguists studying Canadian English, given its historical and present geographical and cultural context. A balance between British, American, and, in some cases, uniquely Canadian pronunciation, grammar, vocabulary, and spelling is, indeed, a definitive feature of Canadian English (Avis Reference Avis1983: 7), and shifts in that balance are among the most important ways English in Canada is changing between generations of its speakers. The new survey reported here gives us a fifty-year perspective on this question – the span of about two generations – as well as a new set of data on how Canadian English varies today, both by region and between age groups.
Due to the history of English-speaking settlement in Canada, explored in detail by Avis (Reference Avis and Sebeok1973: 43–51) and Boberg (Reference Boberg2010: 55–105), Canadian English has always entailed a mixture of American and British features, though its basic character, in terms of lexicon, phonology, and grammar, is North American, being much more similar to General American English than to the Southern British standard (Boberg Reference Boberg2010: 109, 159, 166). With a small set of exceptions, many of which feature in the present survey and its predecessors, when British and American English differ, Canadian English generally aligns closely with American. Some aspects of this character were established by the United Empire Loyalists, refugees from the American Revolutionary War who founded the first major English-speaking settlements in Ontario, Quebec, and the Maritimes in 1783-84, bringing the colonial American English of New England and the Mid-Atlantic states to British North America. In the first half of the 19th century, however, direct immigration from all over the British Isles added many regional dialects of British English, including Irish and Scottish English, to the Canadian mix. Following the completion of the Canadian Pacific Railway linking Montreal and Vancouver in 1885, the Canadian West was settled by an even greater diversity of migrants, with the largest groups coming from Britain, the United States, Europe and, most importantly, Eastern Canada; the latter group transplanted Eastern Canadian English, especially Ontario English, westward.
As Canada’s primary political and cultural orientation gradually shifted from Britain, in the nineteenth century, to the United States, in the twentieth, the country and its language came under increasing American influence, aided by ever-improving communication technologies that broke down the barriers that had isolated Canadians from such influence in the past. The recent Americanization of Canadian English, beyond its initial North American character, can be seen in the replacement of both British and uniquely Canadian pronunciations, grammatical forms, and vocabulary with variants that are more common in American English. The variables discussed above provide several examples of each type, with comparatively few counterexamples: British forms at various stages of decline include eight pronunciations (of the words lever, new, student, schedule, Z, lieutenant, leisure, and progress), two grammatical forms (dived and sneaked as the past tenses of dive and sneak), and two vocabulary items (tap and serviette); declining Canadian forms include the pronunciation of arctic and again and the words chesterfield and eavestroughs.
The major exception to Americanization is spelling, where most Canadians still prefer British spellings like colour, travelled, and grey, likely as a result of both ideological factors such as the need to symbolize Canada’s cultural independence from the United States (Heffernan et al. Reference Heffernan, Borden, Erath and Yang2010) and the associated adoption of these spellings by Canadian schools, governments, media, and other institutions (Dollinger and Clarke 2012), but it is uncertain whether this preference will continue in the future. Spelling, moreover, relates to written language, a medium usually excluded from linguistic analysis, which has traditionally focused on spoken language. Nevertheless, written language can also take on a symbolic function in national, regional and social identity, particularly in today’s digital world, with so much daily communication occurring in written form. This is especially true in Canada, where there has long existed some degree of uncertainty about whether to follow the British standard, the American standard, or a uniquely Canadian mix of both (Ireland Reference Ireland1979, Reference Ireland1980; Pratt Reference Pratt and Clarke1993).
Warkentyne (Reference Warkentyne1971: 197) cites several examples of regional variation in his report on the original survey, but admits that “Clear-cut judgments on dialect boundaries within Canada are difficult to make from the Survey data. There is a tremendous overlapping of features from one area to the next, suggesting active diffusion. Perhaps an extension of the checklist to include many more known regionalisms would make the task much easier. However, this remains a task for the future.” This task has been the second major concern of the present survey, inspiring the addition of many new vocabulary variables that were not included on the original questionnaire, which are analyzed in a separate article (Boberg et al. Reference Boberg, Henderson and Mundieto appear). Even the variables included in the 1972 survey and analyzed above, however, show some degree of regional variability. This may not seem surprising to many readers, but the presence of regional variation in Canadian English, as opposed to widespread trans-regional homogeneity, has been a point of contention in previous research: many early observers were struck by the comparative uniformity of mainland Canadian speech from British Columbia to Nova Scotia (e.g., Bloomfield Reference Bloomfield1948: 63, Priestley Reference Priestley, Partridge and Clark1951: 75–76, Avis Reference Avis and Sebeok1973: 50–51), though more recent research has tended to emphasize the regional differences that nevertheless exist (for a discussion of this question, see Dollinger and Clarke Reference Dollinger and Clarke2012; for analyses of regional differences in vocabulary and phonetics, see Boberg Reference Boberg2005, Reference Boberg2008, and chapters 4 and 5 of Reference Boberg2010). Respondents from Canada’s ten provinces are shown above to differ slightly in the degree to which they exhibit the national shift toward American forms and more robustly in relation to some individual variables, particularly vocabulary items like frosting vs. icing and eavestroughs vs. gutters. Nevertheless, across the full set of 43 directly comparable questions, regional variation is declining, with lower standard deviations of provincial variant frequencies among the middle and youngest age groups today than are found among today’s oldest respondents or the students and parents of 1972. This is a further reflection of the advancing American forms listed in Table 5: As these forms generalize among today’s speakers of Canadian English, their association with the particular regions in which they were first adopted begins to weaken.
The patterns of change and variation identified and discussed here, along with the general conclusions they support about the development of Canadian English over the last five decades and about its current form, are admittedly dependent to at least some extent on the set of variables that Scargill and Warkentyne chose to study in 1972 and on the subset of those variables we chose to restudy in our partial replication of their groundbreaking survey. The aggregate analyses presented above, looking at 45 variables at four different levels of linguistic structure, certainly present a less arbitrary view than studies of only one or a few variables, or of only one kind of variation, but our view of the recent past, present, and future of Canadian English might be different if based on a different set of variables, or on a different methodological approach, such as quantitative analysis of sociolinguistic interviews or acoustic analysis of recorded speech. This is a limitation, of course, of replication work: the replication is necessarily constrained by choices made by those who designed the original study. With respect to regional variation, at least, previous research suggests Scargill and Warkentyne’s choices were not ideal: the set of variables included in the North American Regional Vocabulary Survey (Boberg Reference Boberg2005), many of which were appended to the questionnaire used in the present replication, have much greater regional diagnostic power than those of the SCE. Scargill and Warkentyne, of course, decided to focus on what seemed to them the most important variables at the time, based on their well-informed understanding of Canadian English (including Scargill’s then-recent work on the Dictionary of Canadianisms) and of English dialect variation in a broader context, and on their knowledge of the results of earlier surveys, such as Avis (Reference Heffernan, Borden, Erath and Yang1954–56). From a five-decade retrospective point of view, nevertheless, some of their decisions now seem regrettable, while others turned out to have enduring value for subsequent research. That is, of course, true of any research project, no doubt including the present replication. This limitation, however, does not diminish the legacy that Scargill and Warkentyne’s work bestowed upon future generations of linguists, providing a benchmark for real-time comparison in the study of change over real time, based on a large, Canada-wide sample. We hope that the present project has made good use of that legacy and that future projects will continue in this tradition.
Appendix: New Survey of Canadian English
Part 1: Demographic Questions
D1. What is your native language (mother tongue, or first language learned or understood)?
English Other: ________________________________________
D2. Where did you receive most of your primary & secondary schooling (ages 5−17)?
Province/Territory (Canada) OR Country: _________________________________________
City/Town: __________________________________________________________________
D3. Where do you live now?
Province/Territory (Canada) OR Country: _________________________________________
City/Town: __________________________________________________________________
D4. Where did your mother/parent 1 receive most of her primary & secondary schooling?
Province/Territory (Canada) OR Country: _________________________________________
City/Town: __________________________________________________________________
D5. Where did your father/parent 2 receive most of his primary & secondary schooling?
Province/Territory (Canada) OR Country: _________________________________________
City/Town: __________________________________________________________________
D6. In what year were you born? ________________________________________________
D7. What is your sex? Female Male Other: ________________________ Prefer not to answer
Part 2: Pronunciation Questions
P1. Lever rhymes with: (A) beaver (B) never (C) either way.
P2. New rhymes with: (A) do (B) few (C) either way.
P3. The u in student is pronounced like: (A) oo in too (B) u in use (C) either way.
P4. The sch- of schedule is pronounced like:
(A) sch- of school (B) sh- of shoe (C) either way.
P5. Genuine rhymes with: (A) fin (B) fine (C) either way.
P6. Vase rhymes with: (A) paws (B) face (C) jazz (D) pays (E) ah’s
P7. The letter Z is pronounced: (A) zee (B) zed (C) either way.
P8. The i of semi-, as in semi-final, rhymes with: (A) my (B) me (C) either way.
P9. Bury rhymes with: (A) berry (B) furry (C) either way.
P10. Is the first c in arctic pronounced? (A) yes (B) no (C) sometimes.
P11. Again rhymes with: (A) pane (B) pen (C) pin.
P12. The first syllable of lieutenant is pronounced like: (A) left (B) loot (C) either way.
P13. Leisure rhymes with: (A) pleasure (B) seizure (C) either way.
P14. The oo of roof is pronounced like: (A) oo of moon (B) oo of hook (C) either way.
P15. The ei of either is pronounced like: (A) i of bide (B) ee of beet (C) either way.
P16. Does cot rhyme with caught? (A) yes (B) no
P17. Missile rhymes with: (A) thistle (B) misfile (C) either way.
P18. Do you pronounce the L of almond? (A) yes (B) no
P19. The o of progress (noun – e.g., “we made progress”) is pronounced like:
(A) o of go (B) o of got. (C) either way.
P20. Route rhymes with: (A) shout (B) shoot (C) either way.
P21. The first t of congratulate is pronounced like:
(A) -tch of catch (B) -dge of badge (C) either way.
P22. Do you pronounce the wh- of which or whine and the w- of witch or wine in the same way?
(A) yes (B) no
P23. The o of process (noun – e.g., “a simple process”) is pronounced like:
(A) o of go (B) o of got (C) either way.
P24. Fertile rhymes with: (A) hurtle (B) her tile (C) either way.
P25. The u in Tuesday is pronounced like: (A) oo in too (B) u in use (C) either way.
P26. The first a in drama is pronounced like:
(A) a in gamma (B) o in comma (C) either way.
(D) halfway between the sounds in A and B.
Part 3: Grammatical Questions
Which would you say?
G1. (A) He dove into the pool (B) He dived into the pool; (C) Either one.
G2. (A) The submarine dove; (B) The submarine dived; (C) Either one.
G3. (A) Between you and I; (B) Between you and me; (C) Either one.
G4. (A) Who did you see? (B) Whom did you see?; (C) Either one.
G5. (A) He has drank three glasses of milk; (B) He has drunk ….; (C) Either one.
G6. (A) It was laying on the floor; (B) It was lying …; (C) Either one.
G7. (A) It looks as if he’ll go; (B) It looks like he’ll go; (C) Either one.
G8. (A) He walked towards the door; (B) …toward the door; (C) Either one.
G9. (A) If he was here, things would improve; (B) If he were here, …; (C) Either one.
G10. (A) My book is different to yours; (B) My book is different than yours;
(C) My book is different from yours.
G11. (A) He snuck by when my back was turned; (B) He sneaked by ….; (C) Either one.
G12. (A) Could you lend me a dollar?; (B) Could you loan me a dollar?; (C) Either one.
Part 4: Vocabulary Questions
The following questions ask about variation between different words for the same thing.We’ve divided them into sections based on contexts they occur in.
Around the house: What would you call…
V1. A water valve on an indoor basin or sink:
(A) tap (B) faucet (C) Other: _____________________________________________
V2. A small cloth for washing your face:
(A) face cloth (B) face flannel (C) washcloth (D) Other: ______________________
V3. A container to hold water for washing the car or the floor:
(A) bucket (B) pail (C) Other: _____________________________________________
V4. Devices attached to the roof of a house to catch rain:
(A) eavestroughs (B) gutters (C) Other: ____________________________________
V5. An upholstered piece of furniture with room for three people in a row:
(A) a sofa (B) a chesterfield (C) a couch (D) Other: ______________________
V6. A piece of furniture with drawers for socks, underwear, etc.:
(A) bureau (B) chest of drawers (C) dresser (D) Other: ________________________
V7. A garment you wear over pajamas at home:
(A) bathrobe (B) dressing gown (C) housecoat
(D) robe (E) Other: ______________________________________________________
V8. A close-fitting, knitted winter hat, sometimes with a pompom on the crown:
(A) beanie (B) ski hat (C) toque/tuque (D) Other: _________________________
V9. A container for a woman’s personal articles (keys, make-up, wallet, etc.):
(A) bag (B) handbag (C) pocketbook
(D) purse (E) Other: ________________________________________________________
V10. Athletic shoes worn with jeans as casual footwear:
(A) gym shoes (B) runners (C) running shoes
(D) sneakers (E) tennis shoes (F) Other: ____________________________________
V11. A small house in the countryside, often by a lake, where people go on summer weekends:
(A) cabin (B) camp (C) chalet (D) cottage
(E) lake house (F) summer house (G) Other: ___________________________________
V12. A small apartment without a separate bedroom (i.e., with sleeping and living quarters in a single room):
(A) bachelor (B) loft (C) one- or two-and-a-half
(D) studio (E) Other: _____________________________________________________
Food & drink: What would you call…
V13. What you wipe your mouth with after eating:
(A) serviette (B) napkin (C) either one (D) Other: ________________________
V14. Knives, forks and spoons:
(A) cutlery (B) silverware (C) utensils (D) Other: ________________________
V15. Your main evening meal:
(A) dinner (B) supper (C) Other: _______________________________________
V16. The sweet top layer of a cake:
(A) frosting (B) icing (C) Other: _______________________________________
V17. A carbonated, non-alcoholic beverage, like Coke®, Pepsi®, Sprite®, or Mountain Dew®:
(A) pop (B) soda (C) soft drink (D) Other: _________________________
V18. Pizza with all of the usual toppings (e.g., cheese, pepperoni, mushrooms, onion and green pepper):
(A) all-dressed (B) deluxe (C) everything-on-it
(D) loaded (E) supreme (F) the works
(G) Other: ___________________________________________________________________
At school: What would you call…
V19. A year of school before kindergarten:
(A) junior kindergarten (B) prématernelle (C) nursery school
(D) play school (E) pre-K (F) preschool (G) Other: ________________________
V20. The first numbered year of school:
(A) first grade (B) grade one (C) Other: _______________________________________
V21. The first 6 years of school:
(A) elementary school (B) grade school (C) grammar school
(D) primary school (E) public school (F) Other: ______________________________
V22. A number or letter evaluating an essay or exam in school:
(A) grade (B) mark (C) note (D) Other: ____________________________________
V23. A book of lined paper for school:
(A) copybook (B) exercise book (C) notebook
(D) scribbler (E) Other: _____________________________________________________
V24. Pencils used in school for drawing in colour:
(A) colo(u)red pencils (B) colo(u)ring pencils
(C) pencil crayons (D) Other: ______________________________________________
V25. The article with shoulder straps carried on a student's back to hold books and other items:
(A) backpack (B) bookbag (C) kit bag (D) knapsack
(E) packsack (F) rucksack (G) satchel (H) schoolbag
(I) Other: _________________________________________________________________
V26. The class in school where you exercise and play sports:
(A) gym (B) P.E. (C) phys-ed (D) Other: __________________________________
V27. A long, tilting board that children play on:
(A) see-saw (B) teeter-totter (C) Other: ____________________________________
V28. A division of the school year, e.g. fall or winter:
(A) semester (B) term (C) Other: ____________________________________
V29. A summertime break from work or school:
(A) summer holiday (B) summer vacation
(C) summer break (D) Other: ____________________________________________
Around the community: What would you call…
V30. A small store, open late, that sells milk, newspapers, snacks, etc.:
(A) convenience store (B) corner store (C) dépanneur (or “dep”)
(D) variety store (E) Other: ____________________________________________
V31. The place where you pay for purchases in a store:
(A) cash (B) cashier (C) check-out
(D) counter (E) (cash) register (F) till
(G) Other: _________________________________________________________________
V32. A machine that performs banking services:
(A) ATM (B) bank machine (C) guichet (D) Other: _________________________
V33. A multi-level structure for parking cars:
(A) car park (B) (parking) garage (C) parkade (D) Other: ____________________
V34. Bright orange objects used to control traffic, e.g. around a construction site:
(A) traffic cones (B) traffic pylons (C) Other: ____________________________
V35. Toilet facilities in a public place (e.g. airport, office or shopping mall):
(A) bathroom (B) ladies’ or men’s room (C) restroom
(D) toilet (E) washroom (F) Other: __________________________________
V36. The appliance that provides drinking water in a public place:
(A) drinking fountain (B) water fountain (C) Other: ___________________________
V37. A small freshwater channel in the countryside:
(A) brook (B) creek (C) stream (D) Other: ________________________________
Part 5: Spelling Questions
Which spelling do you normally use?
S1. (A) color; (B) colour; (C) either one.
S2. (A) center; (B) centre; (C) either one.
S3. (A) travelled; (B) traveled; (C) either one.
S4. (A) defense; (B) defence; (C) either one.
S5. (A) grey; (B) gray; (C) either one.
S6. (A) labor; (B) labour; (C) either one.
S7. (A) fiber; (B) fibre; (C) either one.
S8. (A) certified check; (B) certified cheque; (C) either one.
S9. (A) catalog; (B) catalogue; (C) either one.
S10. (A) program; (B) programme; (C) either one.
THANK YOU FOR PARTICIPATING!

 Open access

