

Data from prevalence surveys suggest that nearly 16 million under-5 children worldwide suffer from wasting at any given time( 1 ). This may contribute to the deaths of half a million children per year, if not more( Reference Black, Victora and Walker 2 ).
The management of severe acute malnutrition (SAM) commonly involves programmes that include both inpatient care for cases with complications and outpatient care for cases without complications( Reference Collins 3 , 4 ).
To plan for the implementation of SAM treatment services and estimate the burden of SAM cases, and thus the needed resources such as staff, materials, therapeutic foods, medicines and ultimately funding, the expected number of children requiring treatment needs to be estimated. The caseload of malnutrition over a given period is the sum of current (prevalent) cases at the beginning of the period and new (incident) cases occurring in the given period. Estimation of incident cases usually requires surveillance systems, which are not in place in most countries and unlikely to be operating in areas affected by complex humanitarian emergencies. The common approach to estimating the number of children who will require treatment is to conduct cross-sectional surveys that measure the prevalence of SAM using a method such as the Standardized Monitoring and Assessment of Relief and Transitions (SMART) survey methodology( 5 ). Prevalence surveys, when used with population estimates, directly estimate the number of prevalent cases at the time of the survey, but not the number of incident cases that will occur over a period for programme planning.
Incidence can be estimated as:
 $$\openup -3.5pt\eqalignno{ {\rm Incidence}\,&{\equals}\,{\rm prevalence}/{\rm duration}\,{\rm of}\,{\rm illness}^{{(6)}} \cr & \,{\equals}\,{\rm prevalence}{\times}({\rm duration}\,{\rm of}\,{\rm planning}\,{\rm period}/\cr &\quad {\rm duration}\,{\rm of}\,{\rm illness}). $$
For a planning period of 1 year, the incidence conversion factor is 1/duration of illness with the duration of illness expressed in years. Thus:
 $${\rm Incidence}\,{\equals}\,{\rm prevalence}{\times}({\rm incidence}\,{\rm conversion}\,{\rm factor}).$$
The expected caseload can therefore be calculated as:
 $${\rm Expected}\,{\rm caseload}\,{\equals}\,{\rm prevalent}\,{\rm cases}{\plus}{\rm incident}\,{\rm cases}.$$
This is equivalent to:
 $$\openup -4pt\eqalignno{ {\rm Expected}\,{\rm caseload}\,&{\equals}\,({\rm population}{\times}{\rm prevalence}) \cr & \,\,\,\,{\plus}({\rm population}{\times}{\rm prevalence}\cr&\,\,\,\,{\times}{\rm incidence}\,{\rm conversion}\,{\rm factor}). $$
This can be simplified to:
 $$\kern7pt\openup -3.5pt\eqalignno{ & {\rm Expected}\,{\rm caseload}\,{\equals}\,{\rm population}{\times}{\rm prevalence}\cr&\quad\quad\quad\quad\quad\quad\quad\quad\quad\,\!\!\!{\times}(1{\plus}{\rm incidence}\,{\rm conversion}\,{\rm factor}) \cr& \quad\quad\quad\quad\quad\quad\quad\quad{\equals}\,N{\times}P{\times}(1{\plus}J), $$
where N is the population aged between 6 and 59 months in the programme area; P is the estimated prevalence of SAM; and J is the incidence conversion factor over a given time period. A commonly used guideline( Reference Myatt 7 ) expresses (1+J) as K and uses the formula:
 $${\rm Expected}\,{\rm caseload}\,{\equals}\,N{\times}P{\times}K,$$
where K, the (prevalence) correction factor to expected caseload, is 1+J. In the current study we focus on J.
In addition, expected programme coverage over a given period (C) needs to be considered to calculate the number of children who will seek treatment. The final equation to predict the number of expected SAM cases from prevalence data over a given period is therefore:
 $${\rm Expected}\,{\rm caseload}\,{\equals}\,N{\times}P{\times}(1{\plus}J){\times}C.$$
This equation is the basis for the current guidance on the estimation of SAM caseload( 1 , Reference Myatt 7 ). The value of J that is currently used in these guidelines was derived from estimates of the average duration of episodes of untreated SAM in two African populations, of 7·5 months( Reference Garenne, Willie and Maire 8 ). Adjusting for a 12-month period:
 $$J\,{\equals}\,12/7 \!\cdot\! 5\,{\equals}\,1 \!\cdot\! 6.$$
The extent to which accurate prediction of expected SAM caseload might be derived from prevalence surveys using the above formula has, however, not been validated in many settings in which SAM is common.
The aim of the present study was to estimate J and then attempt to validate current practice for predicting the caseload of SAM from prevalence surveys in several settings. This was done by correlating the expected number of children to be treated, based on the prevalence calculated from surveys and population estimates, and the observed number of SAM patients treated after the surveys. If the assumption that using a constant conversion factor to convert prevalence into caseload is correct, then these two variables should be highly correlated and the slope of the regression line should give the best estimate of the correction factor (1+J).
Methods
Data for the present study involved nutrition surveys and reports from therapeutic feeding programmes managing SAM which were opened or were continuing to operate because of the findings of these surveys. Surveyed children were aged 6–59 months (i.e. the standard nutrition survey and nutrition treatment programme population). The data requested from the programmes included: relevant prevalence surveys, information on monthly admissions to inpatient and outpatient care, and data regarding coverage of the programmes (if available).
Twenty-four data sets were obtained from three sister non-governmental organisations (Action Contre la Faim, Action Against Hunger–USA and Action Contra la Hambre). No coverage survey results were available. The dates of the prevalence surveys and programmes ranged from August 2005 to December 2009 and took place in the six following countries, with the number of data sets given in parentheses: Democratic Republic of Congo (Reference Garenne, Willie and Maire8); Burundi (Reference Black, Victora and Walker2); Somalia (Reference Black, Victora and Walker2); Sudan (Reference Myatt7); Myanmar (Reference Black, Victora and Walker2); and Niger (Reference Collins3). All surveys used the National Center for Health Statistics Growth Reference( Reference Hamill, Drizd and Johnson 9 ) for calculation of SAM prevalence. Weight-for-height percentage of median (WHM) below 70 % of the National Center for Health Statistics reference median or the presence of bilateral pitting oedema was used as the case definition for SAM. All programmes in the present study used this case definition for identifying and admitting cases of SAM. Children less than 6 months of age were excluded from admission totals as these children are excluded from nutritional surveys. Children who were admitted only by mid-upper arm circumference (MUAC) were not included in the study to be consistent with the surveys, which did not collect data on MUAC. As oedematous malnutrition is a transient condition which may require a different coefficient for burden assessment, the study was limited to non-oedematous children. Programme admission data in the months following the survey were requested for as many months as possible, with an initial aim of 12 months. Several programmes had limited data only to 5 months after the survey took place. We adjusted our requirement for length of programme to allow inclusion of these data sets. One survey from Burundi was an outlier having very high prevalence estimate which was inconsistent with low reported admissions figures. Detailed examination of the context from the survey report yielded no apparent major food crisis, so this very high prevalence estimate was considered implausible and this survey and related admissions data were censored.
To estimate the number of children with SAM in the population at the time of the survey, the estimated prevalence was multiplied by the number of children between aged 6 and 59 months in the population. Population sizes were taken from survey reports, or if this was not given, from population data available for 0–4-year-olds from the Wolfram Alpha computational knowledge engine for the specific location( 10 ). This number was multiplied by 1·125 to give a 54-month range (i.e. 54/48=1·125). This procedure was required for eight out of the twenty-four surveys where an estimate of the size of the population covered by the programme was not reported.
Statistical analysis, including scatter plots, linear regression and calculation of Pearson’s correlation coefficient to evaluate the linear relationship between the variables, was done using the R Language and Environment for Statistical Computing version 3.21 software( 11 ).
The regression model was estimated using a bootstrap procedure. Replicates were created by sampling the twenty-four observations with replacement and fitting an ordinary least squares linear regression model with the intercept fixed at zero (regression through the origin):
 $$\openup -3.5pt\eqalign{ &{\rm SAM}\,{\rm caseload}\,{\rm over}\,{\rm 5}\, {\rm months\,} \cr &\quad\quad{ {\equals}\,\beta }{\times}{\rm SAM}\,{\rm burden}\,{\rm estimated}\,{\rm from}\,{\rm prevalence,}$$
to each of 9999 replicates and recording the resulting slope (β) term. The obtained β coefficient represents the best estimate of (1+J)×C. The median of the distribution of the recorded β terms was used as the point estimate and the 2·5th and 97·5th percentiles were used as the lower and upper 95 % confidence limits, respectively. The bootstrap was used because of the small sample size (i.e. n 24) available.
Results
There was a statistically significant relationship between the number of SAM children estimated from prevalence surveys and the number of SAM cases admitted to SAM treatment services treating SAM cases over 5 months after the survey. The Pearson correlation coefficient was estimated to be r=0·48 (95 % CI 0·12, 0·72). The estimate for the slope β was 2·17 (95 % CI 1·33, 3·79). The scatter plot of case load against estimated burden (Fig. 1) shows a point for each data set represented by a letter denoting the respective region of origin, based on the UN Statistics Division geographical groupings( 12 ) of Central Africa (C) for Democratic Republic of the Congo; East Africa (E) for Burundi, Somalia and South Sudan; North Africa (N) for North Sudan; South-East Asia (S) for Myanmar; and West Africa (W) for Niger and Guinea.
Burden of severe acute malnutrition (SAM) cases estimated from prevalence data v. total SAM admissions in the first 5 months of the programme by region (C, Central Africa; E, East Africa; N, North Africa; S, South-East Asia; W, West Africa). Slope=2·17 (95 % CI 1·33, 3·79); intercept of the slope set at 0; Pearson’s r=0·48 (95 % CI 0·12, 0·72)
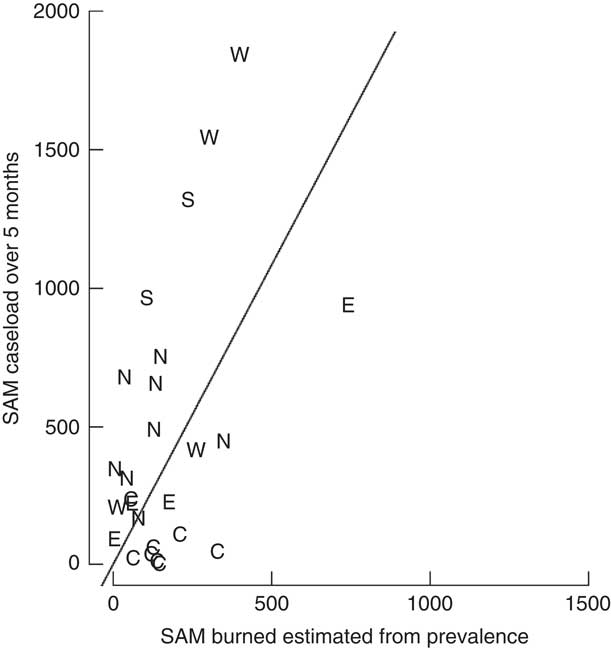
The estimated slope is an estimate of (1+J)×C. Assuming constant incidence and coverage of 100 %, we have: J=2·17−1=1·17 for a 5-month period. Standardized for 12 months, J=1·17×(12/5)=2·81.
Discussion
The results of the present study show a moderate positive correlation between the estimated numbers of SAM children based on prevalence surveys v. the numbers of children admitted into SAM treatment services that were opened or were operating at the time of the survey.
Assuming a coverage of 100 %, J was estimated at 2·81. This is higher than J=1·6 as suggested in the current guidelines( Reference Myatt 7 ).
The wide confidence interval for the coefficient for the slope β found in our study is in line with the results of studies aiming at estimating the average duration of SAM episodes in research settings, which have given highly variable estimates from a few weeks to several months( Reference Garenne, Willie and Maire 8 , Reference Isanaka, Grais and Briend 13 ). Duration of episodes is a determinant of the incidence conversion factor and thus high variation of duration implies large variations in the observed coefficient( Reference MacMahon and Pugh 6 , Reference Miettinen 14 ). There were also regional variations noted in our results when the slope was calculated by region, but the numbers of data sets from each region were too small to draw firm conclusions.
The present study has several limitations. First, the data used for the study only involve admissions into SAM treatment programmes within the first 5 months of the survey. We can only assume that the incidence for the first 5 months would be similar over the remaining months of the year.
Second, coverage data are lacking. We know that programme coverage is highly variable( Reference Rogers, Myatt and Woodhead 15 ). For our analysis, the estimated value of J was 2·81 for 1 year, assuming 100 % coverage. If we assume 38·3 % coverage, as reported by Rogers et al. as the mean level of estimated coverage of forty-four programmes from twenty-one countries( Reference Rogers, Myatt and Woodhead 15 ), the estimate of J becomes considerably higher.
For 5 months and 100 % coverage, we found (1+J)×C=2·17. Thus for 38·3 % coverage:
 $$1{\plus}J\,{\equals}\,2 \!\cdot\! 17/0 \!\cdot\! 383\,{\equals}\,5 \!\cdot\! 67.$$
Therefore:
 $$J\,{\equals}\,5 \!\cdot\! 67{\minus}1\,{\equals}\,4 \!\cdot\! 67.$$
Standardized for 12 months:
 $$J\,{\equals}\,4 \!\cdot\! 67{\times}(12/5)\,{\equals}\,11 \!\cdot\! 21.$$
It is plausible that J lies somewhere between these values, consistent with other studies. One study( Reference Deconinck, Pesonen and Hallarou 16 ) found a range for the incidence conversion factor J of 4·3–9·5 and another study( Reference Isanaka, O’Neal Boundy and Grais 17 ) found a pooled incidence conversion factor J of 4·82, with a wide range among the three African countries.
Third, the data for the present study dated from 2005–2009 during a time when many programme managers were still using WHM from the National Center for Health Statistics Growth Reference for admission criterion to SAM treatment programmes. It is difficult to assess the implications of the change to the WHO Growth Standards on the relationship between prevalence estimates and the number of treated children because, along with the change of reference, there was also the change from using WHM to the use of weight-for-height Z-scores (WHZ) and thus different children would have been selected( Reference Seal and Kerac 18 ).
Fourth, the estimation of the under-5 population might not be accurate due to the uncertainty of population data in many countries where recent census or accurate (e.g. due to population displacement) population data are lacking. Lastly, data cleaning criteria could have impacted our prevalence estimates. SMART software was used for over 60 % of the surveys. Since SMART flagging/censoring criteria are one of the least inclusive( Reference Crowe, Seal and Grijalva-Eternod 19 ) this may have led to SAM prevalence being underestimated by some surveys.
The principal limitation of the current guidance using estimates of the mean duration of SAM episodes based on the results of Garenne et al. (2009) is that the estimate for J was based on estimates of the average duration of SAM episodes made from data collected at 6-monthly intervals. One of the reported sub-studies used a 3-monthly interval. Using these data alone yielded a shorter estimate of the mean duration of SAM episodes( Reference Garenne, Willie and Maire 8 ). This suggests that the estimate of the mean duration of SAM episodes is overestimated and, therefore, J is overestimated. The results presented here will suffer from different biases from Garenne et al. (2009) because of methodological differences. The estimates for J will be influenced, in large part, by screening frequency and treatment-seeking delays in the programmes contributing data. Both factors are, to a considerable extent, under programme control. Sensitisation and mobilisation interventions including recent initiatives with mothers screening their own children and deciding admission using MUAC( Reference Alé, Phelan and Issa 20 ) may, therefore, affect (i.e. tend to increase) the value for J found and thus the value that will be most useful for predicting the caseload for a specific programme.
A final factor to consider is the interpretation of these results as related to the increasing use of MUAC of less than 115 mm as admission criterion to SAM treatment programmes. As there is a mismatch between MUAC and WHM/WHZ, this may weaken the link between prevalence and need estimates; thus it is necessary to use prevalence estimates based on MUAC for these programmes( 21 ). The value for J that was calculated in the present study was based on surveys and programmes using WHM as a case definition. The relationship between prevalence and incidence of SAM measured by MUAC might be different from that of SAM measured by WHM/WHZ, so the same type of studies should be repeated for MUAC-based surveys and programmes, and furthermore for surveys and programmes using a combination of WHM/WHZ and MUAC.
Conclusion
In conclusion, there is significant correlation between the estimated numbers of SAM children based on prevalence surveys v. the numbers of children admitted into SAM treatment services. This indicates that there is some validity in adapting the conversion factor J to account for new (incident cases) over a given period when applying the formula for estimating the number of cases expected to require treatment. The present study shows that the appropriate conversion factor may need to be higher than the one commonly used by health actors. The many limitations of the study, however, outline the need for further work to be done in this area. The study should be repeated in settings where programme coverage data are available and in places where admission to SAM treatment services is done based on MUAC. Both are increasingly common practices.
Acknowledgements
Acknowledgements: This study was started under the Health and Nutrition Tracking Service umbrella and the authors are grateful for the Service’s support. The authors would like to extend thanks to the non-governmental organisations which shared their data, and especially the nutrition and research staff of Action Contre la Faim, Action Against Hunger–USA and Action Contra la Hambre. Financial support: This study was supported by the Health and Nutrition Tracking Service. The Health and Nutrition Tracking Service was involved in the data collection and data cleaning portion of the study. Conflict of interest: All co-authors have seen and agree with the contents of the manuscript and there is no conflict of interest to report. Authorship: N.M.D. contributed to the conception and design, analysis and interpretation of data and drafting of the manuscript. M.M. participated in the design of the study, performed the data analysis and revised the manuscript critically for important intellectual content. C.P. and A.B. participated in the design of the study, analysis and interpretation of the data and revised the manuscript critically for important intellectual content. Ethics of human subject participation: Not applicable. All the analysis was done on routinely collected archive data in which information allowing identification of individual children was missing.

