


Introduction
The global wildlife trade threatens all phyla across the tree of life (Fukushima et al., Reference Fukushima, Mammola and Cardoso2020) by increasing extinction risks (Scheffers et al., Reference Scheffers, Oliveira, Lamb and Edwards2019). On average, species abundance declines by 62% where trade occurs (Morton et al., Reference Morton, Scheffers, Haugaasen and Edwards2021). The persistent removal of species from their native range impacts not only the target species but can often result in ecological cascades that lead to long-term changes in ecosystem functions (Hughes et al., Reference Hughes, Auliya, Altherr, Scheffers, Janssen and Nijman2023). More than 420 million individuals of wild-caught animals that were listed under CITES were traded globally during 1998–2018 (Liew et al., Reference Liew, Kho, Lim, Dingle, Bonebrake, Sung and Dudgeon2021) as pets, sources of sustenance, status symbols and medicine, and for many other purposes (Harfoot et al., Reference Harfoot, Glaser, Tittensor, Britten, McLardy, Malsch and Burgess2018; Fukushima et al., Reference Fukushima, Mammola and Cardoso2020; Andersson et al., Reference Andersson, Tilley, Lau, Dudgeon, Bonebrake and Dingle2021; Prasad et al., Reference Prasad, Rausser and Zilberman2022). This is likely driven by the highly lucrative nature of the legal wildlife trade (CITES-listed and non-listed species), which generates an estimated revenue of USD 220 billion per year (CITES, 2023). The value of the illegal wildlife trade, believed to be USD 7–23 billion per year (Nellemann et al., Reference Nellemann, Henriksen, Raxter, Ash and Mrema2014), may also be underestimated given the proliferation of online marketplaces and transactions via social media, where trade volumes can be difficult to monitor (Mozer & Prost, Reference Mozer and Prost2023; Sung & Fong, Reference Sung and Fong2018).
The legal status of the trade for any particular species may not reflect the long-term viability of harvesting wild populations (Hughes et al., Reference Hughes, Auliya, Altherr, Scheffers, Janssen and Nijman2023). For instance, the discovery of the Boesemani rainbowfish Melanotaenia boesemani, of Indonesia, and its subsequent popularity in the aquarium trade, led to unregulated, albeit legal, exploitation of the species (Allen & Cross, Reference Allen and Cross1980; Polhemus & Allen, Reference Polhemus and Allen2007). More than 60,000 males were caught and exported monthly, causing rapid declines in wild populations (Allen & Cross, Reference Allen and Cross1980; Allen, Reference Allen1995; Polhemus & Allen, Reference Polhemus and Allen2007). Although this species has since been categorized as Endangered on the IUCN Red List, and exports are now restricted to captive-bred individuals (Nugraha et al., Reference Nugraha, Pouyaud, Carman, Widyastuti, Junior and Avarre2015; Evers et al., Reference Evers, Pinnegar and Taylor2019), the significant damage caused by the trade is probably irreversible. The majority of traded plants and animals are not afforded legal protections under CITES (Hughes et al., Reference Hughes, Auliya, Altherr, Scheffers, Janssen and Nijman2023). This includes hundreds of species that are categorized as threatened on the IUCN Red List and > 95% of all described species awaiting assessment (IUCN, 2025). Consequently, knowledge gaps persist in the diversity and trends of the trade in unregulated and under-regulated species, which is often overlooked by large-scale studies that rely primarily on accessible databases such as those of CITES and IUCN (Fukushima et al., Reference Fukushima, Mammola and Cardoso2020), while underestimating the overall biodiversity impacts of wildlife trade (Hughes et al., Reference Hughes, Marshall and Strine2021).
Inadequacies in regulations for supply-side mitigation of wildlife trade impacts suggest there is a need to better understand the demand-side drivers of the wildlife market (Hinsley et al., Reference Hinsley, Veríssimo and Roberts2015; Evers et al., Reference Evers, Pinnegar and Taylor2019; Borges et al., Reference Borges, Oliveira and Alves2022). However, we currently lack comprehensive understanding of what drives demand in the exotic pet trade (Hausmann et al., Reference Hausmann, Cortés-Capano, Fraser and Di Minin2023), including trade in ornamental fish (Biondo & Burki, Reference Biondo and Burki2020; Millington et al., Reference Millington, Holmes and Balcombe2022). There is some evidence to suggest that price (Papavlasopoulou et al., Reference Papavlasopoulou, Vardakas, Perdikaris, Kommatas and Paschos2014), rarity and novelty underpin ownership of exotic pets (Lyons & Natusch, Reference Lyons and Natusch2013; Marshall et al., Reference Marshall, Strine and Hughes2020; Hughes et al., Reference Hughes, Marshall and Strine2021). Other factors such as relational dimensions (e.g companionship, ability to bond, attachment), rare aesthetic features, body size, colours or patterns (Borges et al., Reference Borges, Oliveira and Alves2022) are also often sought (Hausmann et al., Reference Hausmann, Cortés-Capano, Fraser and Di Minin2023).
Consumer preferences play a pivotal role in shaping the dynamics of wildlife trade, and understanding them helps identify groups that are more vulnerable to exploitation (Hinsley et al., Reference Hinsley, Veríssimo and Roberts2015, Reference Hinsley, Willis, Dent, Oyanedel, Kubo and Challender2023). In general, consumers in the ornamental wildlife trade fall into two major groups, serious hobbyists who actively seek rare and expensive species and mass-market buyers, both of whom have unique influences on market trends (Hinsley et al., Reference Hinsley, Veríssimo and Roberts2015). Overall, cheaper goods are more common in markets because they present lower barriers to entry, thus appealing to mass-market buyers (Varian, Reference Varian2014). On the other hand, species that are rare, wild-caught or novel, or individuals that are morphologically unusual (e.g. albinos), are more expensive and appeal primarily to serious hobbyists who are more willing to spend money on such fish (Hinsley et al., Reference Hinsley, Veríssimo and Roberts2015; Sung & Fong, Reference Sung and Fong2018; Marshall et al., Reference Marshall, Strine and Hughes2020; Hughes et al., Reference Hughes, Marshall and Strine2021). For the latter, the anthropogenic Allée effect (Courchamp et al., Reference Courchamp, Angulo, Rivalan, Hall, Signoret, Bull and Meinard2006; Holden & McDonald-Madden, Reference Holden and McDonald-Madden2017), in which the rarity of a species increases its demand, creates a feedback loop that may lead to extinction. This could also be the reason why species listed on CITES Appendices or categorized as threatened on the IUCN Red List are sometimes more expensive than others (Siriwat et al., Reference Siriwat, Nekaris and Nijman2019).
Fish are a good model system for understanding consumer preferences because they are the most highly traded group, with 15,374 species identified in the market (Fukushima et al., Reference Fukushima, Mammola and Cardoso2020), of which > 46% are traded within the ornamental market (Raghavan et al., Reference Raghavan, Dahanukar, Tlusty, Rhyne, Kumar, Molur and Rosser2013). The ornamental fish trade is also a growing sector, with an estimated market value of USD 6.36 billion in 2023, predicted to grow to USD 11.3 billion by 2030 (Grand View Research, 2023). Freshwater fishes dominate the ornamental fish trade market, comprising c. 5,300 species or 90% of the total trade volume (Evers et al., Reference Evers, Pinnegar and Taylor2019). Despite this, only a small fraction of freshwater fishes are protected by CITES regulations (CITES, 2023), leaving many vulnerable to unregulated exploitation. Gaining insights into the drivers of the market prices and prevalence of species is crucial for assessing conservation risks and informing more effective regulatory measures.
Here, we focus on the freshwater ornamental fish trade to identify patterns that could be generalizable to the wider wildlife trade. To do this, we conducted weekly quantitative market surveys in ornamental fish shops in Hong Kong over a 3-month period. Hong Kong is one of the largest wildlife trading hubs (ADMCF, 2018; Hatten et al., Reference Hatten, Whitfort, Baker and Dingle2020; Andersson et al., Reference Andersson, Tilley, Lau, Dudgeon, Bonebrake and Dingle2021) and a major importer of ornamental fish, with a market value of USD 19.3 million in 2014 (Evers et al., Reference Evers, Pinnegar and Taylor2019). During 2007–2016, imports of exotic pets into Hong Kong increased nine-fold (ADMCF, 2018). Although ornamental fish are widely traded across Hong Kong, the so-called Goldfish Street in Mong Kok has been the largest conglomeration of pet fish stores since the 1990s (Han et al., Reference Han, Lai and Fan2002) and is likely a microcosm of the wider Hong Kong ornamental fish market. We undertook a comprehensive survey of Goldfish Street by building an inventory of freshwater fish species present in the market and their respective retail prices (when available), supplementing this with information about native ranges and IUCN Red List category. We used these to assess market trends (e.g. species popularity) and potential predictors of these trends with random forest machine-learning analysis and linear regression. We then determined if there are price premiums on species considered threatened.
Methods
Market surveys
Surveys were conducted weekly on Sundays in Goldfish Street (Tung Choi Street, Mong Kok, Hong Kong) from 27 November 2022 to 26 February 2023 (14 surveys in total). To establish a comprehensive baseline of the market’s species diversity, an initial market-wide survey encompassing all 34 ground-level shops was conducted. During this survey we recorded the name of each species (as labelled in the store) and the corresponding price per individual. Where shops displayed multiple morphs and variants of the same species, for example the guppy Poecilia reticulata, we recorded the species name only once, to avoid duplication. Following the market-wide survey, we selected 10 shops for repeat surveys, selected based on the diversity of species being sold and because they collectively accounted for > 90% of the total species diversity observed. This approach ensured that the repeated surveys were representative of overall market trends while focusing on a manageable subset of shops.
Species identification
After each survey, we matched the labelled name recorded from the market to a scientific name. Labelled names were mostly written in traditional or simplified Chinese (e.g. 朱古力娃娃), so we first matched fishes to established species names by cross-checking against local books, online databases, websites and other published documents (Mohsin, Reference Mohsin2022). In cases where a common name could not be found in these sources, we referred to local aquarium websites and online retailers that linked Chinese common names to scientific names. All species names were then verified following Fricke et al. (Reference Fricke, Eschmeyer and van der Laan2023). In cases where there were discrepancies between sources for species that could not be confidently identified, the observations were omitted from subsequent analyses.
Some labelled names, particularly those that combined genus identity with unique trade identifiers, potentially referred to undescribed species (e.g. Channa sp. ‘mimetic pulchra’). In these instances, we recorded the species in our database by genus, followed by the unique identifier provided in the original source we used to identify the species. For species of the families Loricariidae and Callichthyidae, in which some species were identified by codes (e.g. Panaqolus sp. L397), our primary source of information was Novák et al. (Reference Novák, Hofmann, Hohl, Magalhães and Patoka2022), supplemented by PlanetCatfish (2018) and CorydorasWorld (2018). Such databases provide the most comprehensive coverage of trade names, common names and hobbyist-recognized variants, which may include potentially undescribed species (Novák et al., Reference Novák, Hofmann, Hohl, Magalhães and Patoka2022) not found in Fricke et al. (Reference Fricke, Eschmeyer and van der Laan2023).
Classification of species based on conservation status
For each species, we collated data on their IUCN Red List status at the time of data collection and again in 2025, to identify changes in the updated assessment (IUCN, 2023, 2025; accessed in February 2023 and 2025). Species that were identified to genus, with only unique trade identifiers in place of species information, were collectively classified as ‘potentially undescribed’. Despite the lack of formal scientific descriptions, many of the potentially undescribed species are consistently recognized as distinct entities within the ornamental fish trade, where unique and stable trade names such as L-number serve as de facto species identities (Novák et al., Reference Novák, Hofmann, Hohl, Magalhães and Patoka2022). The inclusion of potentially undescribed species in subsequent analyses reflects the reality of the ornamental freshwater fish market, in which species are traded independently of their taxonomic status.
We also recorded the native geographical range of each species, but this does not consistently reflect the origin of individuals traded within the stores we surveyed. For scientifically described species assessed by IUCN, we collated information about native ranges from the IUCN Red List. For species not assessed by IUCN, we obtained origin data from Fricke et al. (Reference Fricke, Eschmeyer and van der Laan2023), and the native ranges of undescribed Loricariids and Callichthyids with unique identifiers were inferred from PlanetCatfish (2018) and CorydorasWorld (2018). Other undescribed taxa were matched to native ranges using the sources that indicated they are potentially undescribed (see Remarks column in Supplementary Material 1).
Statistical analyses
To assess whether our surveys had reached market saturation, we generated species accumulation curves using the specaccum and plot functions in the vegan package (Oksanen et al., Reference Oksanen, Blanchet, Kindt, Legendre, Minchin and O’Hara2013) in R 4.5.1 (R Core Team, 2020). These curves were used to assess the cumulative number of species recorded over the course of the survey. Subsequently, we extrapolated the species richness upon achieving saturation using the specpool function in vegan. We obtained our final projected number of species by using the averaged estimates from the four models in specpool (Chao, first order jackknife, second order jackknife and bootstrap; Burnham & Overton, Reference Burnham and Overton1978; Chao, Reference Chao1984; Efron, Reference Efron, Kotz and Johnson1992). This was conducted in two parts: firstly, with all fish species, including those that have yet to be formally described; and secondly, with described species only, to obtain a more conservative estimate of species diversity in the market. We removed one shop from the analysis as it was closed on two separate occasions during our market surveys (all species recorded from this shop were also represented in other shops in subsequent surveys, and consequently the total number of species in the market remained unchanged).
We quantified a species’ market occurrence by using its frequency of occurrence per shop per survey. Therefore, if a fish species was observed in multiple tanks of a single shop during a single survey, market occurrence of the species was counted once. This minimizes the effects of inflation of occurrence by shops that specialize in selling different variants of the same species of fish.
We had multiple price variables for each fish species: average price throughout the survey, minimum price (the lowest available price of a species in the market), maximum price (the maximum available price of a species in the market), price range (the difference between maximum and minimum price), and price change (price difference between the first and last occurrence of a species). These price variables were derived from the data collected from shop labels. Using all the price variables, IUCN status and native origin, we examined the importance of each variable in explaining fish occurrences using random forest analysis with the package ranger (Wright & Ziegler, Reference Wright and Ziegler2017). The model was trained to predict the occurrence of species from our variables, with the default settings of 10,000 trees and permutation importance. We modelled the most representative price variable, IUCN status and native origin from random forest analysis (minimum price) with market occurrence using a generalized linear model with negative binomial error distribution with a log link, using the glm.nb function in the R package MASS (Venables & Ripley, Reference Venables and Ripley2002). We chose a negative binomial distribution because the occurrence data are counts (positively skewed), but were overdispersed for a Poisson distribution (Ver Hoef & Boveng, Reference Ver Hoef and Boveng2007). The negative binomial distribution incorporates a dispersion parameter, to account for excess variance in our data (Ver Hoef & Boveng, Reference Ver Hoef and Boveng2007).
We assessed price variability between IUCN categories using the mean price of each species, calculated from all price records collected during the survey period. The mean prices were natural-log transformed to reduce skewness. We tested the homogeneity of variances of the log-transformed prices using Leven’s test and Bartlett’s test from the R packages car and stats, respectively (Fox & Weisberg, Reference Fox and Weisberg2018; R Core Team, 2020). We tested for normality of the log-transformed species’ mean prices with the Shapiro–Wilk test using the function shapiro.test in R package stats (R Core Team, 2020). The data were not normally distributed, so we investigated whether log mean price varied significantly between categories with the non-parametric Kruskal–Wallis test using the function kruskal.test in R package stats (R Core Team, 2020). The differences between groups were further tested with the post-hoc Dunn’s test using the function dunnTest in R package FSA.
Results
We recorded a total of 11,369 occurrences (where an occurrence is of one species in one shop in a survey) comprising 540 freshwater fish species of 73 families (Supplementary Fig. 1). Species richness approached saturation by the 14th survey (Supplementary Fig. 2). The extrapolated total species richness in the market was 585 species (i.e. average output from Chao, first order jackknife, second order jackknife and bootstrap models), or 476 with a more conservative approach that included only the 453 formally described species from our surveys.
Among the 73 families observed, Loricariidae, Charicidae, Cichlidae, Callichthyidae and Cyprinidae (in descending order) dominated the market in terms of number of species. Other families were represented more sporadically. Fifty-nine families were represented by five or less species, and 32 families by only one species. Of the 540 species recorded, at the time of the surveys, 454 species were scientifically described and 86 were undescribed (the latter were mostly Loricariidae and Callichthyidae). Two taxa (Amphilophus citrinellus × Vieja melanurus and A. citrinellus × Paraneetroplus synspilus) were hybrids. Of the 454 described species, 186 had not been evaluated for IUCN Red List, 177 were categorized as Least Concern, 18 as Near Threatened, 19 as Vulnerable, 20 as Endangered, eight as Critically Endangered and 26 as Data Deficient (Supplementary Material 1). Species categorized as Data Deficient or not evaluated accounted for 38% of all described species.
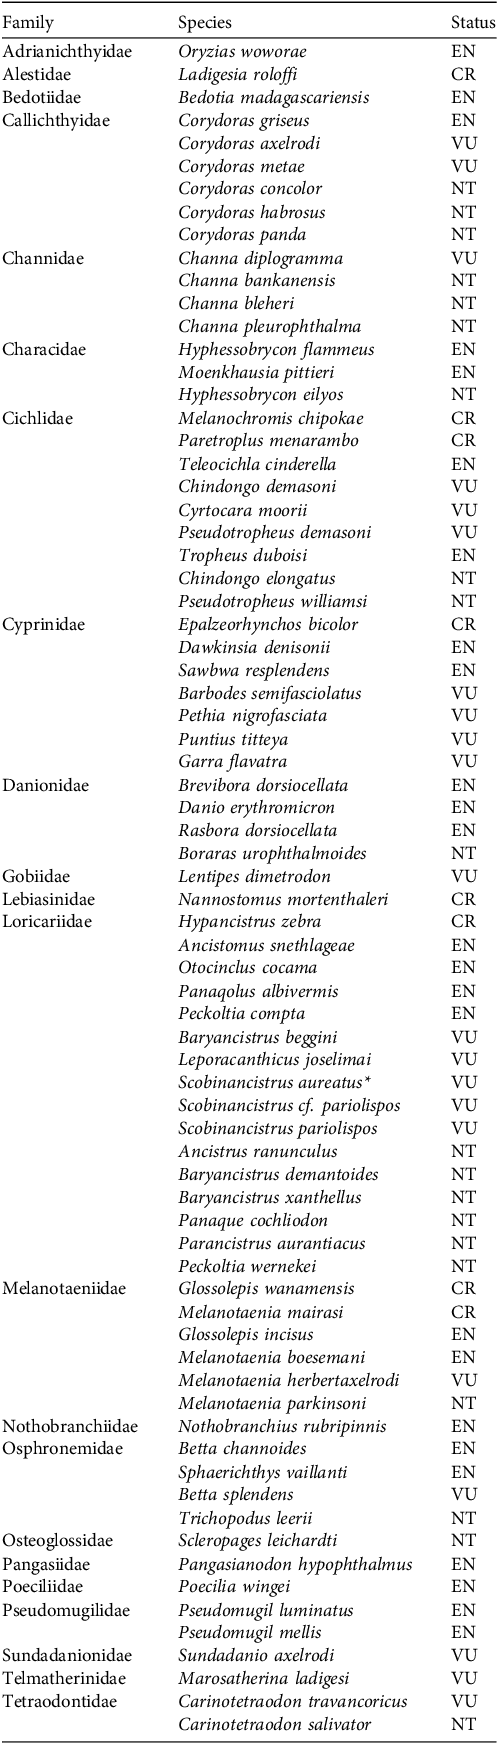
Most species and families in the trade were native to South America and Southeast Asia (78.5%; Fig. 1). With respect to native range, the highest per cent of species not evaluated (56.9%) and undescribed (14.5%) were from South America, largely Characidae and Loricariidae, respectively. Only 13 species (2%) were native to East Asia, including four species native to Hong Kong: Chinese barb Barbodes semifasciolatus, blue neon goby Stiphodon atropurpureus, Hong Kong paradise fish Macropodus hongkongensis, and fork-tailed paradise fish Macropodus opercularis (Chan et al., Reference Chan, Tsang, Yau, Hui, Lau, Tan, Low, Dudgeon and Liew2023). In the 2025 update of the IUCN Red List, 155 additional fish species were evaluated, and the total number of threatened fish species increased from 65 to 74 (Table 1).
Number of species of freshwater fish by IUCN Red List category (IUCN, 2025: CR, Critically Endangered; EN, Endangered; VU, Vulnerable; NT, Near Threatened; LC, Least Concern; DD, Data Deficient; NE, Not Evaluated; UN refers to unidentified species), and by continent/subcontinent of their native range, recorded in the ornamental freshwater fish market in Hong Kong during 2022–2023 (see text for details). Note the differing y-axis scales.

Fish species recorded in the ornamental freshwater fish market in Hong Kong during 2022–2023 that are categorized as Critically Endangered (CR), Endangered (EN), Vulnerable (VU) or Near Threatened (NT) on the IUCN Red List of Threatened Species (2025), by family.

Market trends
Using a random forest machine-learning approach, we found that minimum retail price was the most useful predictor of market occurrence (Supplementary Fig. 3). Using linear regression, we found that lower-priced species were more likely to be traded (estimate = −0.0010, 95% CI −0.0014–−0.0007, P < 0.001). Other price-related predictors (average price, price range, maximum price and price change) were more useful in explaining patterns in species occurrence than non-price-related variables (IUCN Red List category, family and native origin; Fig. 1).
By assessing each species’ placement along the market occurrence–price gradient, the lower priced end of the market was dominated by the black tetra Gymnocorybus ternetzi and zebra fish Danio rerio, which were the most frequently occurring species in our survey. Both are among the cheapest in the market, with minimum prices of USD 0.8 and 1.3, respectively (Fig. 2). Other frequently occurring species were the cardinal tetra Paracheirodon axelrodi, Denison barb Dawkinsia denisonii and guppy Poecilia reticulata, with minimum prices of USD 0.38, 3.06 and 1.02 respectively. The higher priced end of the market was dominated by species of Loricariidae, which were recorded less frequently than most other fishes, with a mean market occurrence of 9.8, compared to the overall mean of 16.2.
Visualization of the market occurrence–price gradient of ornamental freshwater fish species recorded in the Hong Kong freshwater fish market. Market occurrence is the frequency of a species’ occurrence per shop per survey, and price gradient is the minimum recorded price for each species. Prices are in Hong Kong dollars (1 HKD = 0.13 USD). Each point represents one species, categorized by IUCN Red List status or as undescribed. The curve is the best fit correlation between market occurrence and minimum price, and the shaded region the 95% CI (see text for details). We highlight notable species: the two most frequently occurring species in the common/cheap segment of the market (black tetra Gymnocorybus ternetzi and zebra fish Danio rerio, both categorized as Least Concern on the IUCN Red List), and six described/undescribed members of the family Loricariidae in the rare/expensive segment of the market [in parentheses].

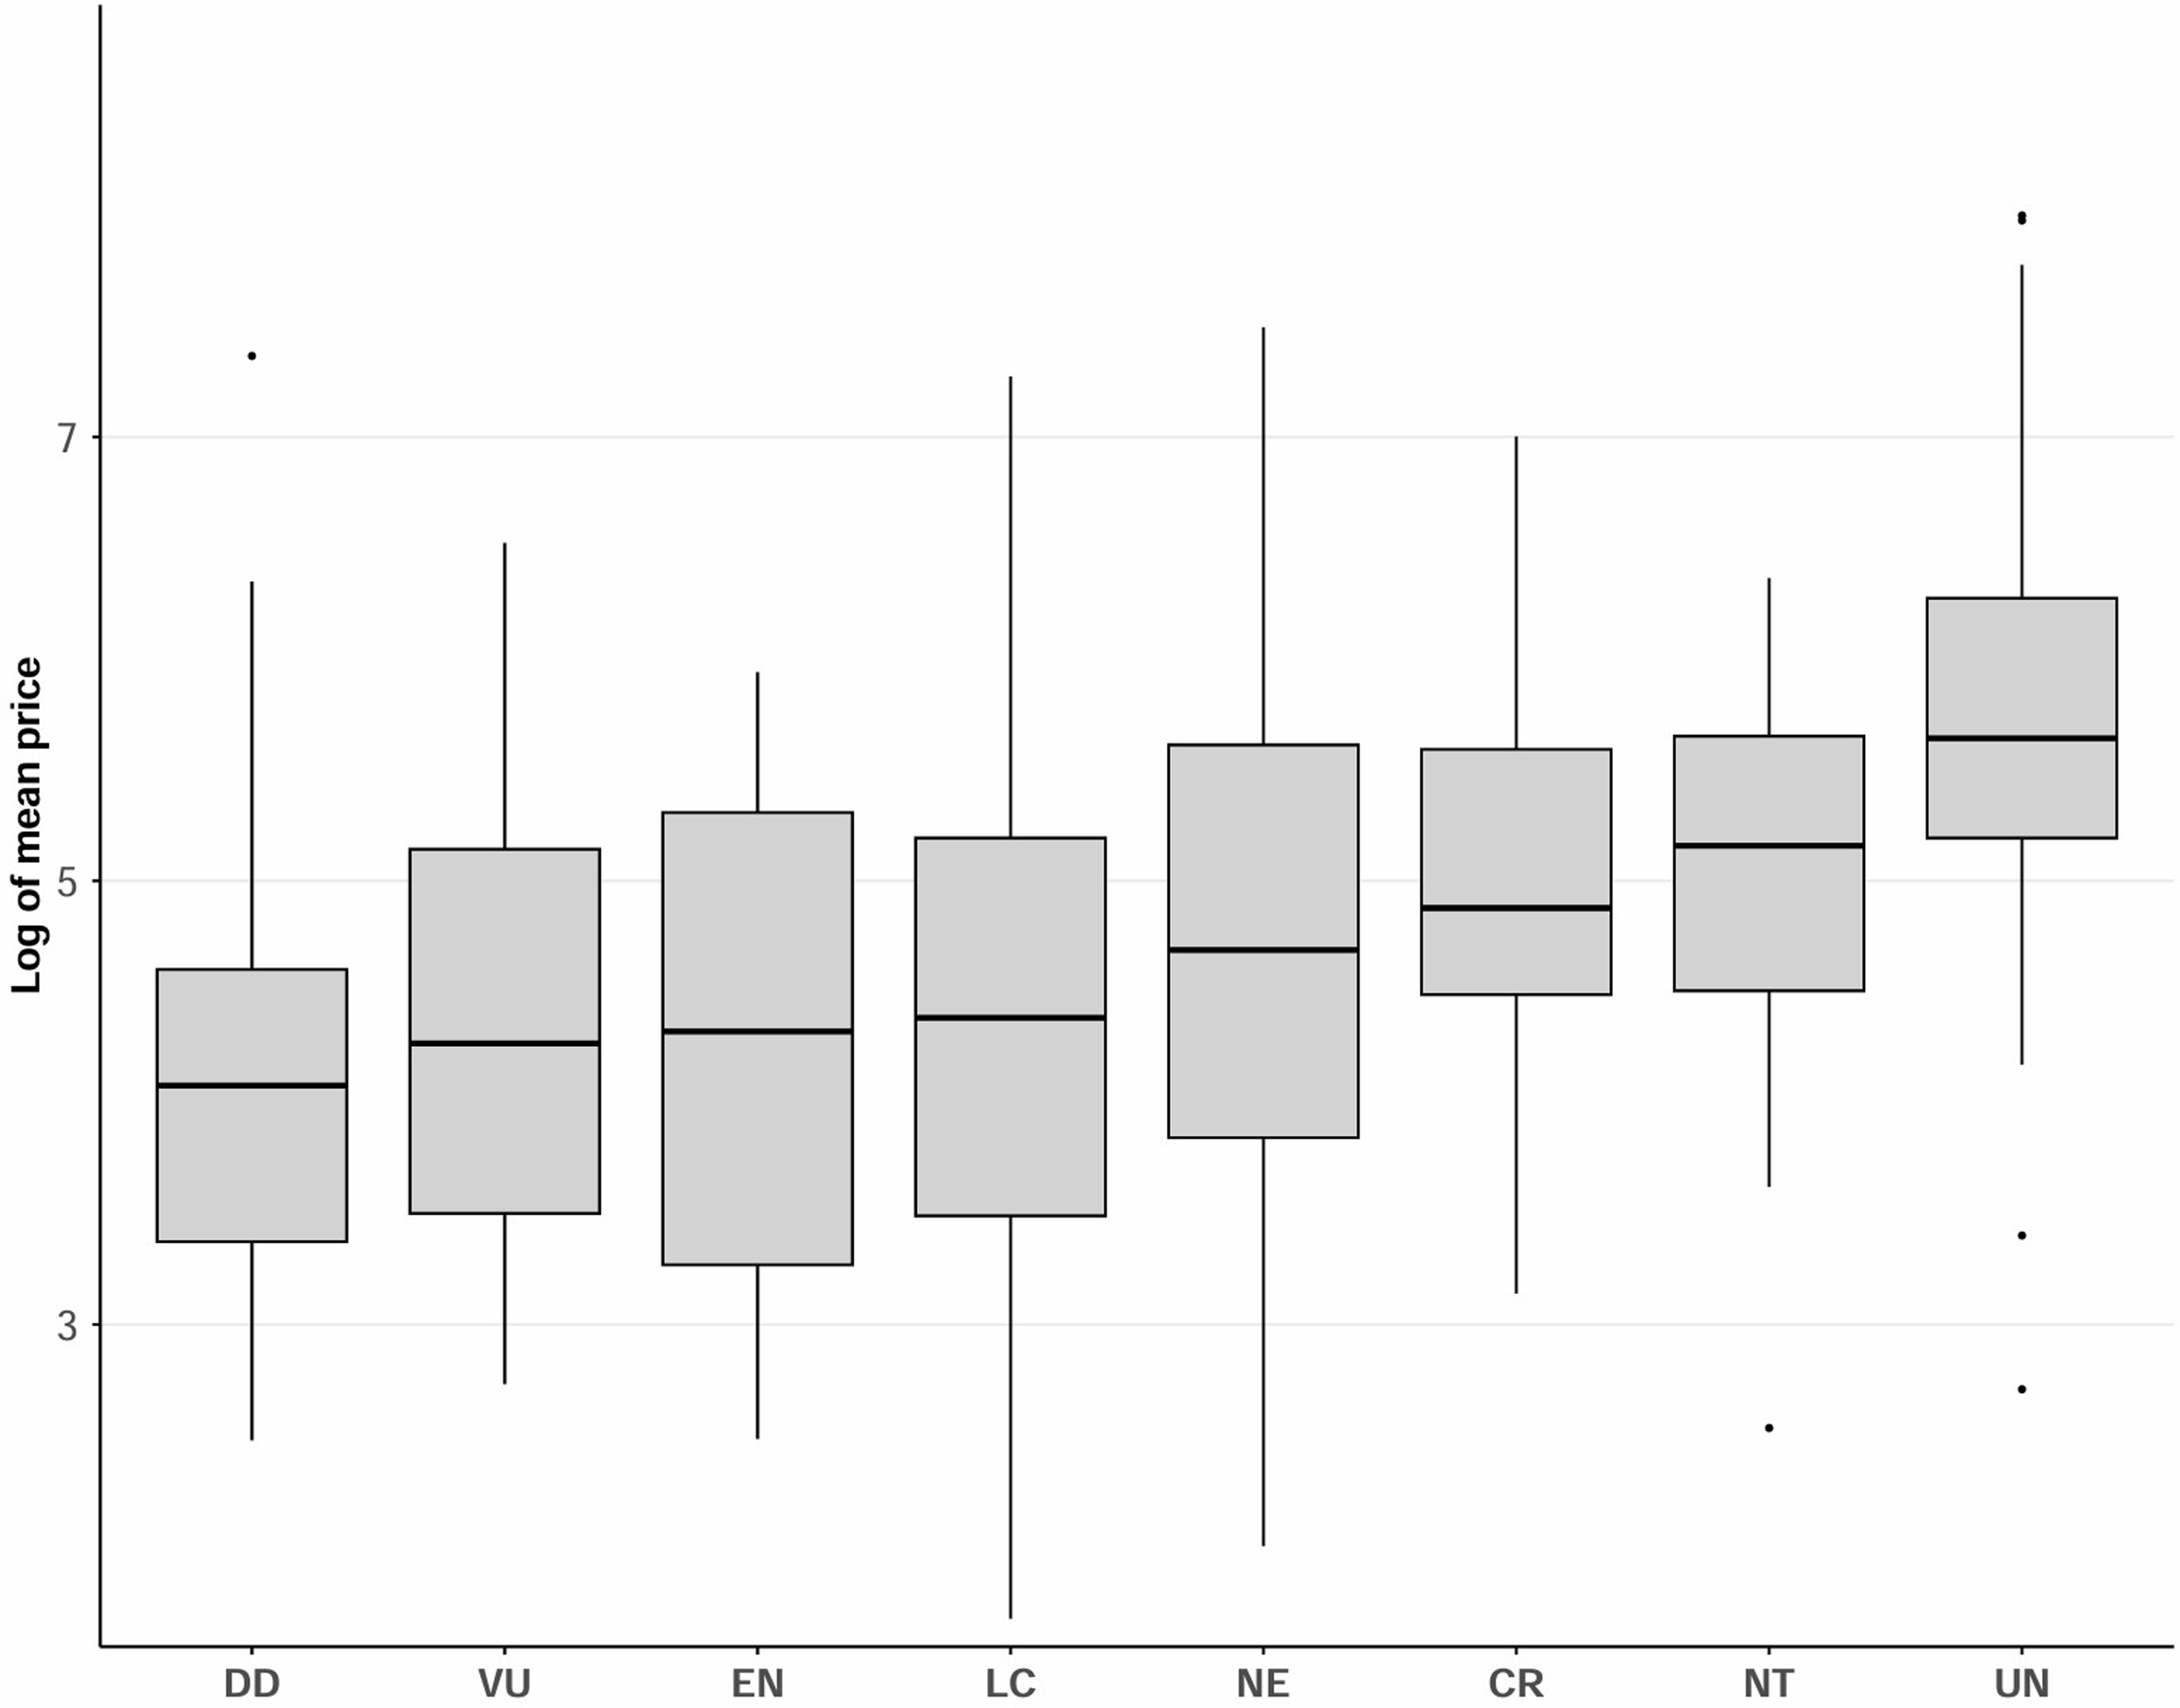
Investigating the relationship between conservation status and retail price using the Kruskal–Wallis test followed by the post-hoc Dunn’s test, we found that undescribed species were priced significantly higher than Least Concern (Z = −7.00, P < 0.001, Bonferroni-adjusted), Vulnerable (Z = 3.80, P = 0.001, Bonferroni-adjusted), Endangered (Z = −3.91, P < 0.001, Bonferroni-adjusted), Data Deficient (Z = −4.62.00, P < 0.001, Bonferroni-adjusted) and not evaluated species (Z = −5.48, P < 0.001, Bonferroni-adjusted; Fig. 3).
The log-transformed mean price of ornamental fish species in the Hong Kong ornamental fish market, by IUCN Red List category (CR, Critically Endangered; EN, Endangered; VU, Vulnerable; NT, Near Threatened; LC, Least Concern; DD, Data Deficient; NE, Not Evaluated), and for undescribed (UN) species, ordered from low to high mean price. Boxes show the interquartile range, with the horizontal line indicating the median; whiskers extend to the most extreme values within 1.5 × interquartile range; points beyond the whiskers indicate outliers. Undescribed species had significantly higher prices than species that were Least Concern, Vulnerable, Endangered, Data Deficient and Not Evaluated (see text for details).

Discussion
This study is a snapshot of the species diversity and market trends of freshwater ornamental fishes for sale in Hong Kong’s ornamental fish trade. The strong correlation between species occurrence/rarity and price is similar to that in other commodity markets. Species at the common/cheap end of the market appeal to mass-market consumers. Species at the expensive/rare end of the market, including many potentially undescribed species, appeal to serious hobbyists. The unprecedented diversity of fishes found in our surveys (relative to historical surveys and surveys from other regions) highlights the wide variety of freshwater fishes the ornamental freshwater fish industry exploits. Many species in the Hong Kong market are yet to be evaluated for the IUCN Red List, indicating significant gaps in our knowledge of these species. Our findings highlight the urgent need for information about the taxonomic and conservation status of the species present in the ornamental fish trade. Such information is essential to establishing a baseline for understanding the impacts of the ornamental fish trade.
The species diversity we recorded was a notable increase compared to the 167 freshwater species from 50 families recorded in trade in 2012–2013 in Hong Kong (Ho, Reference Ho2013), and greater than the 326 freshwater and marine species from 64 families recorded in a year-long survey of multiple ornamental fish stores in Greece (Papavlasopoulou et al., Reference Papavlasopoulou, Vardakas, Perdikaris, Kommatas and Paschos2014). Nevertheless, the dominant fish families we recorded were largely similar to those in the 2012–2013 market surveys in Hong Kong, in which Cyprinidae and Cichlidae, Osphronemidae, Poecilidae and Characidae (in descending order) dominated the trade (Ho, Reference Ho2013). However, although our estimate of the number of species traded exceeds those of previous comparable surveys, it is likely to be an underestimate of the overall species richness in the market because we omitted a small subset of shops that were too logistically challenging to survey consistently because of unpredictable opening hours and lack of accessibility. These included shops specializing in cichlids, armoured catfish and corydoras.
The position of a species on the market occurrence–minimum retail price gradient (Fig. 2) could be indicative of whether it appeals to mass-market consumers (common/cheap) or serious hobbyists (rare/expensive). At the common/cheap end of the market appealing to mass-market consumers, species such as the black tetra, zebra fish and guppy are captive bred at scale (Muir, Reference Muir2004). The guppy, one of the most commonly traded species globally in volume and sales value (Dey, Reference Dey2016), was ranked third most common in our study. Species in this segment of the market are therefore usually of lower conservation concern. However, many species at the rare/expensive end of the market, such as the Loricariids, are potentially wild-caught (Novák et al., Reference Novák, Hofmann, Hohl, Magalhães and Patoka2022). These rare/expensive species appeal to serious hobbyists, who may make purchases motivated by a species’ novelty and/or rarity (Hinsley et al., Reference Hinsley, Veríssimo and Roberts2015). In some exotic pet markets, CITES and IUCN Red List status confers price premiums, with species of conservation concern often more expensive (Siriwat et al., Reference Siriwat, Nekaris and Nijman2019). A similar situation could apply to the undescribed species in the rare/expensive segment of Hong Kong’s ornamental fish market, with undescribed species priced significantly higher than fishes in almost all other categories. This aligns with similar observations in other wildlife markets such as the reptile and amphibian trade (Marshall et al., Reference Marshall, Strine and Hughes2020; Hughes et al., Reference Hughes, Marshall and Strine2021). These species could be influenced by the anthropogenic Allée effect, in which their novelty/rarity exacerbates exploitation because of an increase in demand (Courchamp et al., Reference Courchamp, Angulo, Rivalan, Hall, Signoret, Bull and Meinard2006).
The trade of species that lack formal descriptions or conservation assessments is of conservation concern (Hughes et al., Reference Hughes, Auliya, Altherr, Scheffers, Janssen and Nijman2023). This includes the 86 undescribed species in this study that were mostly associated with unique morphologies or new source locations, or are potentially new, undescribed species (Lujan et al., Reference Lujan, Cramer, Covain, Fisch-Muller and López-Fernández2017; Novák et al., Reference Novák, Hofmann, Hohl, Magalhães and Patoka2022). Without reliable information on their taxonomy or population status, these species may be vulnerable to overexploitation before conservation measures can be implemented (Hughes et al., Reference Hughes, Auliya, Altherr, Scheffers, Janssen and Nijman2023), particularly in speciose groups with hidden diversity such as Loricariidae and Callichthyidae (Lujan et al., Reference Lujan, Cramer, Covain, Fisch-Muller and López-Fernández2017). Newly imported species that are scientifically unidentified are given code names; each code usually represents a unique morphological form or locality of a species, and potentially represents an undescribed species (Novák et al., Reference Novák, Hofmann, Hohl, Magalhães and Patoka2022). A newly discovered species of pencil fish, known as Nannostomus sp. ‘Super Red Cenepa’ (Schäfer, Reference Schäfer2022), was first sold in Hong Kong pet stores within 1 month of the announcement of its discovery (Schäfer, Reference Schäfer2022). Other examples of widely traded but poorly known groups include the snakeheads (Channa spp.), for which exports of wild-caught populations to major markets such as Hong Kong have increased six-fold from 2014 to 2019 (Harrington et al., Reference Harrington, Mookerjee, Kalita, Saikia, Macdonald and D’Cruze2022). However, a plausible alternative explanation for the occurrence of many undescribed fish species, aside from taxonomic uncertainty, is the inability of fish collectors/exporters to identify some of the described fish species (Msukwa et al., Reference Msukwa, Cowx and Harvey2022; Msukwa & Jere, Reference Msukwa and Jere2025). This may have resulted in the creation of temporary names, as for many of the cichlids of the African Great Lakes (Msukwa et al., Reference Msukwa, Cowx and Harvey2022).
We recorded several species of conservation concern that are known to be threatened (Table 1). For example, the Denison barb Dawkinsia denisonii from the Western Ghats of India had the fifth highest occurrence. The species was first traded in 1996, but its popularity in the ornamental fish market led to overexploitation in its native range (Jain et al., Reference Jain, Mercy and Jain2022). Consequently, it was categorized as Vulnerable in 2009 and as Endangered in 2015 (Ali et al., Reference Ali, Raghavan and Dahanukar2015). Other examples of threatened species we recorded in the Hong Kong market include the wild zebra pleco Hypancistrus zebra and the Boesemani rainbowfish, both of which are threatened by overexploitation in their native range (Evers et al., Reference Evers, Pinnegar and Taylor2019). Many of the 74 threatened and Near Threatened species we recorded are potentially facing similar threats from overexploitation.
Most fishes (78.5%) we recorded originate from the tropics, where there is a rich diversity of freshwater fishes, in particular in Brazil (Schaefer et al., Reference Schaefer2003) and Southeast Asia (Evers et al., Reference Evers, Pinnegar and Taylor2019). Brazil and Singapore are among the largest exporters of freshwater ornamental fish (de Araújo et al., Reference de Araújo, dos Santos, Rebello, Prang, de Almeida and Isaac2020). The number of freshwater fish from Africa is likely underestimated given the high diversity of species exported from the continent (Msukwa et al., Reference Msukwa, Cowx and Harvey2022). We could not confirm the origin of individual fish in the Hong Kong market, and they could have been sourced from captive breeding facilities outside their native range. Although, by volume, 90% of freshwater species are captive-bred (Raghavan et al., Reference Raghavan, Dahanukar, Tlusty, Rhyne, Kumar, Molur and Rosser2013), c. 10% are believed to be wild-caught, encompassing a wide variety of species (Raghavan et al., Reference Raghavan, Dahanukar, Tlusty, Rhyne, Kumar, Molur and Rosser2013). Details concerning the source stock of animals in the trade are disclosed on CITES databases, but only a small proportion of freshwater species are covered by the Convention (CITES, 2023). These are primarily large charismatic species such as stingrays, sturgeons and paddlefish (CITES, 2023). The only confirmed record of a CITES-listed species in our market survey was the Asian arowana Scleropages formosus, with retail prices of USD 231–5,104.
Information about whether fishes sold in the shops were wild-caught was often unavailable, but several of the species we recorded are likely to have originated from local wild populations. For example, the Hong Kong paradise fish Macropodus hongkongensis is sparsely distributed in Hong Kong and Guangdong and Hainan Provinces in south China (Zhang et al., Reference Zhang, Li, Li, Dong, Wang, Chen and Shen2023), and although there is no direct evidence that individuals in the market are wild-caught, the species was historically sourced from the wild (Chan, Reference Chan2002). In addition, many diadromous fishes, such as species of the subfamily Sicydiinae, cannot be captive-bred because they need to migrate between freshwater and saltwater environments to complete their life cycle. Therefore, the nine Sicydiine goby species we observed for sale were almost certainly wild-caught. This includes the cyclops goby Lentipes dimetrodon, native to Indonesia and categorized as Vulnerable (Kolkolo et al., Reference Kolkolo, Larson, Ebner and Mungkaje2020). We recorded this species just once, from a single shop at the beginning of our survey, potentially indicating a high turnover rate and low supply.
Despite the obvious impacts on biodiversity, the ornamental fish trade still divides opinions because of potential contributions to local economies (Watson & Moreau, Reference Watson and Moreau2006). When well-managed, the ornamental fish trade can support local communities by creating job opportunities and incentivizing environmental stewardship (Tlusty, Reference Tlusty2002; Watson & Moreau, Reference Watson and Moreau2006; Raghavan et al., Reference Raghavan, Dahanukar, Tlusty, Rhyne, Kumar, Molur and Rosser2013; Evers et al., Reference Evers, Pinnegar and Taylor2019). The presence of wild-caught specimens in the trade has also facilitated the documentation of the life-history traits of rare or understudied species (Maceda-Veiga et al., Reference Maceda-Veiga, Domínguez-Domínguez, Escribano-Alacid and Lyons2016). Hobbyists who purchase these specimens occasionally publish their observational and experimental findings on fish behaviour, ecology and biology (Maceda-Veiga et al., Reference Maceda-Veiga, Domínguez-Domínguez, Escribano-Alacid and Lyons2016), contributing to captive breeding. Successful commercial breeding could also play a role in breaking the feedback loop of the anthropogenic Allée effect (Brook & Sodhi, Reference Brook and Sodhi2006; Teletchea, Reference Teletchea2016). Nevertheless, these potential positive contributions to conservation are greatly overshadowed by the negative impacts of trade, in which most species are at risk as a result of exploitation (Kulabtong et al., Reference Kulabtong, Suksri, Nonpayom and Soonthornkit2014).
We recommend that the scope of CITES should be expanded to include a broader range of threatened freshwater fishes, particularly threatened species that are sourced from wild populations, and exporters should be obliged to adopt an organized coding system that includes species name, source (wild-caught or captive-bred), source of collection and name of collector (Gerson et al., Reference Gerson, Cudmore, Mandrak, Coote, Farr and Baillargeon2008; Raghavan et al., Reference Raghavan, Dahanukar, Tlusty, Rhyne, Kumar, Molur and Rosser2013). Importers should be obliged to adopt mandatory origin labelling, requiring traders to disclose whether species are wild-caught or captive-bred. As an international trading hub, Hong Kong is well placed to take a leading role in implementing stricter regulations in wildlife trade (Ho et al., Reference Ho, Sung and Kark2025) such as implementing origin disclosure laws and providing incentives for the trade of sustainably sourced and captive-bred species.
Author contributions
Study design: SCLH, JCFC, JHL, YHS; fieldwork: SCLH, WHL; data analysis: SCLH, JHL; writing: SCLH, JCFC, YHS, JHL.
Acknowledgements
We acknowledge the Biodiversity Research Group and Freshwater Collective for their support throughout the study.
Conflicts of interest
None.
Ethical standards
This research abided by the Oryx guidelines on ethical standards. All species-related information used in this study was freely accessible online. Data on species offered for sale and their corresponding prices were also publicly available as consumer information in the form of labels on fish tanks. We did not interact directly with sellers during data collection (data were collected solely through observation).
Data availability
Primary data generated and analysed in this study are available in the Supplementary Material. All other data are available from the corresponding author on reasonable request.
Supplementary material
The supplementary material for this article is available at doi.org/10.1017/S0030605325102354




 Open access

