





1. Introduction
As a specific form of sediment transport, bedload transport describes the movement of relatively coarse particles adjacent to the surface of the streambed under different motions of rolling, sliding and saltation. Due to the near-bed turbulence, complex fluid–particle interactions and particle–bed collisions, bedload particle motions are inherently stochastic (Furbish et al. Reference Furbish, Haff, Roseberry and Schmeeckle2012a; Ancey Reference Ancey2020), with the probability theory serving as a basic tool for insightful investigations. The probability description of bedload transport has since inspired intense and ever-growing research interest, stemming from the pioneering work of Einstein (Reference Einstein1936, Reference Einstein1942, Reference Einstein1950) and Kalinske (Reference Kalinske1947). The statistical characteristics of the entrainment, motions and deposition of bedload particles, and more specifically the probability density functions (p.d.f.s) of velocities, accelerations, travel times, hop distances and resting times are fundamental and of great importance to various applications in the fields of geology, hydraulics and environmental sciences (Chien & Wan Reference Chien and Wan1999).
Laboratory experiments are direct and the most important means of collecting statistics for bedload particle motions. Different research groups around the world have performed high-resolution experiments over the past decades. Important results were obtained under different flow and sediment transport conditions. Regarding the p.d.f. of the streamwise velocities of bedload particles, for example, the exponential-like distributions were observed under subcritical flow conditions (Froude number  ${Fr}<1$) (Lajeunesse, Malverti & Charru Reference Lajeunesse, Malverti and Charru2010; Roseberry, Schmeeckle & Furbish Reference Roseberry, Schmeeckle and Furbish2012; Fathel, Furbish & Schmeeckle Reference Fathel, Furbish and Schmeeckle2015; Liu, Pelosi & Guala Reference Liu, Pelosi and Guala2019), while the Gaussian-like distributions were reported for supercritical flow conditions ( ${Fr}>1$) (Martin, Jerolmack & Schumer Reference Martin, Jerolmack and Schumer2012; Ancey & Heyman Reference Ancey and Heyman2014; Heyman, Bohorquez & Ancey Reference Heyman, Bohorquez and Ancey2016). This difference in the literature for the form of the velocity distribution was further investigated and explained by the two-regime scaling of the hop distance–time relation (Wu, Furbish & Foufoula-Georgiou Reference Wu, Furbish and Foufoula-Georgiou2020), which corresponds to two groups of particle hops (i.e. short and long trajectories) with distinct motion statistics. It is the mix of the two that leads to the exponential-like distribution, while the long hops alone result in the Gaussian-like distribution. Thus, the ratio of the two groups of hops, as closely related to the transport conditions, determines the specific form of the velocity distribution.
Regarding theoretical investigations for the kinematics of bedload particles based on these detailed experimental measurements, great progress has been made with the introduction and application of the Fokker–Planck (FP) equation for particle velocities. A general form of the FP equation, where the drift and diffusivity depend on the particle velocity, was introduced by Furbish, Roseberry & Schmeeckle (Reference Furbish, Roseberry and Schmeeckle2012b) with reference to results in statistical mechanics. The form of the drift and diffusivity can be determined by calculating the first- and second-order moments of particle accelerations, respectively, according to measured trajectories of bedload particles. With specific assumptions involved, e.g. using the mean-reverting (or the Ornstein–Uhlenbeck) process to describe the stochastic velocity of a bedload particle during motions, a simpler form of the FP equation with a constant diffusivity can be obtained, which can be analytically solved under the equilibrium transport condition to give a truncated Gaussian distribution for the particle velocities (Ancey & Heyman Reference Ancey and Heyman2014; Pierce, Hassan & Ferreira Reference Pierce, Hassan and Ferreira2022). The exponential-like distribution for particle velocities can also be theoretically obtained by considering a different form of the FP equation with a constant diffusivity (e.g. Fan et al. Reference Fan, Zhong, Wu, Foufoula-Georgiou and Guala2014).
Following the previous work of Furbish et al. (Reference Furbish, Roseberry and Schmeeckle2012b), Wu et al. (Reference Wu, Furbish and Foufoula-Georgiou2020) revised the calculation of the acceleration by associating it with the linear interpolation for an intermediate velocity (or the average velocity) as the starting point during analysing the same dataset used by Fathel et al. (Reference Fathel, Furbish and Schmeeckle2015). The most important results of the new analysis were the determination of the zero drift and the diffusivity depending exponentially on the particle velocity for the general form of the FP equation, correcting previous assessments in the literature (Furbish et al. Reference Furbish, Roseberry and Schmeeckle2012b). The corresponding Monte Carlo particle-tracking (individual-based) simulation was shown able to reproduce well the key features of the measured kinematic quantities for bedload particle hops, including that of velocities, accelerations, travel times, hop distances, as well as the identified two-regime scaling for the hop distance–time relation. Note that the form of the FP equation with the diffusivity depending exponentially on the velocity is not unique to bedload transport. It has also been discussed for other physical processes (Cherstvy & Metzler Reference Cherstvy and Metzler2013; Wang et al. Reference Wang, Cherstvy, Liu and Metzler2020), such as bombardment-enhanced diffusion (Maby Reference Maby1976) and irradiation-enhanced diffusion (Kowall, Peak & Corbett Reference Kowall, Peak and Corbett1976).
It is the lack of an analytical analysis for the continuum FP equation (due to difficulties in treating the velocity-dependent diffusivity) that has driven the application of the individual-based simulation to obtain numerical solutions. Aiming at conducting theoretical analysis enabling further exploration and discussions on the two-regime scaling relation, in a recent work, Wu et al. (Reference Wu, Singh, Foufoula-Georgiou, Guala, Fu and Wang2021) devised a velocity transformation mapping the physical velocity into an opportunely distorted velocity axis, resulting in a governing equation intrinsically identical to that of Taylor dispersion (Taylor Reference Taylor1953) for solute transport within shear flows. The major difference of this approach (Wu et al. Reference Wu, Singh, Foufoula-Georgiou, Guala, Fu and Wang2021) from the earlier work (Wu et al. Reference Wu, Furbish and Foufoula-Georgiou2020) is the fundamental assumption of a prescribed pattern for the particle velocity variations. That is, it assumes that the particle is performing a Brownian motion in the stretched velocity dimension, which can be compared with the work of Ancey & Heyman (Reference Ancey and Heyman2014) prescribing a mean-reverting process for the particle velocity. Instead, the governing equation used by Wu et al. (Reference Wu, Furbish and Foufoula-Georgiou2020) was determined from the general form of the FP equation (Furbish et al. Reference Furbish, Roseberry and Schmeeckle2012b) by experimentally obtaining the drift and diffusivity terms according to their definitions. Consequently, although the obtained theoretical expression (Wu et al. Reference Wu, Singh, Foufoula-Georgiou, Guala, Fu and Wang2021) captures perfectly the measured data, the relationship between corresponding drift and diffusivity in the governing equation was shown to follow a certain fixed form, which may or may not be the case for the bedload particle transport. Thus, there is still a need to find an analytical method to treat the exponentially velocity-dependent diffusivity for the FP equation as introduced and discussed by Furbish et al. (Reference Furbish, Roseberry and Schmeeckle2012b) and Wu et al. (Reference Wu, Furbish and Foufoula-Georgiou2020).
One more obstacle for analytically solving the FP equation lies in specifying an appropriate (velocity) boundary condition for particles ceasing their motions. This condition may be straightforward if observing the particle hop from the Lagrangian perspective: the particle may stop its motion when its velocity decreases to zero, as specified in previous simulations (Furbish et al. Reference Furbish, Roseberry and Schmeeckle2012b; Fan et al. Reference Fan, Zhong, Wu, Foufoula-Georgiou and Guala2014, Reference Fan, Singh, Guala, Foufoula-Georgiou and Wu2016). And it is also straightforward if we assign a stopping chance for the particle at each time when its velocity drops to (or below) zero, as a means of generally describing how easily the particle can stop its motion, the value of which of course is related to the transport environment. In the individual-based numerical simulation by Wu et al. (Reference Wu, Furbish and Foufoula-Georgiou2020), a stopping chance of  $10\,\%$ was determined by comparing the mean travel time of the simulation with that of the measured data. It remains unknown how to translate such a motion termination condition (from the Lagrangian perspective) into the boundary condition for the governing FP equation (from the Eulerian perspective), and whether there is a means of directly estimating the corresponding parameter based on the measurements.
This work is to provide a full analytical consideration for the particle hop process as simulated by Wu et al. (Reference Wu, Furbish and Foufoula-Georgiou2020), by tackling the above-mentioned two unsolved problems. First, we propose a deposition boundary condition for the FP equation accounting for the cease of motions of particles as physically required by the hop process. It is actually a simple Robin (the third-type) boundary condition, with an important parameter representing the deposition rate of bedload transport. Secondly, for the analytical solutions of hop statistics, a new variable transformation is devised to treat the exponentially velocity-dependent diffusivity. The original bedload transport problem can be transformed into a classic problem of solute transport in shear flows through a tube with a constant diffusivity. We have also obtained analytical expressions relating our newly introduced physical parameter of the deposition rate to the mean travel time and the mean hop distance, which is another important contribution of this work. We emphasize that we can now directly determine the deposition rate based on the measured particle motion statistics, instead of resorting to a fitting procedure matching the predicted quantities to the measurements, as done in the numerical simulation of the previous study (Wu et al. Reference Wu, Furbish and Foufoula-Georgiou2020).
The rest of this paper is structured as follows. For the bedload transport problem formulated in § 2 using an FP equation based on the experiment of Roseberry et al. (Reference Roseberry, Schmeeckle and Furbish2012), we first specify its initial condition and the deposition boundary condition. Then, we show how to use spatial and temporal moments to express the key statistics of the hop events, including the distributions of travel times and hop distances, and the mean hop distance over travel time. To find their analytical solutions, a new variable transformation is provided in § 3, greatly simplifying the transport problem. After verifying the analytical result with the numerical and experimental results, we further investigate the influence of the deposition condition on these three key characteristics in § 4. Analytical expressions are obtained relating the deposition rate to the mean travel time, and the mean hop distance. In § 5, we further explore the variation of the deposition rate under different flow conditions, using the recent experimental data of Liu et al. (Reference Liu, Pelosi and Guala2019). Finally, § 6 concludes.
2. Formulations
2.1. Governing equation
We consider the bedload transport under subcritical flow conditions (with Froude number  ${Fr}<1$), which is in accordance with that analysed by Fathel et al. (Reference Fathel, Furbish and Schmeeckle2015) and Wu et al. (Reference Wu, Furbish and Foufoula-Georgiou2020). Six runs of experiments (R1A, R2A, R3A, R5A, R2B and R3B) were conducted by Roseberry et al. (Reference Roseberry, Schmeeckle and Furbish2012) using relatively uniform sand ( $D_{50}={0.05}\ {\rm cm}$) in an ${8.5}{\rm m}\times {0.3}{\rm m}$ flume under four different flow conditions. The flow rate was low and thus no bed form was produced. The run R3B was later reanalysed by Fathel et al. (Reference Fathel, Furbish and Schmeeckle2015) and it is the main dataset used in the current analysis. Some key experimental parameters are listed in table 1. More details can be found in the work of Roseberry et al. (Reference Roseberry, Schmeeckle and Furbish2012).
Parameters and hop statistics of the experiments by Roseberry et al. (Reference Roseberry, Schmeeckle and Furbish2012) (reanalysed by Fathel et al. Reference Fathel, Furbish and Schmeeckle2015) and the simulation by Wu et al. (Reference Wu, Furbish and Foufoula-Georgiou2020).

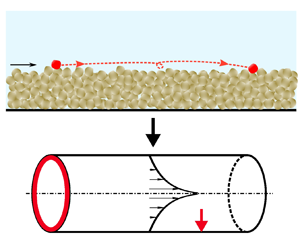
We aim at studying particle hops which are defined as trajectories of particles moving successively from the start to the end of their motions, as shown in figure 1. For simplicity, only the streamwise motions of bedload particles are considered, enabling an idealized theoretical analysis. Statistics of particle motions including velocities, accelerations, travel times and hop distances can all be obtained based on tracing the particle's streamwise positions  $x^{\ast }$ and recording the corresponding times $t^{\ast }$.
Sketch of a bedload particle hop.

Schematic representation of the transformation (3.3a,b).

For the individual-based simulation by Wu et al. (Reference Wu, Furbish and Foufoula-Georgiou2020), the stochastic differential equation (SDE) can be written as
 $$\begin{gather} \frac{\mathrm{d} x^{{\ast}}}{\mathrm{d} t^{{\ast}}} = u^{{\ast}}, \end{gather}$$
 $$\begin{gather}\frac{\mathrm{d} u^{{\ast}}}{\mathrm{d} t^{{\ast}}} = a_{\mu}^{{\ast}} (u^{{\ast}}) + \sqrt{2 k^{{\ast}} (u^{{\ast}})} \xi^{{\ast}} (t^{{\ast}}), \end{gather}$$
where  $x^{\ast }$ is the streamwise location, $t^{\ast }$ is the time, $u^{\ast }$ is the streamwise velocity, $a_{\mu }^{\ast }$ is the ‘drift’ term of velocity, $k^{\ast }$ is the diffusion coefficient of velocity and $\xi ^{\ast }$ is the white noise term. We use the asterisk to mark dimensional variables (which will be non-dimensionalized later in § 3.1).
According to the reanalysis (Wu et al. Reference Wu, Furbish and Foufoula-Georgiou2020, figure 1) of the experimental data as presented by Fathel et al. (Reference Fathel, Furbish and Schmeeckle2015), the drift term is zero, and the diffusivity  $k^{\ast }$ is an exponential function of $u^{\ast }$ due to the observed exponential distribution of particle velocities (Wu et al. Reference Wu, Furbish and Foufoula-Georgiou2020, (6)), namely
 \begin{equation} a_{\mu}^{{\ast}}=0, \quad k^{{\ast}} (u^{{\ast}}) = k^{{\ast}}_0 \,\mathrm{e}^{u^{{\ast}} / u_0^{{\ast}}}. \end{equation}
The reference velocity  $u_0^{\ast }$ is in fact equal to the mean velocity $u_a^{\ast }$; and in the simulation of Wu et al. (Reference Wu, Furbish and Foufoula-Georgiou2020), $u_0^{\ast } =u_a^{\ast }={4.76}\ {\rm cm}\ {\rm s}^{-1}$ and the constant $k^{\ast }_0={300}\ {\rm cm}^{2}\ {\rm s}^{-3}$. Technically, this velocity dependence of the diffusivity $k^{\ast }$ becomes the main obstacle for analytically analysing the corresponding FP equation.
Note that (2.2a,b) represents one of the limited sets of drift and diffusivity that has been directly determined based on available experimental dataset of particle kinematics under subcritical flow conditions (Roseberry et al. Reference Roseberry, Schmeeckle and Furbish2012; Liu et al. Reference Liu, Pelosi and Guala2019). It represents the external force (as a result of the combined actions of turbulent flow drag, particle–particle and particle–bed interactions) acting on the moving bedload particles, and states the nature of its random variations. The model (2.1) describes a Markov process and thus it cannot account for the historical effect of the velocity variations. There are other forms of the drift  $a_{\mu }^{\ast }(u^{\ast })$ and the diffusivity $k^{\ast }(u^{\ast })$ depending on the flow and transport conditions, as discussed in §§ 1 and 6.
For the continuum model, we can deduce the FP equation immediately from (2.1), which is similar to (3.9) of Ancey & Heyman (Reference Ancey and Heyman2014). We use  $P^{\ast }(x^{\ast }, u^{\ast }, t^{\ast })$ to denote the joint p.d.f. of the streamwise position, the velocity and the time; then the governing equation can be written as
 \begin{equation} \frac{\partial P^{{\ast}}}{\partial t^{{\ast}}} + u^{{\ast}} \frac{\partial P^{{\ast}}}{\partial x^{{\ast}}} = \frac{\partial^2}{{\partial u^{{\ast}}}^2} ( k^{{\ast}}_0 \,\mathrm{e}^{u^{{\ast}} / u_0^{{\ast}}} P^{{\ast}}), \end{equation}
with  $u^{\ast } \in (0, \infty )$ and $x^{\ast } \in (- \infty, \infty )$.
2.2. Initial and boundary conditions
Since we are focusing on the particle hop process, we need to describe the start of the particle motion (entrainment), the successive streamwise movement of the particle and, eventually, the cease of motion of this particle (deposition). While the successive particle motions are governed by (2.3), the entrainment and deposition phases of the hop process are specified by the initial and boundary conditions for (2.3), respectively.
First, for the entrainment of bedload particles, we follow Wu et al. (Reference Wu, Singh, Foufoula-Georgiou, Guala, Fu and Wang2021) and consider all bedload particles initially starting their motions at  $x^{\ast }=0$ with $u^{\ast }=0$. Thus, the initial condition is
 \begin{equation} P^{{\ast}}_{{init}} = \delta (x^{{\ast}}) \delta(u^{{\ast}}), \end{equation}
where  $\delta$ is the delta function. Note that (2.4) is a rather idealized description for the entrainment. During analysis of the particle hop statistics (e.g. velocities, accelerations, travel times and hop distances), an important but straightforward simplification is that all the information will not depend on when and where the particle hop starts. Hence, by introducing (2.4) we virtually move all the starting positions to the same location for the ensemble of hops and start their motions at the same time.
Second, we can specify the deposition boundary condition according to the numerical algorithm of Wu et al. (Reference Wu, Furbish and Foufoula-Georgiou2020). We assume that a particle may cease its motion with a stopping chance  $P_{stop}$ every time its velocity drops to (or below) zero. Wu et al. (Reference Wu, Furbish and Foufoula-Georgiou2020) chose a value of $P_{stop}=10\,\%$ so that the mean travel time of the simulated particle hops can match that of the experimental measurements (Fathel et al. Reference Fathel, Furbish and Schmeeckle2015). Therefore, we can impose
 \begin{equation} \left. k^{{\ast}}_0 \frac{\partial P^{{\ast}}}{\partial u^{{\ast}}}\right|_{u^{{\ast}} = 0} = \varGamma^{{\ast}} P^{{\ast}} |_{u^{{\ast}} = 0}, \end{equation}
where the deposition rate  $\varGamma ^{\ast }$ can be related to $P_{stop}$. Equation (2.5) is a Robin (third-type) boundary condition for partially reflecting boundaries, often used in reactive transport problems (Singer et al. Reference Singer, Schuss, Osipov and Holcman2008; Andrews Reference Andrews2009; Jiang et al. Reference Jiang, Zeng, Fu and Wu2022; Wang et al. Reference Wang, Jiang, Chen and Tao2022b). According to the relationship between the individual-based and continuum models, $P_{stop}$ used in the simulation can be calculated (Erban & Chapman Reference Erban and Chapman2007, (10)) as
 \begin{equation} P_{{stop}} = \varGamma^{{\ast}} \sqrt{\frac{{\rm \pi} \Delta t_s^{{\ast}}}{k_0^{{\ast}}}}, \end{equation}
where  $\Delta t_s^{\ast }$ is the time step and $\Delta t_s^{\ast }={0.0004}\ {\rm s}$ was used in the simulation of Wu et al. (Reference Wu, Furbish and Foufoula-Georgiou2020). Therefore, $\varGamma ^{\ast }$ can be obtained by (2.6) as
 \begin{equation} \varGamma^{{\ast}}=\varGamma_{s}^{{\ast}}={48.8}\ {\rm cm}\ {\rm s}^{{-}2}. \end{equation}
Generally speaking,  $\varGamma ^{\ast }$ determines how easily a particle will cease its motion. Its value may be related to the roughness of the bed, the flow strength, fluid–particle interactions, particle–bed collisions, the particle diameter, etc. As discussed by Wu et al. (Reference Wu, Furbish and Foufoula-Georgiou2020), bedload particles moving at low speeds may encounter the zero velocity situation (or ‘zero velocity hits’) many times and thus stop early, resulting in short hop distances. Particles performing long hops are probably spending more time moving with velocities much greater than zero and thus have fewer chances to encounter the zero velocity hits. One extreme case is that bedload particles cease their motions immediately when $u^{\ast } = 0$, as in the condition imposed in the random walk simulations by Furbish et al. (Reference Furbish, Roseberry and Schmeeckle2012b) and Fan et al. (Reference Fan, Singh, Guala, Foufoula-Georgiou and Wu2016). It is mathematically similar to an absorbing boundary with $\varGamma ^{\ast } \rightarrow \infty$.
Note that  $\varGamma ^{\ast }$ is more physically meaningful than $P_{stop}$ because the value of $P_{stop}$ varies with the time step chosen for simulations. On the other hand, another contribution of this work, as documented in § 4.2.2, is that we have analytically related this new physical parameter of the deposition rate $\varGamma ^{\ast }$ to the mean travel time and the mean particle velocity, for example. Consequently, $\varGamma ^{\ast }$ can be directly determined based on the measured particle hop statistics, in contrast to the previous work of Wu et al. (Reference Wu, Furbish and Foufoula-Georgiou2020) in which a similar parameter to $P_{stop}$ needs to be obtained by fitting the predicted quantities to experimental measurements.
2.3. Travel times and hop distances: relation to moments
Now we have the continuum model based on exploring the individual-based simulation algorithm of Wu et al. (Reference Wu, Furbish and Foufoula-Georgiou2020), we can express the key statistics of hop events of bedload particles, such as the distributions of travel times and hop distances, using the spatial and temporal moments of  $P^{\ast }$.
First, we derive the p.d.f. of travel times  $f_T^{\ast }(t^{\ast })$, which is the period of time of a hop. By the deposition condition (2.5), the probability flux of stopped particles (from the motion state to the resting state) is $\varGamma ^{\ast } P^{\ast }(x^{\ast },u^{\ast }=0, t^{\ast })$. Therefore
 \begin{equation} f_T^{{\ast}}(t^{{\ast}}) = \int^{\infty}_{- \infty} \varGamma^{{\ast}} P^{{\ast}} (x^{{\ast}}, u^{{\ast}} = 0, t^{{\ast}}) \, \mathrm{d} x^{{\ast}} = \varGamma^{{\ast}} \mu^{{\ast}}_0 (u^{{\ast}} = 0, t^{{\ast}}), \end{equation}
where  $\mu _0^{\ast }$ is the zeroth-order spatial moment and its definition extended to the $n$th-order spatial moment is
 \begin{equation} \mu_n^{{\ast}} \triangleq \int^{\infty}_{- \infty} (x^{{\ast}})^n P^{{\ast}} \, \mathrm{d} x^{{\ast}}, \quad n = 0, 1, \ldots . \end{equation}
Additionally, note that the total number of particles (both in motion and at rest) is conserved, thus  $f_T^{\ast }$ can also be expressed as
 \begin{equation} f_T^{{\ast}} = \frac{\mathrm{d}}{\mathrm{d} t^{{\ast}}} (1 - \overline{\mu_0^{{\ast}}}) ={-}\frac{\mathrm{d} \overline{\mu_0^{{\ast}}}}{\mathrm{d} t^{{\ast}}} , \end{equation}
where we use the bar to denote the mean of a value over  $u^{\ast }$, namely
 \begin{equation} \overline{\mu_0^{{\ast}}} = \int^{\infty}_0 \mu_0^{{\ast}} \, \mathrm{d} u^{{\ast}}. \end{equation}
 Second, we can use the temporal moment of  $P^{\ast }$ to express the p.d.f. of hop distances
 \begin{equation} f_L^{{\ast}} (x^{{\ast}}) = \int^{\infty}_0 \varGamma^{{\ast}} P^{{\ast}} (x^{{\ast}}, u^{{\ast}} = 0, t^{{\ast}}) \, \mathrm{d} t^{{\ast}} = \varGamma^{{\ast}} m_0^{{\ast}} (x^{{\ast}}, u^{{\ast}} = 0), \end{equation}
where  $m_0^{\ast }$ is the zeroth-order temporal moment (Harvey & Gorelick Reference Harvey and Gorelick1995) and
 \begin{equation} m_n^{{\ast}} \triangleq \int^{\infty}_{0} (t^{{\ast}})^n P^{{\ast}} \, \mathrm{d} t^{{\ast}}, \quad n = 0, 1, \ldots . \end{equation}
 Finally, we analyse the mean hop distance over travel time, namely the mean of all possible hop distances at each specific travel time. Thus, the mean hop distance is a function of travel time, denoted as  $L^{\ast }(t^{\ast })$. It can be calculated using the first two spatial moments of the stopped particles
 \begin{equation} L^{{\ast}} (t^{{\ast}}) = \frac{\displaystyle \int^{\infty}_{- \infty} x^{{\ast}} \varGamma^{{\ast}} P^{{\ast}} |_{u^{{\ast}} = 0} \,\mathrm{d} x^{{\ast}}}{\displaystyle \int^{\infty}_{- \infty} \varGamma^{{\ast}} P^{{\ast}} |_{u^{{\ast}} = 0} \,\mathrm{d} x^{{\ast}}} = \frac{\mu_1^{{\ast}} |_{u^{{\ast}} = 0}}{ \mu_0^{{\ast}} |_{u^{{\ast}} = 0}}. \end{equation}
By (2.14), we can see a different physical meaning of  $L^{\ast } (t^{\ast })$: the position of the centroid of the particle cloud stopped at a specific time $t^{\ast }$; because ${\mu _1^{\ast }}/{ \mu _0^{\ast }}$ is actually the normalized first-order moment.
3. Analytical solutions for hop statistics
Based on the continuum model we have revealed the relationship between the key hop statistics and moments. Next, we will analytically solve the three key characteristics, i.e. the p.d.f.s of travel times ( $f_T^{\ast } (t^{\ast })$) and hop distances ( $f_L^{\ast } (x^{\ast })$), and the mean hop distance over travel time ( $L^{\ast } (t^{\ast })$).
As mentioned previously, the major obstacle for us to analytically treat (2.3) is the exponentially velocity-dependent diffusivity ( $k^{\ast } (u^{\ast })$). To tackle this difficulty we devise a variable transformation, based on which (2.3) can be transformed into a much simpler form, representing the main contribution of this work. Then we can directly apply the method of Barton (Reference Barton1983) to obtain the analytical expressions of spatial and temporal moments, and thus obtain $f_T^{\ast }$, $f_L$ and $L^{\ast }$.
3.1. Non-dimensionalization and the variable transformation
Before introducing the transformation for the velocity-dependent  $k^{\ast } (u^{\ast })$, we non- dimensionalize the governing equation (2.3) with the following dimensionless variables and parameters:
 \begin{equation} \left. \begin{array}{c@{}}
\displaystyle u = \dfrac{u^{{\ast}}}{u_0^{{\ast}}},\quad x
= \dfrac{x^{{\ast}}}{4 (u_0^{{\ast}})^3 / k^{{\ast}}_0},
\quad t = \dfrac{t^{{\ast}}}{4 (u_0^{{\ast}})^2 /
k^{{\ast}}_0},\\ \displaystyle \varGamma = \dfrac{2
\varGamma^{{\ast}}}{k^{{\ast}}_0 / u_0^{{\ast}}}, \quad k =
\dfrac{k^{{\ast}}}{k^{{\ast}}_0} = \mathrm{e}^u, \quad P =
\dfrac{4 P^{{\ast}}}{k^{{\ast}}_0 / (u_0^{{\ast}})^4},
\end{array} \right\} \end{equation}
\begin{equation} \left. \begin{array}{c@{}}
\displaystyle u = \dfrac{u^{{\ast}}}{u_0^{{\ast}}},\quad x
= \dfrac{x^{{\ast}}}{4 (u_0^{{\ast}})^3 / k^{{\ast}}_0},
\quad t = \dfrac{t^{{\ast}}}{4 (u_0^{{\ast}})^2 /
k^{{\ast}}_0},\\ \displaystyle \varGamma = \dfrac{2
\varGamma^{{\ast}}}{k^{{\ast}}_0 / u_0^{{\ast}}}, \quad k =
\dfrac{k^{{\ast}}}{k^{{\ast}}_0} = \mathrm{e}^u, \quad P =
\dfrac{4 P^{{\ast}}}{k^{{\ast}}_0 / (u_0^{{\ast}})^4},
\end{array} \right\} \end{equation}
where constants  $4$ and $2$ are imposed for the subsequent transformation. The resulting dimensionless governing equation and boundary condition are
 $$\begin{gather} \frac{\partial P}{\partial t} + u \frac{\partial P}{\partial x} =4 \frac{\partial^2}{\partial u^2} (\mathrm{e}^u P), \quad u \in (0, \infty), \ x \in (- \infty, \infty), \end{gather}$$
 $$\begin{gather}\left. \frac{\partial (\mathrm{e}^u P)}{\partial u} \right|_{u = 0} = \frac{\varGamma}{2} P |_{u = 0} . \end{gather}$$
Next, subject to a posteriori verification, we introduce the following transformation:
 \begin{equation} r = \mathrm{e}^{- u / 2}, \quad c= \mathrm{e}^u P. \end{equation}
Consequently,  $u=-2 \ln r$ and $P =c/k = r^2 c$. With the chain rule ${\partial }/{\partial u} = ({\partial }/{\partial r}) ({\partial r}/{\partial u}) = - \frac {1}{2} r ({\partial }/{\partial r})$, the whole initial-boundary-value problem (2.3)–(2.4) can be rewritten as
 $$\begin{gather} \frac{\partial c}{\partial t} + u(r) \frac{\partial c}{\partial x} = \frac{1}{r} \frac{\partial}{\partial r} \left( r \frac{\partial c}{\partial r} \right),\quad r \in (0, 1), \, x \in (- \infty, \infty), \end{gather}$$
 $$\begin{gather}\left. \frac{\partial c}{\partial r} \right|_{r = 1} ={-} \varGamma c |_{r = 1}, \end{gather}$$
 $$\begin{gather}c |_{t = 0} = \frac{1}{2} \delta(x) \delta(r-1). \end{gather}$$
 It is seen that the above transformation greatly simplifies the original FP equation (2.3) by transforming the problem of bedload transport with an exponentially velocity-dependent diffusivity into a classic problem of solute transport in laminar flows through a tube with a constant diffusivity. As a result,  $r$ is a ‘radial’ coordinate, which can be one-to-one mapped to the velocity $u$;
$u$;  $c$ can be understood as the ‘concentration’ distribution; and the deposition boundary condition (2.5) at $u=0$ becomes an absorption condition (3.4b) at the ‘tube wall’ ( $r=1$), the same as the classic reactive transport problems (Barton Reference Barton1984; Wang & Chen Reference Wang and Chen2017; Jiang & Chen Reference Jiang and Chen2018; Debnath et al. Reference Debnath, Jiang, Guan and Chen2022). The transformation of $u$ is different from the (2.19) of Wu et al. (Reference Wu, Singh, Foufoula-Georgiou, Guala, Fu and Wang2021) because, in their governing equation, the form of drift and diffusivity is fixed and implies a non-zero drift. Additionally, the form of $r$ is similar to (25) of Cherstvy & Metzler (Reference Cherstvy and Metzler2013), which is deduced from SDEs in the Stratonovich convention and thus requires an additional transformation back into equations in the Itô convention.
In addition, the integration of the p.d.f. can be written as
 \begin{equation} \int^{\infty}_{- \infty} \int^{\infty}_0 P (x, u, t) \, \mathrm{d} u \,\mathrm{d} x = \int^{\infty}_{- \infty} \int^1_0 2 r c (x, r, t) \, \mathrm{d} r \,\mathrm{d} x, \end{equation}
with the mean operation over the velocity  $u$ (2.11) rewritten in terms of $r$ as
 \begin{equation} \bar{c} = \int^1_0 2 r c \, \mathrm{d} r, \end{equation}
which is exactly the area-average operation over a tube cross-section.
Finally, we non-dimensionalize  $f_T^{\ast } (t^{\ast })$, $f_L^{\ast } (x^{\ast })$ and $L^{\ast } (t^{\ast })$ using (3.1) and (3.3a,b). Results of (2.8), (2.12) and (2.14) can be rewritten as
 $$\begin{gather} f_T (t) = 2 \varGamma \mu_0 (r=1, t), \end{gather}$$
 $$\begin{gather}f_L (x) = 2 \varGamma m_0 (x, r=1), \end{gather}$$
 $$\begin{gather}L (t) = \frac{\mu_1 (r=1, t)}{ \mu_0 (r=1, t)}, \end{gather}$$
where the dimensionless spatial moment  $\mu _n$ and temporal moment $m_n$ are
 \begin{equation} \mu_n (r, t) \triangleq \int^{\infty}_{- \infty} x^n c(x, r, t) \, \mathrm{d} x, \quad m_n(x,r) \triangleq \int^{\infty}_{0} t^n c(x, r, t) \, \mathrm{d} t, \end{equation}
respectively, and  $n=0,1,2,\ldots$.
3.2. Solutions for spatial and temporal moments
We can solve the spatial moment  $\mu _n$ for $f_T$ and $L$ in (3.7) and (3.9). Note that the transport problem (3.4) is only slightly different from the classic Taylor dispersion of solute in a tube flow (Taylor Reference Taylor1953; Aris Reference Aris1956): the ‘velocity distribution’ is $u(r)=-2 \ln r$ instead of the parabolic profile, and there is no longitudinal diffusion.
The solutions of spatial moments have been systematically studied by Barton (Reference Barton1983, Reference Barton1984) using the Sturm–Liouville theory, with general expressions for the first four moments provided for direct use. Barton's results have been widely applied to studies on various dispersion phenomena (Zeng et al. Reference Zeng, Chen, Tang and Wu2011; Li et al. Reference Li, Jiang, Wang, Guo, Li and Chen2018; Guan et al. Reference Guan, Zeng, Jiang, Guo, Wang, Wu, Li and Chen2022; Wang, Jiang & Chen Reference Wang, Jiang and Chen2022a). In order not to disrupt the narrative flow, the solution procedure is summarized in Appendix A of § A.1.
For  $f_L$ in (3.8), we can solve the temporal moment $\mu _0$. The solution procedure is similar to that of the spatial moments as presented above, and details are given in Appendix A of § A.2. Since there is no longitudinal diffusion in the transport problem (3.4), $x$ can be seen as a ‘time’ variable in the resulting moment equations. Consequently, the form of the solution of $\mu _0$ is the same as (A5): one only needs to replace $t$ using $x$ with corresponding eigenvalues and eigenfunctions. The generalized integral transform technique (GITT) method (Cotta Reference Cotta1993) is applied to solve the corresponding eigenvalue problem.
4. Results
We have deduced the continuum model for the bedload particle hops. A simple deposition boundary condition for particles ceasing their motions was specified for the governing equation based on recent numerical and experimental studies. We then analytically solved the three key characteristics: the p.d.f.s of travel times ( $f_T (t)$) and hop distances ( $f_L(x)$), as well as the mean hop distance over travel time ( $L (t)$). Here we continue to investigate the influence of the deposition condition on these key characteristics of hop events.
4.1. Validation by experimental and numerical results
We first validate our analytical results for the three key characteristics by the experimental data of Fathel et al. (Reference Fathel, Furbish and Schmeeckle2015) and the numerical simulations of Wu et al. (Reference Wu, Furbish and Foufoula-Georgiou2020). Note that analytical expressions such as (A5) and (A8) contain series expansions which need to be truncated. We adopted the first ten eigenvalues and eigenfunctions for the analysis. Additionally, although we have non-dimensionalized the governing equation and thus corresponding analytical solutions, expressions with dimensional variables are also deduced, enabling a direct comparison with existing experimental and numerical results (e.g. Wu et al. Reference Wu, Furbish and Foufoula-Georgiou2020, figures 3 and 4).
4.1.1. The p.d.f.s of travel times and hop distances
As shown in figure 3(a), the analytical result for the p.d.f. of travel times agrees well with the numerical result, which is close to the experimental measurements. For large travel times,  $f_T$ decays exponentially with a rate almost equal to the first non-zero eigenvalue, as shown by (3.7) and (A5). For small travel times, we can observe a noticeable deviation of the numerical and analytical results from the experimental data, where the measurements roughly follow an exponential decay, while the other two results decrease more sharply. The reason for this discrepancy may be twofold. On the one hand, there exist difficulties in experimentally tracking very short hops, giving rise to uncertainties for the corresponding measurements. On the other hand, it may also be related to the deposition boundary condition which may not exactly agree with the physical process of how the particle ceases its motion. Mathematically, $f_T$ approaches infinity as $t$ approaches zero because the initial condition (2.4) is a delta function of $u^{\ast }$ at $u^{\ast }=0$.
The p.d.f.s of (a) travel times  $f_T$, and (b) hop distances $f_L$.

Comparisons for p.d.f.s of hop distances among different results also demonstrate good consistency, as shown in figure 3(b). Similar to the travel time distribution, for large hop distances  $f_L$ decays exponentially, as revealed by (3.8) and (A14). For small hop distances, $f_L$ decreases sharply and thus is closer to a Weibull distribution (Fathel et al. Reference Fathel, Furbish and Schmeeckle2015). Namely, $f_L$ has a Weibull front and an exponential tail, as pointed out by Wu et al. (Reference Wu, Furbish and Foufoula-Georgiou2020) and Wu et al. (Reference Wu, Singh, Foufoula-Georgiou, Guala, Fu and Wang2021).
4.1.2. Mean hop distance over travel time
For the mean hop distance over travel time  $L(t)$, comparisons in figure 4 show an overall similar feature among analytical, numerical and experimental results. That is, very good agreement between the first two results in fact demonstrates the validation of the analytical solution, since the two approaches consider almost the same idealized transport process; their deviations from the experimental measurements highlight the limitation possibly related to the deposition boundary condition, or the uncertainties of the measurements. Specifically, the two-regime scaling relation (advective $L \sim t^2$ and dispersive $L \sim t$) is consistent with previous analysis (Wu et al. Reference Wu, Furbish and Foufoula-Georgiou2020, Reference Wu, Singh, Foufoula-Georgiou, Guala, Fu and Wang2021). The deviation of the analytical solution at very short travel times (here $t^{\ast }<0.02\textrm {s}$) may be due to the Gibbs phenomenon of series expansion because the initial condition (2.4) is a delta function of $u^{\ast }$ at $u^{\ast }=0$, based on which the mean hop distance over travel time in (2.14) is calculated.
Mean hop distance over travel time  $L(t)$.

4.2. Influence of deposition rate
The key parameter introduced in this work is the deposition rate  $\varGamma ^{\ast }$. In the calculation in § 4.1, $\varGamma _{s}^{\ast }={48.8}\ \textrm {cm} \textrm {s}^{-2}$ in (2.7) is used based on the experimental and numerical studies (Wu et al. Reference Wu, Furbish and Foufoula-Georgiou2020). Here, we analyse the effect of $\varGamma ^{\ast }$ on the particle hop statistics, which may correspond to the influence of different transport conditions including the flow strength, the roughness of the bed and the slope of the bed. Two additional cases with $\varGamma ^{\ast }=0.2 \varGamma _{s}^{\ast }$ and $\varGamma ^{\ast }=5 \varGamma _{s}^{\ast }$ are considered, while other parameters are kept the same, for the three key characteristics: $f_T (t)$, $f_L(x)$ and $L (t)$. Importantly, we eventually deduced the relation between the deposition rate and the average travel time, or between that and the average hop distance. This provides a means to directly determine the deposition rate based on the physically measured particle motion statistics, instead of fitting the predicted results to the measurements.
4.2.1. The p.d.f.s of travel times and hop distances
The influence of  $\varGamma ^{\ast }$ on the p.d.f. of travel times is shown in figure 5(a). It is seen that the larger the $\varGamma ^{\ast }$ is, the smaller the proportion of long travel times is, and the larger the proportion of short travel times is. This can be observed partly by the different slopes of the exponential tail of the three curves. Since $\varGamma ^{\ast }$ is proportional to the stopping chance as shown in (2.6), a larger $\varGamma ^{\ast }$ means that particles are more likely to stop when its velocity decreases to zero, on average resulting in smaller travel times. For the hop distance, similarly, increasing the deposition rate can generally reduce the hop length; and the resulting change in shape for curves of $f_L$ is analogous to that for $f_T$, as shown in figure 5(b).
The p.d.f.s of (a) travel times and (b) hop distances for different deposition rates.

4.2.2. Relation of deposition rate to the average travel time and average hop distance
Other than revealing the effect of deposition rate on the shape of the p.d.f.s of travel times and hop distances, it is interesting to observe how the mean travel time and hop distance will depend on the deposition rate.
In figure 6, we have calculated and displayed  $T_a$ and $L_a$ as functions of the deposition rate. Interestingly, a rather good power-law relation can be observed for both mean quantities, which motivates us to see whether some theoretical description would be possible. We have eventually arrived at analytical expressions of $T_a$ and $L_a$ in terms of $\varGamma$, enabling a direct determination of this new quantity $\varGamma$ based on measured particle statistics, instead of the fitting process used for the similar parameter of particle stopping chance in the numerical simulation of the previous study (Wu et al. Reference Wu, Furbish and Foufoula-Georgiou2020). Here, we document the deduction of this key result.
(a) Mean travel time  $T_a$ and (b) mean hop distance $L_a$, as functions of the deposition rate $\varGamma$.

Mathematically, the mean travel time  $T_a$ and hop distance $L_a$ are the first-order moments of the p.d.f.s of travel times and hop distances, respectively. With the aid of (3.7) and (3.8),
 $$\begin{gather} T_a \triangleq \int^{\infty}_0 t f_T (t) \, \mathrm{d} t = \int^{\infty}_0 t 2 \varGamma \mu_0 (r = 1, t) \, \mathrm{d} t = 2 \varGamma M_{0, 1} (r = 1), \end{gather}$$
 $$\begin{gather}L_a \triangleq \int^{\infty}_{- \infty} x f_L (x) \, \mathrm{d} x = \int^{\infty}_{-\infty} x 2 \varGamma m_0 (x, r = 1) \, \mathrm{d} x = 2 \varGamma M_{1, 0} (r = 1) , \end{gather}$$
where  $M_{n, m}$ is introduced as the ‘universal’ moment, i.e. the temporal–spatial moment
 \begin{equation} M_{n, m} \triangleq \int^{\infty}_0 t^m \int^{\infty}_{- \infty} x^n c (x, r, t) \,\mathrm{d} x \, \mathrm{d} t, \end{equation}
for  $n = 0, 1, 2, \ldots$ and $m = 0, 1, 2, \ldots$.
Universal moments  $M_{0, 1}$ and $M_{1, 0}$ can be solved, as presented in Appendix B. By (B4a,b), (B3) and (B7), we have
 $$\begin{gather} T_a = \bar{M}_{0, 0} = \frac{1}{2 \varGamma}, \end{gather}$$
 $$\begin{gather}L_a = 2 \varGamma M_{1, 0} |_{r = 1} = \overline{- u (r) M_{0, 0}} = \frac{1}{2 \varGamma}. \end{gather}$$
Namely, the power-law relation as observed in figure 6 is in fact a reciprocal function of  $\varGamma$.
Finally, we can express the results by the original dimensional variables in (3.1). Equations (4.4) and (4.5) turn out to be
 $$\begin{gather} T_a^{{\ast}} =\frac{u_0^{{\ast}}}{\varGamma^{{\ast}}} =\frac{u_a^{{\ast}}}{\varGamma^{{\ast}}}, \end{gather}$$
 $$\begin{gather}L_a^{{\ast}} = \frac{(u_0^{{\ast}})^2}{\varGamma^{{\ast}}}= u_0^{{\ast}} T_a^{{\ast}}= u_a^{{\ast}} T_a^{{\ast}}. \end{gather}$$
Note that  $u_0^{\ast }$ is equal to the mean particle velocity $u_a^{\ast }$, and $\varGamma ^{\ast }$ has dimensions of acceleration. Additionally, considering the physical meaning of the deposition rate $\varGamma ^{\ast }$, which describes how fast the particle stops its motions, another interpretation of (4.6) can be given as follows. The mean travel time is the time when a particle travelling with the mean velocity $u_a^{\ast }$ decelerates until it is stopped under the acceleration $\varGamma ^{\ast }$. The mean hop distance is simply the distance during the deceleration phase, $u_a^{\ast } T_a^{\ast }$. Note that the mean velocity $u_a^{\ast }$ is the average of the measured velocities at each discrete point of the hop trajectories and thus, $u_a^{\ast }= L_a^{\ast }/ T_a^{\ast }$. (4.6b) reveals no new findings.
In § 2.2, we have used  $P_{{stop}}$ in the individual-based simulation of Wu et al. (Reference Wu, Furbish and Foufoula-Georgiou2020) to determine $\varGamma ^{\ast }$ by (2.6), and $\varGamma ^{\ast }={48.8}\ \textrm {cm}\ \textrm {s}^{-2}$ was obtained. We need to emphasize that $P_{{stop}}$ was fitted so that the simulated mean travel time can match the measured result. Now, we can directly use the experimental data to calculate $\varGamma ^{\ast }$ based on (4.6)
 \begin{equation} \varGamma^{{\ast}} = \frac{u_a^{{\ast}}}{T_a^{{\ast}}} = \frac{(u_a^{{\ast}})^2}{L^{{\ast}}_a} = \frac{L^{{\ast}}_a}{(T_a^{{\ast}})^2} . \end{equation}
The mean travel time in figure 3(a) is  ${0.97}\ \textrm {s}$ (see table 1), which gives $\varGamma ^{\ast }={49.1}\ \textrm {cm}\ \textrm {s}^{-2}$, very close to the value used in the numerical simulation.
4.2.3. Mean hop distance over travel time
For the mean hop distance over travel time displayed in figure 7, the influence of the deposition rate may appear rather counter-intuitive at first glance: when  $\varGamma ^{\ast }$ increases, $L(t)$ does not decrease as expected given particles would generally have shorter hop distances (as demonstrated in figure 5b); but instead $L(t)$ increases with $\varGamma ^{\ast }$.
Mean hop distance over travel time  $L(t)$ for different deposition rates.

We recall the physical meaning of  $L(t)$ by (2.14): it tells us, on average, how far the particle can travel during a hop with a specific travel time. What $L(t)$ does not tell us is the distribution of particles with respect to travel times: by curves in figure 7 alone we have no idea of the proportion of particles that can travel as long as, say, around $t_e= 0.5$ s. Thus, for a higher deposition rate there are indeed fewer particles that can travel the same period of time $t_e$.
On the other hand, the deposition boundary condition requires that particles are about to stop motions by experiencing on average the same number of times when their velocities drop to zero with a given deposition rate. This means that, at a higher deposition rate, particles travel a period of  $t_e$ not because they survived more ‘zero velocity hits’ (than at a lower deposition rate), but because they generally travelled with a higher velocity which reduces their chance of experiencing a ‘zero velocity hit’. Hence, a higher mean velocity during the hop results in a longer hop distance with the same travel time.
5. Application to recent experiments: additional validation
As shown in the above sections, this present model works well for the single dataset by Fathel et al. (Reference Fathel, Furbish and Schmeeckle2015). It is thus interesting to check its performance against bedload particle hops under different transport conditions, which can provide additional validation for the model in its ability to generally describe the kinematics of particle motions. To this end, we choose experiments conducted recently by a different research group of Liu et al. (Reference Liu, Pelosi and Guala2019), who used much coarser sediment particles ( $D_{50}={0.11}\ \textrm {cm}$) with much larger particle Reynolds numbers, representing distinct transport characteristics from that of Fathel et al. (Reference Fathel, Furbish and Schmeeckle2015).
The experiments of Liu et al. (Reference Liu, Pelosi and Guala2019) were conducted in a  ${19}\textrm {m}\times {0.9}\textrm {m}$ flume under five low flow rates. They provided five series (S1–S5) of data, with the Froude number varying from $0.27$ to $0.30$. Main experimental parameters are provided in table 2 and details can be found in their paper. Hereinafter, we follow Liu et al. (Reference Liu, Pelosi and Guala2019) and focus on the experimental series S2–S5 in the analysis, because a very limited number of moving particles were detected in S1 under the lowest shear-stress condition.
Parameters and hop statistics for the experiments by Liu et al. (Reference Liu, Pelosi and Guala2019) and for the current model; S2–S5 are labels of different experiment series. The hyphen (-) represents that this parameter is the same for all the series.

For the particle velocities, Liu et al. (Reference Liu, Pelosi and Guala2019, (1)) reported a gamma distribution which is closely related to the algorithm for distinguishing between motion and rest regimes during bedload particle transport, as argued by the authors: ‘if we consider all the non-zero particle velocities, including both the motion and the ambiguous rocking back-and-forth state, the velocity distributions maintain the exponential trend in a lower range’. On the other hand, we note that the current model (2.3) adopts an exponential distribution as an approximation for the observed exponential-like form of the particle velocity distribution, the form of which generally applies to the observations of Liu et al. (Reference Liu, Pelosi and Guala2019) for particle velocities, thus (2.3) is expected to be able to describe the hop processes for this new dataset.
5.1. Determine model parameters by experimental statistics
We can determine the model parameters (i.e.  $u_0^{\ast }$, $\varGamma ^{\ast }$ and $k_0^{\ast }$) directly by the experimental statistics according to the obtained theoretical result of (4.7). One important issue that needs to be addressed is that Liu et al. (Reference Liu, Pelosi and Guala2019) have imposed a cutoff velocity ( $u_c^{\ast }={1.5}$ cm s $^{-1}$) to determine the start and the end of a particle hop. Namely, particles with velocities smaller than $u_c^{\ast }$ are considered to be in the resting state. As a result, the reference velocity $u_0^{\ast }$ in the governing equation (2.3) may not be equal to the mean velocity $u_a^{\ast }$. This treatment may also be responsible for the observed deviation from the exponential distribution of particle velocities at small values, as discussed above. In fact, by (C6), we have $u_0^{\ast }=u_a^{\ast }-u_c^{\ast }$. According to the experimental dataset of Liu et al. (Reference Liu, Pelosi and Guala2019) (table 2), we found that the average velocity $u_a^{\ast }> L_a^{\ast }/ T_a^{\ast }$, which means that the experimental hop statistics do not satisfy the relationship in (4.6b). This inconsistency may arise from the filter of particle velocities for small values during the data analysis (Liu et al. Reference Liu, Pelosi and Guala2019, p. 2672). To resolve this problem, we adopt the result of (4.6b) rather than the ‘filtered’ value for $u_a^{\ast }$. Therefore, the reference velocity is calculated by
 \begin{equation} u_0^{{\ast}}= \frac{L_a^{{\ast}}}{T_a^{{\ast}}}-u_c^{{\ast}}. \end{equation}
 Next, we need to calculate  $\varGamma ^{\ast }$ in the deposition boundary condition (2.5), which is now changed to
 \begin{equation} k_0^{{\ast}} \,\mathrm{e}^{u_c^{{\ast}}/{u_0^{{\ast}}}} \left. \frac{\partial P^{{\ast}}}{\partial u^{{\ast}}} \right|_{u^{{\ast}} = u_c^{{\ast}}} = \varGamma^{{\ast}} P^{{\ast}} |_{u^{{\ast}} = u_c^{{\ast}}}, \end{equation}
due to the introduced cutoff velocity. Fortunately, we can make a velocity translation ( $u'^{\ast }=u^{\ast }-u^{\ast }_c$) to handle this issue, so that the corresponding analytical procedure remains nearly the same as before. Details of the derivation are presented in Appendix C. Note that by (C7), the relationship in (4.7) is now generalized as
 \begin{align} \varGamma^{{\ast}}&= \frac{u_a^{{\ast}} - u_c^{{\ast}}}{T_a^{{\ast}}} = u_a^{{\ast}} \frac{u_a^{{\ast}} - u_c^{{\ast}}}{L_a^{{\ast}}} \end{align}
 \begin{align} &= \frac{L^{{\ast}}_a}{(T_a^{{\ast}})^2} - \frac{u_c^{{\ast}}}{T_a^{{\ast}}}, \end{align}
after the introduction of the cutoff velocity. We eventually calculated  $\varGamma ^{\ast }$ based on (5.3b).
For the velocity diffusive coefficient  $k_0^{\ast }$, we can use the experimental statistics of the acceleration distribution. Note that the acceleration distribution depends on the time step $\Delta t^{\ast }$ used for measurements or numerical simulations. In the experiments of Liu et al. (Reference Liu, Pelosi and Guala2019), the time step $\Delta t^{\ast }=1/120$ is small enough and we can use the Euler–Maruyama scheme to approximate the acceleration distribution, as presented in Appendix D. By (D17), $k_0^{\ast }$ can be approximated by
 \begin{equation} k_0^{{\ast}} = \frac{\rm \pi}{32} \Delta t^{{\ast}} (a_{{std}}^{{\ast}})^2 \, \mathrm{e}^{{-}u_c^{{\ast}}/u_0^{{\ast}}}. \end{equation}
5.2. Comparison of results under different flow rates
With all model parameters determined (see table 2), we can obtain the analytical expressions for the three key characteristics and compare them with the experimental results of Liu et al. (Reference Liu, Pelosi and Guala2019). We also adopted the first ten eigenvalues and eigenfunctions for the analysis, the same as that in § 4.1.
Comparisons for the p.d.f.s of the travel times and hop distances for the four different flow rates are shown in figure 8. Although the analytical results can largely capture the shapes of the experimentally determined p.d.f.s, there are observable discrepancies especially for small travel times and short hop distances. The fact that the number of measured short hop events is much smaller than the expected value is probably due to the same reason as discussed in § 4.1.1. Apart from the ‘unavoidable uncertainties in the automated particle-tracking process’ as mentioned by Liu et al. (Reference Liu, Pelosi and Guala2019), another possible reason is that Liu et al. (Reference Liu, Pelosi and Guala2019) ‘further and significantly restricted the whole datasets to long particle trajectories, with integrated displacement over  $10 D_{50}$, and experiencing at least one step-stop-step sequence of motion and rest’. Consequently, a large number of short trajectories were expected to be filtered during the data analysis, resulting in an underestimate of the proportion for short hop distances with small travel times.
The p.d.f.s of (a,c,e,g) travel times  $f_T$ and (b,d, f,h) hop distances $f_L$ for the four experimental groups of Liu et al. (Reference Liu, Pelosi and Guala2019). Experiments under flow rates from the low to high: S2 (a,b), S3 (c,d), S4 (e, f) and S5 (g,h).

For the mean hop distance over travel time  $L(t)$, the analytical results show good agreement with the experimental results for all the four different flow rates, as shown in figure 9. Although the analytical result overestimated the portion of p.d.f.s for small travel times and short distances in figure 8, this theoretical model captures well the result of the mean hop distances during travel times spanning over two orders of magnitude, which is calculated for each travel time interval by dividing the measurements into bins. Since these bin statistics do not reflect the proportion (or relative magnitude) of hops travelling with different time periods, the result of the mean hop distance in figure 9 shows that the analytical model can correctly predict the information of, on average, how long a distance a particle can travel during the hop with a specific travel time.
Mean hop distance over travel time  $L(t)$ for the four experimental groups of Liu et al. (Reference Liu, Pelosi and Guala2019). Experiments under flow rates from the low to high: S2 (a), S3 (b), S4 (c) and S5 (d).

The influence of flow condition on the p.d.f. of travel times and hop distances has been discussed by Liu et al. (Reference Liu, Pelosi and Guala2019). Here, we focus on its effect on the deposition rate. We have estimated  $\varGamma ^{\ast }$ by (5.3b) using $T_a^{\ast }$ and $L_a^{\ast }$. Table 2 and figure 8 show that the travel time distribution is insensitive to the flow rate, as reported by Liu et al. (Reference Liu, Pelosi and Guala2019), while the average hop distance increases with the flow rate. Therefore, informed by (5.3b), we know that the deposition rate may also grow as the flow rate increases, although the value of $\varGamma ^{\ast }$ for experiment S2 is larger than that of S3 because $T_a^{\ast }={0.12}\ \textrm {s}$ of S2 is the smallest. This overall increasing tendency of $\varGamma ^{\ast }$ over the flow rate for S3–S5 is rather counter-intuitive because it is expected that the deposition effect should be weakened as the bed shear stress increases. This can be explained by the fact that the velocity diffusion coefficient also increases with the flow rate. Therefore, to quantify the net effect of deposition, we introduce a new parameter according to the stopping probability in (2.6)
 \begin{equation} f^{{\ast}}_d \triangleq \frac{(\varGamma^{{\ast}})^2}{k_0'^{{\ast}}} =\frac{(\varGamma^{{\ast}})^2}{k_0^{{\ast}} \, \mathrm{e}^{u^{{\ast}}_c / u_0^{{\ast}}}}, \end{equation}
based on the deposition boundary condition (5.2). The unit of  $f^{\ast }_d$ is s $^{-1}$ and thus we call $f^{\ast }_d$ the deposition frequency, which can reflect the stopping possibility of the deposition event. As a result, as shown in table 2, $f^{\ast }_d$ decreases as the flow rate increases as expected for S3–S5. However, due to a lack of systematic experimental studies, at this stage, we cannot draw any further conclusions on the relation between the deposition frequency and the flow rate.
6. Concluding remarks
For the statistics of bedload particle hops in subcritical flows, this work has provided a full analytical consideration of the numerical simulations of Wu et al. (Reference Wu, Furbish and Foufoula-Georgiou2020) based on the experimental data of Fathel et al. (Reference Fathel, Furbish and Schmeeckle2015), and the obtained analytical solutions are further validated by experimental observations with a quite different bedload particle diameter and transport conditions (Liu et al. Reference Liu, Pelosi and Guala2019). To bridge the gap between the continuum model and the individual-based simulation, a deposition boundary condition for the governing FP equation is specified according to the numerical algorithm and experimental measurements for the first time. It is a simple Robin boundary condition, with an important parameter representing the deposition rate of bedload particles, which is similar to the stopping chance for the numerical simulation. We have analytically shown that the newly introduced physical parameter of deposition rate is inversely proportional to the mean travel time or the mean hop distance, enabling a direct determination of the deposition rate based on the measured particle motion statistics. This is in contrast to the previous numerical simulation (Wu et al. Reference Wu, Furbish and Foufoula-Georgiou2020) using a fitting procedure matching the predicted quantities to the measurements for determining the stopping chance.
We have provided an analytical method to obtain theoretical results for particle hop statistics. The key is to treat the exponentially velocity-dependent diffusivity, which was determined by Wu et al. (Reference Wu, Furbish and Foufoula-Georgiou2020) during a reanalysis of the experimental data (Fathel et al. Reference Fathel, Furbish and Schmeeckle2015). We have devised a variable transformation such that the original bedload transport problem can be transformed into a simple problem of solute transport in laminar flow through a tube with a constant diffusivity. We can then directly use the classic analytical technique of Barton (Reference Barton1983) for solutions.
We have validated our analytical solutions using the numerical results of Wu et al. (Reference Wu, Furbish and Foufoula-Georgiou2020), and the experimental results of Roseberry et al. (Reference Roseberry, Schmeeckle and Furbish2012) (reanalysed by Fathel et al. Reference Fathel, Furbish and Schmeeckle2015) and that of Liu et al. (Reference Liu, Pelosi and Guala2019). Then we investigate the influence of the deposition rate on three key characteristics of hop events: the p.d.f.s of travel times ( $f_T (t)$) and hop distances ( $f_L(x)$), and the mean hop distance over travel time ( $L (t)$), which are derived using the spatial and temporal moments with Taylor–Aris theory. It is found that a larger deposition rate can result in a longer mean hop distance over travel time, which can be counter-intuitive at first glance. From the limited experimental dataset under different flow rates, it is observed that the deposition frequency decreases as the shear stress increases when the flow rate is not small.
We emphasize that the theoretical framework of this present paper is different from the earlier work of Wu et al. (Reference Wu, Singh, Foufoula-Georgiou, Guala, Fu and Wang2021) mainly in the following two aspects. First, Wu et al. (Reference Wu, Singh, Foufoula-Georgiou, Guala, Fu and Wang2021) imposed a fundamental assumption on the pattern for the particle velocity variations (i.e. the particle is performing a Brownian motion in the stretched velocity dimension), which can be regarded as a certain simplification based on the general form of the FP equation (Furbish et al. Reference Furbish, Roseberry and Schmeeckle2012b). Instead, the present work directly used the general form of the FP equation with experimentally determined drift and diffusivity terms according to their definitions (Furbish et al. Reference Furbish, Roseberry and Schmeeckle2012b; Wu et al. Reference Wu, Furbish and Foufoula-Georgiou2020). No further simplification is required. Second, regarding the governing equations deduced in the two papers, the present work can describe the solute transport process in a tube flow (under a cylindrical coordinate system) as reflected by (3.4) and figure 2, while Wu et al. (Reference Wu, Singh, Foufoula-Georgiou, Guala, Fu and Wang2021) describes a process under a Cartesian coordinate system.
The FP equation proposed by Furbish et al. (Reference Furbish, Roseberry and Schmeeckle2012b) is noted in this paper as a ‘general form’ in the sense that the forms of the drift and the diffusivity terms in the equation are open and can be arbitrary functions of the particle velocity based on experimental observations. Although specific forms have been used in the literature, including linear or constant drift and diffusivity, for example, the set of terms with a zero drift and an exponential form of diffusivity as presented in (2.2a,b) is one of the limited sets of results that have been directly determined based on the available experimental datasets of particle kinematics. This spells out the value of the present analytical work, while at the same time points out also the limitations and possible extensions in the future. For example, it remains to be seen how the forms of the two terms vary with the transport conditions, and if there exists a general form of the drift and diffusivity that can be applied to both subcritical and supercritical flows.
Regarding the velocity boundary condition for the governing FP equation, the deposition condition (2.5) is of the simplest possible form to account for the termination of bedload particle hops. Although this boundary condition is widely used in reactive transport problems, it may not be the most appropriate condition for bedload transport problems. As discussed in the results section, there is a noticeable deviation of both the analytical and numerical results from the experimental measurements for the p.d.f. of travel times at small values (figure 3), and in this region the curves for the analytical and numerical results decrease more quickly than the exponential distribution. This suggests that a modification to the deposition condition may be needed. Recently, Wu et al. (Reference Wu, Singh, Foufoula-Georgiou, Guala, Fu and Wang2021, (2.29)) applied a ‘bulk’ absorption term to the FP equation to account for the deposition, which means that bedload particles may have an equal chance of ceasing their motions at any velocity (Ancey et al. Reference Ancey, Davison, Böhm, Jodeau and Frey2008; Ma et al. Reference Ma, Heyman, Fu, Mettra, Ancey and Parker2014; Wu et al. Reference Wu, Singh, Foufoula-Georgiou, Guala, Fu and Wang2021; Pierce et al. Reference Pierce, Hassan and Ferreira2022). Alternatives such as the time-fractional deposition process (Li et al. Reference Li, Chen, Sun, Meng, Zhang and Sibatov2021) may also be considered.
Moreover, this work focuses only on the hop processes of the bedload particle transport. With the resting times taken into account, bedload particle transport across time scales can be analysed which contains multiple alternating processes of particle hops and rests (entrainment and deposition) (Parker, Paola & Leclair Reference Parker, Paola and Leclair2000; Garcia Reference Garcia2008; Ancey & Heyman Reference Ancey and Heyman2014). And the p.d.f. of particle resting times is also closely related to the possible form of the boundary conditions. For example, some studies (Heyman et al. Reference Heyman, Mettra, Ma and Ancey2013) have suggested an exponential distribution of resting times and thus a similar entrainment condition to the deposition condition (a Poisson process). As a comparison, there are other studies (Martin et al. Reference Martin, Jerolmack and Schumer2012; Martin, Purohit & Jerolmack Reference Martin, Purohit and Jerolmack2014; Fraccarollo & Hassan Reference Fraccarollo and Hassan2019; Liu et al. Reference Liu, Pelosi and Guala2019; Pretzlav, Johnson & Bradley Reference Pretzlav, Johnson and Bradley2021) suggesting a power-law-like distribution for the resting times, although a simple form of the entrainment condition is not available yet. It is noted that, by incorporating other physical processes like the burial and exhumation of particles during their streamwise transport (Wu et al. Reference Wu, Foufoula-Georgiou, Parker, Singh, Fu and Wang2019a,Reference Wu, Singh, Fu and Wangb), the power-law-like resting time distribution can be recovered which consequently induces the anomalous diffusion of bedload particles. Future theoretical work should therefore include an appropriate entrainment condition for bedload transport models.
Funding
This work was partially supported by the National Natural Science Foundation of China (U2243222, U2243240, 52179067, and 52109093) and the Fund Program of State key Laboratory of Hydroscience and Engineering (2022-KY-04). W.J. acknowledges the support of China Postdoctoral Science Foundation (2021M701906 and 2022T150362) and the Shuimu Tsinghua Scholar Program.
Declaration of interests
The authors report no conflict of interest.
Appendix A. Solution procedure for spatial and temporal moments
A.1. Spatial moments for  $f_T$ and $L$


Here, we solve the spatial moment  $\mu _n$ for $f_T$ and $L$ in (3.7) and (3.9). First, according to the definition of moments (3.10a,b) and applying integration by parts to (3.4), we can obtain the initial-boundary-value problem for $\mu _n$ as
 $$\begin{gather} \frac{\partial \mu_n}{\partial t} - u(r) \mu_{n - 1} = \frac{1}{r} \frac{\partial}{\partial r} \left( r \frac{\partial \mu_n}{\partial r} \right) , \end{gather}$$
 $$\begin{gather}\left. \frac{\partial \mu_n}{\partial r} \right|_{r = 1} ={-} \varGamma \mu_n |_{r = 1}, \end{gather}$$
 $$\begin{gather}\mu_n |_{t = 0} = \begin{cases} \frac{1}{2} \delta (r - 1), & n = 0,\\ 0, & n = 1, 2, \ldots, \end{cases} \end{gather}$$
for  $n=0,1,2,\ldots$ and $\mu _{- 1} = \mu _{- 2} = 0$.
Next, we can write the eigenvalue problem for (A1)
 $$\begin{gather} \frac{1}{r} \frac{\partial}{\partial r} \left( r \frac{\partial g}{\partial r} \right) ={-} \lambda g, \end{gather}$$
 $$\begin{gather}\left. \frac{\partial g}{\partial r} \right|_{r = 1} ={-} \varGamma g|_{r = 1}, \end{gather}$$
where  $\lambda$ is the eigenvalue to be solved, and $g(r)$ is the corresponding eigenfunction. Their solutions are
 \begin{equation} \lambda_i = \alpha_i^2, \quad g_i (r) = \frac{\alpha_i {J}_0 (\alpha_i r)}{\sqrt{\alpha_i^2 + \varGamma^2} {J}_0 (\alpha_i)}, \end{equation}
where  ${J}_0$ is the zeroth-order Bessel function of the first kind and $\{ \lambda _i \}_{i = 0}^{\infty }$ are the roots of
 \begin{equation} \alpha_i {J}'_0 (\alpha_i) ={-} \varGamma {J}_0 (\alpha_i). \end{equation}
The first few eigenvalues are provided in table 3.
The first few eigenvalues and coefficients of initial conditions for spatial and temporal moments.

Here,  $\{ g_i(r) \}_{i = 0}^{\infty }$ forms a basis for the function space satisfying the boundary condition (A1b).
For  $\mu _0$, from (2.8) of Barton (Reference Barton1984), we have
 \begin{equation} \mu_0(r,t) = \sum_{i = 0}^{\infty} a_i \,\mathrm{e}^{- \lambda_i t} g_i (r), \end{equation}
where coefficient  $a_i$ is related to the initial condition
 \begin{equation} a_i = \langle \mu_0(r,t=0), g_i(r) \rangle = \frac{\alpha_i}{2 \sqrt{\alpha_i^2 + \varGamma^2}}, \quad i=0,1,\ldots, \end{equation}
and the angle brackets define the inner product:
 \begin{equation} \langle f_1, f_2 \rangle \triangleq \int^1_0 r f_1(r) f_2(r) \, \mathrm{d}r, \end{equation}
where  $f_1(r)$ and $f_2(r)$ are arbitrary functions. The values of the first few $a_i$ are presented in table 3.
For  $\mu _1$, by (2.9) of Barton (Reference Barton1984) we have
 \begin{equation} \mu_1(r,t) = \sum^{\infty}_{i = 0} a_i B_{i, i} t \,\mathrm{e}^{- \lambda_i t} g_i(r) + \sum^{\infty}_{\substack{i,j=0 \\ j \neq i}} \frac{a_j B_{i, j} (\mathrm{e}^{- \lambda_j t} - \mathrm{e}^{- \lambda_i t})}{\lambda_i - \lambda_j} g_i(r), \end{equation}
where coefficient  $B_{i, j}$ is related to $u(r)$ and can be calculated as
 \begin{equation} B_{i, j} = \langle u(r) g_i (r), g_j (r) \rangle = \langle - 2 \ln r g_i (r), g_j (r) \rangle, \end{equation}
for  $i,j=0,1,\ldots$.
A.2. Temporal moments for $f_L$

Here, we solve the temporal moment  $m_0$ for $f_L$ in (3.8). First, according to the definition (3.10a,b) and applying the integration by parts to (3.4), the governing equation of $m_n$ is
 \begin{equation} -\delta_{0 n} c |_{t = 0} - n m_{n-1} + u(r) \frac{\partial m_n}{\partial x} = \frac{1}{r} \frac{\partial}{\partial r} \left( r \frac{\partial m_n}{\partial r} \right) , \end{equation}
for  $n=0, 1,2, \ldots$ and $\delta _{i j}$ is the Kronecker delta. The boundary condition of $m_n$ is in the same form as (3.4b).
Note that in the initial condition (3.4c),  $c_{{init}}$ is a Dirac delta function of $x$. Therefore, we can rewrite the problem of $m_n$ as
 $$\begin{gather} \frac{\partial m_n}{\partial x} - \frac{1}{u (r)} n m_{n - 1} = \frac{1}{u (r)} \frac{1}{r} \frac{\partial}{\partial r} \left( r \frac{\partial m_n}{\partial r} \right) , \end{gather}$$
 $$\begin{gather}\left. \frac{\partial m_n}{\partial r} \right|_{r = 1} ={-} \varGamma m_n |_{r = 1}, \end{gather}$$
 $$\begin{gather}m_n |_{x = 0} = \begin{cases} \dfrac{1}{2 u(r)} \delta (r - 1), & n = 0,\\ 0, & n = 1, 2, \ldots. \end{cases} \end{gather}$$
Now we can see that the above initial-boundary-value problem of  $m_n$ is very similar to (A1) of $\mu _n$, and we can also use the method of Barton (Reference Barton1983, Reference Barton1984) for the analytical solution.
The corresponding eigenvalue problem for (A11) is
 $$\begin{gather} \frac{1}{u (r)} \frac{1}{r} \frac{\partial}{\partial r} \left( r \frac{\partial h}{\partial r} \right) ={-} \psi h, \end{gather}$$
 $$\begin{gather}\left. \frac{\partial h}{\partial r} \right|_{r = 1} ={-} \varGamma h|_{r = 1}, \end{gather}$$
where  $\psi$ is the eigenvalue and $h(r)$ is its eigenfunction. The inner product is defined as
 \begin{equation} \langle f_1, f_2 \rangle_T \triangleq \int^1_0 r u (r) f_1(r) f_2(r) \, \mathrm{d} r, \end{equation}
where  $f_1(r)$ and $f_2(r)$ are arbitrary functions.
Suppose we have found a sequence of solution of eigenvalues, denoted as  $\{ \psi _i \}_{i = 0}^{\infty }$, and the corresponding eigenfunctions $\{ h_i \}_{i = 0}^{\infty }$. Then, similar to (A5), by (2.8) of Barton (Reference Barton1984), we have
 \begin{equation} m_0(x, r) = \sum_{i = 0}^{\infty} b_i \,\mathrm{e}^{- \psi_i x} h_i (r), \end{equation}
where the coefficient  $b_i$ is
 \begin{equation} b_i = \langle m_0(x=0, r), h_i(r) \rangle_T = \frac{h_i(1)}{2}, \quad i=0,1,\ldots. \end{equation}
The values of the first few  $b_i$ are presented in table 3.
Next, we solve the eigenvalue problem (A12) by the GITT method (Cotta Reference Cotta1993; Rubol, Battiato & de Barros Reference Rubol, Battiato and de Barros2016; Guo & Chen Reference Guo and Chen2022) because the diffusion term contains  $u(r)$, which makes it more complicated than (A2). Fortunately, we can use the function basis $\{ g_i(r) \}_{i = 0}^{\infty }$ by (A2), and perform a series expansion for $h_i(r)$ using the GITT method
 \begin{equation} h_i(r) = \sum_{j = 0}^{\infty} \eta_{i j} g_j(r), \quad i=0,1,\ldots, \end{equation}
where  $\eta _{i j}$ is the expansion coefficient. We can also express the results in the matrix form. Defining $\boldsymbol {\eta }_i = (\eta _{i 0}, \eta _{i 1}, \cdots )^{\textrm {T}}$ and $\boldsymbol {g} = (g_{0}, g_{1}, \cdots )^{\textrm {T}}$, then $h_i = \boldsymbol {\eta }_i^{\textrm {T}} \boldsymbol {g}$, where $\textrm {T}$ denotes the transpose. Performing the integral transform for (A12a), we obtain the linear equation for the coefficient vector $\boldsymbol {\eta }$
 \begin{equation} {\boldsymbol{A}}{\boldsymbol{\eta}}_i= \psi_i {\boldsymbol{\eta}}_i, \end{equation}
where the elements of matrix  $\boldsymbol{\mathsf{A}}$ are
 \begin{equation} A_{i j} = \left\langle g_i, \frac{1}{u (r)} \frac{1}{r} \frac{\partial}{\partial r} \left( r \frac{\partial g_j}{\partial r} \right) \right\rangle_T. \end{equation}
Therefore,  $\psi _i$ is the eigenvalue of $\boldsymbol{\mathsf{A}}$ and $\boldsymbol {\eta }_i$ is the corresponding eigenvector, which can be obtained after a truncation for the series expansion (A16) to some degree. The first few $\psi _i$ are presented in table 3. Finally, we remark that one can also apply the GITT method directly to (A10) and thus expand $m_0$ with the function basis $\{ g_i(r) \}_{i = 0}^{\infty }$. A similar solution procedure was presented in the work of Rubol et al. (Reference Rubol, Battiato and de Barros2016, (12)).
Appendix B. Solution for universal moments
According to the definition (4.3) of the universal moment, the governing equations for  $M_{n, m}$ can be obtain by applying the integration by parts to (A1) or (A10)
 $$\begin{gather} - \delta_{0 m} \mu_n |_{t = 0} - M_{n, m - 1} - u (r) M_{n - 1, m} = \frac{1}{r} \frac{\partial}{\partial r} \left( r \frac{\partial M_{n, m}}{\partial r} \right), \end{gather}$$
 $$\begin{gather}\left. \frac{\partial M_{n, m}}{\partial r} \right|_{r = 1} ={-} \varGamma M_{n, m} |_{r = 1} , \end{gather}$$
for  $n = 0, 1, 2, \ldots$ and $m = 0, 1, 2, \ldots$. Here, $M_{-1, 0}$, $M_{-1, -1}$ and $M_{0, - 1}$ all equal to zero. By calculating the cross-sectional mean of $M_{n, m}$ with respect to $r$, which is
 \begin{equation} \bar{M}_{n, m} = \int^1_0 2 r M_{n, m} (r) \, \mathrm{d} r, \end{equation}
we immediately have
 \begin{equation} - \delta_{0 m} \overline{\mu_n} |_{t = 0} - \bar{M}_{n, m - 1} - \overline{u (r) M_{n - 1, m}} = 2 \varGamma M_{n, m} |_{r = 1}. \end{equation}
 According to (4.1) and (4.2), the mean travel time  $T_a$ and the mean hop distance $L_a$ are related to $M_{0, 1}$ and $M_{1,0}$, respectively. Now with (B3), we have
 \begin{equation} T_a = 2 \varGamma M_{0, 1} |_{r = 1} =\bar{M}_{0, 0}, \quad L_a = 2 \varGamma M_{1, 0} |_{r = 1} = \overline{- u (r) M_{0, 0}}. \end{equation}
Therefore, we only need to solve  $M_{0, 0}$.
By (B1a), the governing equation of  $M_{0, 0}$ is
 \begin{equation} - \mu_0 |_{t = 0} = \frac{1}{r} \frac{\partial}{\partial r} \left( r \frac{\partial M_{0, 0}}{\partial r} \right). \end{equation}
Its general solution can be written as
 \begin{equation} M_{0, 0} = \int^r_0 \frac{1}{r''} \left( \int^{r''}_0 - r' \mu_0 (r, t = 0) \, \mathrm{d} r' + A \right) \, \mathrm{d} r'' + B, \end{equation}
where  $A$ and $B$ are undetermined constants. Note that $A = 0$ because $\ln r |_{r = 0} = - \infty$. And the initial condition (A1c) of $\mu _0$ is a delta function. Therefore,
 \begin{align} M_{0, 0} (r) & = \int^r_0 \frac{1}{r''} \left( \int^{r''}_0 - r' \mu_0 (r, t = 0) \, \mathrm{d} r' \right) \, \mathrm{d} r'' + B \nonumber\\ & ={-} \int^r_0 \frac{1}{r''} \frac{H (r'' - 1)}{2} \, \mathrm{d} r'' + B\nonumber\\ & ={-} \frac{1}{2} H (r - 1) \ln r + B, \end{align}
where  $H (r)$ is the Heaviside step function. According to the boundary condition (B1b), we have
 \begin{equation} - \tfrac{1}{2} ={-} \varGamma B, \end{equation}
namely  $B = 1 / (2 \varGamma )$.
Appendix C. Deposition condition with a cutoff velocity
If one imposes the cutoff velocity to determine the resting state, then the deposition condition for the bedload particle hops should be modified, as presented in (5.2). The initial condition (2.4) also needs modification
 \begin{equation} P^{{\ast}}_{{init}} = \delta (x^{{\ast}}) \delta(u^{{\ast}}-u_c^{{\ast}}). \end{equation}
 To handle the cutoff velocity, we impose the velocity translation,  $u'^{\ast }=u^{\ast }-u_c^{\ast }$. Then, with a modified velocity diffusion coefficient
 \begin{equation} {k_0'^{{\ast}}} \triangleq k^{{\ast}}_0 \,\mathrm{e}^{u_c^{{\ast}} / u_0^{{\ast}}}, \end{equation}
the transformed bedload transport problem,
 $$\begin{gather} \frac{\partial P^{{\ast}}}{\partial t^{{\ast}}} + \left( {u'^{{\ast}}} + u_c^{{\ast}} \right) \frac{\partial P^{{\ast}}}{\partial x^{{\ast}}} = \frac{\partial^2}{\partial {u'^{{\ast}}}^2} {(k_0'^{{\ast}}} \,\mathrm{e}^{{u'^{{\ast}}} / u_0^{{\ast}}} P^{{\ast}}), \end{gather}$$
 $$\begin{gather}{k_0'^{{\ast}}} \left. \frac{\partial P^{{\ast}}}{\partial {u'^{{\ast}}}} \right|_{{u'^{{\ast}}} = 0} = \varGamma^{{\ast}} P^{{\ast}} |_{{u'^{{\ast}}} = 0}, \end{gather}$$
 $$\begin{gather}P^{{\ast}}_{{init}} = \delta (x^{{\ast}}) \delta(u'^{{\ast}}), \end{gather}$$
is nearly in the same form as the original one (2.3)–(2.5), with only a slight difference in the advection term. Therefore, we can still use the dimensionless variables and parameters in (3.1), and then introduce the transformation for the exponential diffusivity term in (3.3a,b), replacing  $u^{\ast }$ and $k_0^{\ast }$ with $u'{\ast }$ and $k_0'^{\ast }$, respectively. We can change the advective term in (3.4a) to have
 \begin{equation} \frac{\partial c}{\partial t} + [u'(r)+u_c] \frac{\partial c}{\partial x} = \frac{1}{r} \frac{\partial}{\partial r} \left( r \frac{\partial c}{\partial r} \right), \end{equation}
where the dimensionless cutoff velocity  $u_c = u_c^{\ast }/u_0^{\ast }$. In fact, we can also keep using the original transport problem for $c$ with a different definition for the ‘velocity profile’ $u(r) = -2 \ln r + u_c$. Then the analytical solution procedure for the spatial and temporal moments are exactly the same.
We have the following results for the hop statistics. First, the p.d.f. of particle velocities under the equilibrium transport conditions now becomes
 \begin{equation} f_U^{{\ast}}(u^{{\ast}}) = \frac{1}{u_0^{{\ast}}} \,\mathrm{e}^{- ({u^{{\ast}} - u_c^{{\ast}}})/{u_0^{{\ast}}}}, \end{equation}
and thus  $\int ^{\infty }_{u_c^{\ast }} f_U^{\ast }(u^{\ast })\, \mathrm {d} u^{\ast } = 1$. The average velocity is
 \begin{equation} \frac{L_a^{{\ast}}}{T_a^{{\ast}}} = u_a^{{\ast}} = \int^{\infty}_{u_c^{{\ast}}} u^{{\ast}} f_U^{{\ast}}(u^{{\ast}}) \, \mathrm{d} u^{{\ast}} = u_0^{{\ast}} + u_c^{{\ast}}. \end{equation}
For the average travel time and average hop distance, the relationship (4.6) is changed to
 $$\begin{gather} T_a^{{\ast}} =\frac{u_0^{{\ast}}}{\varGamma^{{\ast}}}= \frac{u_a^{{\ast}}-u_c^{{\ast}}}{\varGamma^{{\ast}}}, \end{gather}$$
 $$\begin{gather}L_a^{{\ast}} =u_a^{{\ast}} {T_a^{{\ast}}} = (u_0^{{\ast}} + u_c^{{\ast}}) \frac{u_0^{{\ast}}}{\varGamma^{{\ast}}}. \end{gather}$$
Appendix D. Acceleration distribution
We can use the Euler–Maruyama scheme for discrete SDEs to approximate the p.d.f. of accelerations with a small time step. First, the Euler–Maruyama approximation of (2.1b) is
 \begin{equation} A \approx \frac{\Delta U}{\Delta t^{\ast}} \approx \frac{\sqrt{2 k^{\ast} (U) \Delta t^{\ast}} \Delta \xi^{\ast}}{\Delta t} \end{equation}
where  $A$ is the random variable of acceleration $a^{\ast }$, $U$ is the random variable of velocity $u^{\ast }$ and $\Delta \xi ^{\ast } \sim N (0, 1)$ follows the standard normal distribution. The time step $\Delta t^{\ast }$ should be small enough (Miao et al. Reference Miao, Cao, Zhong and Li2018).
Next, we write  $A^{\ast }$ as a product of three factors
 \begin{equation} A = \sqrt{\frac{2 k_0^{{\ast}}}{\Delta t^{{\ast}}}} A_1 A_2 = \sqrt{\frac{2 k_0^{{\ast}}}{\Delta t^{{\ast}}}} Z , \end{equation}
where  $Z=A_1 A_2$,
 \begin{equation} A_1(U) = \sqrt{\frac{k^{{\ast}} (U)}{k_0^{{\ast}}}}=\mathrm{e}^{{U}/{2 u_0^{{\ast}}}}, \end{equation}
and  $A_2 = \Delta \xi ^{\ast }$. Note that $A_1$ is a function $U$ and $U \sim {Exp}(1/u_0^{\ast })$ follows an exponential distribution (because the velocity distribution is exponential Wu et al. Reference Wu, Furbish and Foufoula-Georgiou2020). With the inverse function $U(A_1)=2 u_0^{\ast } \ln (A_1)$, the p.d.f. of $A_1$ is
 \begin{align} f_{A_1} (a_1) & = f^{{\ast}}_U [u^{{\ast}} (a_1)] \left| \frac{\mathrm{d} U}{\mathrm{d} A_1} \right| \end{align}
 \begin{align} & = \frac{1}{u_0^{{\ast}}} \exp \left( - \frac{u^{{\ast}} (a_1)}{u_0^{{\ast}}} \right) \left| \frac{2 u_0^{{\ast}}}{a_1} \right| \end{align}
 \begin{align} & = \frac{1}{u_0^{{\ast}}} \exp \left( - \frac{2 u_0^{{\ast}} \ln a_1}{u_0^{{\ast}}} \right) \left| \frac{2 u_0^{{\ast}}}{a_1} \right| \end{align}
 \begin{align} & = \frac{1}{u_0^{{\ast}}} \frac{1}{a_1^2} \left| \frac{2 u_0^{{\ast}}}{a_1} \right| \end{align}
 \begin{align} & = \frac{2}{a_1^3} . \end{align}
The p.d.f. of  $A_2$ is Gaussian,
 \begin{equation} f_{A_2}(a_2) = \frac{1}{\sqrt{2 {\rm \pi}}} \exp \left( - \frac{a_2^2}{2} \right). \end{equation}
According to rules for the joint p.d.f. of the product of two independent random variables, for  $Z=A_1 A_2$, we have
 \begin{equation} f_Z (z) = f_{A_1 A_2} (z) = \int^{\infty}_{- \infty} \frac{1}{|a_2 |} f_{A_2} (a_2) f_{A_1} \left( \frac{z}{a_2} \right) \, \mathrm{d} a_2 . \end{equation}
Note that  $A_1 \in [1, + \infty )$, then
 \begin{equation} f_{A_1 A_2} (z) = \int^z_{- z} \frac{1}{\sqrt{2 {\rm \pi}}} \,\mathrm{e}^{-{a_2^2}/{2}} \frac{1}{|a_2 |} \left( \frac{2 a_2^3}{z^3} \right)\,\mathrm{d} a_2 . \end{equation}
For  $z > 0$, we have
 \begin{align} f_{A_1 A_2} (z) & = \int^z_0 \frac{1}{\sqrt{2 {\rm \pi}}} \,\mathrm{e}^{-{a_2^2}/{2}} \frac{1}{|a_2 |} \left( \frac{2 a_2^3}{z^3} \right)\, \mathrm{d} a_2\nonumber\\ & = \frac{2}{\sqrt{2 {\rm \pi}}} \frac{1}{z^3} \int^z_0 a_2^2 \,\mathrm{e}^{-{a_2^2}/{2}} \,\mathrm{d} a_2\nonumber\\ & = \frac{2}{\sqrt{2 {\rm \pi}}} \frac{1}{z^3} \left[ - z \,\mathrm{e}^{-{z^2}/{2}} + \sqrt{\frac{\rm \pi}{2}} \,{Erf} \left( \frac{z}{\sqrt{2}}\right) \right]\nonumber\\ & = \frac{1}{z^3} \, {Erf} \left( \frac{z}{\sqrt{2}} \right) - \frac{\sqrt{2}}{\sqrt{\rm \pi}} \frac{1}{z^2} \,\mathrm{e}^{-{z^2}/{2}}, \end{align}
where  ${Erf}$ is the error function. Note that $f_Z (z)$ is an even function. Finally, for the acceleration in (D2), we just need to put in the constant factor $\sqrt {{2 k_0^{\ast }}/{\Delta t^{\ast }}}$
 \begin{equation} f_A (a^{{\ast}}) = \frac{1}{\sqrt{{2 k_0^{{\ast}}}/{\Delta t^{{\ast}}}}} f_{A_1 A_2} \left( \frac{a^{{\ast}}}{\sqrt{{2 k_0^{{\ast}}}/{\Delta t^{{\ast}}}}} \right) . \end{equation}
 Note that the above approximated form for the p.d.f. of acceleration is complicated. In practice, the simple Laplace distribution ( ${Laplace}(0, b)$) is a more common choice for approximation (Wu et al. Reference Wu, Furbish and Foufoula-Georgiou2020). As shown in figure 10, the Laplace distribution even gives a better prediction than that by the numerical approximation (D13). The mean of the absolute of acceleration (mean absolute deviation, $a_{{mad}}^{\ast }$) or the standard deviation of acceleration ( $a_{{std}}^{\ast }$) is useful for the estimation of the parameter $b$. Using the property of independent distributions, we have
 \begin{align} a_{{mad}}^{{\ast}} = \mu_{|A|} & = \sqrt{\frac{2 k_0^{{\ast}}}{\Delta t^{{\ast}}}} \mu_{|A_2|} \mu_{|A_1 |}\nonumber\\ & = \sqrt{\frac{2 k_0^{{\ast}}}{\Delta t^{{\ast}}}} \left[ \int^{\infty}_0 \sqrt{\frac{k (u^{{\ast}})}{k_0^{{\ast}}}} f^{{\ast}}_U (u^{{\ast}}) \, \mathrm{d} u^{{\ast}} \right] \left[ 2 \int^{\infty}_0 a_2 \frac{1}{\sqrt{2 {\rm \pi}}} \,\mathrm{e}^{-{a_2^2}/{2}} \, \mathrm{d} a_2 \right]\nonumber\\ & = \sqrt{\frac{2 k_0^{{\ast}}}{\Delta t^{{\ast}}}} \left( \int^{\infty}_0 \,\mathrm{e}^{{u^{{\ast}}}/{2 u^{{\ast}}_0}} \frac{1}{u^{{\ast}}_0}\, \mathrm{e}^{{- u^{{\ast}}}/{u^{{\ast}}_0}} \, \mathrm{d} u^{{\ast}} \right) 2 \frac{1}{\sqrt{2 {\rm \pi}}}\nonumber\\ & = 4 \sqrt{\frac{k_0^{{\ast}}}{{\rm \pi} \Delta t^{{\ast}}}}. \end{align}
Note that the mean absolute deviation of  ${Laplace}(0, b)$ is $b$ and thus
 \begin{equation} b = 4 \sqrt{\frac{k_0^{{\ast}}}{{\rm \pi} \Delta t^{{\ast}}}} . \end{equation}
If one uses the standard deviation of acceleration, note that the standard deviation of  $A_1$ does not exist probably because (D1) is only a first-order approximation. Thus, we have to use the Laplace distribution as an approximation and the variance $(a_{{std}}^{\ast })^2=2b^2$. Together with (D15), we have
 \begin{equation} k_0^{{\ast}} = \tfrac{1}{32} {\rm \pi}\Delta t^{{\ast}} (a_{{std}}^{{\ast}})^2. \end{equation}
Comparison of p.d.f. of acceleration for experiment S5 of Liu et al. (Reference Liu, Pelosi and Guala2019). ‘Approximation’ represents the solution by (D13).

Finally, if one imposes the cutoff velocity, the analysis is similar after we make the translation  $u'^{\ast }=u^{\ast }-u_c^{\ast }$, as presented in § C. We just need to replace $u^{\ast }$ and $k_0^{\ast }$ in (D14) with $u'^{\ast }$ and $k_0'^{\ast }$ (defined in (C2)), respectively. Then, (D16) is generalized for the presence of the cutoff velocity as
 \begin{equation} k_0^{{\ast}} \,\mathrm{e}^{u_c^{{\ast}} / u_0^{{\ast}}} = k_0'^{{\ast}} = \tfrac{1}{32} {\rm \pi}\Delta t^{{\ast}} (a_{{std}}^{{\ast}})^2. \end{equation}


 Open access

