


1. Introduction
New spectroscopic observational capabilities enabled by next-generation X-ray satellite telescopes will allow us to study exotic astrophysical systems at unprecedented resolution. The X-Ray Imaging and Spectroscopy Mission (XRISM) (Tashiro et al. Reference Tashiro2025) is expected to deliver 5 eV spectral resolution at 6 keV, and NewAthena (Barret et al. Reference Barret, den Herder, Nikzad and Nakazawa2018) will provide 2.5 eV resolution up to 7 keV (Hell et al. Reference Hell, Beiersdorfer, Brown, Eckart, Kelley, Kilbourne, Leutenegger, Lockard, Porter and Wilms2020; García et al. Reference García, Dauser, Ludlam, Parker, Fabian, Harrison and Wilms2022). These observatories will be equipped with X-ray microcalorimeters and larger collection areas that will simultaneously provide high spectral and spatial resolution. Proposed missions such as Lynx (gratings and a calorimeter) would extend observational capabilities even further by reaching sub-eV spectral resolution at softer energies below 1 keV (The Lynx Team 2018). The data will enable investigation of previously inaccessible regimes and will likely provide new and remarkable physical insight into plasma characteristics and hydrodynamical structure and evolution of extended X-ray sources such as supernova remnants, galaxy clusters and compact sources such as active galactic nuclei.
Astrophysical observations of emission from a mixture of elements and a range of ionisation states require accurate transition line energies to correctly interpret the data. The observed spectra can be used in different ways depending on the information one hopes to extract. For example, the strengths of different spectral lines can be used to infer plasma characteristics such as the ionisation distribution (or charge state distribution) or elemental composition. Similarly, line ratios (which are directly linked to population ratios) can be used to infer temperature. Information about the ionisation flux required to produce a given charge state distribution can also be extracted from the spectrum. Additionally, differences in observed energies of line features due to Doppler shifts enable inferences about the structure and velocities of different components of a system. The quality of all of these inferences is tied either directly or indirectly to the line locations and accurate identification of spectroscopic features. The inferences cannot be trusted unless the lines are correctly identified to begin with.
In particular, silicon, being astrophysically abundant, provides many opportunities for varied analyses. Structural and velocity analysis has been done for high-mass X-ray binaries using silicon lines, and kinematic structure of outflows and ionisation conditions of the gas can be inferred in active galactic nuclei where silicon is observed (Hanke et al. Reference Hanke, Wilms, Nowak, Pottschmidt, Schulz and Lee2009; Miškovičová et al. Reference Miškovičová2016; Hirsch et al. Reference Hirsch2019; Holczer & Behar Reference Holczer and Behar2012; Netzer et al. Reference Netzer2003).
However, theoretical X-ray transition energies calculated using atomic structure codes populate various atomic databases and are largely untested due to experimental challenges. The ionisation and excitation regimes found in astrophysical X-ray sources are difficult to access in terrestrial laboratories. Among other challenges, the high-energy X-rays required to generate these transitions are difficult and costly to produce (broadband sources even more so). Additionally, high spectral resolution capable of resolving individual transitions from highly charged ions with many electrons is difficult to achieve in the laboratory. High spectral resolution is even more challenging in the context of an X-ray satellite telescope. For the spectral resolution of a given laboratory measurement to be sufficient, the uncertainty must at least meet or exceed that of the data one hopes to interpret. Next-generation X-ray observatories can benefit from the higher-resolution spectroscopic data achievable in the laboratory (Smith et al. Reference Smith2019).
Any required revisions to line locations may affect the blended features in complicated ways that could be consequential for the ensuing interpretations. Furthermore, different atomic structure codes’ predictions for transitions energies can disagree by as much as several eV, especially for higher- $Z$
elements (Verner, Verner & Ferland Reference Verner, Verner and Ferland1996; Behar & Netzer Reference Behar and Netzer2002; Palmeri et al. Reference Palmeri, Quinet, Mendoza, Bautista, García and Kallman2008). In these cases, benchmark measurements become even more crucial.
$Z$
elements (Verner, Verner & Ferland Reference Verner, Verner and Ferland1996; Behar & Netzer Reference Behar and Netzer2002; Palmeri et al. Reference Palmeri, Quinet, Mendoza, Bautista, García and Kallman2008). In these cases, benchmark measurements become even more crucial.
This paper presents laboratory data that provide benchmark measurements of transitions from He-like to B-like Si ions. The data were obtained on Z-pinch wire array experiments using the Z-machine at Sandia National Laboratories (Loisel et al. Reference Loisel, Bailey, Liedahl, Fontes, Kallman, Nagayama, Hansen, Rochau, Mancini and Lee2017). The platform produces photoionised plasmas by using the intense broadband source of X-rays to irradiate a thin-foil sample. We collect both emission and absorption data simultaneously using time-integrated space-resolved crystal spectrometers. The main goal of the platform is to test various physical assumptions underpinning astrophysical photoionised plasma models such as the validity of resonant Auger destruction (Liedahl Reference Liedahl and Smith2005, Reference Liedahl2011; Loisel et al. Reference Loisel, Bailey, Liedahl, Fontes, Kallman, Nagayama, Hansen, Rochau, Mancini and Lee2017) and the accuracy of differences in the predicted spectral emission from low- versus high-density model calculations in the context of the supersolar Fe abundance problem (e.g. García et al. Reference García, Fabian, Kallman, Dauser, Parker, McClintock, Steiner and Wilms2016; Jiang et al. Reference Jiang2019a , Reference Jiang, Fabian, Wang, Walton, García, Parker, Steiner and Tomsickb ; Kallman et al. Reference Kallman, Bautista, Deprince, García, Mendoza, Ogorzalek, Palmeri and Quinet2021; Cho et al. Reference Cho, Loisel, Bailey, Nagayama, Fontes, Mayes and Dunham2024).
The data presented in this paper were taken to test whether measurements at such high resolving power were possible with the platform. They are an outgrowth of the main data goals. The data presented in this paper were obtained on two shots using an emission spectrometer set-up that allowed us to obtain high-resolution data at an average resolving power of $E/ \Delta E\sim$
7500. These data represent exactly the kind of experimental benchmarks, like those provided by Hell et al. (Reference Hell, Brown, Wilms, Grinberg, Clementson, Liedahl, Porter, Kelley, Kilbourne and Beiersdorfer2016), that will facilitate accurate interpretation of future high-resolution astrophysical spectroscopic data.
$E/ \Delta E\sim$
7500. These data represent exactly the kind of experimental benchmarks, like those provided by Hell et al. (Reference Hell, Brown, Wilms, Grinberg, Clementson, Liedahl, Porter, Kelley, Kilbourne and Beiersdorfer2016), that will facilitate accurate interpretation of future high-resolution astrophysical spectroscopic data.
Figure 1 shows a comparison of the laboratory Z data for Si (z2972) and the corresponding X-ray spectrum expected with the new XRISM mission. We simulated the astrophysical spectrum of a bright source assuming that the intrinsic emission is equivalent to the Z spectrum. The simulations were produced with the spectral analysis software xspec (Arnaud Reference Arnaud, Jacoby and Barnes1996), using the most recent instrumental response for the Resolve instrument on board the XRISM (Ishisaki et al. Reference Ishisaki2018, Reference Ishisaki, den Herder, Nikzad and Nakazawa2022). Resolve is a soft X-ray microcalorimeter spectrometer, which provides non-dispersive 5–8 eV energy resolution in the 0.3–12 keV bandpass. For this particular simulation, we have used the most optimistic redistribution matrix files for 5 eV resolution, together with the ancillary response files for the case of gate valve open (i.e. no filter). This comparison illustrates the superior energy resolution of our Z experimental data to resolve the complex emission profiles from Si ions in this spectral band.
Simulated XRISM Si emission spectral data (blue) compared with high-resolution Si emission spectral data (yellow) collected with the Z-machine on shot z2972. Both datasets are shown in arbitrary units (rescaled) for better comparison. The resolution of the Z data presented in this paper exceeds the expected resolution of XRISM data and will be critical for resolving complex emission profiles from Si ions observed in future astrophysical data in this spectral band. This comparison relies on pre-flight response files for the Resolve spectrometer on board XRISM. Newer response files that have been calibrated in flight that are now available will not change this comparison appreciably.

Previous laboratory measurements of silicon have been used to benchmark several transition energies; however, the number of benchmarked lines is still low (Walker & Rugge Reference Walker and Rugge1971; Aglitskii et al. Reference Aglitskii, Boiko, Zakharov, Pikuz and Faenov1974; Walker, Rugge & Weiss Reference Walker, Rugge and Weiss1974; Behring et al. Reference Behring, Cohen, Feldman and Doschek1976; Boiko et al. Reference Boiko, Faenov, Pikuz and Safranova1977; Trabert et al. Reference Trabert, Armour, Bashkin, Jelley, O’Brien and Silver1979; Deserio et al. Reference DeSerio, Berry, Brooks, Hardis, Livingston and Hinterlong1981; Faenov et al. Reference Faenov, Pikuz and Shlyaptseva1994; Hell et al. Reference Hell, Brown, Wilms, Grinberg, Clementson, Liedahl, Porter, Kelley, Kilbourne and Beiersdorfer2016), and most silicon transition energies in the various atomic databases are still based on theoretical calculations. Theoretical calculations of transition energies in Si ions have been computed using various codes and methods including HULLAC (Bar-Shalom, Klapisch & Oreg Reference Bar-Shalom, Klapisch and Oreg2001) by Behar & Netzer (Reference Behar and Netzer2002) and HFR (Cowan Reference Cowan1981) + AUTOSTRUCTURE (Eissner, Jones & Nussbaumer Reference Eissner, Jones and Nussbaumer1974; Badnell Reference Badnell1986, Reference Badnell1997) by Palmeri et al. (Reference Palmeri, Quinet, Mendoza, Bautista, García and Kallman2008). More recent experimental work includes wavelengths of He-like satellite transitions measured in a CO $_2$
laser-produced plasma by Faenov et al. (Reference Faenov, Pikuz and Shlyaptseva1994), and transition energies of highly charged Si ions using the EBIT facility at Lawrence Livermore National Laboratory with microcalorimeter spectrometers by Hell et al. (Reference Hell, Brown, Wilms, Grinberg, Clementson, Liedahl, Porter, Kelley, Kilbourne and Beiersdorfer2016). See Deslattes et al. (Reference Deslattes, Kessler, Indelicato, de Billy, Lindroth and Anton2003), Palmeri et al. (Reference Palmeri, Quinet, Mendoza, Bautista, García and Kallman2008) and Hell et al. (Reference Hell, Brown, Wilms, Grinberg, Clementson, Liedahl, Porter, Kelley, Kilbourne and Beiersdorfer2016) for a more complete account of past experimental and theoretical work.
$_2$
laser-produced plasma by Faenov et al. (Reference Faenov, Pikuz and Shlyaptseva1994), and transition energies of highly charged Si ions using the EBIT facility at Lawrence Livermore National Laboratory with microcalorimeter spectrometers by Hell et al. (Reference Hell, Brown, Wilms, Grinberg, Clementson, Liedahl, Porter, Kelley, Kilbourne and Beiersdorfer2016). See Deslattes et al. (Reference Deslattes, Kessler, Indelicato, de Billy, Lindroth and Anton2003), Palmeri et al. (Reference Palmeri, Quinet, Mendoza, Bautista, García and Kallman2008) and Hell et al. (Reference Hell, Brown, Wilms, Grinberg, Clementson, Liedahl, Porter, Kelley, Kilbourne and Beiersdorfer2016) for a more complete account of past experimental and theoretical work.
In this experiment, we measured silicon emission spectra with the high average resolving power of $E$
/
$E$
/ $\Delta$ $E$
$E$ $\sim$
7500 using a laboratory photoionised plasma platform developed on the Z-machine at Sandia National Laboratories (Loisel et al. Reference Loisel, Bailey, Liedahl, Fontes, Kallman, Nagayama, Hansen, Rochau, Mancini and Lee2017). We identify 53 lines in He-like to B-like silicon. These data are collected from actual photoionised plasmas produced in the laboratory, an environment that reaches some of the same plasma conditions (temperature and density) as observations of the actual astrophysical sources whose interpretation we hope to benefit. While the densities are orders of magnitude higher than most astrophysical photoionised plasmas, there are certain regions where these conditions are directly relevant. In particular, this platform is intended to study plasmas produced in close proximity to high-energy continuum sources of X-rays, such as photoionised plasmas found in black hole accretion disks irradiated by power-law continuum photons from the corona. The experimental plasma is photoionised which enables observation of highly ionised silicon at relatively low temperature and density. Line blending due to Doppler motion is reduced compared with collisional plasmas which require much higher temperatures to reach the same ionisation states. This allows us to make many new line identifications with high accuracy.
$\sim$
7500 using a laboratory photoionised plasma platform developed on the Z-machine at Sandia National Laboratories (Loisel et al. Reference Loisel, Bailey, Liedahl, Fontes, Kallman, Nagayama, Hansen, Rochau, Mancini and Lee2017). We identify 53 lines in He-like to B-like silicon. These data are collected from actual photoionised plasmas produced in the laboratory, an environment that reaches some of the same plasma conditions (temperature and density) as observations of the actual astrophysical sources whose interpretation we hope to benefit. While the densities are orders of magnitude higher than most astrophysical photoionised plasmas, there are certain regions where these conditions are directly relevant. In particular, this platform is intended to study plasmas produced in close proximity to high-energy continuum sources of X-rays, such as photoionised plasmas found in black hole accretion disks irradiated by power-law continuum photons from the corona. The experimental plasma is photoionised which enables observation of highly ionised silicon at relatively low temperature and density. Line blending due to Doppler motion is reduced compared with collisional plasmas which require much higher temperatures to reach the same ionisation states. This allows us to make many new line identifications with high accuracy.
In this paper, we present experimentally measured transition energies for 53 silicon transitions that can be used to validate atomic databases. The emission features fall in the $\sim$
1795–1880 eV (6.6–6.9 Å) energy range. We provide the atomic states involved in the transitions for the observed features of Si XIII (He-like) to Si X (B-like) along with their energies and uncertainties. Finally, we compile a comparison of calculated values obtained using the RATS (Relativistic ATomic Structure) (Fontes et al. Reference Fontes, Zhang, Jr, Clark, Kilcrease, Colgan, Cunningham, Hakel, Magee and Sherrill2015) and FAC (Flexible Atomic Code) (Gu Reference Gu2008) atomic structure codes, along with the NIST (Martin & Zalubas Reference Martin and Zalubas1983; Kramida et al. Reference Kramida, Ralchenko and Reader2024) and XSTAR uaDB databases (Bautista & Kallman Reference Bautista and Kallman2001; Mendoza et al. Reference Mendoza2021). In all cases, we used pre-tabulated data.
$\sim$
1795–1880 eV (6.6–6.9 Å) energy range. We provide the atomic states involved in the transitions for the observed features of Si XIII (He-like) to Si X (B-like) along with their energies and uncertainties. Finally, we compile a comparison of calculated values obtained using the RATS (Relativistic ATomic Structure) (Fontes et al. Reference Fontes, Zhang, Jr, Clark, Kilcrease, Colgan, Cunningham, Hakel, Magee and Sherrill2015) and FAC (Flexible Atomic Code) (Gu Reference Gu2008) atomic structure codes, along with the NIST (Martin & Zalubas Reference Martin and Zalubas1983; Kramida et al. Reference Kramida, Ralchenko and Reader2024) and XSTAR uaDB databases (Bautista & Kallman Reference Bautista and Kallman2001; Mendoza et al. Reference Mendoza2021). In all cases, we used pre-tabulated data.
The average line centre differences between the four databases and the experimentally measured values are presented in table 2. Detailed information regarding the identified transitions, their measured energies and comparisons among the four databases are consolidated and presented in table 3. Many of the measurements in the data presented here are the first ever observations of those transitions in silicon, and benchmark important transitions for accurately interpreting astrophysical spectra. More broadly, it establishes our Z platform as an additional potential source for benchmark measurements of transition energies for astrophysically relevant ions/elements as well as an analysis method that produces wavelength measurements with robust uncertainties.
2. Experiment and measurement
The measurement was performed using the expanding foil photoionised plasma platform on the Z-machine at Sandia National Laboratories (Loisel et al. Reference Loisel, Bailey, Liedahl, Fontes, Kallman, Nagayama, Hansen, Rochau, Mancini and Lee2017). This experimental platform relies on a Z-pinch dynamic hohlraum produced using a double-nested tungsten wire array. Electrical current is driven through the wire array to produce a dynamic hohlraum that generates the X-ray drive. The current converts the solid tungsten wires into a plasma that gives off an initial burst of radiation with a near-Planckian spectrum that lasts $\sim$
110 ns. The
$\sim$
110 ns. The $\boldsymbol{J}\times \boldsymbol{B}$
force from the flowing current implodes the tungsten plasma which forms the wall of the roughly cylindrical hohlraum. The imploding tungsten plasma eventually reaches stagnation as it approaches the central vertical axis. The stagnation launches a shock, heats the tungsten plasma further to a temperature of
$\boldsymbol{J}\times \boldsymbol{B}$
force from the flowing current implodes the tungsten plasma which forms the wall of the roughly cylindrical hohlraum. The imploding tungsten plasma eventually reaches stagnation as it approaches the central vertical axis. The stagnation launches a shock, heats the tungsten plasma further to a temperature of $\sim$
200 eV and produces the main burst of radiation, another higher-energy broadband X-ray spectrum. This secondary burst of radiation has a full width at half maximum (FWHM) of
$\sim$
200 eV and produces the main burst of radiation, another higher-energy broadband X-ray spectrum. This secondary burst of radiation has a full width at half maximum (FWHM) of $\sim$
3 ns and is the primary radiation drive that photoionises the plasma (Rochau et al. Reference Rochau, Bailey, Falcon, Loisel, Nagayama, Mancini, Hall, Winget, Montgomery and Liedahl2014).
$\sim$
3 ns and is the primary radiation drive that photoionises the plasma (Rochau et al. Reference Rochau, Bailey, Falcon, Loisel, Nagayama, Mancini, Hall, Winget, Montgomery and Liedahl2014).
The radiation produced by the Z-pinch propagates outward through windows cut out of the return current can and irradiates a thin silicon foil placed ${\sim} 29$
mm away from the Z-pinch axis (see figures 2 and 3). The initial radiation burst from the phase prior to stagnation heats and expands the foil sample and vaporises the solid foil into a plasma. The following higher-energy X-rays from stagnation then photoionise the silicon plasma.
${\sim} 29$
mm away from the Z-pinch axis (see figures 2 and 3). The initial radiation burst from the phase prior to stagnation heats and expands the foil sample and vaporises the solid foil into a plasma. The following higher-energy X-rays from stagnation then photoionise the silicon plasma.
Actual image of the experimental set-up. The thin silicon foil (brown) is mounted on a metal U-shaped holder (pictured to the right) and arranged to accept X-ray radiation face on. The Z-pinch is produced at the centre of the gold return current canister. Some of the thin tungsten wires of which the wire array is composed are faintly visible above the return current can and through the middle return current can slot.

Schematic of experimental set-up and spectrometer orientation from a top-down view. The gold ‘return current can’ is depicted by the broken yellow circle. The X-ray radiation from the Z-pinch propagates through holes in the gold return current can called the ‘return current slots’. Time-integrated emission and absorption spectra are simultaneously collected from two perpendicular lines of sight.

A diverse collection of excited states (beyond those observed in a collisonal plasma) are produced as by-products of the photoionisation events themselves as well as by photoexcitation and electron impact excitation. Subsequent de-excitation processes (mostly spontaneous radiative decay) into K-shell holes left behind by photoionisation events then generate the observed emission spectrum. This produces many more lines in emission than observed from coronal plasmas at similar moderate temperatures of tens of eV. The collisional–radiative calculations performed for the analysis of these data predict that single electron recombination dominates recombination processes in our plasma. The K-shell lines of interest are populated by inner-shell photoexcitation and photoionisation processes, rather than dielectronic recombination, in this plasma.
There are many interesting discrepancies observed between the synthetic spectra arising from the collisional–radiative model calculation and the data. A deeper investigation of the sources of the discrepancies would require additional experimental data and analysis. Most importantly, since radiative excitation plays an important role in setting the level populations in this plasma, further interrogation would require a careful accounting of the detailed shape and time evolution of the radiation drive spectrum. This would necessarily also have to be considered in conjunction with any evolution in the silicon plasma conditions and charge state distribution.
Both emission and absorption spectrometers’ data collection modes are time-integrated. However, the spectra are only measured during specific periods of time. Absorption spectra are only recorded when the backlight from the Z-pinch is bright enough for the absorption features to be observable, and the emission spectra presented here are produced during the period of time when the photoionising radiation from the pinch is intense enough at the energies required to produce Si K-shell vacancies.
2.1. Challenges associated with laboratory photoionised plasma spectroscopy
Producing photoionised plasmas in terrestrial laboratories is extremely challenging and represents a collective set of efforts that spans the last two decades (Heeter et al. Reference Heeter, Bailey, Cuneo, Emig, Foord, Springer and Thoe2001; Bailey et al. Reference Bailey2002; Foord et al. Reference Foord2004; Van Hoof et al. Reference Van Hoof2005; Foord et al. Reference Foord2006; Mancini et al. Reference Mancini, Bailey, Hawley, Kallman, Witthoeft, Rose and Takabe2009, Reference Mancini, Lockard, Mayes, Hall, Loisel, Bailey, Rochau, Abdallah, Golovkin and Liedahl2020; Mayes et al. Reference Mayes, Mancini, Lockard, Hall, Bailey, Loisel, Nagayama, Rochau and Liedahl2021). There are only a handful of facilities in the world capable of producing the requisite spectral intensity in high-energy X-rays such that photon-driven atomic processes sufficiently dominate collisionally driven processes to drive a macroscopic photoionised plasma. The Z facility is one such. The density of the plasma must also not be so high that it becomes optically thick and introduces complications of self-absorption within the plasma. Conversely, the density and size of the plasma must be balanced. The density must not be so low that it prohibits high-signal-to-noise (S/N) spectral observations. Lower density can be compensated for with larger plasma size to increase the intensity, but the size of the plasma must not be so large that geometrical dilution introduces significant temperature and density gradients. The ability to produce a plasma at the right conditions to collect spectroscopic data rests on establishing a fine balance among all of these factors.
Another set of challenges is associated with the diagnostic capabilities. High-resolution spectral measurements at the average $\sim$
7500 resolving power achieved by this experimental platform are unprecedented for photoionised silicon. Achieving this resolving power requires perfect (not mosaic) spherical crystals fabricated to extremely high quality with strong reflective properties to ensure high-S/N spectra even at the low emission intensities of the plasmas produced by this platform.
$\sim$
7500 resolving power achieved by this experimental platform are unprecedented for photoionised silicon. Achieving this resolving power requires perfect (not mosaic) spherical crystals fabricated to extremely high quality with strong reflective properties to ensure high-S/N spectra even at the low emission intensities of the plasmas produced by this platform.
The platform also uses a complicated geometry to enable simultaneous collection of absorption and emission spectra. The absorption line of sight looks through the thickness of the sample directly at the Z-pinch while the emission line of sight runs parallel to the width of the sample. The absorption line of sight must be normal to the sample for the Z-pinch to act as a backlighter and for absorption lines to be observed. By contrast, the emission line of sight must be offset from the pinch to observe the self-emission from the plasma in isolation without contaminating the signal with emission from the Z-pinch (see figure 3). The data presented in this paper are collected from the emission line of sight.
Finally, the highly violent environment necessitated by the intense X-ray production process yields extreme levels of debris in the form of soot and explosive shrapnel. Sufficient debris mitigation that ensures survival of the light-sensitive X-ray film data protected by a thin ( $\sim$
8.5
$\sim$
8.5 $\mathrm{\mu}$
m) layer of light-tight filtration material is itself a non-trivial problem.
$\mathrm{\mu}$
m) layer of light-tight filtration material is itself a non-trivial problem.
2.2. Space-resolving spherical crystal spectrometer
The XRS $^3$
, a spectrometer diagnostic available on the Z-machine, which was originally designed for X-ray Thomson scattering experiments, met our needs for the expanding foil photoionised plasma platform (Harding et al. Reference Harding, Ao, Bailey, Loisel, Sinars, Geissel, Rochau and Smith2015). This diagnostic disperses radiation from the plasma in energy/wavelength using a concave spherical crystal. The spectrometer implements FSSR-1D (focusing spectrometer with spatial resolution) geometry (Pikuz, Erko & Faenov Reference Pikuz, Erko and Faenov1994; Sinars et al. Reference Sinars2006). The FSSR-1D configuration achieves space resolution along one dimension of the crystal and wavelength dispersion along the other. In effect, the data are composed of multiple spectra from different locations along one spatial dimension.
$^3$
, a spectrometer diagnostic available on the Z-machine, which was originally designed for X-ray Thomson scattering experiments, met our needs for the expanding foil photoionised plasma platform (Harding et al. Reference Harding, Ao, Bailey, Loisel, Sinars, Geissel, Rochau and Smith2015). This diagnostic disperses radiation from the plasma in energy/wavelength using a concave spherical crystal. The spectrometer implements FSSR-1D (focusing spectrometer with spatial resolution) geometry (Pikuz, Erko & Faenov Reference Pikuz, Erko and Faenov1994; Sinars et al. Reference Sinars2006). The FSSR-1D configuration achieves space resolution along one dimension of the crystal and wavelength dispersion along the other. In effect, the data are composed of multiple spectra from different locations along one spatial dimension.
For the measurements presented in this paper, we used a spherically bent quartz 10-10 crystal with bending radius R = 250 mm at a Bragg angle of ${\sim}58^{\circ }$
at the centre of the crystal to collect the emission spectrum. The instrumental set-up allows us to reach an average resolving power of
${\sim}58^{\circ }$
at the centre of the crystal to collect the emission spectrum. The instrumental set-up allows us to reach an average resolving power of ${\sim}7500$
in the
${\sim}7500$
in the $\sim$
1795–1880 eV (6.6–6.9 Å) energy range of interest. This translates to an energy resolution of 0.482–0.684 eV (1.77–2.25 mÅ). For comparison, the energy resolution of the recent Si data collected with the EBIT Calorimeter Spectrometer is 4.5–5.0 eV (Hell et al. Reference Hell, Brown, Wilms, Grinberg, Clementson, Liedahl, Porter, Kelley, Kilbourne and Beiersdorfer2016). The one-dimensional space-resolved data are recorded on RAR 2492 X-ray film and are time-integrated over the entire duration of the plasma’s lifetime. Additional details and a full description of the experimental platform are given in Loisel et al. (Reference Loisel, Bailey, Liedahl, Fontes, Kallman, Nagayama, Hansen, Rochau, Mancini and Lee2017).
$\sim$
1795–1880 eV (6.6–6.9 Å) energy range of interest. This translates to an energy resolution of 0.482–0.684 eV (1.77–2.25 mÅ). For comparison, the energy resolution of the recent Si data collected with the EBIT Calorimeter Spectrometer is 4.5–5.0 eV (Hell et al. Reference Hell, Brown, Wilms, Grinberg, Clementson, Liedahl, Porter, Kelley, Kilbourne and Beiersdorfer2016). The one-dimensional space-resolved data are recorded on RAR 2492 X-ray film and are time-integrated over the entire duration of the plasma’s lifetime. Additional details and a full description of the experimental platform are given in Loisel et al. (Reference Loisel, Bailey, Liedahl, Fontes, Kallman, Nagayama, Hansen, Rochau, Mancini and Lee2017).
2.3. Sources of broadening
A general rule of thumb is that we can extract the line centre to an accuracy of roughly a tenth of the broadening and can separate spectral lines at least to the resolution of the measurements. The accuracy of the line energy is generally better than the resolution which means that the narrower the line, the better the accuracy of the wavelength. Therefore, the total amount of broadening is an important quantity which limits the total separation that we can hope to measure. The sources of broadening in our experiment include thermal Doppler, source size, crystal and detector. The Doppler, source size and detector broadening are all Gaussian profiles while the crystal broadening is Lorentzian (see figure 4). The broadening behaviour is also a known function of wavelength. Like the wavelength dispersion axis, the broadening curves can be analytically calculated except for crystal broadening which we calculate using the X-ray Oriented Programs (XOP) software suite (Sanchez del Rio & Dejus Reference Sanchez del Rio and Dejus1997, Reference Sánchez del Río and Dejus2011).
All significant sources of broadening in the spectrometer measurement broken down by type. Doppler broadening curves are shown for the nominal 33 eV (solid green) measured value for the plasma temperature and 40 eV (dashed red) which represents the plasma temperature assuming maximum error. The total Gaussian FWHM values (the convolution of only sources of broadening with Gaussian profiles) and total Voigt FWHM values (the convolution of all sources of broadening both Gaussian and Lorentzian) are plotted for both 33 eV (solid brown and grey) and 40 eV (dashed pink and yellow) demonstrating only minor differences in the total broadening. The silicon K-edge is visible at $\sim$
6.75 Å in the crystal broadening curve (orange). In the central portion of the full wavelength range within which the identified lines fall (
$\sim$
6.75 Å in the crystal broadening curve (orange). In the central portion of the full wavelength range within which the identified lines fall ( $\sim$
6.6–6.9 Å; blue shaded region), the source-size broadening (purple) is minimal; however, it dominates at lower and higher wavelengths outside of this range.
$\sim$
6.6–6.9 Å; blue shaded region), the source-size broadening (purple) is minimal; however, it dominates at lower and higher wavelengths outside of this range.

Figure 5 plots the total resolving power for our instrumental set-up excluding physical plasma effects. The native instrumental resolving power varies somewhat significantly over the spectral range of interest. In the central portion of the full wavelength range within which the identified lines fall (blue shaded region in figure 4 from $\sim$
6.6 to 6.9 Å), the detector broadening dominates, while source-size broadening dominates at lower and higher wavelengths outside of this range.
$\sim$
6.6 to 6.9 Å), the detector broadening dominates, while source-size broadening dominates at lower and higher wavelengths outside of this range.
Instrumental resolving power without physical plasma effects – including crystal, source-size and detector broadening, but omitting Doppler broadening. The wavelength range within which the identified lines fall ( $\sim$
6.6–6.9 Å) is shaded in blue. The green, red and blue vertical dotted lines indicate locations of the He
$\sim$
6.6–6.9 Å) is shaded in blue. The green, red and blue vertical dotted lines indicate locations of the He $\alpha$
w, y and z lines respectively.
$\alpha$
w, y and z lines respectively.

One particular feature of note is the sharp drop in the crystal broadening curve visible in figures 4 and 5 at ${\sim}1840\,\textrm {eV}$
. This drop is associated with the silicon K-edge. Photons at or above these energies are strongly absorbed by K-shell electrons of silicon in quartz 10-10 (SiO
${\sim}1840\,\textrm {eV}$
. This drop is associated with the silicon K-edge. Photons at or above these energies are strongly absorbed by K-shell electrons of silicon in quartz 10-10 (SiO $_2$
). The additional absorption in this spectral region is accounted for in the XOP calculations and manifests as a drop in the FWHM of the wavelength-dependent crystal rocking curves, which represent the crystal spectral broadening. The narrow rocking curves in this region also cause a drop in the integrated reflectivity values which are obtained by integrating the wavelength-dependent crystal rocking curves (Nagayama et al. Reference Nagayama2023). The integrated reflectivity of the crystal is calculated using XOP.
$_2$
). The additional absorption in this spectral region is accounted for in the XOP calculations and manifests as a drop in the FWHM of the wavelength-dependent crystal rocking curves, which represent the crystal spectral broadening. The narrow rocking curves in this region also cause a drop in the integrated reflectivity values which are obtained by integrating the wavelength-dependent crystal rocking curves (Nagayama et al. Reference Nagayama2023). The integrated reflectivity of the crystal is calculated using XOP.
In the final stage of data processing, this wavelength-dependent integrated reflectivity curve is combined with other sources of attenuation in the experiment. These include, for example, geometrical dilution and attenuation from the film and snout filters (which accounts for both the specific filter composition and the position-/wavelength-dependent path length of the radiation through the material, given the incidence angle on the film). The combination of effects is used to construct a crystal ‘efficiency’ curve. The film data are scaled using this ‘efficiency’ curve to convert the data into absolute units of $(\mathrm{J\,sr^{-1}\,cm^{-2}\,eV^{-1}})$
. Therefore, the extra absorption associated with the Si K-edge effectively leads to lower crystal reflection ‘efficiency’ and the raw data are multiplied by a larger scale factor to account for it.
$(\mathrm{J\,sr^{-1}\,cm^{-2}\,eV^{-1}})$
. Therefore, the extra absorption associated with the Si K-edge effectively leads to lower crystal reflection ‘efficiency’ and the raw data are multiplied by a larger scale factor to account for it.
While the wavelengths of the lines are generally unaffected by the efficiency curve, if incorrectly applied, or if the XOP calculation features significant inaccuracies, sharp discontinuities associated with absorption edges can affect the line shape of any spectral feature that overlaps the discontinuity. This could subsequently affect the final fitted line centre. In this particular dataset, the only spectral line that could have been affected by this is the Li-10 feature detected in shot z3532. The final spectral lineout does not indicate any distinct abnormality in either the shape or intensity of the line; thus we conclude that the effect of the Si K-edge was properly accounted for assuming that the XOP calculations are accurate.
For the thermal Doppler broadening induced by particle motion, we use the measured temperature of 33 eV (Loisel et al. Reference Loisel, Bailey, Liedahl, Fontes, Kallman, Nagayama, Hansen, Rochau, Mancini and Lee2017). The total broadening is dominated by the source size and the detector. Allowing for the maximum error in the temperature measurement of $\pm$
7 eV produces only minor differences in the total Voigt FWHM (see figure 4). Using Doppler-broadened curves assuming a 40 eV plasma temperature does not appreciably change the final fits. We tested the effect of using a 40 eV temperature for the Doppler broadening on the data from shot z3532. The final fits for the line centre energies differed by an average of 0.001 eV compared with the results obtained using a 33 eV temperature, which is more than an order of magnitude smaller than the average estimated line centre errors. Finally, a related but additional potential source of broadening is bulk plasma motion. Broadening due to bulk velocities in the plasma was found to be relatively unimportant, so we omit its consideration here as well (Loisel et al. Reference Loisel, Bailey, Liedahl, Fontes, Kallman, Nagayama, Hansen, Rochau, Mancini and Lee2017).
$\pm$
7 eV produces only minor differences in the total Voigt FWHM (see figure 4). Using Doppler-broadened curves assuming a 40 eV plasma temperature does not appreciably change the final fits. We tested the effect of using a 40 eV temperature for the Doppler broadening on the data from shot z3532. The final fits for the line centre energies differed by an average of 0.001 eV compared with the results obtained using a 33 eV temperature, which is more than an order of magnitude smaller than the average estimated line centre errors. Finally, a related but additional potential source of broadening is bulk plasma motion. Broadening due to bulk velocities in the plasma was found to be relatively unimportant, so we omit its consideration here as well (Loisel et al. Reference Loisel, Bailey, Liedahl, Fontes, Kallman, Nagayama, Hansen, Rochau, Mancini and Lee2017).
The silicon areal density, obtained using Rutherford back-scattering spectrometry, is measured to be $3.1\,\times \,10^{17}\,\pm$
5
$3.1\,\times \,10^{17}\,\pm$
5 $\%$
Si cm
$\%$
Si cm $^{-2}$
. The sample, as pictured in figure 2, is originally 10 mm × 16 mm in the horizontal and vertical directions. It consists of three layers – an 800 Å thick layer of SiO
$^{-2}$
. The sample, as pictured in figure 2, is originally 10 mm × 16 mm in the horizontal and vertical directions. It consists of three layers – an 800 Å thick layer of SiO $_2$
tamped on either side with a 1000 Å thick layer of CH. We infer the physical expansion of the sample by measuring the spatial extent of the spectral data on the film and applying the appropriate magnification factor (Harding et al. Reference Harding, Ao, Bailey, Loisel, Sinars, Geissel, Rochau and Smith2015; Nagayama et al. Reference Nagayama2023). The FWHM of the length of expanded plasma is measured to be 3.5 mm which is
$_2$
tamped on either side with a 1000 Å thick layer of CH. We infer the physical expansion of the sample by measuring the spatial extent of the spectral data on the film and applying the appropriate magnification factor (Harding et al. Reference Harding, Ao, Bailey, Loisel, Sinars, Geissel, Rochau and Smith2015; Nagayama et al. Reference Nagayama2023). The FWHM of the length of expanded plasma is measured to be 3.5 mm which is $\gt$
44 000 times the thickness of the original layer of silicon. The expansion size allows us to infer a density of
$\gt$
44 000 times the thickness of the original layer of silicon. The expansion size allows us to infer a density of ${\sim}8.5\,\times \,10^{17}\,\pm$
1 % Si cm
${\sim}8.5\,\times \,10^{17}\,\pm$
1 % Si cm $^{-3}$
. Assuming an average charge of
$^{-3}$
. Assuming an average charge of ${\sim}{+}10$
, the electron number density is estimated to be
${\sim}{+}10$
, the electron number density is estimated to be ${\sim}8.5\times 10^{18}$
cm
${\sim}8.5\times 10^{18}$
cm $^{-3}$
. At these densities, Stark broadening is estimated to be
$^{-3}$
. At these densities, Stark broadening is estimated to be $\lt$
0.02 eV (
$\lt$
0.02 eV ( $\sim$
0.07 mÅ) for the He-like intercombination line (He-2 in table 3) for which we measure a line centre of 1853.66 eV (6.68862 Å). More detailed fully quantum mechanical calculations, done using the ‘Balrog’ line shape code, suggest even smaller Stark broadening widths (Gomez et al. Reference Gomez2021). This effect is negligible compared with the other sources of broadening described above, and we omit any further consideration of Stark broadening in our analysis.
$\sim$
0.07 mÅ) for the He-like intercombination line (He-2 in table 3) for which we measure a line centre of 1853.66 eV (6.68862 Å). More detailed fully quantum mechanical calculations, done using the ‘Balrog’ line shape code, suggest even smaller Stark broadening widths (Gomez et al. Reference Gomez2021). This effect is negligible compared with the other sources of broadening described above, and we omit any further consideration of Stark broadening in our analysis.
3. Data analysis and line identifications
The raw emission film data and spectral lineouts are shown in figures 6 and 7, respectively. As expected with such high-resolution measurements, the data are complex. There are many line features and significant blending among many of the lines. In some cases, the blending is significant enough that the line appears simply as a ‘shoulder’ to a neighbouring line feature.
Raw film image data collected on shot z2972. Intensities are shown on a log scale to improve visibility. This image is only a portion of the X-ray film data from shot Z2972 where the spectral image appears. The recorded spectrum occupies just a small portion of the total film spatial extent. The dark background regions register non-zero intensity values from various sources of excitation including fogging which increases over time as the film sits in storage and ambient background radiation inside the diagnostic chamber.

Spectral emission data from the two Z shots (blue) with uncertainties in lineout intensity indicated by grey shaded region.

We expect an individual line that appears within the spectral range where we observe the He-like to B-like transitions listed in table 3 (blue shaded region in figure 4) to have a total FWHM (including both instrumental and Doppler broadening) of 0.482–0.684 eV (1.77–2.25 mÅ) assuming Voigt profiles and a 33 eV plasma temperature (grey curve in figure 4). This is significantly more broadening than what we expect from the instrumental broadening alone, which ranges from 0.146 to 0.373 eV (0.536–1.433 mÅ) (including crystal, source-size and detector broadening). Given the general expectation that we can extract the line centre to an accuracy of roughly a tenth of the broadening, we anticipated the total uncertainty on the line centre energies/wavelengths to be $\sim$
0.05 eV (0.5 mÅ). Overall, we find that the rigorously calculated uncertainties agree with this estimate on average. Although we do observe a significant amount of blending, the final fits are robust against the blending effects.
$\sim$
0.05 eV (0.5 mÅ). Overall, we find that the rigorously calculated uncertainties agree with this estimate on average. Although we do observe a significant amount of blending, the final fits are robust against the blending effects.
In the remainder of this section, we describe additional details of our approach to the analysis of the data including wavelength calibration and decomposition of the spectrum into individual emission features.
3.1. Wavelength calibration
Spherical crystal spectrometers with FSSR-1D geometries spectrally disperse radiation in space along the meridional direction (see figure 8). The wavelength dispersion axis can be calculated analytically given the spectrometer configuration. The crystal type (2d spacing), crystal radius, the crystal Bragg angle and the distance between the plasma and crystal (or source-to-crystal distance) can be used to perform detailed ray-tracing calculations that yield the dispersion relationship between wavelength and film position (see figure 9). For each location along the meridional plane of the crystal, we precisely calculate the wavelength of radiation dispersed by the crystal and the film location to which that radiation is focused. This yields a single dispersion curve that provides the wavelength as a function of film position for the entire spectral range of a dataset.
Schematic diagram demonstrating crystal spectrometer wavelength dispersion and incidence of the reflected spectrum on the detector. The spherical geometry of the crystal reflects rays along the sagittal direction to a single point on the detector while dispersing rays along the meridional direction in energy/wavelength. The Bragg angle of a given spectrometer set-up is the angle between the ray that traces the source to the centre of the crystal (point C) and the tangent line to the Rowland circle at the centre of the crystal. The energy axis on the detector increases with increasing Bragg angle on the crystal. Diagram is replicated from Harding et al. (Reference Harding, Ao, Bailey, Loisel, Sinars, Geissel, Rochau and Smith2015).

Optimised wavelength dispersion curve that provides the relationship between film position and wavelength for shot z2972 (black). The mean absolute difference between the reported fiducial wavelength values (blue circles) and the wavelength value of the fiducial location on our film data is 0.6421 mÅ. The blue labelled line names match those of Hell et al. (Reference Hell, Brown, Wilms, Grinberg, Clementson, Liedahl, Porter, Kelley, Kilbourne and Beiersdorfer2016) with the exception of He $\alpha$
which is labelled in that paper as ‘Si w’. The residuals between the reported wavelengths of the fiducial lines and the optimised dispersion curve are plotted in the lower panel (red circles).
$\alpha$
which is labelled in that paper as ‘Si w’. The residuals between the reported wavelengths of the fiducial lines and the optimised dispersion curve are plotted in the lower panel (red circles).

To calibrate the dispersion curve, we must identify transition lines in our data for which the energies/wavelengths are accurately known from past experimental data (fiducial lines). This is necessary because the parameters used for the ray-tracing calculations can vary slightly. The spectrometer placement in any given experiment and, thus, the source-to-crystal distance can differ from the nominal set-up by up to a few centimetres. The installation of the film and crystal inside the body of the instrument is done using high-tolerance mounting holes and components with fixed locations for the film and the crystal. While the film-to-crystal angle experiences little to no shot-to-shot variability, the angle of the entire diagnostic, and therefore the central Bragg angle of the crystal relative to the Si plasma, can vary by a few tenths of a degree. Differences in these geometrical parameters (source-to-crystal distance and central Bragg angle) will produce nonlinear offsets in the dispersion curve, or the wavelength axis. Therefore, we use the fiducial lines to solve for a best fit to the unique geometrical parameters for each individual shot that best represent the wavelength axis of the dataset.
To identify these unique geometrical parameters, we use an optimisation routine to fit the fiducial lines with our analytically calculated dispersion curve (Loisel Reference Loisel2011). We vary the crystal Bragg angle and source-to-crystal distance and construct a $\chi ^2$
surface across this two-dimensional parameter space. The
$\chi ^2$
surface across this two-dimensional parameter space. The $\chi ^2$
value is the square of the absolute difference between the reported wavelength fiducial measurements and the wavelength values of the locations on our film data where we observe the fiducial lines. A new wavelength dispersion curve is calculated for each unique combination of Bragg angle and source-to-crystal distance, and then used to calculate the
$\chi ^2$
value is the square of the absolute difference between the reported wavelength fiducial measurements and the wavelength values of the locations on our film data where we observe the fiducial lines. A new wavelength dispersion curve is calculated for each unique combination of Bragg angle and source-to-crystal distance, and then used to calculate the $\chi ^2$
value. The wavelength dispersion curve corresponding to the two parameter values at the minimum of the
$\chi ^2$
value. The wavelength dispersion curve corresponding to the two parameter values at the minimum of the $\chi ^2$
surface is taken to be the final optimised and calibrated wavelength dispersion curve. We call this the dispersion solution.
$\chi ^2$
surface is taken to be the final optimised and calibrated wavelength dispersion curve. We call this the dispersion solution.
The dispersion solutions obtained using this approach rely on high-quality prior measurements. The dispersion solutions for the data presented in this paper were obtained using six emission features that we observed in common with the silicon measurements conducted with the EBIT at Lawrence Livermore National Laboratory (Hell et al. Reference Hell, Brown, Wilms, Grinberg, Clementson, Liedahl, Porter, Kelley, Kilbourne and Beiersdorfer2016). These lines are referred to in that paper as ‘Si w’, ‘Li-1’, ‘Li-2’, ‘Be-1’, ‘B-1’ and ‘B-2’. The corresponding line labels in this paper, as indicated in table 3, are: ‘He-1’, ‘Li-3’, ‘Li-5’, ‘Be-5’, ‘B-3’ and ‘B-6’, respectively. After applying this calibration process, the optimised wavelength dispersion curves had mean absolute differences relative to the reported fiducial values from Hell et al. (Reference Hell, Brown, Wilms, Grinberg, Clementson, Liedahl, Porter, Kelley, Kilbourne and Beiersdorfer2016) of 0.450 mÅ for shot z3532 and 0.624 mÅ for shot z2972 (see figure 9).
3.2. Spectral decomposition
To identify the energies of the line centres in our data, we chose to perform a simultaneous multicomponent Voigt decomposition of the spectrum using a modified version of the open source GAUSSPY code (Lindner et al. Reference Lindner, Vera-Ciro, Murray, Stanimirović, Babler, Heiles, Hennebelle, Goss and Dickey2015). The results of the decomposition are plotted in figure 10. We observe a large number of emission features in a small wavelength range because of the high spectral resolving power. However, many lines are highly blended and the locations of the individual features are often ambiguous. Most spectral fitting packages such as Sherpa (Laurino et al. Reference Laurino, Burke, Evans, McLaughlin, Nguyen, Siemiginowska, Molinaro, Shortridge and Pasian2019) and Specutils (Astropy-Specutils Development Team 2019) require a set of initial guesses (mean, FWHM and amplitude of each spectral feature) to perform the fits. The initial guesses are difficult to determine by eye, especially when dealing with highly blended lines. Additionally, neither of these packages returned satisfactory final fits to the total spectrum. The GAUSSPY package, which performs fully autonomous spectral decomposition, solved these problems.
The He-, Li-, Be-, B- and C-like lines from both silicon datasets. Grey shaded regions denote uncertainties in intensity. Individual Voigt component of each emission feature is plotted in red. The full fitted spectrum (sum of all Voigt components) is plotted in purple. The ATOMIC calculation (blue) has been shifted to the right by 5 mÅ.

The advantage of the GAUSSPY algorithm is that it autonomously identifies all parameters for the set of initial guesses for all of the features in the spectrum. It computes numerical derivatives of the spectra and applies a set of selection criteria. Any locations that satisfy all selection criteria correspond to the initial guess for the wavelength, FWHM and amplitude of each individual line feature. The user is not involved in the process and does not have to produce any initial guesses by eye. Once the initial guesses are computed, the algorithm performs Levenberg–Marquardt least-squares minimisation to find the final simultaneous best-fit solution along with the uncertainties of each individual component’s fit parameters.
We were unable to use the original GAUSSPY code ‘out of the box’. The convolution of the various sources of broadening in our experiment result in Voigt profiles instead of Gaussians. However, GAUSSPY natively only provides the option to use Gaussian line shapes. We modified the GAUSSPY source code to use Voigt profiles. The widths can be either fixed to discrete values or allowed to float. The widths of the individual Gaussian and Lorentzian broadening components are interpolated along the individual wavelength-dependent broadening curves described in § 2.3 and used within GAUSSPY to perform the fits. See Appendix A for additional details about GAUSSPY and our specific use case.
4. Wavelength error analysis
Because of the limited availability of time on the Z-machine, it can be difficult to collect enough data to build up reliable statistics. Data from two shots taken $\sim$
5 years apart were used for the goal of line identification of our silicon plasma. The small statistical size prevented us from estimating uncertainties in the spectral intensity by simply calculating the standard deviation. Additionally, because there can be shot-to-shot variations, it is not a guarantee that we are achieving the same charge state distribution in our plasma. While Z data have in some cases shown remarkable shot-to-shot consistency (Bailey et al. Reference Bailey2015; Loisel et al. Reference Loisel, Bailey, Liedahl, Fontes, Kallman, Nagayama, Hansen, Rochau, Mancini and Lee2017), for the two shots described in this paper, we observe some differences in the corresponding spectra. One possibility for this behaviour is that the plasmas reached different conditions and are characterised by different charge state distributions. This would mean that the two datasets belong to different statistical parent populations which could further complicate uncertainty determinations. Therefore, we use a different approach that does not assume the two datasets are from the same parent population.
$\sim$
5 years apart were used for the goal of line identification of our silicon plasma. The small statistical size prevented us from estimating uncertainties in the spectral intensity by simply calculating the standard deviation. Additionally, because there can be shot-to-shot variations, it is not a guarantee that we are achieving the same charge state distribution in our plasma. While Z data have in some cases shown remarkable shot-to-shot consistency (Bailey et al. Reference Bailey2015; Loisel et al. Reference Loisel, Bailey, Liedahl, Fontes, Kallman, Nagayama, Hansen, Rochau, Mancini and Lee2017), for the two shots described in this paper, we observe some differences in the corresponding spectra. One possibility for this behaviour is that the plasmas reached different conditions and are characterised by different charge state distributions. This would mean that the two datasets belong to different statistical parent populations which could further complicate uncertainty determinations. Therefore, we use a different approach that does not assume the two datasets are from the same parent population.
In this section, we describe our approach to estimating error in Z data collected with X-ray film. Though our approach was more laborious than simply using a percentage estimate based on previous shots, it instils greater confidence in our results. More importantly, it establishes the Z-machine as a viable platform for accurate line identification on a broad scale, and provides us with an uncertainty determination method that can be applied to any X-ray film dataset. Future experiments on the Z-machine can continue to use this error analysis approach to make valuable contributions to anticipated atomic data needs of future high-resolution X-ray satellite telescope observations.
There are four main sources of noise or uncertainty in the Z spectral emission data: uncertainty in the spectral intensity ( $\sigma _{\textrm {I}}$
), uncertainty in the calibrated wavelength axis (
$\sigma _{\textrm {I}}$
), uncertainty in the calibrated wavelength axis ( $\sigma$
), fitting approach (
$\sigma$
), fitting approach ( $\sigma _{\textrm {fit}}$
) and shot-to-shot differences (
$\sigma _{\textrm {fit}}$
) and shot-to-shot differences ( $\sigma _{\textrm {shot}}$
). Uncertainty
$\sigma _{\textrm {shot}}$
). Uncertainty $\sigma _{\textrm {shot}}$
is simply taken to be the difference in line centres measured between the two shots. All sources of uncertainty are assumed to be random and Gaussian distributed and are thus added in quadrature to calculate the final uncertainties of the line centres reported in table 3. The other sources of uncertainty are described in more detail below.
$\sigma _{\textrm {shot}}$
is simply taken to be the difference in line centres measured between the two shots. All sources of uncertainty are assumed to be random and Gaussian distributed and are thus added in quadrature to calculate the final uncertainties of the line centres reported in table 3. The other sources of uncertainty are described in more detail below.
4.1. Statistical uncertainty: uncertainty in intensities of spectral lineouts
The final spectral lineout measurement is subject to various sources of noise during data processing. We use RAR 2492 X-ray film to record our data. The extreme X-ray environment of the Z-machine makes using electronic detectors difficult. There are several sources of noise imprinted on the final film data. These are associated with: photon counts, grain sensitivity to photons and response to development solution. Additional statistical fluctuation is introduced during the scanning process. It is beyond the scope of this work to analyse each of these sources of uncertainty individually. Instead, we consider their effect in aggregate on the noise observed in the final spectrum extracted from the film.
The lineout itself is obtained by taking the average intensity over a vertical column of pixels in the film data where the spectrum is recorded. Uncertainties in the intensity of the spectrum will constrain uncertainties in the fits to line-centre energies in the spectral decomposition and fitting process. To characterise uncertainties in the lineout intensity, we quantify pixel-to-pixel noise fluctuations in the film data assuming Poisson statistics. See Dunham et al. (Reference Dunham, Harding, Loisel, Lake and Nielsen-Weber2016) for additional discussion of error estimation in the context of establishing an appropriate scaling relationship between two types of detectors used at Z.
We construct a histogram of ‘normalised noise’ (see Appendix B for further details) to identify an appropriate scaling factor which we apply to the intensity of each pixel in the data in order to determine that pixel’s uncertainty. Under the assumption of Poisson statistics, the square root of the pixel’s intensity multiplied by the scaling factor is taken to be the pixel’s uncertainty. The advantage of this approach is that it considers all of the sources of uncertainty introduced at each stage of data processing collectively. We construct an ‘uncertainty’ image in which each pixel’s value is its uncertainty (or noise/error bar) value. We then propagate the uncertainty associated with each pixel’s intensity value to the final spectral lineout. We use the weighted mean of the individual pixel intensity uncertainties along the same vertical column of pixels over which we average to obtain the spectral lineouts. Finally, we can use these uncertainties in the spectral lineout intensities when fitting for the parameters of the emission features which will ultimately yield uncertainties on the best-fit line centres. We intentionally provide only a short description of this process here for the sake of brevity and refer interested readers to Appendix B for additional details.
4.2. Instrumental uncertainty: uncertainty in the wavelength axis
There is also uncertainty associated with the wavelength axis itself. This is because the wavelength dispersion for film data collected with space and spectrally dispersive crystals is not a known quantity but rather must be calibrated as described in § 2. Any uncertainties in the wavelength fiducials must be propagated to the uncertainty in the wavelength axis. In practice this means that uncertainties in the wavelength axis from offsets in the instrument set-up away from nominal (offsets in source-to-crystal distance and crystal Bragg angle) must be combined with the uncertainties of the reported fiducial measurements from Hell et al. (Reference Hell, Brown, Wilms, Grinberg, Clementson, Liedahl, Porter, Kelley, Kilbourne and Beiersdorfer2016). We refer to the total uncertainty in the wavelength axis from the combined effect of these two sources as an instrumental uncertainty rather than systematic. This is because the uncertainty is not the result of a systematic offset in one direction, but rather is associated with random offsets in the instrumental set-up combined with random errors in the wavelength measurements of the fiducial lines.
At present, we do not have a method to analytically parametrise this instrumental uncertainty. Instead, we use random sampling to propagate the uncertainties in the fiducials to our wavelength axis. We produced 25 000 Monte Carlo-sampled sets of the fiducial line wavelength values that are Gaussian distributed within the reported measurement errors of the fiducials from Hell et al. (Reference Hell, Brown, Wilms, Grinberg, Clementson, Liedahl, Porter, Kelley, Kilbourne and Beiersdorfer2016). For those fiducials with asymmetric uncertainties, we took a conservative approach and sampled from a Gaussian for which the width was twice the larger of the two uncertainty values.
Full collection of wavelength dispersion calculations near the film position where the Si-w He $\alpha$
line is measured. This is a zoomed-in view of a small region of the dispersion curve. The five other fiducial lines are used simultaneously but not shown here. The collection of wavelength values along the vertical dotted blue line represents the possible set of line-centre wavelengths (or energies) corresponding to each set of sampled wavelength fiducials combined with their respective optimised geometrical parameters. The spread in wavelength values along the dotted blue line represents the uncertainty in the line-centre location due to the combined effect of instrumental uncertainty and uncertainty in the fiducial wavelength values. The horizontal green line indicates the line-centre wavelength for Si-w He
$\alpha$
line is measured. This is a zoomed-in view of a small region of the dispersion curve. The five other fiducial lines are used simultaneously but not shown here. The collection of wavelength values along the vertical dotted blue line represents the possible set of line-centre wavelengths (or energies) corresponding to each set of sampled wavelength fiducials combined with their respective optimised geometrical parameters. The spread in wavelength values along the dotted blue line represents the uncertainty in the line-centre location due to the combined effect of instrumental uncertainty and uncertainty in the fiducial wavelength values. The horizontal green line indicates the line-centre wavelength for Si-w He $\alpha$
reported in (Hell et al. (Reference Hell, Brown, Wilms, Grinberg, Clementson, Liedahl, Porter, Kelley, Kilbourne and Beiersdorfer2016).
$\alpha$
reported in (Hell et al. (Reference Hell, Brown, Wilms, Grinberg, Clementson, Liedahl, Porter, Kelley, Kilbourne and Beiersdorfer2016).

We then calculated the 25 000 wavelength dispersion axis solutions corresponding to each set of sampled wavelength fiducials (see figure 11). Finally, we constructed a histogram of energies for the film location of each observed emission feature. The $\sigma$
of the best-fit Gaussian for each of those histograms represents the line-centre wavelength uncertainty associated with the total instrumental uncertainty (see figure 12). Finally, we appeal to the central limit theorem to make the assumption that our uncertainties are Gaussian distributed (Robinson Reference Robinson2017). Hence, we add the instrumental uncertainties in quadrature to the fitted line-centre uncertainties to yield total line-centre uncertainties.
$\sigma$
of the best-fit Gaussian for each of those histograms represents the line-centre wavelength uncertainty associated with the total instrumental uncertainty (see figure 12). Finally, we appeal to the central limit theorem to make the assumption that our uncertainties are Gaussian distributed (Robinson Reference Robinson2017). Hence, we add the instrumental uncertainties in quadrature to the fitted line-centre uncertainties to yield total line-centre uncertainties.
Example histogram of line-centre wavelength values for shot z3532 at the location of the Si-w He $\alpha$
line. The histogram plots the wavelength values at the film location where we observe this line for the 25 000 best-fit dispersion curve solutions corresponding to the 25 000 sets of sampled wavelength fiducials. These are the wavelength values at each point of intersection between the fitted dispersion curves and the blue dotted line in figure 11. We take the best-fit Gaussian (blue) to be our estimated instrumental uncertainty.
$\alpha$
line. The histogram plots the wavelength values at the film location where we observe this line for the 25 000 best-fit dispersion curve solutions corresponding to the 25 000 sets of sampled wavelength fiducials. These are the wavelength values at each point of intersection between the fitted dispersion curves and the blue dotted line in figure 11. We take the best-fit Gaussian (blue) to be our estimated instrumental uncertainty.

4.3. Uncertainty due to the fitting method
A significant challenge presented by these data is that the large number of lines makes it particularly difficult to fit the spectrum. Different fitting approaches produce different fit results and the effect on line-centre determinations must be included as an additional source of uncertainty. To do this, we repeated the fit with a less flexible approach that limited the total number of fitted components (see figure 13). This approach fits the well-isolated features and largely avoids fitting the continuum regions of the spectrum. The advantage of this approach is that we avoid ‘false detections’ that could be made by including more components. There are two main potential disadvantages. The first is that, for highly blended regions, not all components may be accurately detected. The second is that skew effects from inaccurately fitting all of the intensity in the spectrum (in particular, any asymmetry between the red and blue sides of the lines) may cause the line centres to be less accurate.
Same as figure 10 but showing results of an alternative fitting approach with a much more limited number of Voigt components. Individual Voigt component of each emission feature is plotted in red. The full fitted spectrum (sum of all Voigt components) is plotted in purple. The ATOMIC calculation (blue) has been shifted to the right by 5 mÅ.

The total absolute mean difference between these fit results compared with those reported in table 3 is 0.065 eV. In many cases, because the peak of the line is isolated, the difference in the line centres between the two fitting methods is trivial. The line-centre differences are largest when the feature is highly blended or when including many more lines forces a subjective choice of which Voigt component to assign to a given line transition. We assume that the differences due to fit results are also random and Gaussian distributed and add the magnitude of the line-centre differences in quadrature to the total uncertainty. In the future, as we continue to develop the platform further, we intend to pursue even higher-resolution measurements along with improved modelling capabilities which will improve the uncertainties.
In summary, the final uncertainties reported in table 3 are calculated by adding all sources of uncertainty in quadrature. The total uncertainty of each line ( $\sigma _{\textrm {tot}}$
) is calculated individually as
$\sigma _{\textrm {tot}}$
) is calculated individually as
 \begin{equation} \sigma _{\textrm {tot}} = \sqrt {\sigma _{\textrm {I}}^2 + \sigma _{\stackrel{\circ}{\textrm{A}}}^2 + \sigma _{\textrm {fit}}^2 +\sigma _{\textrm {shot}}^2}. \end{equation}
The total fractional absolute mean uncertainty for the lines reported in this paper is $5.44\times 10^{-5}$
. Although, at present, we do not have an analytical method to determine expected improvement in the uncertainty, it is unsurprising that the uncertainties reported here are, on average, smaller than those of the fiducial lines reported in Hell et al. (Reference Hell, Brown, Wilms, Grinberg, Clementson, Liedahl, Porter, Kelley, Kilbourne and Beiersdorfer2016). This is due to the simultaneous use of six fiducials along with the detailed wavelength dispersion modelling of the instrument geometry.
$5.44\times 10^{-5}$
. Although, at present, we do not have an analytical method to determine expected improvement in the uncertainty, it is unsurprising that the uncertainties reported here are, on average, smaller than those of the fiducial lines reported in Hell et al. (Reference Hell, Brown, Wilms, Grinberg, Clementson, Liedahl, Porter, Kelley, Kilbourne and Beiersdorfer2016). This is due to the simultaneous use of six fiducials along with the detailed wavelength dispersion modelling of the instrument geometry.
5. Theoretical calculations
The spectral features arising from multi-electron ions, particularly the Be-like and B-like features discussed in this work, are challenging to interpret (Safronova & Lisina Reference Safronova and Lisina1979), and collisional–radiative modelling is crucial to obtain accurate line identifications. Thus, we employed the Los Alamos suite of relativistic (LASER) atomic physics codes to generate a collisional–radiative model, starting with the fully relativistic RATS atomic structure code and the GIPPER ionisation code (Fontes et al. Reference Fontes, Zhang, Jr, Clark, Kilcrease, Colgan, Cunningham, Hakel, Magee and Sherrill2015). The RATS code employs a Dirac–Fock–Slater approach (Sampson, Zhang & Fontes Reference Sampson, Zhang and Fontes2009) and is the fully relativistic analogue of the semi-relativistic atomic structure code CATS, which is based on Cowan’s atomic structure code (Cowan Reference Cowan1981). In addition to generating energy levels, wavefunctions and radiative rates, we used RATS to calculate electron-impact excitation cross-sections via the plane-wave Born approximation. While the distorted-wave approach could have been used to generate more accurate electron-impact excitation data, we found that plane-wave Born results were sufficient for the purpose of line identification in this work. The GIPPER code produces fundamental ionisation rate data for the three main ionisation pathways (electron-impact ionisation, photoionisation and autoionisation). The GIPPER code employs the distorted-wave approach using relativistic wavefunctions for bound electrons produced with RATS, and solutions of the Dirac equation are obtained within GIPPER for the continuum-electron wavefunctions (e.g. Sampson et al. Reference Sampson, Zhang and Fontes2009).
The fundamental atomic physics data (energy levels, cross-sections and rates for the various fundamental processes) are then used within ATOMIC (another theoretical opacity modelling code) to construct and solve the system of collisional–radiative equations (e.g. equation (2) in Oelgoetz et al. (Reference Oelgoetz, Fontes, Zhang and Pradhan2007)). We ran non-local thermodynamic equilibrium ATOMIC calculations at the independently measured plasma conditions to produce the full synthetic emission spectrum over the entire observed wavelength range. These conditions include an electron temperature of 25 eV and a radiation drive represented by the superposition of three Planckians evaluated at temperatures of 45.7, 87.4 and 162 eV, with dilution factors of 0.137, 0.0389 and 0.00328, respectively.
The atomic physics model includes contributions from the H–like to C–like charge states, comprising configurations with occupied atomic orbitals up to a maximum principal quantum number of $n_{\textrm {max}} = 10$
. The list of considered configurations, described in table 1, includes a variety of electron permutations from the ground configuration of each charge state. All possible fine-structure energy levels that arise from these configurations were generated via a standard configuration-interaction approach (Sampson et al. Reference Sampson, Zhang and Fontes2009; Fontes et al. Reference Fontes, Zhang, Jr, Clark, Kilcrease, Colgan, Cunningham, Hakel, Magee and Sherrill2015), resulting in more than 35 000 levels.
$n_{\textrm {max}} = 10$
. The list of considered configurations, described in table 1, includes a variety of electron permutations from the ground configuration of each charge state. All possible fine-structure energy levels that arise from these configurations were generated via a standard configuration-interaction approach (Sampson et al. Reference Sampson, Zhang and Fontes2009; Fontes et al. Reference Fontes, Zhang, Jr, Clark, Kilcrease, Colgan, Cunningham, Hakel, Magee and Sherrill2015), resulting in more than 35 000 levels.
A list of configurations expressed in standard supershell notation for H-like to C-like ions of Si. The symbol $[n]^w$
represents all permitted sets of orbital combinations that can arise from permuting
$[n]^w$
represents all permitted sets of orbital combinations that can arise from permuting $w$
electrons within the shell denoted by principal quantum number
$w$
electrons within the shell denoted by principal quantum number $n$
. The notation
$n$
. The notation $[n - n']^w$
indicates that
$[n - n']^w$
indicates that $w$
electrons are to be permuted within a range of shells, from
$w$
electrons are to be permuted within a range of shells, from $n$
to
$n$
to $n'$
.
$n'$
.

Figure 14 plots the synthetic emission spectrum obtained from this model, broken down by each ion’s contribution to the total emission. The sum total predicted emission from all ion charges is convolved with the instrument resolution function and plotted in figures 10, 15, 16 and 17 (blue).
ATOMIC synthetic spectrum calculation broken down by individual ion contribution.

He- and Li-like lines from both silicon datasets. Grey shaded regions denote uncertainties in intensity. Individual Voigt component of each emission feature is plotted in red. The full fitted spectrum (sum of all Voigt components) is plotted in purple. The ATOMIC calculation (blue) has been shifted to the right by 5 mÅ as in other plots. Identified lines are labelled by keys listed in table 3. Labels for lines used as fiducials in the wavelength calibration are plotted in black. In cases where a given feature corresponds to multiple transitions, only the first transition listed in the table (the strongest contribution to the line) is indicated. For the sake of clarity, this zoomed-in figure only plots the individual Voigt components (red) for which we have identified a corresponding transition in table 3. However, the full fitted spectrum (purple) in this figure is the same as what is plotted in figure 10 – the sum of all of the individual components in the total fit.

Be-like lines from both silicon datasets. Grey shaded regions denote uncertainties in intensity. Individual Voigt component of each emission feature is plotted in red. The full fitted spectrum (sum of all Voigt components) is plotted in purple. The ATOMIC calculation (blue) has been shifted to the right by 5 mÅ as in other plots. Identified lines are labelled by keys listed in table 3. Labels for lines used as fiducials in the wavelength calibration are plotted in black. In cases where a given feature corresponds to multiple transitions, only the first transition listed in the table (the strongest contribution to the line) is indicated. For the sake of clarity, this zoomed-in figure only plots the individual Voigt components (red) for which we have identified a corresponding transition in table 3. However, the full fitted spectrum (purple) in this figure is the same as what is plotted in figure 10 – the sum of all of the individual components in the total fit.

B-like lines from both silicon datasets. Grey shaded regions denote uncertainties in intensity. Individual Voigt component of each emission feature is plotted in red. The full fitted spectrum (sum of all Voigt components) is plotted in purple. The ATOMIC calculation (blue) has been shifted to the right by 5 mÅ as in other plots. Identified lines are labelled by keys listed in table 3. Labels for lines used as fiducials in the wavelength calibration are plotted in black. In cases where a given feature corresponds to multiple transitions, only the first transition listed in the table (the strongest contribution to the line) is indicated. For the sake of clarity, this zoomed-in figure only plots the individual Voigt components (red) for which we have identified a corresponding transition in table 3. However, the full fitted spectrum (purple) in this figure is the same as what is plotted in figure 10 – the sum of all of the individual components in the total fit.

After shifting the ATOMIC spectrum by 5 mÅ towards higher wavelengths, the qualitative match between the calculated and measured spectra was good enough to provide line identifications for a number of features. This shift of 5 mÅ was required because the RATS transition energies that were used to generate the synthetic spectrum did not include the improvements associated with the generalised Breit interaction and first-order quantum electrodynamic corrections, which become progressively more important for high charge states of high- $Z$
elements (Fontes, Sampson & Zhang Reference Fontes, Sampson and Zhang1993; Sampson et al. Reference Sampson, Zhang and Fontes2009). However, the final transition energies reported in table 3 were calculated with the generalised Breit interaction + first-order quantum electrodynamic corrections and represent the most accurate theoretical values available from the LASER codes.
$Z$
elements (Fontes, Sampson & Zhang Reference Fontes, Sampson and Zhang1993; Sampson et al. Reference Sampson, Zhang and Fontes2009). However, the final transition energies reported in table 3 were calculated with the generalised Breit interaction + first-order quantum electrodynamic corrections and represent the most accurate theoretical values available from the LASER codes.
Average absolute differences between measured and predicted line-centre energies broken down by ion. For the NIST and XSTAR’s uaDB database, the average difference is only computed using the transitions for which a transition energy exists.

Identifications of the fitted silicon line centres.
 ${}^{*}$
Fiducial lines from Hell et al. (Reference Hell, Brown, Wilms, Grinberg, Clementson, Liedahl, Porter, Kelley, Kilbourne and Beiersdorfer2016) used to perform wavelength dispersion axis calibration as described in § 3.
${}^{*}$
Fiducial lines from Hell et al. (Reference Hell, Brown, Wilms, Grinberg, Clementson, Liedahl, Porter, Kelley, Kilbourne and Beiersdorfer2016) used to perform wavelength dispersion axis calibration as described in § 3. ${}^{a}$
Level configuration label is different for FAC versus RATS as noted in § 6. The configuration label listed in the table follows the RATS convention which uses the state with the next most significant mixing coefficient if the label(s) for a more dominant state(s) has(have) already been used, thus ensuring unique configuration labels. The FAC label, on the other hand, corresponds to the state with the dominant mixing coefficient. Corresponding FAC labels are available upon request.
${}^{a}$
Level configuration label is different for FAC versus RATS as noted in § 6. The configuration label listed in the table follows the RATS convention which uses the state with the next most significant mixing coefficient if the label(s) for a more dominant state(s) has(have) already been used, thus ensuring unique configuration labels. The FAC label, on the other hand, corresponds to the state with the dominant mixing coefficient. Corresponding FAC labels are available upon request. ${}^{b}$
There are two features that could be equally justified in being identified as Be-9. We arbitrarily chose the feature at the longer wavelength to report in this table. See discussion on the Be-like charge state in § 6.
${}^{b}$
There are two features that could be equally justified in being identified as Be-9. We arbitrarily chose the feature at the longer wavelength to report in this table. See discussion on the Be-like charge state in § 6.
The validity of the theoretical line identifications associated with each emission feature depends on the accuracy of the calculated transition energies, atomic level populations in the plasma and the radiative decay rates, all of which are used to predict the location and strengths of the various lines. In cases where an emission feature was predicted to be composed of multiple, overlapping lines, we chose to include only those transitions that contributed strongly to the feature, as indicated by the ATOMIC calculations.
We have also calculated the transition wavelengths with FAC (Gu Reference Gu2008b ) for additional comparison. We did not explicitly calculate a synthetic spectrum using FAC, rather we rely on the line identifications made using ATOMIC and compare against the corresponding wavelength predictions in FAC for those same transitions. FAC is a relativistic atomic code, which solves the Dirac equation in a central field potential for one-electron radial wavefunctions. The electron correlations are taken into account using a combination of configuration interaction and second-order many-body perturbation theory (Gu et al. Reference Gu, Holczer, Behar and Kahn2006). The calculations start with a configuration interaction expansion in a multi-reference model space, where interactions between configurations are expected to be strong. The weaker interactions between the reference space and the configuration space orthogonal to the reference model are then included in the second order many-body perturbation theory. Comparisons between the measured line centres and the predicted FAC atomic energy levels are provided alongside the corresponding RATS data in table 3.
6. Discussion
The data presented in this paper immediately highlight the challenge involved in producing, analysing and modelling photoionised plasmas, an ongoing subject of active research around the world. This platform has successfully demonstrated the ability to reliably produce plasmas with bright enough self-emission intensity to collect high-S/N spectra owing to the intense radiation drive from the Z-pinch. One of the key benefits associated with the platform in the context of this high-resolution Si emission measurement is the fact that the emission intensity is bright despite the relatively low plasma densities. Thus, Stark broadening is minimal but the radiation drive produces an exotic plasma with large populations of a diverse set of excited states among many different ions.
It is more likely that there are other sources of uncertainty besides density effects that could lead to the observed model-to-data discrepancies. While we reserve more detailed discussion for future work, we mention here some of the possibilities. In particular, the input radiation drive spectrum is modelled as a superposition of three Planckians based on a best fit to the data used to constrain the Z-pinch radiation drive. The radiation drive spectrum input into the ATOMIC calculation thus assumes a smooth continuum and does not account for the complicated spectral structure imprinted by the tungsten that makes up the wire array used to produce the Z-pinch. Some other possibilities for the model-to-data discrepancies include non-uniformity in the radial spatial profile of the temperature and density along the direction of the Z-pinch propagation and possibly time evolution of the plasma conditions and charge states throughout the duration of the Z-pinch radiation drive.
The platform has the advantage that it allows us to observe many more lines than are typical for plasmas produced with other facilities like EBITs or tokamaks, allowing us to build on the foundation of the recent pioneering EBIT measurements (Hell et al. Reference Hell, Brown, Wilms, Grinberg, Clementson, Liedahl, Porter, Kelley, Kilbourne and Beiersdorfer2016). Indeed, this dataset contains observations of many lines that have never been observed before. However, we pay a price for the spectral detail. The main downside of the platform is that the plasma involves complicated physics which are a challenge even for current state-of-the-art modelling capabilities. One possible benefit of this analysis is that the challenges encountered here may be similar to and therefore useful for those posed by future spectral observations of astrophysical photoionised plasmas as the resolution of satellite X-ray observatories continues to increase.
The data suggest that shot z2972 reached higher ionisation states than shot z3532 given that, overall, the intensities of the He-like and Li-like lines are stronger and the intensities of the Be-like lines are weaker in z2972 than in z3532 (see figure 10). The two shots were taken roughly five years apart, which reflects some diminished level of expected reproducibility since various components of the Z-machine have been replaced or upgraded during that time. Additionally, the detailed composition and specifications of the wire array may have changed over the years, and the suppliers of the materials may have changed as well. There are many factors that, in aggregate, might contribute to differences in the radiation drive spectrum of the Z-pinch, and subsequently in the observed Si emission spectra.
Both datasets exhibit a high S/N ratio across the entire wavelength range. Additionally, for well-isolated lines and stronger lines with minimal blending, the fixed-width Voigt profiles provide reasonable matches to the widths of the lines in the data. In cases where there is blending, the collection of lines also matches well the total width of the blended set. This agreement provides confidence that our analytical wavelength-dependent resolution curves are accurate enough to enable reliable analysis throughout the wavelength range containing the observed lines.
One puzzle that we do not have a satisfactory explanation for is that the intensities in the regions between lines are higher than we would expect. One particularly strong example occurs in the region between Be-5 and Be-6 at ${\sim}6.792$
Å (see figure 16). In the z2972 data, it seems plausible that there may be strong additional blended lines between these two features associated with the obvious shoulders. However, in shot z3532, this explanation is less likely because we observed a smooth still elevated continuum but without obvious shoulder features. In the case of z3532, the continuum may be a blend of a large number of weak transitions.
${\sim}6.792$
Å (see figure 16). In the z2972 data, it seems plausible that there may be strong additional blended lines between these two features associated with the obvious shoulders. However, in shot z3532, this explanation is less likely because we observed a smooth still elevated continuum but without obvious shoulder features. In the case of z3532, the continuum may be a blend of a large number of weak transitions.
We identified two transitions from the He-like, 16 transitions from the Li-like, 20 transitions from the Be-like and 15 transitions from the B-like charge states. Detailed configuration information and predicted transition energies from RATS, FAC, NIST and XSTAR (uaDB) are provided in table 3. (References for the original experimental measurements and relevant theoretical calculations used to encode the NIST database are presented in Martin & Zalubas (Reference Martin and Zalubas1983).) We also provide a mapping to the widely used line labels from Gabriel (Reference Gabriel1972) and Bely-Dubau et al. (Reference Bely-Dubau, Faucher, Dubau and Gabriel1982) in parentheses in the first column.
Many of the lines associated with these transitions overlap significantly and appear to belong to the same emission feature in the data. Where this occurs, we use three dots in table 3 to indicate that the dotted transition overlaps with the closest numbered transition preceding it.
Figures 15, 16 and 17 provide zoomed-in views of figure 10 focusing on the He- and Li-like, Be-like and B-like lines, respectively. Each figure plots the data from each of the two shots (black) in separate panels along with the associated uncertainty on the data (grey), the Voigt component fits for each emission feature (red) and the sum of all Voigt components for each shot (purple). Each panel also plots the ATOMIC calculation (blue) to show the qualitative match used to identify the lines in the data. Not all observed lines in the data are predicted by ATOMIC and not all lines predicted by ATOMIC are observed in the data. Where this occurs, we note the discrepancy in §§ 6.1–6.4
As mentioned previously, the ATOMIC calculation was shifted to higher wavelengths by a constant 5 mÅ across the entire spectrum. This was done to obtain the best qualitative match with the wavelength positions of the observed spectral features and facilitate matching the lines for identifications. The blue vertical lines align with the individual transition locations in the ATOMIC calculation and the corresponding labels in the top panel of each figure are the line labels in column 1 of table 3. Because each emission feature is often composed of lines associated with multiple transitions, the vertical lines do not always line up with the exact centre of the emission feature in the spectrum produced with ATOMIC. Rather, their locations match the exact energy/wavelength predicted by RATS of a single transition that contributes to the line feature. When there are multiple transitions associated with a given feature that we have identified in table 3, we only indicate one vertical line for the first numbered transition. In other words, there are no vertical lines corresponding to table entries whose first column is ‘ $\ldots$
’.
$\ldots$
’.
Finally, we note a difference between RATS and FAC in level-labelling conventions. The RATS code does not repeat configuration name labels more than once. Therefore, the labels that are listed in table 3 may not be the dominant basis state associated with a given fine-structure level. Whereas in FAC, the labels are those corresponding to the dominant mixing coefficient, and are sometimes duplicated. For all states for which we encountered a duplicate label in FAC, the ambiguity was easily resolved by looking at the energies of the transitions. In other words, there was always one clear correct identification of the fine-structure level(s) involved in the transition because the energy of the other level(s) was(were) too discrepant to be correct.
6.1. He-like silicon (Si XIII)
We observe two $1{\rm s} \to 2{\rm p}$
lines arising from He-like silicon: the resonance line known as the ‘w’ line (He-1) and the spin-forbidden or intercombination or ‘y’ line (He-2) (figure 15). While we detect both lines in both datasets, they are much weaker in z3532. The intensity of the ‘w’ line is greater than that of the ‘y’ line in z3532. However, in z2972, the lines are of comparable intensity. This behaviour could have implications for differences in the excitation processes in the plasma. Recombination alone would make the ‘y’ line stronger than the ‘w’ line. There may be additional overlapping lines contributing to the intensity.
$1{\rm s} \to 2{\rm p}$
lines arising from He-like silicon: the resonance line known as the ‘w’ line (He-1) and the spin-forbidden or intercombination or ‘y’ line (He-2) (figure 15). While we detect both lines in both datasets, they are much weaker in z3532. The intensity of the ‘w’ line is greater than that of the ‘y’ line in z3532. However, in z2972, the lines are of comparable intensity. This behaviour could have implications for differences in the excitation processes in the plasma. Recombination alone would make the ‘y’ line stronger than the ‘w’ line. There may be additional overlapping lines contributing to the intensity.
6.2. Li-like silicon (Si XII)
We report 16 $1{\rm s} \to 2{\rm p}$
Li-like silicon transitions associated with 10 distinct emission line features in our data (figure 15). Four of these transitions overlap with others and are blended into the same line feature. For example, three separate transitions are associated with the Li-1 feature. For blended lines, we report the same transition energy for the set of overlapping transitions. For five of the Li-like transitions (Li-2, −3, −4, −5 and −10), experimental measurements of the upper states were recently compiled by Azarov, Kramida & Ralchenko (Reference Azarov, Kramida and Ralchenko2023) to update the NIST database with more accurate line-centre wavelengths and updated uncertainties that represent the weighted mean of the complete collection of available experimental measurements of energy levels of Li-like ions (Walker & Rugge Reference Walker and Rugge1971; Aglitskii et al. Reference Aglitskii, Boiko, Zakharov, Pikuz and Faenov1974; Walker et al. Reference Walker, Rugge and Weiss1974; Hell et al. Reference Hell, Brown, Wilms, Grinberg, Clementson, Liedahl, Porter, Kelley, Kilbourne and Beiersdorfer2016). For these five lines, the transition energies reported in the NIST column in table 3 in this paper were calculated using the weighted mean experimental energies provided in Azarov et al. (Reference Azarov, Kramida and Ralchenko2023), rather than those provided in the NIST ASD.
$1{\rm s} \to 2{\rm p}$
Li-like silicon transitions associated with 10 distinct emission line features in our data (figure 15). Four of these transitions overlap with others and are blended into the same line feature. For example, three separate transitions are associated with the Li-1 feature. For blended lines, we report the same transition energy for the set of overlapping transitions. For five of the Li-like transitions (Li-2, −3, −4, −5 and −10), experimental measurements of the upper states were recently compiled by Azarov, Kramida & Ralchenko (Reference Azarov, Kramida and Ralchenko2023) to update the NIST database with more accurate line-centre wavelengths and updated uncertainties that represent the weighted mean of the complete collection of available experimental measurements of energy levels of Li-like ions (Walker & Rugge Reference Walker and Rugge1971; Aglitskii et al. Reference Aglitskii, Boiko, Zakharov, Pikuz and Faenov1974; Walker et al. Reference Walker, Rugge and Weiss1974; Hell et al. Reference Hell, Brown, Wilms, Grinberg, Clementson, Liedahl, Porter, Kelley, Kilbourne and Beiersdorfer2016). For these five lines, the transition energies reported in the NIST column in table 3 in this paper were calculated using the weighted mean experimental energies provided in Azarov et al. (Reference Azarov, Kramida and Ralchenko2023), rather than those provided in the NIST ASD.
The z2972 data show interesting ‘shoulder’ features flanking either side of the Li-9 feature that we have not successfully identified as discrete transitions. A small shoulder is also observed on the right (higher-wavelength) end of the feature in the data from z3532. The ATOMIC calculation predicts a relatively strong line between 6.715 and 6.72 mÅ that we do not observe in the data.
There are also differences between the two shot datasets in the set of features (Li-10 through Li-12) to the right of the main cluster of Li-like lines above $\sim$
1840.9 eV (6.735 Å). As mentioned previously, these subtle differences may be due to slight differences in charge state or small-scale inhomogeneities in the plasma.
$\sim$
1840.9 eV (6.735 Å). As mentioned previously, these subtle differences may be due to slight differences in charge state or small-scale inhomogeneities in the plasma.
Finally, the two transitions corresponding to the line labelled as Li-11 are particularly speculative two-electron transitions of the type: 1s $^2$
3s
$^2$
3s $\to$
1s2s3p. We observe a distinct feature at that location in the z2972 dataset. However, the corresponding feature in the ATOMIC calculation is very weak. A definitive identification would require better theory/experimental investigations.
$\to$
1s2s3p. We observe a distinct feature at that location in the z2972 dataset. However, the corresponding feature in the ATOMIC calculation is very weak. A definitive identification would require better theory/experimental investigations.
6.3. Be-like silicon (Si XI)
As we approach higher wavelengths in the dataset, the phenomenon of elevated continuum background contribution between lines becomes more pronounced. In addition, identifications of some of the 20 Be-like lines become more ambiguous (see figure 16). The most ambiguous of these is the identification of Be-9 ( ${\sim}6.804$
Å). In both datasets, there are two identifiable lines flanking either side of the single feature in the ATOMIC calculation. In shot z3532, the left feature is significantly blended and does not offer a distinct peak, but rather manifests as a shoulder. We decided to choose the peak on the right (higher-wavelength) side to identify as the Be-9 feature; however, the peak on the left side may just as easily be the correct one. Definitive identification of these two features will require improved modelling in the future. The uncertainties of the Be-like lines are also considerably larger than those of the He-like and Li-like lines in cases where there is significant blending. In some cases, the larger uncertainty is due to the additional blending. However, for the largest of the uncertainties, the difference between the two shots is the dominant source.
${\sim}6.804$
Å). In both datasets, there are two identifiable lines flanking either side of the single feature in the ATOMIC calculation. In shot z3532, the left feature is significantly blended and does not offer a distinct peak, but rather manifests as a shoulder. We decided to choose the peak on the right (higher-wavelength) side to identify as the Be-9 feature; however, the peak on the left side may just as easily be the correct one. Definitive identification of these two features will require improved modelling in the future. The uncertainties of the Be-like lines are also considerably larger than those of the He-like and Li-like lines in cases where there is significant blending. In some cases, the larger uncertainty is due to the additional blending. However, for the largest of the uncertainties, the difference between the two shots is the dominant source.
For the first Be-9 transition, and the Be-10 transitions, the listed upper states (from RATS) were not found in the FAC collection of Be-like atomic states. We suspect that this is due to the previously mentioned difference in level-labelling conventions associated with the mixing coefficients. The upper levels for these transitions contain a strong amount of mixing and the basis-state labels provided in the table do not correspond to the state with the dominant mixing coefficient. For these three lines, we identified the state in RATS associated with the dominant mixing coefficient and queried those in FAC instead.
There are several potential blended lines detected in the data (e.g. between Be-4 and Be-5, between Be-5 and Be-6 and above ${\sim}6.807$
Å) that were not predicted by ATOMIC. The discrepancy is puzzling and indicates potential inaccuracies in atomic rate coefficients or potential time-dependent effects in the plasma. These additional lines, which appear in the data but not in the modelled spectrum, make the identification of Be-4 particularly ambiguous among the Be-like lines.
${\sim}6.807$
Å) that were not predicted by ATOMIC. The discrepancy is puzzling and indicates potential inaccuracies in atomic rate coefficients or potential time-dependent effects in the plasma. These additional lines, which appear in the data but not in the modelled spectrum, make the identification of Be-4 particularly ambiguous among the Be-like lines.
6.4. B-like silicon (Si X)
The B-like lines are the most speculative among the identifications we provide in this paper (figure 17). The line fits are less certain as the continuum levels between lines are much higher or there are many more blended components which blur the discreteness of the line features. Nevertheless, there is good enough correspondence between the locations of the features in the ATOMIC calculation and the fit results of the data to offer some possible identifications. NIST and XSTAR comparisons could not be included in the table because these databases do not contain energies for the states involved in the B-like transitions.
7. Results and conclusions
The high spectral resolution of this dataset allowed us to record transition energy values of many silicon lines for the first time in any observational setting, as far as we are aware. While lines from similar charge states of silicon have been observed in the past, the data presented in this paper resolve many more individual lines and contribute a much more detailed validation of atomic structure calculations. Our error analysis establishes robust uncertainty bounds for the measured wavelength values of the transitions we observed.
These data succeed in resolving some of the ambiguity among different databases for many $1{\rm s}\to nl$
transitions arising from He-like to B-like silicon ions. The data extend to higher wavelengths and include observations of transitions from C-like charge states as well. However, the line blending becomes even more severe and the ATOMIC calculations predicted almost no emission from the C-like ion stage. Thus, we were unable to definitively identify any transitions associated with the C-like region of the spectrum.
$1{\rm s}\to nl$
transitions arising from He-like to B-like silicon ions. The data extend to higher wavelengths and include observations of transitions from C-like charge states as well. However, the line blending becomes even more severe and the ATOMIC calculations predicted almost no emission from the C-like ion stage. Thus, we were unable to definitively identify any transitions associated with the C-like region of the spectrum.
The data collected thus far and presented in this paper are limited to a few ions of one element and we report comparisons of a selection of widely referenced codes/databases among the astrophysical community. The average absolute differences relative to experimentally measured values are 0.26, 0.39, 0.17 and 0.39 eV for RATS, FAC, NIST and XSTAR’s uaDB, respectively. Table 2 also contains average differences broken down by ion. All codes/databases show good agreement with the experimental values with the NIST ASD values showing the closest match overall.
While the predicted transition energies presented here generally agree well with our measured values, this result does not diminish the chances that more consequential differences may exist for other ions and other elements. Therefore, we reiterate that additional laboratory measurements with high resolving power, such as those presented in this paper, are needed to better interpret the coming data from future high-resolution X-ray telescopes such as XRISM (Tashiro et al. Reference Tashiro2025) and NewAthena (Nandra et al. Reference Nandra2013; Ravera et al. Reference Ravera, Takahashi, den Herder and Bautz2014; Cruise et al. Reference Cruise2025).
We hope to repeat this process using Fe L-shell and Ca K-shell emission data that we have collected using a slightly modified version of the experimental platform and for other astrophysically relevant elements in the future.
Acknowledgements
This work was performed at Sandia National Laboratories. We thank the Z facility teams and in particular R. Harmon, L. Molina, B. Ritter, J. Mignon, M. McCall, J. Swalby, A. Edens and R. Speas for their support. We wish to acknowledge the support of the Z Astrophysical Plasma Properties (ZAPP) collaboration and the Fundamental Science Program at Z. We thank the referees for their thoughtful and helpful comments and suggestions and B. Dunlap, M. Montgomerey and D. Winget for guidance and helpful discussion.
Editor Louise Willingale thanks the referees for their advice in evaluating this article.
Funding
P.B.C. acknowledges support from the DOE NNSA LRGF under the United States Department of Energy cooperative agreement DE-NA0003960. P.B.C and D.C.M. acknowledge support from the Wootton Center for Astrophysical Plasma Properties under the United States Department of Energy cooperative agreement number DE-NA0003843 and from the United States Department of Energy grant under DE-NA0004149. The work of C.J.F. was supported by the US Department of Energy through the Los Alamos National Laboratory, which is operated by Triad National Security, LLC, for the National Nuclear Security Administration of the US Department of Energy (contract no. 89233218CNA000001). J.A.G. acknowledges support from Smithsonian Astrophysical Observatory grant AR0-21003X.
Sandia National Laboratories is a multimission laboratory managed and operated by National Technology and Engineering Solutions of Sandia, LLC, a wholly owned subsidiary of Honeywell International, Inc., for the US Department of Energy’s National Nuclear Security Administration under contract DE-NA-0003525. This paper describes objective technical results and analysis. Any subjective views or opinions that might be expressed in the paper do not necessarily represent the views of the US Department of Energy or the United States Government.
This paper has been authored in part at Lawrence Livermore National Security, LLC, under contract no. DE-AC52-07NA2 7344 with the US Department of Energy. The United States Government retains, and the publisher, by accepting the article for publication, acknowledges that the United States Government retains a non-exclusive, paid-up, irrevocable, world-wide licence to publish or reproduce the published form of this paper, or allow others to do so, for United States Government purposes.
Declaration of interests
The authors report no conflict of interest.
Appendix A. GAUSSPY details
Here, we provide additional details regarding the GAUSSPY algorithm for interested readers. The process of autonomous identification of initial guesses for the parameters of the individual spectral components involves a set of selection criteria based on the values of the first ( $ \mathrm{d}f/\mathrm{d}x$
) to fourth (
$ \mathrm{d}f/\mathrm{d}x$
) to fourth ( $\mathrm{d}^4f/\mathrm{d} x^4$
) derivatives. Here
$\mathrm{d}^4f/\mathrm{d} x^4$
) derivatives. Here $f$
represents the spectral intensity and
$f$
represents the spectral intensity and $x$
represents energies/wavelengths. The derivatives are numerically calculated and used to locate points in the data where there are local minima of negative curvature. Where the second derivative is negative, the original data have negative curvature (the data are concave down). Where the third derivative is equal to zero, there is a local minimum or local maximum in the plot of curvature (local maximum in the second derivative). Finally, among the points identified by the previous criteria, enforcing the criteria that the fourth derivative is positive picks out local minima in the second derivative plot of curvature. In other words, GAUSSPY works by identifying locations where the data are above some noise threshold, concave down, and where the concavity reaches a local minimum. By using these criteria GAUSSPY is able to identify good initial parameter guesses even for difficult circumstances, for example, where a line is significantly blended into a neighbouring line such that the feature manifests in the spectrum as a shoulder without a well-defined peak.
$x$
represents energies/wavelengths. The derivatives are numerically calculated and used to locate points in the data where there are local minima of negative curvature. Where the second derivative is negative, the original data have negative curvature (the data are concave down). Where the third derivative is equal to zero, there is a local minimum or local maximum in the plot of curvature (local maximum in the second derivative). Finally, among the points identified by the previous criteria, enforcing the criteria that the fourth derivative is positive picks out local minima in the second derivative plot of curvature. In other words, GAUSSPY works by identifying locations where the data are above some noise threshold, concave down, and where the concavity reaches a local minimum. By using these criteria GAUSSPY is able to identify good initial parameter guesses even for difficult circumstances, for example, where a line is significantly blended into a neighbouring line such that the feature manifests in the spectrum as a shoulder without a well-defined peak.
In order for this approach to work, there must be some measure of noise suppression in the original dataset. Finite-difference differentiation has the effect of amplifying noise in numerically calculated derivatives that would otherwise produce many spurious initial guesses. To avoid this, GAUSSPY achieves noise suppression by regularising the differentiation. In a broad sense, the derivative is forced to remain smooth while it is fitted to the data. The strength of the smoothness constraint is imposed by the parameter $\alpha$
. The trade-off for larger values of
$\alpha$
. The trade-off for larger values of $\alpha$
, or more smoothing, is data fidelity. Once the
$\alpha$
, or more smoothing, is data fidelity. Once the $\alpha$
value has been chosen, GAUSSPY can be used to identify the starting set of initial guesses. It then uses standard Python libraries to perform Levenberg–Marquardt least-squares minimisation and returns best-fit parameters for the mean, standard deviation and FWHM of each Gaussian spectral component in the data.
$\alpha$
value has been chosen, GAUSSPY can be used to identify the starting set of initial guesses. It then uses standard Python libraries to perform Levenberg–Marquardt least-squares minimisation and returns best-fit parameters for the mean, standard deviation and FWHM of each Gaussian spectral component in the data.
GAUSSPY provides built-in machine learning functions that use supervised learning to determine a good value for $\alpha$
. The algorithm can be trained using either fully synthetic data or real data that have already been decomposed. The advantage of using a fully synthetic dataset is that the parameters associated with the decomposition represent the true values of the underlying spectral components. On the other hand, using real data to train the algorithm engages it with a more realistic task. We tested both types of training data and used various initial values of
$\alpha$
. The algorithm can be trained using either fully synthetic data or real data that have already been decomposed. The advantage of using a fully synthetic dataset is that the parameters associated with the decomposition represent the true values of the underlying spectral components. On the other hand, using real data to train the algorithm engages it with a more realistic task. We tested both types of training data and used various initial values of $\alpha$
for the training phase to properly explore the parameter space and ensure the solution was not falsely ensconced in a local minimum. The two types of training data returned slightly different trained values for
$\alpha$
for the training phase to properly explore the parameter space and ensure the solution was not falsely ensconced in a local minimum. The two types of training data returned slightly different trained values for $\alpha$
. Nevertheless, the different
$\alpha$
. Nevertheless, the different $\alpha$
values returned the same decomposition results. Using the trained value of
$\alpha$
values returned the same decomposition results. Using the trained value of $\alpha$
returns the ‘less flexible’ fit results presented in figure 13. Using a very small value for
$\alpha$
returns the ‘less flexible’ fit results presented in figure 13. Using a very small value for $\alpha$
effectively limits the amount of smoothing, leading the algorithm to identify many more initial guesses. The large number of initial guesses provides the fit with more flexibility and naturally yields the ‘more flexible’ fit results presented in figure 10.
$\alpha$
effectively limits the amount of smoothing, leading the algorithm to identify many more initial guesses. The large number of initial guesses provides the fit with more flexibility and naturally yields the ‘more flexible’ fit results presented in figure 10.
Appendix B. Further details regarding the error analysis method
In order to characterise the fluctuations in intensity, we start by assuming that the process that influences the per pixel intensity of the scanned digitised film data is a random Poisson process. This can be justified by the fact that the intensity is fundamentally associated with the number of photons that were incident on the film, and photon count is a classic Poisson process. The uncertainty of a classic Poisson process is $\sigma = \sqrt {N}$
. In our case, N is the number of photons that hit the film. Though it is appealing in its simplicity, this picture is not easily applicable because of the additional sources of uncertainty introduced at each step of the film data processing routine described above. Nevertheless, we take the Poissonian approach under the assumption that, ultimately, all of the processing steps yield a final measured quantity that behaves according to Poisson statistics.
$\sigma = \sqrt {N}$
. In our case, N is the number of photons that hit the film. Though it is appealing in its simplicity, this picture is not easily applicable because of the additional sources of uncertainty introduced at each step of the film data processing routine described above. Nevertheless, we take the Poissonian approach under the assumption that, ultimately, all of the processing steps yield a final measured quantity that behaves according to Poisson statistics.
One intermediate quantity to which the data are converted is our best estimate of exposure, or photons per square micrometre. Even though photon count is the precise quantity that behaves as a Poisson process, we do not measure photon counts directly but must infer them after many processing steps. Therefore, we cannot necessarily assume that the uncertainties are given by the square root of the exposure values. Instead, we assume that there is a constant scaling factor between the measured exposure units and the fundamental count values:
 \begin{align} N_{ij} = CI_{ij}, \end{align}
where $N$
represents fundamental counts,
$N$
represents fundamental counts, $I$
represents the exposure value and
$I$
represents the exposure value and $ij$
represents the pixel indices. If we assume that this scaling factor is the same across the entire dataset (i.e. it does not vary with wavelength), then we can also assume that the fractional uncertainties are invariant and that the constant scaling factor can also be used to convert the errors:
$ij$
represents the pixel indices. If we assume that this scaling factor is the same across the entire dataset (i.e. it does not vary with wavelength), then we can also assume that the fractional uncertainties are invariant and that the constant scaling factor can also be used to convert the errors:
 \begin{align} \frac {\sigma _{ij}^{\textrm {count}}}{{N_{ij}^{\textrm {count}}}} &= \frac {\sigma _{ij}^{\textrm {data}}}{{N_{ij}^{\textrm {data}}}}, \end{align}
 \begin{align} \frac {\sigma _{ij}^{\textrm {count}}}{{N_{ij}^{\textrm {count}}}} &= \frac {\sigma _{ij}^{\textrm {data}}}{{N_{ij}^{\textrm { count}}/C}}, \end{align}
 \begin{align} \sigma _{ij}^{\textrm {count}} &= C\sigma _{ij}^{\textrm {data}}. \end{align}
Then, the uncertainty in the measured values is given by
 \begin{align} \sigma _{ij}^{\textrm {data}} = \sqrt {I_{ij}^{\textrm {data}}/C}. \end{align}
In order to evaluate the uncertainty then, we need to find a way to estimate the quantity C. To do this, we first define a quantity called the normalised noise. This quantity is intended to represent the ratio of the observed noise in a given pixel to the true uncertainty associated with the intensity of that pixel:
 \begin{align} \textrm {Normalized noise} = \frac {I_{\textrm {bkg}} - I_{\textrm {bkg,true}}}{\sigma _{\textrm{bkg,true}}} = \frac {I_{\textrm {bkg}} - I_{\textrm {bkg,true}}}{\sqrt {I_{\textrm {bkg,true}}}}. \end{align}
Assuming we can find a fair representation of $I_{\textrm {bkg,true}}$
, or the ‘true’ intensities of the pixel counts, we can measure the differences between the observed intensities and true intensities. The ensemble of observed pixel intensities should depart from their respective true pixel intensities by different amounts. If the difference observed in each pixel is scaled according to its uncertainty (i.e. if we take the ratio of the observed difference to the true uncertainty), collectively, these values should form a Gaussian distribution with
$I_{\textrm {bkg,true}}$
, or the ‘true’ intensities of the pixel counts, we can measure the differences between the observed intensities and true intensities. The ensemble of observed pixel intensities should depart from their respective true pixel intensities by different amounts. If the difference observed in each pixel is scaled according to its uncertainty (i.e. if we take the ratio of the observed difference to the true uncertainty), collectively, these values should form a Gaussian distribution with $\sigma =1$
.
$\sigma =1$
.
It is useful to define the noise in this way because each pixel will have a different measured intensity. This means that each pixel belongs to a different parent population with its own probability distribution. However, the normalised noise quantities all belong to the same parent population with a collective probability distribution. The logic to justify this goes as follows. In the limit of large counts (where here, counts refers to a large number of pixels measured per intensity bin), the normalised noise distribution will converge to a Gaussian. We can further state that the normalised noise distribution should have a mean equal to 0 and standard deviation equal to 1. This is because we expect that, in aggregate, the statistical fluctuations of the measured pixel count values will vary roughly equally above and below the ‘true’ count values (meaning that the mean will converge to 0 as we consider larger and larger ensembles). If we divide the magnitude of the difference between the measured and ‘true’ value by the expected uncertainty, the values will now fluctuate above and below the ‘true’ value with a standard deviation of 1. Hence, this quantity is referred to as the normalised noise.
The scaling factor represents our expectation of the relationship between the observed count values and the fundamental Poissonian count values. It does not by itself provide us with an observable quantity that we can measure and extract. The normalised noise quantities, on the other hand, are directly calculable from the film data. Furthermore, because we expect the histogram of the normalised noise values to converge to a Gaussian with known parameters, and we have established a relationship between the measured counts/measured uncertainties and C, we now have a way to calculate C. The trick is to determine how to represent the $I_{\textrm {bkg,true}}$
quantity. We represent this quantity by a smoothed film image (see figure 18). If we think of the actual intensity counts recorded on the film as some (true) value plus noise, smoothing the film image provides us with an approximation of the true value and a way to characterise the magnitude of the statistical fluctuations. We smooth the film image using a Gaussian kernel with
$I_{\textrm {bkg,true}}$
quantity. We represent this quantity by a smoothed film image (see figure 18). If we think of the actual intensity counts recorded on the film as some (true) value plus noise, smoothing the film image provides us with an approximation of the true value and a way to characterise the magnitude of the statistical fluctuations. We smooth the film image using a Gaussian kernel with $\sigma$
= 1 pixel. This smooths sharp discontinuities between neighbouring pixels while retaining information about real intensity variations on small scales.
$\sigma$
= 1 pixel. This smooths sharp discontinuities between neighbouring pixels while retaining information about real intensity variations on small scales.
Example of background smoothing applied to the image using a Gaussian smoothing kernel with $\sigma =$
1 pixel. We use the fluctuations in the original image around the smoothed image to characterise the statistical noise.
$\sigma =$
1 pixel. We use the fluctuations in the original image around the smoothed image to characterise the statistical noise.

We then construct a histogram of the normalised noise and solve for the scaling constant C which will force the Gaussian distribution to have a $\sigma =1$
as follows:
$\sigma =1$
as follows:
 \begin{align} f(z) &= \it{exp}\left [ - \frac {1}{2} \left (\frac {I_{ij}^{\textrm {data}} - I_{ij}^{\textrm {true}}}{\sigma _{ij}} \right )^2 \right ]\\[-10pt]\nonumber \end{align}
 \begin{align} &= \it{exp}\left [ - \frac {1}{2} \left (\frac {I_{ij}^{\textrm {data}} - I_{ij}^{\textrm {true}}}{\sqrt {I_{ij}^{\textrm {true}}/C}} \right )^2 \right ]\\[-10pt]\nonumber \end{align}
 \begin{align} &= \it{exp}\left [ - \frac {C}{2} \left (\frac {I_{ij}^{\textrm {data}} - I_{ij}^{\textrm {true}}}{\sqrt {I_{ij}^{\textrm {true}}}} \right )^2 \right ].\\[-10pt]\nonumber \end{align}
 \begin{align} \end{align}
The $\sigma$
of the best fit Gaussian to this distribution will yield C:
$\sigma$
of the best fit Gaussian to this distribution will yield C:
 \begin{equation} C = \frac {1}{\sigma ^2}. \end{equation}
There is one subtle point that bears clarification. There is a choice between two options to define the term $I_{\textrm {bkg, smoothed}}$
when characterising the noise. We can simply create a histogram of the noise relative to the mean background value across the entire region we have selected. Alternatively, we can use a smoothed background image to define the term instead as we have described above. The choice comes down to which seems more likely to represent the ‘true’ background count values that the film is bathed in during the experiment. We chose to use the second option. The simple average background value across the entire region does not take into account the real macroscopic fluctuations across the spatial extent of the film and will overestimate the total uncertainty.
$I_{\textrm {bkg, smoothed}}$
when characterising the noise. We can simply create a histogram of the noise relative to the mean background value across the entire region we have selected. Alternatively, we can use a smoothed background image to define the term instead as we have described above. The choice comes down to which seems more likely to represent the ‘true’ background count values that the film is bathed in during the experiment. We chose to use the second option. The simple average background value across the entire region does not take into account the real macroscopic fluctuations across the spatial extent of the film and will overestimate the total uncertainty.
In order to determine the best units to use to measure uncertainties, we replicated the error analysis using all three options: film data in optical density units, film data in exposure units and the final measured spectrum from the fully processed data. Prior to this analysis it was unknown which would be most appropriate. We tried all three options and determined that the statistical fluctuations measured from the film data in exposure units best conforms to a Gaussian distribution (see figure 19). Therefore, we chose to perform the statistical noise analysis using exposure units.
Normalised noise histogram and best-fit Gaussian.


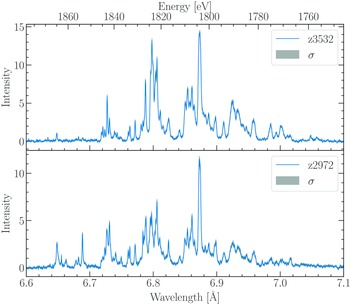


 Open access