

1 Background and Aim of the Project
In an earlier study of the dynamics of the Antarctic ice sheet, Reference Budd, Jenssen and RadokBudd and others (1971) noted that In some regions of the ice sheet, particularly inland of the large ice shelves, the gravitational downslope driving stress reached a maximum and then decreased towards the grounding line. At the same time the ice flux and the ice velocity, which were required to keep the ice sheet in a balanced state, increased. These regions are also characterized by bedrock well below sea-level and basal temperatures most likely to be at the pressure melting point. It was suggested by Reference BuddBudd (1975) that for fast-flowing surging glaciers, or for outflow glaciers from ice sheets, the basal shear stress might decrease for high sliding velocity (300 to 30 000 m a−1). But in the case of the West Antarctic ice sheet the decrease in basal shear stress appears to occur for velocities in the range 30 to 300 m a−1. Since no velocity measurements are available between Byrd station (at elevation ~1 500 m), where the velocity is about 12 m a−1 (Reference WhillansWhillans 1977), and the Ross Ice Shelf, where velocities are of the order of 300 to 500 m a−1, two quite different conclusions were possible.
-
(i) The actual velocities of the West Antarctic ice streams flowing into the Ross Ice Shelf might be low, in which case the ice sheet should be considerably out of balance and therefore becoming thicker.
-
(ii) The ice streams may be indeed flowing fast, as required for approximate zero net mass balance. In that case, how can such high velocities be reconciled with the small gravitational forces driving the ice? These questions raise the fundamental problems of the the current state of balance of the West Antarctic ice sheet and the dynamics of basal sliding. They have been extensively discussed by Hughes (Reference Hughes1973, Reference Hughes1975), Reference WeertmanWeertman (1976), Reference RoseRose (1979), Reference YoungYoung (1981) and Reference Cooper, McIntyre and RobinCooper and others (1982).
Laboratory studies of ice sliding by Reference Budd, Keage and BlundyBudd and others (1979) indicated that the ice sliding velocity was strongly dependent on the effective normal stress (above basal water pressure buoyancy) as well as the basal shear stress and basal roughness. The decrease in effective normal stress, with the decrease of ice thickness above that required for grounding, is a common feature of fast-flowing ice streams and outlet glaciers as they approach the grounding/floatinq transition. This increase in velocity with decreasing normal stress occurs in spite of a decreasing net downslope gravitational driving force, which, for most practical purposes, is numerically equal to the basal shear stress. The primary objective of this paper is to develop and test a functional relationship between velocity, shear stress and normal stress which holds for the fast ice-stream flow with low basal shear stress.
An analysis of ‘the dynamics of a typical single ice-stream flow line of West Antarctica was carried out by Reference YoungYoung (1981), using Reference RoseRose’s (1979) data. Young found that, as the basal shear stress decreased towards the grounding line, transverse and longitudinal stresses became equally important. But this merely adds to the puzzle of how relatively high velocities can be maintained by small gravitational downslope forces.
The three-dimensional modelling of Reference Budd and SmithBudd and Smith (1982) found that the region of West Antarctica was very sensitive to the formulation of ice dynamics such that ice velocities slightly less than balance would lead to a much thicker ice sheet than at present, whereas velocities and strain-rates that were too high could result in a substantial retreat of the grounding line. The coarse (100 km) resolution of that study, however, made it impossible to represent adequately the features of the individual ice streams in West Antarctica.
The present study, therefore, concentrates on just that part of the West Antarctic ice sheet which drains into the Ross Ice Shelf, and aims to have sufficient resolution to allow adequate representation of the major features of the ice streams, cf. Figure 1.
Flow lines. The pattern of computed flow lines is shown superimposed on the elevation contours of Figure 2. The main ice streams and their drainage basins are delineated. The ice streams are labelled A to E following Reference RoseRose (1979). The estimated grounding- line positions from various sources are shown by dotted lines. Contours are for 0 to 0.1 km at 20 m intervals, 0.2 to 0.5 m at 100 m intervals, 0.5 to 1 km at 250 m intervals, and 1 km to 2 km at 200 m intervals.

For this work, it is necessary to have an adequately high resolution database as an input. The data obtained for the new Scott Polar Research Institute (SPRI) map folio series, described by Reference Drewry and JordanDrewry and Jordan (1980), provide a valuable source, covering most of the input required for the modelling of the ice flow. However, observed velocities over the ice sheet, required to check the model output, are still not available. A limited amount of velocity data from the ice divide to Byrd is available from Reference WhillansWhillans (1977). This allows a check to be made on the internal ice deformation. The extensive velocity data now available over the Ross Ice Shelf (Reference Thomas and MacAyealThomas and Mac-Ayeal (1982)) provide a check on the ice-stream velocities near the grounding line through the continuity of ice flux.
The specific aims of this paper, then, are to construct a three-dimensional model of the West Antarctic ice sheet in order to assess Its state of balance in the light of the velocities of the Ross Ice Shelf, and to use the flux-implied upstream velocities as checks on “dynamics” velocities as computed from the geometry, flow and sliding properties of the ice. Since the flow and sliding depend on temperature, the temperature distribution throughout the ice sheet needs to be computed, and the basal melt must also be determined.
Finally, after the dynamic model has been developed to simulate the present behaviour of the West Antarctic ice sheet, some implications for its stability and future behaviour are considered.
2 Input Data Required
The procedure used is somewhat similar to that used by Reference Budd, Jenssen and RadokBudd and others (1971) and Reference Budd and SmithBudd and Smith (1982). The input data required for the balance computations are the surface elevation, the bedrock elevation, and the accumulation rate. For the thermal regime the distribution of surface temperatures is also required.
For surface and bedrock elevation the data of Reference Jankowski and DrewryJankowski and Drewry (1981) provide a basis. The General Bathymetric Chart of the Oceans (GEBC0) (Canadian Hydrographic Service 1980), at a scale of 1 : 6 000 000 provides a convenient representation of the surface and bed topographies combined on the one map.
A 61 × 61 point square grid of 20 km grid spacing was used as an overlay for digitizing the data and running the computer model. This square overlay with corners (82.5°S 86.0°W, 83.4°S 172.8°E, 73.4°S 118.5°W, 73.9°S 157.5°W) extends beyond the region of the grounded part of West Antarctica that flows into the Ross Ice Shelf, except perhaps for the extreme southern boundary where some of the ice flow may originate from East Antarctica. For the scale of the grid, the spherical distortion is small and so will be neglected here, the ice dynamics being treated as taking place on a plane.
The result of the digitization of the GEBCO data and interpolation onto the grid is shown in Figure 2 by the surface and bedrock contours as computed from the grid point data. It is interesting to note that the regions of the major ice streams A, B, C, D, E, as described by Reference RoseRose (1979), in order going from south to north, show up quite well with slightly lower surfaces and deeper bedrock. The region of the uncertain grounding-line zone as understood from the above data sources is indicated by the dotted lines.
Surface and bedrock. Ice-surface elevation contours are shown by the continuous lines, as for Figure 1, and bedrock contours by dashed lines at 0.5 km intervals, plus the −0.75 and −0.25 km levels. Deep bedrock below −1.0 km is shown stippled. Bedrock above −0.5 km is shown hatched.

For accumulation rate there are still large gaps in the data coverage, particularly between the contour at 1 000 m and the grounding line. The following compilations have been used for the synthesis undertaken here: Reference Bull and QuamBull (1971), Reference Kotlyakov, Barkov, Loseva and PetrovKotlyakov and others (1974), Reference WhillansWhillans (1977), and Reference Clausen, Oansgaard, Nielsen and CloughClausen and others (1979).
The net result indicates a fairly uniform accumulation rate over the major part of the basin averaging 0.15 m of ice per year (≈ 13.5 Mg m−2 a−1). Sensitivity studies have been carried out to determine the effects of increased or decreased accumulation rates from that average. The major result here is that changes in the computed “balance velocities” are directly proportional to uniform percentage changes in the accumulation field.
For the surface temperatures there are also large gaps in the observed data coverage. Compilations have been used from Reference Bentley, Cameron, Bull, Kojima and GowBentley and others (1964), Reference Shimizu and MellorShimizu (1964), Reference Tolstikov YeTolstikov (1966), Reference Budd, Jenssen and RadokBudd and others (1971), Reference ThomasThomas (1976) and Whillans (Reference Whillans1977, Reference Whillans1979).
In the major part of the basin the surface temperatures show an increase with decreasing elevation from −32°C, at around 2 000 m, to −22°C near 700 m. Thereafter there appears to be a decrease of temperature to about −28 to −29°C on the ice shelf near 100 m elevation. Further data in this transition region are required.
3 Derived Kinematic and Balance Features
If it is assumed that, on the large scale, ice flows downslope, orthogonally to the elevation contours, then the general pattern of ice flow can be computed from the elevation distribution. It was indicated by Budd (Reference Budd1968, Reference Budd1970[a], Reference Budd1970[b]) that average slopes over about 10 to 20 times the ice thickness or more are required to avoid effects of large fluctuations due to bedrock irregularities. An objective numerical scheme developed by Jenssen (Reference Budd, Jacka, Jenssen, Radok and YoungRadok and others 1982) was used to compute flow lines as smooth orthogonal trajectories to the elevation contours by high resolution interpolation between the grid points.
A representative set of computed flow lines is shown in Figure 1. It should be noted that the flow- line pattern may be strongly affected by errors in the elevation data, and that gaps occur in the data coverage near the southern and northern boundaries of the grid. For the main drainage basin to the Ross Ice Shelf the data coverage is acceptable at the 20 km scale and the major ice streams A to E, described by Reference RoseRose (1979), are clearly delineated. Over the Ross Ice Shelf the ice flow is not as closely controlled by the elevation contours weakening the basis for the calculations. The flow lines there provide just a guide to the expected major ice-stream flows as indicated by Reference RobinRobin (1975) and more clearly defined by the measurements of the Ross Ice Shelf Project from Reference Thomas and MacAyealThomas and MacAyeal (1982).
Again, it should be noted that part of the basin for ice stream A is omitted. For the other ice streams, the pattern shows large source areas for ice streams B, D and E, with a relatively smaller basin for ice stream C.
From the flow-line pattern and the distribution of ice thickness Z, and accumulation rate A (in ice equivalent), the flux of ice required for a steady- state mass balance is computed from the continuity equation. From the flux the “balance velocity” Vb is then computed as the column-average velocity required for balance. The technique used is similar to that given by Reference Budd, Jenssen and RadokBudd and others (1971) and refined by Reference Budd, Jacka, Jenssen, Radok and YoungRadok and others (1982). For x, the coordinate distance along a flow line, and y, the orthogonal coordinate across the flow line, the continuity equation may be written as

from which the flux (VbZ) and the balance velocity are computed by integration.
The results of the balance velocity calculations are shown in Figure 3. Noting again that the magnitudes are directly related to the accumulation distribution and that there are still large gaps in the accumulation coverage, these results can be compared with the few surface velocities available from the ridge crest to Byrd and on the Ross Ice Shelf.
Balance velocities. The computed balance velocities, representing averages through a vertical column, are shown with contours 1, 5, 10, 25, 50, 100 and 500 m a−1. The high velocities occur in the major ice streams near the grounding-line region. Values on the ice shelf are not expected to be valid.

Considering possible errors, including those of relating surface to average column velocities for grounded ice, the balance velocities are quite close to those observed. On the Ross Ice Shelf, the relatively high flow rates of 300 to 500 m aẎ1 for ice streams B,D and E are apparent, whereas much lower velocities, less than 100 m a−1, are suggested for ice stream C.
The balance velocity pattern suggests that the 30 to 50 m a−1 velocity isopleths penetrate well inland along the ice streams whereas flow rates less than 10 m a−1 prevail between the ice streams.
From these results it would appear unlikely that the West Antarctic ice sheet/Ross Ice Shelf basin is grossly out of balance; more probably it is within ± 20% of balance. This means that the assumption of exact balance should provide a close approximation to any inferred total “dynamics” velocity, particularly in the regions of high basal sliding.
From the balance velocities a wide range of other balance characteristics can be calculated, as shown by Reference Budd, Jenssen and RadokBudd and others (1971), e.g. ice flux, strain- rates, particle paths, ages, residence time, etc. For West Antarctica these results will be presented elsewhere. Here we concentrate on just those elements which are essential for assessing the ice dynamics. In particular we show in Figures 4 and 5 the basal shear stress and the ice thickness above buoyancy Z* which is related to the effective normal stress.
Basal shear stress. The large-scale smoothed basal shear-stress pattern is shown with contours 0.1, 0.2, 0.5, 0.75 and 1.0 bar.

Ice thickness above buoyancy Z*. The ice thickness in excess of that required just to ground on the bedrock is shown for Z* contours of 0, 1, 5, 10, 25, 50, 75, and 100, 500 and 1 000 m. Low Z* values are noted in the major ice streams with high balance velocities approaching the grounding line.

The basal shear stress is computed as
where ρ is the average ice density, g is the gravitational acceleration and α is the surface slope averaged over several grid intervals. Equation (2) gives strictly the (negative) total downslope driving stress acting on an ice column of length Z and unit width. The vertically integrated hydrostatic pressure is P = gρZ2/2, so that the net stress in the flow direction X is

where α and β are the (small) surface and bedrock slopes. Adding to this the downslope gravitational force acting on the ice column of unit width,
gives Equation (2). The basal shear stress may differ from this if longitudinal and transverse stresses have appreciable magnitudes. But strain-rates computed from the balance velocities indicate that on the large scale these other stresses are generally small and become appreciable only near the ice-stream grounding lines. So, with that reservation, we concentrate, on τb as the main stress-balancing the downslope internal and gravitational forces acting on the ice.
The basal shear stress distribution shows a general increase from zero near the ridges and summits to about 0.6 bar or more near the 800 m elevation contour; then a gradual reduction occurs, particularly along the ice streams, to about 0.1 bar or less, near the grounding line. The low basal shear stresses, particularly in the region of high balance velocities, represent the main problem here.
The distribution of effective normal stress given by the Z* isopleths in Figure 5 shows a pattern of high values (greater than 800 m) inland with a similar pattern of low values towards the grounding line. The grounding-line zone is itself a region of uncertainty where Z* depends on the actual average ice and seawater densities as well as on the surface and bed elevations. To determine the average ice density it would be necessary to allow for the low-density top firn layer and for the air enclosed in the ice. Instead, for the present study, a range of floating criteria were examined. The criterion used in Figure 5 was taken from a fit to the data of Reference Crary, Robinson, Bennett and BoydCrary and others (1962) for the thicker floating ice and has the form

where E is the surface elevation. It should be noted that effects of crevassing could influence this relation significantly and that the small Z* values could be proportionally high in error.
4 Ice Deformation, Sliding, and Dynamic Features
For the present study the average dynamics velocity through the column Vd has been separated into the contribution from internal ice deformation V i and that due to sliding Vs:
Two methods have been used to compute the average internal velocity. The first is the simple block flow equation
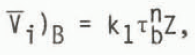
where k1 is a flow law parameter which can be set and interpreted as a function of the temperature of the basal layer of the ice sheet.
The second method uses the complete computed column temperatures through the ice and a flow law which relates the shear strain-rate to the shear stress. For generality the flow law is expressed in terms of “octahedral” values
![]() and τ representing invariants of the strain-rate and stress tensors. The flow law for a temperature deviation θ* from the melting point θ0 then has the form
and τ representing invariants of the strain-rate and stress tensors. The flow law for a temperature deviation θ* from the melting point θ0 then has the form
where θ* = θ – θ0 and Θ is the ice temperature.
The flow-law data given by Reference Russell-Head and BuddRussell-Head and Budd (1979) provide a useful basis for the flow law here since they cover the central range of stress and temperature of interest and give tertiary flow rates together with information on effects of crystal anisotropy.
For the case in which the dominant stress is the horizontal shear stress τXZ, the horizontal shear strain-rate (
![]() ) at depth z can be expressed as a function of τXZ.
) at depth z can be expressed as a function of τXZ.
If uz is the horizontal velocity at depth z, then

and

(cf. Reference Budd and SmithBudd and others 1982), The contribution of the internal velocity to the surface velocity is then given by

where this integral is taken over the vertical column with the temperature computed as indicated below. The average internal velocity is then given by

It is found in practice that, for suitable values of the generalized parameter k1, these two computed deformational velocities do not differ greatly because the total deformation is strongly dependent on the stress and temperature of the basal layer a few hundred metres thick.
The pattern of computed deformational velocities is shown in Figure 6, Although the basal temperature distribution has some effect on this pattern the main factor is the basal shear stress. The deformational velocity increases from the summits and ridges to about the region of maximum shear stress, in a manner not unlike the balance velocities. From there to the grounding line the decreasing basal stress results in very low deformational velocities. This suggests that the ice flow along the major Ice streams is increasingly dominated by sliding.
Deformational velocities. The contribution to the average column velocities from the internal deformation is shown for the block velocity formulation. Note the maximum around 20 m a−1 near the zone of maximum shear stress with low values further downstream.

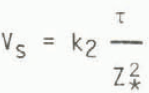
The ice sliding experiments of Reference Budd, Keage and BlundyBudd and others (1979) indicated that, for low sliding speeds Vs, relations of the following form:
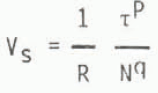
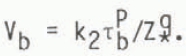
where R is a roughness factor, τ is the basal shear stress, N is the effective normal stress and p and q are parameters which may vary with stress, velocity or roughness. The results suggested at low stresses P≈1 and q≈2 whereas at higher stresses p≈3 anri q≈1.
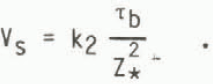
This type of relation was therefore examined for the West Antarctic ice sheet/Ross Ice Shelf drainage basin by plotting the computed balance velocities against basal shear stress for different values of Z* as a measure of effective normal stress. In other words a functional relation of the form
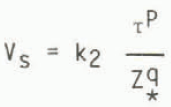
is sought for constant values of k2, P and q in the regions of high sliding velocities where the contribution of the deformational velocity to the total velocity is small.
Figure 7 shows the results for the major ice streams. Although considerable scatter exists in the data the values of p = 1 and q = 2 give a reasonable representation of the major trends with k2 ≈ 5 × 10⁶ bar−1 m3 a−1.
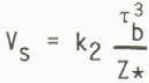
Dynamics sliding relation. The balance velocities Vb for the major ice streams from the zone of maximum stress to the grounding line are plotted against the basal shear stress. In spite of large scatter a trend emerges for increasing Vb with decreasing Z* as depicted by the full lines defined by the relation VS = k2τb/Z*, with k2 ≈ 6 × 10⁶ bar−1 m3 a−1. The dashed lines snow the internal deformation resulting from the relation
![]() with k1 = 0.03 bar−3 a−1.
with k1 = 0.03 bar−3 a−1.

Using this relation, viz.
over the grid gives the distribution of sliding velocity shown by Figure 8. Here the pattern of increasing velocities towards the grounding line of the major ice streams is similar to the pattern for balance velocities but not so concentrated. The pattern of basal temperatures could be an important factor there. Inland, as Z* becomes large, the sliding velocity becomes small and considerably below the deformational velocity.
Sliding velocity Vs. The computed sliding velocity as derived from the sliding relation given by Figure 7 is shown with contours 1, 5, 10, 50, 100 and 500 m a−1. The pattern has a similar trend of increase towards the grounding line as the balance velocities but with lower values inland.

Finally, the deformational and sliding velocities are combined to give a total dynamics velocity as in Equation (4)
The resultant pattern is shown in Figure 9. Although details differ considerably between the maps of Vb and Vd, at least the general trend of monotonically increasing velocities towards the grounding line, with maxima in the regions of the major ice streams, is common to each.
Total dynamics velocity, obtained from V d = V j + Vs. The resultant pattern has a similar general form to the pattern of balance velocities but not so concentrated within the ice streams.

5 The Thermal Regime
So far the thermal regime has not been taken into account for the sliding although it might be expected that the basal temperature distribution would have a major influence.
For steady state the heat conduction equation for a vertical column at distance x along a flow line can be written

where ρ is the ice density, c is the capacitance, k is the thermal diffusivity (taken as constant here), wZ, uZ are the vertical and horizontal velocities at depth z, and QZ is the mechanical heat dissipation per unit volume.
With basal sliding playing such a major role, only the basal heating by friction is used in which case the dissipational heating is represented by τbV.This is added to the heating produced by the geothermal gradient γG so that the basal temperature gradient is prescribed as
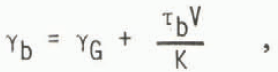
where K is the thermal conductivity.
When the basal temperature reaches the pressure melting point this temperature is then prescribed as the basal boundary condition and the basal gradient is used in comparison with the computed base gradient to calculate the basal melt rate.
The above heat conduction Equation (14) is solved along the flow lines by the technique developed by Jenssen in Budd and others (Reference Budd, Jenssen and Radok1971, Reference Budd, Jacka, Jenssen, Radok and Young1982) and Reference Budd, Jacka, Jenssen, Radok and YoungRadok and others (1982).
In the first instance the horizontal velocity is taken to equal the balance velocity. The resultant temperatures are used for the computation of the deformational velocities. Finally the basal temperatures are recomputed using the total dynamics velocity. Since the balance and total dynamics velocities are similar the resultant pattern of basal temperatures are also similar. Of more importance is the unknown geothermal flux. Hence a number of complete calculations were carried out varying γG from 2.6 to 3.6°C 100 m−1. At Byrd, for example, the observed basal gradient is 3.25°C 100 m−1 (Reference Ueda and GarfieldUeda and Garfield 1970), of which up to 3.0°C 100 m−1 would be expected to result from geothermal flux for steady state. Effects of secular changes have been examined by Reference Budd, Young and RobinBudd and Young (1983); for Antarctic basal temperatures, they were found to be small by comparison with the uncertainties of the geothermal heat flux.
The main features of the different basal temperature maps are similar with a gradual growth in the region of basal melting with increasing geothermal flux. An example is shown in Figure 10 for γG = 3.0°C 100 m−1. Here the deep interior basal ice is found to be at pressure melting with narrow zones of pressure melting concentrated in the major ice streams extending to the grounding line. It. could be expected that this would enhance the sliding along the ice streams, compared to neighbouring regions. If allowed for in the sliding relation, this could improve the match between balance and dynamics velocities. This extension is not explored further here. Instead we consider a few implications regarding the stability of the West Antarctic ice sheet.
Basal temperatures. The basal temperatures (relative to pressure melting as computed from the balance velocities and a geothermal gradient of 3.0°C 100 m−1 are illustrated. Melting zones are shown hatched. These tend to occur under the thick inland ice and the major ice streams. Lower temperatures in the ice streams near the grounding line suggest freezing would take place there.

6 Assessment of the State of Balance and Stability of the West Antarctic Ice Sheet
The three-dimensional modelling of Reference Budd and SmithBudd and Smith (1982) for Antarctica using a sliding relation of the form
was not very effective in reproducing the low-stress, high-velocity zone of West Antarctica. That model has, therefore, been re-run with the sliding relation of Equation (13), viz.
This has resulted in a form for the Ross Ice Shelf basin of West Antarctica much more similar to the present observed ice sheet for steady state in spite of the 100 km resolution which is too coarse to capture the individual ice streams, cf. Figure 11.
Whole Antarctic simulation. The three-dimensional model of Reference Budd and SmithBudd and Smith (1982) for the whole of Antarctica with 100 km resolution has been re-run with the sliding and deformation parameters derived from West Antarctica. In (b) the sliding parameter k2 = 6 × 10⁶ m3 bar−1 a−1 has been used giving a low West Antarctic saddle region more similar to that observed rather than the large ice sheet which results from low sliding as shown in (a) with k2 = 1 × 10⁶ m3 bar−1 a−1. Contours are in decametres.

The observed velocities on the Ross Ice Shelf suggest that the West Antarctic ice sheet cannot be too far from a state of overall zero net mass balance. Therefore a dynamic relation something like that derived here is required. With this dynamic relation it is now possible to examine effects of external change with the high resolution model. Some preliminary qualitative indications follow. (1). Direct warming of the ice has little effect on the flow which takes a long time to react, as indicated by Reference YoungYoung (1981). (2). Basal melting is more important as it thins the ice and increases the sliding through the reduced Z*. (3). A rise of sea-level can accelerate the flow in a similar way, but must be expected to be small, especially in the short term. (4). Isostatic- ally rising bedrock can also decrease the ice sliding and so could be a counteracting factor to the accelerating effects.
For any external change that is prescribed, a first approximation to the ice-sheet reaction can be obtained by running the model forward in time.
Finally, it needs to be emphasized that observed velocities along the ice streams will be the most valuable data for both assessing the current state of balance and finding a sounder basis for the ice dynamics. In the meantime, the results presented here represent estimates of the ice velocities that should guide future field work.
The authors are indebted to an anonymous reviewer whose questions helped them to improve several key passages of the paper.


