

“I will build a motor car for the great multitude…constructed of the best materials, by the best men to be hired, after the simplest designs that modern engineering can devise…so low in price that no man making a good salary will be unable to own one-and enjoy with his family the blessing of hours of pleasure in God’s great open spaces.”
—Henry Ford, likely said sometime between 1903 and 1906Footnote 1
Between 1910 and 1930, the United States rapidly adopted the passenger car. In 1910, there were fewer than 50 passenger cars per 10,000 people in the United States; by 1930, there were more than 1,800.Footnote 2 We highlight two facts about the U.S. adoption of the car. First, as illustrated in Figure 1, the United States adopted the car more rapidly than other countries.Footnote 3 ,Footnote 4 Second, the gap between car adoption in the United States and abroad reflected a transformation of the U.S. car market in the decade between 1909 and 1919. In 1909, the car was a luxury, mostly owned by the rich for leisure and / or to signal social status. In 1919, the car was a mass-market good, owned by many in the middle class and used for practical purposes.
MOTOR VEHICLE REGISTRATIONS ACROSS COUNTRIES
Sources: U.S. motor vehicle registrations are from the Federal Highway Administration, Highway Statistics (table MV-201); the United States and French populations are from Bolt et al. (Reference Bolt, Inklaar, de Jong and Luiten van Zanden2020). Vehicles in the United Kingdom and France are from Palgrave Macmillan, ed. (2013a). Palgrave Macmillan, ed. (2013a) provides no data on commercial vehicles in France before 1920; in order not to underestimate the total number of vehicles in France, we estimate the number of commercial vehicles pre-1920 by assuming that the ratio of commercial vehicles to private cars was the same in each year before 1920 as it was in 1920. The U.K. population is from Palgrave Macmillan, ed. (2013c). Vehicle and population data for Canada are described in the Appendix.

We show that the rapid adoption of the car in the United States, and in particular the car’s transformation from a luxury to a mass-market good between 1909 and 1919, were in part (not entirely) a result of the success of the Model T in the United States and its relative lack of success abroad. The Model T was introduced in 1908, began to be mass-produced in 1913, and ceased production in 1927. To understand the effect of the Model T on U.S. car adoption, we study time series, cross-state, and cross-county data on motor vehicle registrations. All point to the conclusion that Model T sales were not simply substitutes for sales of other cars: the Model T expanded the market. But the diffusion of the Model T outside the United States was limited. It was limited not because foreign consumers disliked the Model T; rather, success abroad was limited because the Model T cost roughly 20 to 150 percent more outside the United States.
Of course, the importance of the Model T for U.S. car adoption is well-known. Many scholars (though few economists) have written about the Model T, and its popularity made it a cultural icon. Our work is in part inspired by the argument for the importance of the Model T made by Gordon (Reference Gordon2016). Gordon (Reference Gordon2016, p. 165) writes: “[B]y far the most important reason for the rapid diffusion of automobile ownership through 1929 was the rapid decline in prices, an achievement largely brought about by Ford’s Model T and unmatched in any other nation.” Relative to Gordon (Reference Gordon2016) and to prior observers of the auto industry, our contributions are: (1) the quantitative documentation of the pre-1930 U.S. car adoption lead; (2) our use of state and newly-collected county data to document the change in the car from a luxury to a mass-market good between 1909 and 1919; (3) our use of state and county data to document the Model T’s appeal to a new segment of the market; and (4) our use of newspaper advertisements to find prices of the Model T abroad.
We begin in the next section by examining cross-country data on the adoption of the motor vehicle relative to the adoption of the telephone and radio. There were two unusual features of motor vehicle adoption in the United States. First, while the United States led the world in telephone and radio ownership, the U.S. lead in motor vehicle ownership was much larger. In 1929, for instance, Germany had 30 percent of the U.S. level of telephones per capita, but only 4 percent of the U.S. level of motor vehicles per capita.Footnote 5 Second, the gap between motor vehicle ownership in the United States and abroad generally stayed the same or grew from 1913–29, whereas the gap between U.S. and foreign telephone ownership shrank. We focus particularly on the comparison to Canada. Canadian provinces generally had only about half the cars per capita of adjacent U.S. states; for example, in 1919 Manitoba had fewer than half as many cars per capita as North Dakota.
The unusually large U.S. motor vehicle (primarily car) ownership lead reflected a transformation of the U.S. car market between 1909 and 1919. We look at the association between income, population density, and literacy with car ownership. In 1909, the cross-state elasticity of car registrations per capita with respect to income is well above one, and there is little correlation between population density or literacy and car ownership. By 1919, the income elasticity of car ownership had dropped to well below one, and there is a strong negative relationship between car ownership and population density and a positive relationship between car ownership and literacy. These results are consistent with narrative evidence suggesting a change in the car from a luxury good purchased by the rich, often in urban areas, to a mass-market good purchased in large numbers, in particular, but far from exclusively in richer rural states. County data in California for 1907 and 1921 corroborate this finding. In 1907, the largest number of motor vehicles per capita in California were in and near San Francisco and Los Angeles. In 1921, the car remained popular in and around Los Angeles, but most of the California counties with the largest number of vehicles per capita were in the rural central valley.
Next, we introduce our argument that the Model T helps to explain the U.S. car adoption lead and the transformation of the U.S. car market between 1909 and 1919. We describe the history of the Model T’s production and pricing. The Model T was revolutionary both because of the mass production methods used to produce it and because of Ford’s unusual decision to design a car to appeal to a mass market. The raw number of Model Ts on the road strongly suggests that the Model T contributed to the large number of cars in the United States; by 1922, 47 percent of all cars in the United States were Model Ts (Automotive Industries, 9/6/1923, p. 481).
We then turn to cross-sectional data to better understand who bought Model Ts. We expect that the Model T added to total car sales by appealing to a distinct set of consumers. We investigate this hypothesis with cross-state and cross-county data. Cross-state data show that the first few years of Model T sales (1909–13) coincided with the beginning of a large gap in the rate of car adoption between urban and rural states, with rural states starting to adopt cars more rapidly when the Model T was introduced. County data on Model T ownership fits with these results, showing that the Model T made up a larger share of cars in rural areas of the country.
In the final section of the paper, we examine the Model T’s record abroad. Obstacles to Model T sales abroad varied, including tariffs and expensive local production. These obstacles reduced sales of the Model T in part by increasing the Model T’s price. To learn about the Model T’s price abroad, we collected car prices from newspaper advertisements in 18 countries in 1914 and 19 countries in 1922. These advertisements show that the Model T cost roughly 20 to 150 percent more outside the United States.
Previous Literature
There has been surprisingly little work by economists on the adoption of the car. Lebergott (Reference Lebergott2014) discusses the adoption of the car in the United States, focusing in particular on the cost of car ownership. And we already mentioned Gordon (Reference Gordon2016), who reviews the history of pre-1940 car adoption in the United States (chapter 5). He emphasizes the importance of the Model T in lowering prices and in appealing to farmers, and he also discusses the dramatic effect on daily life of the car. The results in our paper support the arguments in Gordon (Reference Gordon2016), but we go beyond his work by using cross-sectional data to document the U.S. lead in car adoption and the role of the Model T in maintaining the U.S. lead.
Cheng et al. (Reference Cheng, Crucini, Oh and Yilmazkuday2025) are, like us, interested in understanding variation in the speed of car adoption across countries. They find that trade barriers and the combination of higher gas prices and lower incomes abroad can explain the majority of the pre-WWII U.S. car adoption lead. Also closely related to our work are a pair of papers on the pre-WWII auto industry, Raff (Reference Raff1991) and Raff and Trajtenberg (1996). Raff (Reference Raff1991) provides useful background on Ford’s unique competitive position. And Raff and Trajtenberg (1996) document a large decline in the quality-adjusted price of cars before WWII. While Raff and Trajtenberg (1996) note the significance of the Model T’s uniquely high quality-to-price ratio, the Model T is not their focus.
Outside of economics, historians have done descriptive work on the causes and consequences of car adoption, often focusing on specific regions. For instance, Flink (Reference Flink1988) provides an overview of the history of the car’s production and use in the United States, Brilliant (Reference Brilliant1989) focuses on the history of the car in southern California in the 1920s, and Davies (Reference Davies1987) looks at the history of the car in Ontario, Canada. While interested in similar questions, we differ from this prior work in history with our focus on quantitative measurement. More similar to our work than is that by historians, the sociologists Fischer and Carroll (Reference Fischer and Carroll1988) use cross-state data to quantitatively compare the diffusion of the telephone and the car in the United States before WWII.
Our work is also related to the large literature in economics on technological progress. A long-standing literature in economic history looks at the sources of U.S. technological leadership, specifically in mass production. Nelson and Wright (Reference Nelson and Wright1992) and Hounshell (Reference Hounshell1985) use the auto industry and Ford in particular as an example of U.S. leadership. We add to this history by showing the consequences of U.S. mass production for car prices and car adoption. Our empirical work complements the theory in Foellmi, Wuergler, and Zweimüller (Reference Foellmi, Wuergler and Zweimüller2014), in which process innovation (e.g., mass production) plays a key role in the adoption of new goods; indeed, Foellmi, Wuergler, and Zweimüller (Reference Foellmi, Wuergler and Zweimüller2014) motivate their model with the Model T. By contrast, much work on the adoption of new goods focuses on so-called internal drivers of adoption, such as social learning. Young (Reference Young2009), for instance, looks at how social dynamics determine the speed of adoption of an unchanging technology. Our work shows how a so-called external development, in this case, a cheaper car, changed the adoption process. We expect that the dynamic in which a technology starts to diffuse, and then external developments accelerate the adoption process, may be common.
Endogeneity: Difficulties Studying the Car
Within the economic history literature on technology adoption, our work can be compared to that on the diffusion of the tractor. The car almost certainly affected the U.S. economy more than the tractor; between 1910 and 1939, farmers’ spending on cars was itself more than double farmers’ spending on tractors (U.S. Department of Agriculture 1940, table 1, p. 3). But despite the car’s greater importance, there is a good reason why economic historians have written extensively about the tractor and almost nothing about the car. The more limited use of the tractor makes it easier to study. The tractor had one use: to produce farm products. Thus its adoption can be studied as the solution to a producer’s cost minimization problem. The result is a set of well-posed questions, such as whether the cost characteristics of the tractor versus the horse made the tractor more suited for large farms (Olmstead and Rhode Reference Olmstead and Rhode2001). By contrast, cars were purchased by both businesses and consumers for an almost limitless number of uses, including the transportation of goods (e.g., from a store to a residence), commuting, and recreation. There are a myriad of possible determinants of consumers’ car purchase decisions, many of which are endogenous to the level of car ownership.
SHARE OF U.S. PER CAPITA NUMBER IN USE (%)
Notes: Motor vehicle and telephone data are for 1914 rather than 1913 in Denmark and Italy. Telephones may be underestimated in Denmark and Italy in 1913 and in Japan in 1913 and 1929, since in these cases subscriber lines rather than each telephone are counted. The radio data ought to be treated with caution given large uncertainties about the number of radios in some countries (Batson Reference Batson1930).
Sources: The number of motor vehicles and telephones is from Palgrave Macmillan, ed. (2013a, 2013b); radios are from Batson (Reference Batson1930, pp. 12–13); the population is from Bolt et al. (Reference Bolt, Inklaar, de Jong and Luiten van Zanden2020). Exceptions: U.S. motor vehicle registrations are from the Federal Highway Administration, Highway Statistics (table MV-201). Motor vehicles per capita in Canada are as described in the Appendix. In 1913, we do not have commercial car data for France; we estimate the number of commercial vehicles in 1913 by assuming that the ratio of commercial vehicles to private cars was the same in 1913 as it was in 1920, the first year for which Palgrave Macmillan, ed. (2013a) provides data on the number of commercial vehicles in France. Telephones in New Zealand in 1913 are from Frazer (Reference Frazer1913, pp. 477–78). Telephones in Australia in 1913 are from the Commonwealth Bureau of Census and Statistics (n.d., table no. 62, p. 45).
Consider roads, credit availability, and a dealer network, for instance. All caused more car ownership. Better roads made cars faster; credit availability allowed liquidity-constrained consumers to purchase a car, and an extensive dealer network made it easy to buy a car and to have it locally repaired. But car ownership also caused roads to be built, car loans to become widespread,Footnote 6 and dealer networks to expand. Large numbers of car owners likely led to more political support for road building, and the large number of cars being sold made it worthwhile for car manufacturers to set up installment credit subsidiaries and to expand dealer networks. Thus, for instance, in 1929 New Brunswick and Nova Scotia together had a total of 52 miles of paved road while Maine had 388 miles.Footnote 7 It is, however, hard to know the extent to which this difference in paved road mileage is a cause or an effect of the much larger number of cars per capita in Maine (see Table 2).
CARS PER 10,000 PEOPLE: CANADIAN PROVINCES AND U.S. BORDER STATES

Sources: See the note to Figure 2.
In any case, our goal in this paper is not a full accounting of the drivers of cross-country differences in car adoption. Our goal is more modest: to document anomalously rapid U.S. car adoption and the importance of the Model T for this rapid adoption. In doing so, we provide one piece of the larger puzzle of why the U.S. adopted the car much more quickly than did any other country.
THE UNITED STATES ADOPTED THE CAR UNUSUALLY QUICKLY
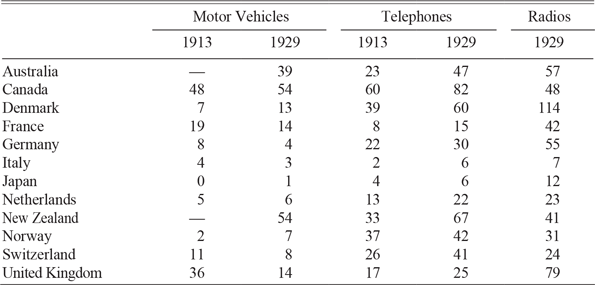
Our interest in the Model T is motivated by our wish to explain the rapid U.S. adoption of the car. To see whether U.S. car adoption was unusual, we compare the adoption of the motor vehicle to the adoption of the telephone and the radio in the United States and abroad.Footnote 8 Such a comparison is necessarily inexact; while motor vehicles often had to be registered, registration was less often required for telephones and radios.Footnote 9 Still, cross-country comparisons paint a picture of anomalously rapid U.S. adoption of motor vehicles. U.S. motor vehicle adoption was anomalous in the sense that the gap between motor vehicle adoption in the United States and abroad was much larger than that for the telephone and radio, and in the sense that the gap between U.S. and foreign vehicle ownership levels generally held steady or grew between 1913 and 1929 at the same time as the gap in telephone ownership shrank.Footnote 10
Table 1 shows per capita motor vehicle, telephone, and radio ownership in 12 countries in 1913 and 1929. The 12 countries include the 8 countries for which Palgrave Macmillan (2013a, 2013b) reports motor vehicle and telephone ownership in 1913 and 1929 plus Canada, Australia, New Zealand, and France. Per capita ownership in Table 1 is expressed as a share of the U.S. level. The 39 percent for motor vehicles in Australia in row one, for instance, means that per capita ownership of motor vehicles in Australia in 1929 was 39 percent of the U.S. level.Footnote 11
We conclude first that in both 1913 and 1929, the United States had a large lead in motor vehicle ownership. Australia, Canada, and New Zealand were closest to the United States, but they still had only about half the number of motor vehicles per capita. Europe was much further behind, with (the United Kingdom excepted) less than 15 percent of the U.S. level of per capita vehicle ownership. Second, in 1929 the United States had a larger lead in motor vehicle ownership than it did in telephone or radio ownership. Each of the 12 countries in the table had a level of telephone ownership closer to the U.S. level than their level of vehicle ownership. Canada, for instance, had 82 percent of the U.S. number of telephones per capita in 1929, but only 54 percent of the U.S. number of motor vehicles per capita. Likewise, in all countries in the table except Canada and New Zealand, radio ownership in 1929 was closer to the U.S. level than was motor vehicle ownership. The large lead in U.S. motor vehicle ownership did not simply reflect a general U.S. technological lead; there was something unusual about the United States and the car.
Table 1 also allows us to look at the change in motor vehicle and telephone ownership between 1913 and 1929, years when we would expect to see the impact of the Model T on vehicle ownership. In most countries, there was convergence toward the U.S. level of telephone ownership. In the United Kingdom, for instance, the per capita number of telephones in use rose from 17 percent of the U.S. level in 1913 to 25 percent in 1929. Motor vehicle ownership followed a different path; most of the countries in the table saw little, if any, convergence to U.S. levels. In the United Kingdom, motor vehicle ownership per capita fell from 36 percent of the U.S. ownership level in 1913 to 14 percent in 1929. We take the lack of convergence in motor vehicle ownership as suggestive evidence of a Model T effect: during the years of Model T mass production, telephone ownership was converging to U.S. levels while motor vehicle ownership was not.
An obvious concern is the influence of WWI. It is inconvenient that mass production of the Model T started in 1913, a year before WWI began, because there are many ways in which WWI might have slowed the adoption of the car in Europe. Indeed, Gordon (Reference Gordon2016) attributes the rapid adoption of the car in the United States relative to Europe in part to the impact of WWI (p. 162). The concern is somewhat addressed by the comparison of motor vehicles to telephones and radios. Some of the ways in which WWI would have slowed motor vehicle adoption would also have been ways in which the war would have slowed telephone and radio adoption. Lower incomes, for example, ought to have slowed the adoption of all three of these goods. The concern is also mitigated by the consistency of the results in Table 1 across countries with varying degrees of involvement in the war. Switzerland was neutral, yet its pattern of ownership looks similar to that of other European countries.
Canada
WWI is only one of many factors that complicate the comparison of motor vehicle adoption in the United States and Europe. A cleaner comparison is between the United States and Canada. Canada’s geographic proximity and similarities along many dimensions to the United States make it a natural comparison and make its slower adoption of the car a mystery. Canada was part of WWI from the war’s beginning, in 1914. But unlike in Europe, in Canada involvement in the war did not have obvious effects on consumers’ car purchases. The number of private cars in use fell in the United Kingdom and France during WWI (Palgrave Macmillan 2013a), but between 1914 and 1918 passenger car registrations in Canada rose by a factor of three. Indeed, the percentage increase in passenger car registrations was larger in Canada during these four years’ than it was in the United States (315 percent versus 234 percent).
We have already seen (e.g., Figure 1 and Table 1) that Canada had many fewer motor vehicles per capita than the United States. Figure 2 illustrates this fact again by comparing the time series of cars per capita in Canada to cars per capita in the United States and to cars per capita in U.S. states bordering Canada. Canada had fewer cars per capita than the United States as a whole in all years before 1930, and even fewer relative to states bordering Canada. In 1909, for instance, the first year for which we have data, there were 5 cars per 10,000 people in Canada while there were 33 per 10,000 people in the United States.Footnote 12 The relative difference between the two countries shrank between 1909 and 1912 but then remained roughly constant. From 1912–29, Canada consistently had roughly half the car registrations per capita of the United States, and even fewer relative to U.S. states bordering Canada.
CAR REGISTRATIONS IN CANADA AND THE UNITED STATES
Note: U.S. border states is the average of car registrations per capita in Washington, Idaho, Montana, North Dakota, Minnesota, Michigan, New York, Vermont, New Hampshire, and Maine.
Sources: Canadian car registrations per capita—see the Appendix. U.S. car registrations are from the Federal Highway Administration, Highway Statistics (table MV-201). Population data are from the U.S. Census as reported in Haines and ICPSR (Reference Haines2010). Population numbers are interpolated between Census years by assuming that population in year t is equal to pop c(1 + g)t−c, where c is the closest Census before year t, and g is the average annual growth rate of the population between year c and c + 10.

Lower per capita income is an obvious candidate to explain fewer cars in Canada, since from 1909–29, U.S. GDP per capita was on average about 50 percent higher than Canadian GDP per capita (Bolt et al. Reference Bolt, Inklaar, de Jong and Luiten van Zanden2020). But lower income can at best explain only part of Canada’s slower car adoption. In 1909 and 1929, Canada’s real per capita income was higher than that in 10 U.S. states. Yet in 1909 Canada had fewer cars per capita than every state except Oklahoma, and in 1929, Canada had fewer cars per capita than every state except Alabama. Income alone cannot explain Canada’s slower adoption of the car. Aikman (Reference Aikman1926) comes to the same conclusion in his thesis on the Canadian automobile industry, arguing (p. 44):
Figures for 1925 show that in Canada there is one automobile for every thirteen persons. Similar statistics in the United States indicate that on the average, one person in every six is a car owner. This difference is, in part, accounted for by the larger per capita wealth and consequently larger incomes of Americans. This is not, however, the whole answer. The main factor is the increased price, resulting in a corresponding restriction of ownership.
Of course, like Aikman (Reference Aikman1926), we also emphasize price—specifically the price of the Model T—as a reason for the larger number of cars in the United States.
One might wonder whether population density can explain United States-Canada differences. Canada as a whole has a low population density, of course. But the large area of northern Canada does not rule out the possibility that much of the Canadian population could have been living in relatively dense areas. To see whether a small number of cars in dense areas of Canada can explain low per-capita ownership in the country as a whole, Table 2 compares Canadian provinces with their neighboring U.S. states. If slow adoption of vehicles in high population density areas (e.g., Toronto and Montreal) explained slow vehicle adoption in Canada as a whole, then we would expect to see large differences vis-à-vis the United States in Ontario and Quebec and smaller differences in more rural provinces. Instead, in all but one case, we see much lower car ownership rates on the Canadian side of the border.Footnote 13 In most cases, per capita car ownership was more than double on the U.S. side of the border; in 1919, for instance, British Columbia had 453 cars per 10,000 people, while Washington state had 1,006, and Manitoba had 524 cars per 10,000 people while North Dakota had 1,261.
Cross-Country Conclusions
While hardly proof of the influence of the Model T, the cross-country data rule out some other possible explanations for the large U.S. lead in car and motor vehicle ownership. First, the large lead in U.S. motor vehicle ownership did not simply reflect that the United States adopted more of all new goods: the U.S. lead in telephone and radio ownership was much smaller than that in motor vehicle ownership. Second, the cross-country data show that the influence of per capita income on motor vehicle ownership was limited. Even poor U.S. states had more cars than richer European countries. Switzerland in 1929, for example, was richer than Alabama, but it had fewer than a fifth as many passenger cars per capita.Footnote 14 Finally, we see that the influence of population density on adoption was limited. The United States had a denser population than Canada, Australia, New Zealand, and Norway, yet it had far more cars. Manitoba and Saskatchewan were no denser than North Dakota and Montana but had only about half the cars per capita.
1909–1919: FROM LUXURY TO MASS-MARKET GOOD
Behind the U.S. car ownership lead in 1929 was the rapid adoption of the car in the prior two decades. More cars were bought in the decade after 1920 than in the decade before (Eli, Hausman, and Rhode Reference Eli, Hausman and Rhode2022), but the decade before 1920 is of more relevance for understanding the advent of the car as a mass-market good. In 1909, the first full year the Model T was available,Footnote 15 the car was a rare, luxury good. There were 305,950 cars in the United States, roughly one car for every 300 Americans. In quantity and purpose, cars were similar to yachts today.Footnote 16 Like yachts today, a car in 1909 could be used for recreation, and it could signal social status. But like a yacht, it was often used for recreation rather than for practical purposes.
The expense of a car limited its popularity. Epstein (Reference Epstein1928) estimates that more than half of all cars sold in 1908 cost more than $1,375; CPI-adjusted, this is $45,000 in 2023 dollars. More than a third of all cars sold cost more than $2,275 ($75,000 in 2023 dollars).Footnote 17 By comparison, per capita income in 1908 was $317,Footnote 18 and annual earnings of a wage earner in manufacturing were $518 (Margo 2006). The few cheap cars that were available tended to be of low quality and limited usefulness. The lack of cheap, good cars meant the almost complete absence of cars in poorer areas of the United States. At the end of 1909, there were a total of 790 cars in Arkansas, one for every 2,000 residents.
Anecdotes from the time confirm that the car was a luxury good with a limited market. Nevins (Reference Nevins1954, pp. 396–97) writes that before the Model T: “For years most farmers had shown a stubborn dislike for automobiles, which scared horses, killed poultry, and sometimes (as Woodrow Wilson noted in a speech made when he first entered politics) flaunted idleness and conspicuous consumption in the faces of hardworking, hard-pinched men.” Berger (Reference Berger1980, pp. 30–31) writes: “For the better part of two decades [1893 to 1913], rural America had passively observed the growth of the automobile industry … [M]ost farmers continued to believe that the automobile was a plaything of the rich and that motoring was a sport. They could see little utilitarian value for the automobile in their own lives.”
Cross-state and cross-county data confirm that cars were a luxury good. Figure 3 shows the number of cars per capita in U.S. states in 1909.Footnote 19 The three states with the most cars per capita were California, Rhode Island, and Massachusetts. In every year from 1900 to 1913, California led all other states in the number of cars per capita. California was both wealthy and blessed with a climate and topography well-suited to the use of the car, especially for leisure purposes.
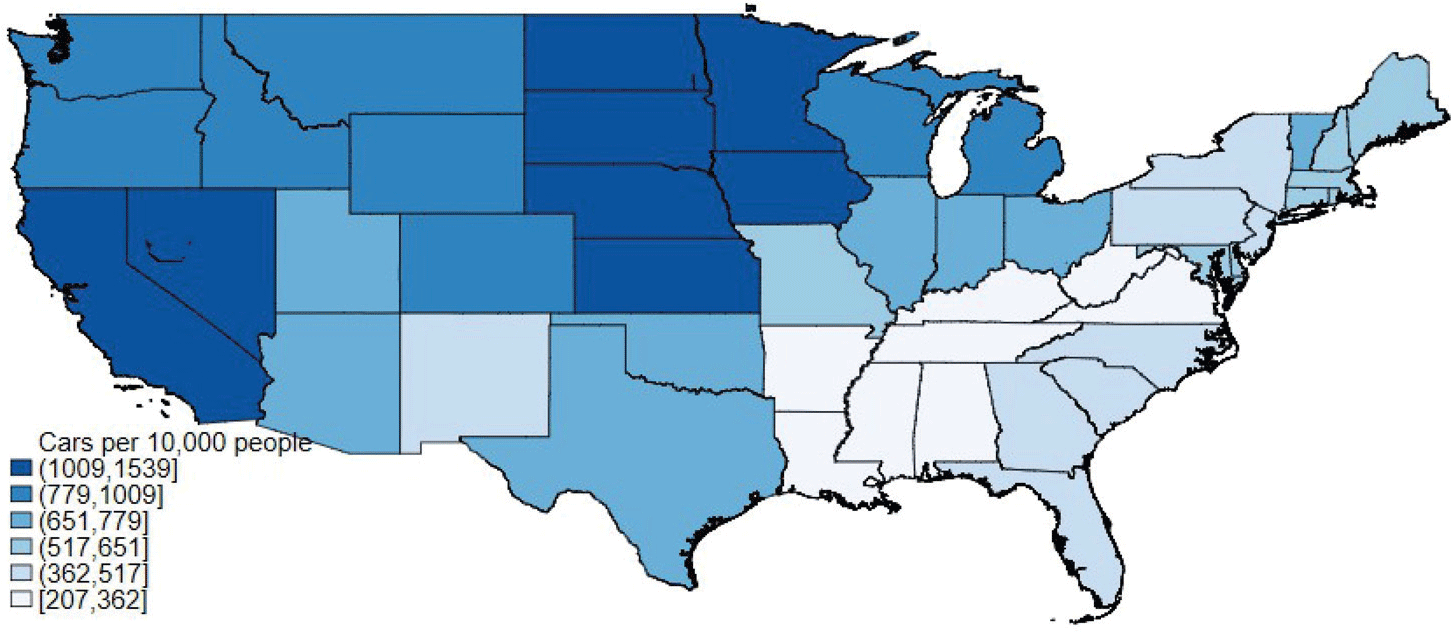
Figure 4 shows per capita car registrations in 1919. In 1919, it remained the case that there were a large number of cars per capita in California and a small number in the South. In the rest of the country, however, the geographic pattern of car ownership was transformed. By 1919, the northeast had (relatively) few, rather than many cars. From Kansas north, the Great Plains had many more cars. The three states with the most cars per capita in 1919 were South Dakota, Nebraska, and Iowa.Footnote 20
CARS PER CAPITA IN 1909
Sources: See footnote 19.

CARS PER CAPITA IN 1919
Sources: See footnote 19.
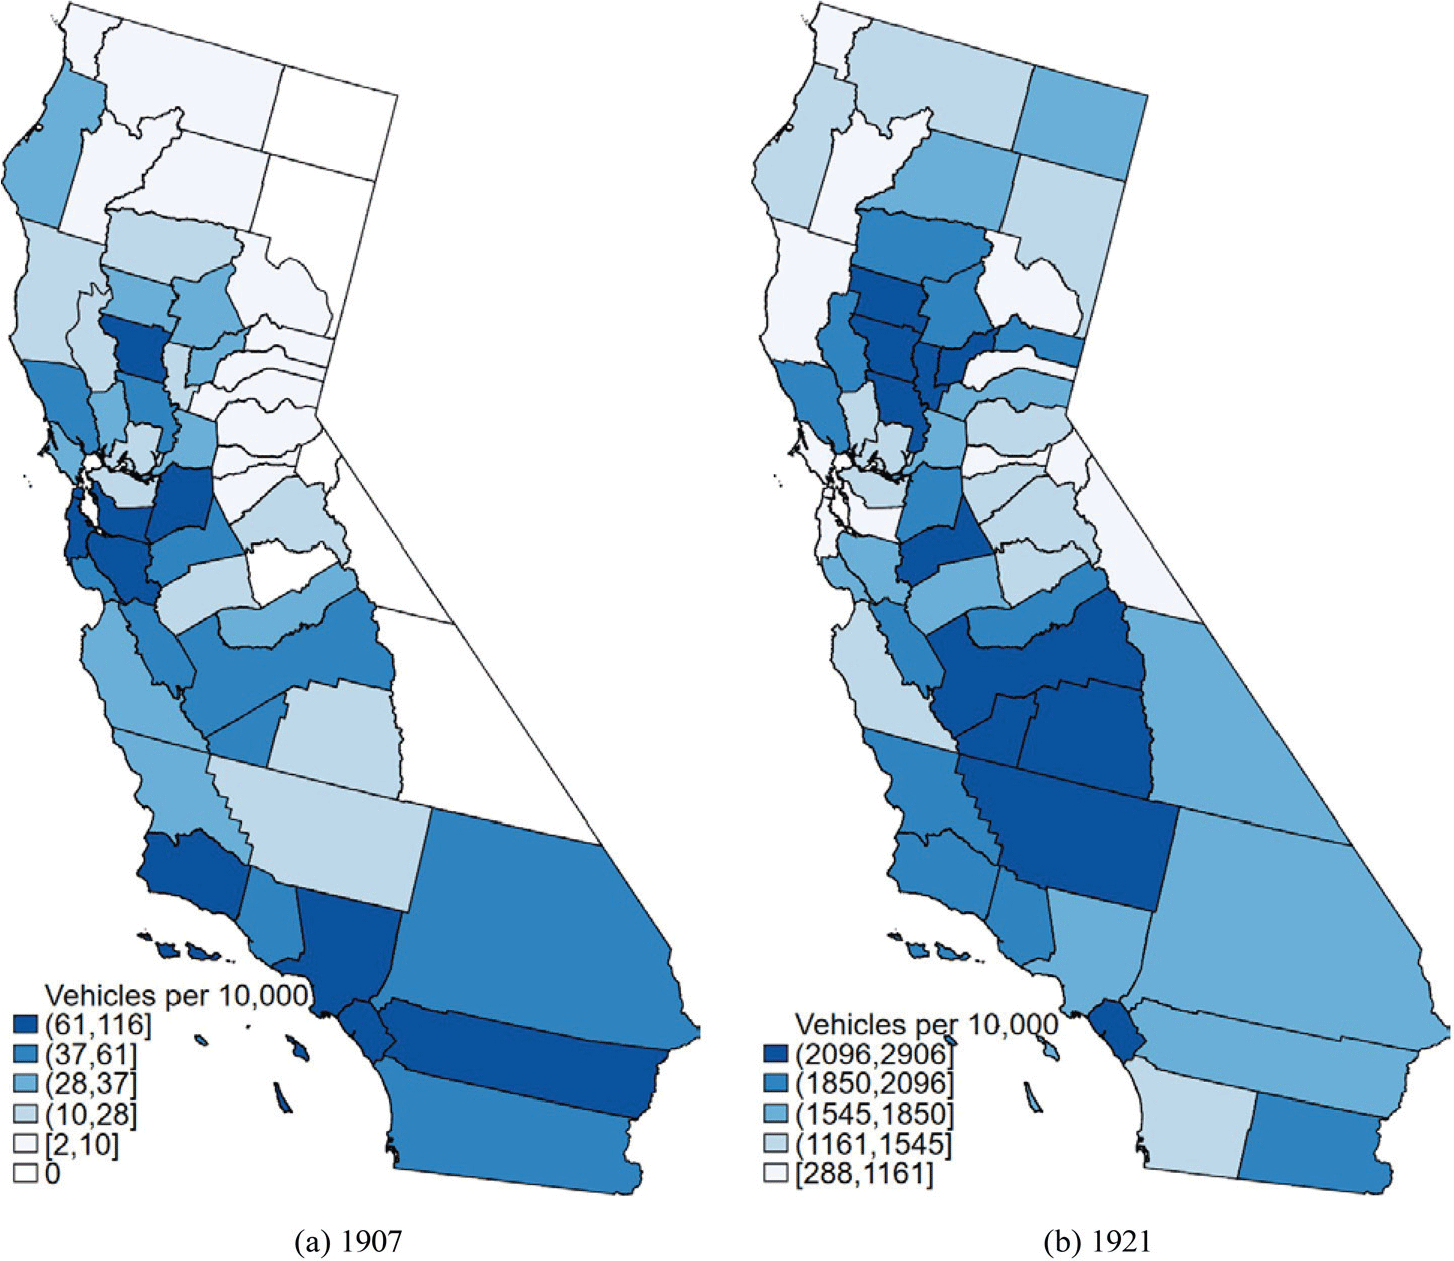
County data from California match the national patterns. Figure 5(a) shows that pre-Model T vehicle ownership, in 1907, was clustered where the rich lived, in or near urban areas; the most vehicles per capita were in and near San Francisco and Los Angeles. In 1921 (Figure 5(b)), by contrast, the counties in California with the largest number of vehicles per capita were primarily in the rural central valley.
MOTOR VEHICLE REGISTRATIONS PER CAPITA IN CALIFORNIA, 1907 AND 1921
Sources: 1907: Motor vehicle registrations are from California Secretary of State, Motor Vehicle Department (1907). These figures are as of 1 September 1907, so we match to interpolated population figures for counties as of mid-year 1907. Interpolation between Census population figures is as described in the note to Figure 2. 1921: Motor vehicle registrations are from Tuttle (Reference Tuttle1921). (It is unclear whether these data are as of 1/1/1921 or another day in 1921.)
To understand changes in car ownership between 1909 and 1919 more systematically, we use cross-state regressions. Table 3 shows the OLS estimates of the relationship between log cars per capita and log population per square mile, log real income per capita, and literacy in 1900, 1909, 1919, and 1929.Footnote 21 The coefficients tell a story consistent with the maps in Figure 5. In 1900 and 1909, the car is a luxury owned by the rich, often in cities. There is a strong relationship between income and car ownership, with the elasticity of car ownership with respect to income well above one. There is little relationship between literacy and car ownership, as one would expect given that cars in 1900 and 1909 were almost exclusively owned by the rich. Reflecting the fact that the rich tended to live in or near cities, there is, if anything, a positive relationship between population density and car ownership.
As we saw in the state and California county maps, there was a large change between 1909 and 1919 in the geographic distribution of car ownership. In 1919 (and similarly in 1929), there is a negative conditional relationship between population density and car ownership; conditional on income and literacy, more rural states had more cars per capita. And while the relationship between income and car ownership in 1919 and 1929 remains positive, the elasticity is well under 1. The large coefficient on literacy beginning in 1919 reflects the small number of cars in the South, where literacy was lowest. Literacy may proxy for income equality, which likely was positively associated with car ownership.
To summarize, the maps and cross-state regressions show that the car was a luxury good before 1909. Ownership was strongly associated with income, with the most cars owned in or near urban areas where the rich lived. By 1919 the car had become a mass-market good with some of the highest levels of ownership in richer rural states.
THE MODEL T
We presented two facts about car adoption in the United States. First, car adoption was rapid relative to that in other countries. Second, from 1909–1919 the car changed from a luxury to a mass-market good. That these years were the same years that the Model T was introduced and then sold in large numbers suggests a causal role for the Model T in driving U.S. car adoption. In the rest of the paper, we consider a variety of further evidence for the Model T’s potential to explain anomalously rapid U.S. car adoption. We start in this section with a summary of the history of the Model T, a history suggesting that the Model T contributed to rapid U.S. car adoption in the 1910s.
The Model T was a revolutionary car in two respects: its design and its method of production (Raff and Trajtenberg 1996). The revolutionary design was present from the Model T’s introduction in fall 1908. Mass production was put in place fully in 1913. Prior to the Model T, cars were designed to appeal to existing affluent, often urban customers, and they were produced in relatively small numbers without mass production methods. As already mentioned, the cheap cars that did exist tended to make compromises limiting their appeal. Henry Ford was unique in his combination of a desire and an ability to design a car that would be both cheap to produce and yet still meet the needs of many consumers. Of particular importance to Henry Ford, the Model T was light, at roughly 1,200 pounds. Its lightness was made possible by the use of vanadium steel (Brinkley Reference Brinkley2003, pp. 100–3). Lightness had many advantages; it meant less wear on the tires, and it meant that a small engine could provide adequate power. Other features of the Model T’s design included high ground clearance, which made the car well suited for unpaved roads; a transmission that was easy to operate; and the placement of the steering wheel on the left.
Contributing to low costs, the Model T was sold with a minimum of unnecessary features. An electric starter was unavailable before 1919,Footnote 22 and was optional until 1926 (McCalley Reference McCalley1994). From 1914–25, the Model T was famously sold only in black.Footnote 23 As Raff and Trajtenberg (1996) put it, “the Model T was a smaller, simpler, less powerful, and less luxurious car than virtually any other car of its time” (p. 91). The simple design meant that the Model T was (relatively) reliable and cheap to maintain (Brinkley Reference Brinkley2003, p. 121). Farmers could service the Model T themselves, often drawing on experience with gasoline-powered farm equipment (Nevins Reference Nevins1954, p. 493).
Though sold with few features, the Model T could be easily modified. As White (Reference White2003, p. 13) recalled:
When you bought a Ford, you figured you had a start—a vibrant, spirited framework to which could be screwed an almost limitless assortment of decorative and functional hardware. . . .
In addition to modifications and additions to the car made by consumers, Model Ts could be modified to serve business purposes. Business uses of the Model T included as tractors pulling plows (Wik Reference Wik1972) and as fire engines and mail trucks (Brinkley Reference Brinkley2003, p. 128).
The Model T’s design made it popular, but it was the combination of its design with mass production that made the Model T affordable to the middle class. Elements of mass production, such as part standardization, were in use before the Model T. And the move in 1910 of production to Ford’s new Highland Park plant led to a rapid series of improvements culminating in 1913 with the novel use of a moving assembly line (Nevins Reference Nevins1954, chap. XVIII). The assembly line saved many labor hours. In summer 1913, for instance, before an assembly line was installed, it took 12.5 hours of labor to construct a Model T chassis. In December 1913, after the installation of a system in which the chassis moved continuously (an assembly line), labor time per chassis had fallen almost 80 percent, to 2 hours and 38 minutes (Nevins Reference Nevins1954, p. 473). As a result of improvements like these, in 1914 Ford made 260,722 cars with 13,000 employees; all other U.S. car companies combined made 286,770 cars with 66,350 employees (Nevins Reference Nevins1954, p. 488).
Productivity improvements allowed Ford to continuously lower the Model T’s price. Figure 6 shows the nominal and real (CPI-deflated) price of the Model T. The Model T’s nominal and real price fell by roughly half between 1909–15; the real price then halved again between 1915–21. The result was a price-quality ratio unmatched by other cars, at least until the 1920s. Raff (Reference Raff1991) argues that it was not until 1926 or 1927 that Chevrolet was able to roughly match Ford’s unit costs. More generally, Raff (Reference Raff1991, p. 731) finds that “The diffusion of Ford’s production idea—as against merely the diffusion of some of the machines—appears to be a distinctly post-First World War phenomenon.”
MODEL T PRICE
Notes: The figure shows the price for the Touring model. The price excludes an electric starter and demountable wheels. Since these were standard equipment in 1926 and 1927, the prices shown here are $85 less than the posted prices in those years.
Sources: The Model T price is from Brinkley (Reference Brinkley2003, p. 111) for 1909–1910; thereafter, it is from McCalley (Reference McCalley1994). The CPI is from Lindert and Sutch (2006) for 1908–1912 (annual data); thereafter it is the monthly, non-seasonally adjusted BLS series from FRED series CPIAUCNS.

Figure 7 is a scatter plot of car price and one indicator of quality—engine displacement per pound—for 250 car models in 1916. Engine displacement is strongly correlated with engine power; cars with more engine displacement per pound were faster and more capable. One can see that the Model T was almost unique in the amount of engine displacement per pound that one got for the price. Ford himself was proud of this indicator of quality, writing in 1922:Footnote 24
With the Ford there are only 7.95 pounds to be carried for each cubic inch of piston displacement. This is one of the reasons why Ford cars are “always going,” wherever and whenever you see them—through sand and mud, through slush, snow, and water, up hills, across fields and roadless plains.
ENGINE DISPLACEMENT AND CAR PRICES IN 1916
Notes: The figure shows the 1916 chassis price and engine displacement divided by the chassis weight for the Model T, plus the 249 cars for which Raff and Trajtenberg (2011) provide data.
Sources: Data on the Model T price and weight is from McCalley (Reference McCalley1994, p. 195). Data on the Model T’s engine displacement is from Raff and Trajtenberg (2011); we look at their 1915 and 1917 data and infer that the Model T’s engine in 1916 was the same as that in 1915 and 1917.

That price and engine displacement are negatively correlated implies that engine displacement was only one dimension of quality. Figure 7 does not reflect many other attributes (e.g., reliability, ground clearance, availability of aftermarket modifications) that made the Model T more attractive than other cars.
The Chevrolet “Four Hundred and Ninety” provides a helpful illustration of what competition to the Model T looked like in the 1910s.Footnote 25 Sold beginning in June 1915, its name was its initial price, $490 (Kimes and Ackerson Reference Kimes and Ackerson1986). Four-hundred and ninety was also, likely not coincidentally, the price of the Model T (McCalley Reference McCalley1994, p. 173). Its price competitiveness with the Model T was, however, short-lived; Kimes and Ackerson (Reference Kimes and Ackerson1986, p. 21) note that after an initial period “generally, as the T’s price was lowered the ‘Four Hundred and Ninety’s was raised and the price differential between the two cars widened considerably.” Whether one got a better car for the “Four Hundred and Ninety”’s higher price is unclear. In Kimes and Ackerson’s (1986, p. 21) judgment: “[F]or bas[ic] transportation regardless of price, the Model T would unquestionably remain the better bargain for some years.” Alfred P. Sloan Jr., then president of General Motors, later wrote (Sloan Reference Sloan1990, p. 69):
In 1921 Ford had about 60 per cent of the total car and truck market in units, and Chevrolet about 4 percent. With Ford in almost complete possession of the low price field, it would have been suicidal to compete with him head on. No conceivable amount of capital short of the United States Treasury could have sustained the losses required to take volume away from him at his own game.
Given the lack of other low-price competition, as the price of the Model T fell, quantities sold rose, and the Model T quickly captured a near monopoly on low-price car sales. Around 1913, the Model T made up 96 percent of all cars sold for less than $600 (Nevins Reference Nevins1954). Figure 8 shows annual production of the Model T, a good proxy for sales. Production rose from 10,660 in the first year of production (1 October 1908–30 September 1909) to 170,211 in 1913 and more than 900,000 in 1920. In 1923, the peak production year, Ford produced more than 2 million Model Ts. The share of the stock of passenger cars that were Fords (almost entirely Model Ts) was already 29 percent in 1914 and rose to 42 percent in 1917.Footnote 26 By 1926, half of all cars on the road were Fords.
As Ford’s sales rose, its dealer network quickly grew. The first Ford dealership was established around 1903 in San Francisco (Ford Motor Company 1953). The number of dealers grew rapidly thereafter, as the company pushed to create a dense nationwide network. In early 1909, just a few months after Model T sales began, there were 1,500 Ford dealers.Footnote 27 In 1923, the Wall Street Journal (19 October 1923) reported that Ford had some 9,400 dealers nationwide. In addition to selling and repairing Model Ts, dealers helped to advertise the car. Advice to dealers in the Ford Times in 1911 read: “Early to bed and early to rise. Work like hell and advertise” (quoted in Wik Reference Wik1972, p. 35). Local dealer publicity complemented nationwide free and paid publicity from the parent company. Free publicity came, for instance, from the announcement in early January 1914 that Ford would pay his workers $5 a day; as Raff (Reference Raff1997, p. 2) puts it, after the announcement of the $5 day, “[Henry Ford’s] name was known to every newspaper reader in the United States and doubtless to many other Americans as well.”
As with any popular consumer product, it is difficult to quantify the effect of publicity versus word-of-mouth as an explanation of growing sales. No doubt both mattered. Perhaps reflecting both Ford’s scale and the importance of word-of-mouth advertising, relatively little of the cost of a Model T went to advertising expenses. Parlin and Youker (1914) estimate that of the $550 cost of a Model T to a consumer, only 4 percent ($20) went to “advertising, selling and overhead” (chart 8 and pp. 387–88).
CROSS-SECTIONAL EVIDENCE THAT THE MODEL T EXPANDED THE MARKET
The large number of Model Ts sold, and its dominance of the low-price car segment suggest that the Model T contributed to rapid U.S. car adoption. Here we consider another approach to understanding whether the Model T increased sales: we look at who bought Model Ts. As the policy of producing the Model T only in black suggests, the Model T’s design was utilitarian, not stylish. Narrative evidence suggests that while many cars were bought to signal social status or for leisure purposes, Model Ts were often bought for more utilitarian reasons. In their 1914 investigation of the automobile industry Parlin and Youker (1914, p. 622) write: “People will more readily buy Fords where the kind of car they drive has little or no effect on their social standing in the community.”
If the Model T led a group of consumers, such as farmers, to become first-time car buyers, this would be evidence that the Model T expanded the market for cars rather than cannibalizing the sales of other manufacturers. Thus, in this section, we look at cross-sectional evidence on who was buying cars and whether this changed at the time of the Model T’s introduction. In 1922, we are able to actually observe where Model Ts were. The results are consistent with the Model T opening up a new market for cars in rural areas of the country. As one would expect if a new market opened up, we see that residents of rural areas quickly started buying more cars when the Model T was introduced, and we see that the share of cars that were Model Ts is strongly correlated with the rural share of the population. If the Model T had not created a new market for cars, these results would be less likely; if the Model T were bought by the same people who had been buying other cars, then it would be somewhat surprising to see a large change in where cars were bought when the Model T was introduced, and it would be surprising to see that Model Ts were disproportionately owned in rural areas of the country.
We have already seen that population density became negatively correlated with car ownership during the first decade of Model T production, between 1909 and 1919. To further examine what happened to car ownership in more or less rural states, we divide states into four quartiles based on their rural population share. Figure 9(a) shows the path of car registrations per capita in these four groups of states. It shows that after the Model T was introduced, car registrations per capita grew more rapidly in more rural areas of the country. We can see this pattern more clearly in Figure 9(b), which shows the natural log (percent) difference between car registrations per capita in states with rural shares in quartiles 2 through 4 relative to the states with the smallest share of the population in rural areas (quartile 1). The figure shows that prior to the introduction of the Model T, car registrations per capita grew similarly in all states, regardless of the rural population share. After the introduction of the Model T, car registrations per capita began to grow more quickly in states with a larger share of the population in rural areas. And this relationship is monotonic: between 1908 and 1915, the number of cars per capita in the least rural states (quartile 1) grew 840 percent; in quartile 2, 1,320 percent; in quartile 3, 1,800 percent; and in quartile 4, 2,050 percent.
MODEL T PRODUCTION
Notes: The figure shows the production of all Model T types, including trucks. Some production was exported, though the number of Model Ts exported was small. For 1909–1912, production is for the fiscal year beginning 1 October; in 1914, production is for the 10-month period from 10/1/1913–7/31/1914; from 1915–1920, production is for the fiscal year beginning 1 August; in 1921, production is for the 17-month period from 8/1/1920–12/31/1921; from 1922–27, production is for the calendar year.
Source: McCalley (Reference McCalley1994).

CAR REGISTRATIONS BY RURAL SHARE QUARTILE
Notes: Figure 9(a) shows the path of car registrations per capita in four sets of states grouped by the rural share of the population in 1910. Quartile 1 has the smallest share of the population living in rural areas. Figure 9(b) shows the natural log difference in car registrations per capita in quartiles 2–4 relative to quartile 1. The first vertical line indicates 1909, when the Model T was introduced; the second vertical line indicates 1913, when the Model T began to be mass produced.
Sources: Car registrations per capita—see the note to Figure 2. Rural share of the population is from the 1910 Census as reported in Haines and ICPSR (Reference Haines2010).

Figure 9 is consistent with the hypothesis that the Model T opened up a new market for cars among the rural population. For more evidence, we turn to county-level data. Figure 10 shows the share of cars in a county that were Model Ts in 1922, the first year for which we have such data. The large variation itself suggests that the Model T’s appeal varied across the country. The standard deviation of the share of cars in a county that were Model Ts was 13 percent. The share ranged from more than 90 percent in 17 counties to less than 30 percent in 30 counties. The only county with both more than 1,000 total car registrations and a Model T share of less than 20 percent was Manhattan, New York. That Manhattan is an outlier with a low Model T share is consistent with the Model T appealing relatively less to the rich, to those concerned with social status, and to urban populations.
MODEL T SHARE
Note: The map shows the share of cars in a county that were Fords (nearly entirely Model Ts) on 1 January 1923.
Source: Tuttle (Reference Tuttle1923).

To better understand the patterns in this map, we estimate regressions across counties j of the form
 $$Model\,{T_j} = {\beta _0} + {\beta _1}Rural\,shar{e_j} + {\beta _2}Income\,tax\,return\,p.c{._j} + {\beta _3}Share\,literat{e_j} + \gamma 'F{E_j} + {\varepsilon _j}.$$
Model T j is either the share of cars in a county that were Model Ts or the number of Model Ts per capita in a county. Income tax return p.c. is the per capita number of income tax returns filed in a county in 1922. Since only the rich—the top 5–10 percent of households—had to pay income tax, tax returns proxy for income in a county. FE j are state fixed effects. Column (1) of Table 4 shows results with Model T share as the dependent variable and with no state fixed effects. Column (2) adds state fixed effects. With and without fixed effects, there is a large coefficient on the rural share of the population. The coefficient of roughly 0.15 means that for every 10 percentage point increase in the share of a county’s population that was rural, the share of cars that were Model Ts increased by 1.5 percentage points. So a one-standard-deviation increase in the rural share of the population (25 percentage points) was associated with a 3.5 percentage point increase in the Model T share. The coefficient is precisely estimated. With state fixed effects, the 95 percent confidence interval is [0.13, 0.21].
CROSS-STATE REGRESSIONS

Notes: The dependent variable is the natural log of the number of cars per 10,000 people. Robust standard errors are in parentheses. *p < 0.1, **p < 0.05, ***p < 0.01.
Sources: Car registrations are from the Federal Highway Administration, Highway Statistics (table MV-201). These data are likely as of 12/31, so we match registrations in year t to population in year t + 1. Population data and land area are from the Census as reported in Haines and ICPSR (Reference Haines2010). Nominal state per capita income data for 1909 are nominal per capita income in 1900 multiplied by (1 + g)9, where g is average annual growth in per capita state income between 1900 and the 1919–1921 average. State per capita incomes in 1900 and 1919–21 are taken from Easterlin (1957, table Y-1, p. 753). Nominal state per capita income for 1929 is from the BEA, table SAINC1. These figures are converted to 2011 dollars by multiplying each per-capita income figure by Y mad,t / Y nom,t, where Y mad,t is the Maddison estimate of GDP per capita in the United States in 1900, 1909, 1919, or 1929 in 2011 dollars (Bolt et al. Reference Bolt, Inklaar, de Jong and Luiten van Zanden2020), and Y nom is nominal U.S. GDP per capita. Literacy is from the Census as reported in Haines and ICPSR (Reference Haines2010).
CROSS-COUNTY REGRESSIONS

Notes: The dependent variables are as of 1 January 1923. Counties with fewer than 20 total cars are excluded. Share Model T is the share of cars in a county (in percent) that were Fords; these would have been nearly entirely Model Ts. Model Ts p.c. is the number of Fords per 10,000 people. We do not include Ford trucks, although many of these may also have been (modified) Model Ts. Non-Model Ts p.c. is the number of non-Ford cars per 10,000 people. Standard errors clustered by state are in parentheses. *p < 0.1, **p < 0.05, ***p < 0.01.
Sources: Model T and other car registrations are from Tuttle (Reference Tuttle1923); rural population share and literacy are from the 1920 Census as reported in Haines and ICPSR (Reference Haines2010); tax returns are from the IRS statistics of income.
We obtain a similar result in Columns (3) and (4), in which the dependent variable is Model Ts per capita. With and without state fixed effects, the coefficient on rural share is roughly 3; this means that a one standard deviation increase in the rural share of the population was associated with 75 more Model Ts per 10,000 people. In Columns (5) and (6), we see that there was no relationship between rural share of the population and the per-capita ownership of cars that were not Model Ts. It was not that the rural population bought more of every type of car; the Model T was unusual in its rural appeal.
The Model T’s rural appeal likely resulted from many factors. One of these was the lack of good roads in rural areas. In Florida in 1914, for instance, only 16 percent of all roads were surfaced, and most of these surfaced roads were still unpaved; they were surfaced with sand or clay (U.S. Department of Agriculture 1917, p. L, table 40). As noted previously, the Model T was well-suited for use on bad or non-existent roads, likely increasing its appeal in rural areas relative to other cars. A joke at the time was “about the man who asked that his Ford be buried with him. It had never failed to get him out of a hole” (Galbraith Reference Galbraith1958).
Row two of Table 4 reports the association between Model T ownership and tax returns per capita (scaled as tax returns per 100 people). The estimates show a negative relationship between tax returns per capita and the share of Model Ts in a county (Columns (1) and (2)), and a (statistically weak) positive relationship with the number of Model Ts in a county (Columns (3) and (4)). The relationship with the number of non-Model T cars in a county is much larger (Columns (5) and (6)). Conditional on rural share, literacy, and state fixed effects, a one standard deviation increase in income tax returns per capita was associated with 53 more Model Ts and 119 more non-Model T cars per 10,000 people. These results fit with a story in which richer counties had more cars overall but had a smaller share of cars that were Model Ts. The regression results closely match the narrative in Parlin and Youker (1914, p. 622), who observe:
Those sections will absorb larger numbers of Fords, which contain the largest number of people who can pay $550 for car, but cannot afford a car of a more expensive grade; that is, which contain the largest number of people who are not well-to-do, but who are earning more than a bare living. These are found among the farmers and in minor cities and villages.
The final row of the table shows the association between car ownership and the literate share of the population. With state fixed effects (Column (2)), there is no relationship between literacy and Model T share. But literacy, perhaps because it proxies for something like median income, is strongly correlated with per capita ownership of all cars, both Model T and non-Model T (Columns (3)–(6)). The coefficient of 14 in Column (4), for instance, means that a 1-percentage point increase in the share of a county’s population that was literate was associated with 14 more Model Ts per 10,000 people.
The coefficients on the state fixed effects are also themselves of interest. In the specification in Column (4), in which Model Ts per capita is the dependent variable, the largest positive state fixed effects are Kansas, Iowa, and Nebraska. Conditional on rural share of the population, income tax returns, and literacy, there were more Model Ts in these states than would be expected. The coefficient on the Kansas fixed effect is 754 compared to, for instance, a coefficient on New York of 202. So conditional on the controls, there were 550 more Model Ts per 10,000 people in Kansas than in New York. The Model T evidently had a particular appeal in the Great Plains, an appeal only partly explained by the rural, literate population.
While there is strong evidence that the Model T opened up a new market for cars in rural areas, neither Figure 9 nor Table 4 is proof. It is possible, for instance, that even had the Model T not been introduced, rural areas would have seen much more rapid adoption of the car in the early 1910s than did urban areas. And it is possible that the disproportionate ownership of Model Ts in rural counties that we observe in Table 4 does not reflect a Model T effect per se, so much as a preference in rural areas for cheap cars. While these alternative hypotheses cannot be entirely dismissed, we view them as unlikely in part because qualitative accounts so strongly suggest that the Model T opened up a new market for cars among farmers and the middle class more generally.
To sum up, there is quantitative evidence that the Model T appealed to a distinct market. That the introduction of the Model T was associated with a larger increase in car ownership in rural states fits with the county-level evidence that Model Ts were more popular in rural areas. Of course, Model Ts were in urban areas too. There would have been no way for Model Ts to be roughly half of all cars in the country in the mid-1920s without large numbers being bought in and near cities. Manhattan, New York, had a uniquely low share of Model Ts, but there were still 19,773 Model T cars in Manhattan on 1 January 1923. There were more Model T cars in Los Angeles County (92,507) than in Arkansas and Mississippi combined. The point is that the disproportionately large number of Model Ts purchased in rural areas supports the hypothesis that the Model T opened up a new market for cars, thus contributing to the car becoming a mass-market good.
THE MODEL T ABROAD
We began by documenting the anomalous U.S. car ownership lead in 1929, anomalous in the sense that it was larger than one would expect given cross-country ownership differences for telephones and radios, and anomalous in the sense that the lead is not obviously explained by income or population density. This paper is not the place for a full explanation of the U.S. car ownership lead. And as emphasized at the end of the introduction, the endogeneity of many factors influencing car ownership means that a full explanation for rapid U.S. car adoption is likely impossible. Our goal in this section is a more modest one: to show that the Model T did not contribute to car adoption abroad in the same way that it did in the United States, likely in part because it cost more abroad. That the Model T contributed much less to car adoption abroad than it did to car adoption in the United States is one reason why overall car adoption was much slower abroad than it was in the United States.
A few numbers illustrate the small number of Model Ts sold abroad. In 1924, Ford’s U.S. production of cars, trucks, and chassis totaled 1,790,278.Footnote 28 Of these, 142,641 were exported.Footnote 29 Ford in Canada (Walkerville, now Windsor, Ontario) produced 71,371; Ford in England (Manchester) 27,505; Ford in Belgium (Antwerp) 25,206; and Ford in Argentina (Buenos Aires) 23,210. Ford produced in other countries, but generally in small numbers. Total production abroad outside these countries was less than 56,000.Footnote 30
The small numbers sold abroad often reflected the small overall market for cars in many countries, not any specific unpopularity of the Model T. In 1914, for instance, Model T sales in Canada exceeded the sales of all other cars in Canada combined (Wilkins and Hill 2011, p. 43); 45 percent of the stock of cars in Canada were Model Ts in 1926, close to the Model T share of cars in the United States. But since Canada had only about half the U.S. level of cars per capita, this meant it had only about half the number of Model Ts per capita (Wilkins and Hill 2011, p. 132). In 1915 in New South Wales, Australia, 20 percent of all car registrations were Fords; no other company accounted for more than roughly 6 percent of registrations (Holderness Motors Limited 1915, p. 27). Likewise, on 1 January 1928, 42 percent of all motor vehicles in the Netherlands were Fords. But the Netherlands had only about 6 percent of U.S. motor vehicles per capita (Table 1), so the absolute number of Ford vehicles in the Netherlands (31,493) was small (De Goey 2003, table 1, p. 236).
Thus outside the United States, the Model T was often a popular—or the most popular—car. Still, it would be wrong to conclude that Ford was uniformly popular abroad. In Europe, Ford and American car manufacturers more generally often faced difficulties appealing to the local market (Foreman-Peck Reference Foreman-Peck1982, pp. 873–76). Ford, in particular, struggled against the obstacle of Ford’s unwillingness to modify the Model T for different markets. For some time after WWI, for instance, Ford refused to produce Model Ts in Britain with the steering wheel on the right (Wilkins and Hill 2011, p. 101). Ford also often marketed the Model T abroad in ways similar to how it marketed the Model T in the United States, at times to the detriment of Ford sales. The degree of flexibility allowed to foreign operations varied over time, but in the early 1920s—the peak of Model T sales in the United States—marketing in Europe “had to be done according to Detroit scripture” (Wilkins and Hill 2011, p. 100). In England, for instance, this meant that Ford dealers were not allowed to sell cars made by other manufacturers. The result was unhappy dealers and a decline in the number of Ford dealers in England (Wilkins and Hill 2011, p. 100).
The Model T also faced local competition, particularly after 1920. As Wilkins and Hill (2011, pp. 100–101) put it: “[T]he Model T, a dozen years after its first appearance, was in 1920 still a far better buy than any car in its class or price range. The future was a different matter. Morris, Austin, Renault, Citroën, and Fiat would soon begin to produce in quantity. General Motors in 1920 would sell 30,000 units overseas.” One might add to this list Opel in Germany, which outsold Ford there (Wilkins and Hill 2011, p. 140). In England, the Model T ceased to be the best-selling car in 1924, when it was outsold by Morris; in that year, Morris sold 32,918 “cars and chassis,” while Ford produced (and likely roughly sold) 27,497 “units” (Wilkins and Hill 2011, pp. 143–44).
In France, Citroën was a pioneer in mass-producing cars. Like Ford, André Citroën attempted to mass-produce one model, a simple 10 horsepower car (Loubet 2018). Difficulties producing and selling the 10 horsepower model, however, led Citroën in 1922 to introduce a 5 horsepower model (Loubet 2018, pp. 60–61). According to a January 1922 advertisement, the 5 horsepower model sold for 8,500 francs, roughly the same price as the Model T touring model (8,925 francs) or runabout model (8,200 francs).Footnote 31 The Model T, however, with roughly 14 or 20 horsepower (depending on the measurement method), was the much more powerful car.Footnote 32 Still, in 1925 Citroën produced 61,487 cars in France, far more than Ford’s production of 24,200 (Loubet Reference Loubet2001, p. 93).
Local competition benefited from the relatively high price of the Model T abroad. Tables 5 and 6 show prices of the Model T around the world in 1914 and 1922.Footnote 33 The first four rows of Table 5 show prices in the United States. Within the United States, consumers paid more the further they were from Detroit; the price in San Francisco and Los Angeles was $75 (roughly 15 percent) more than the price in Detroit. To learn about Model T prices abroad, we collected prices from newspaper advertisements. We searched Readex World Newspaper Archives, CLR Global Press Archives, Proquest Historical Newspapers, and Hathitrust, as well as the digitized newspaper holdings of national libraries across Europe and Oceania. We used the search terms “Ford Motor” and “Universal Car,” a Ford trademark. That we could use these English language terms to find newspaper advertisements for the Model T around the world is an indicator of the uniformity of Ford’s marketing across countries. We found data on prices in 18 countries in 1914 and 19 countries in 1922. While there is large variation, Tables 5 and 6 show that in all cases the Model T cost more abroad than it did in the United States; it cost roughly 20–50 percent more in Canada and roughly 20–150 percent more elsewhere.Footnote 34
PRICE OF A MODEL T IN 1914 (U.S. DOLLARS)

Notes: Exchange rates are from Mood (Reference Mood1930). The U.K. price roughly matches that for 1913 reported in Foreman-Peck, Bowden, and McKinlay (Reference Foreman-Peck, Bowden and McKinlay1995, p. 13).
PRICE OF A MODEL T IN 1922 (U.S. DOLLARS)

Notes: Exchange rates are from Mood (Reference Mood1930), except that for Canada, which is from The Federal Reserve Bulletin, March 1922, p. 366.
*These prices were in effect 1/16/22–10/16/22; on 10/17/22 prices of all Model T types were reduced by $50 (McCalley Reference McCalley1994, p. 306).
One source of the Model T’s higher price abroad is obvious. Most countries imposed high tariffs on the import of cars from the United States. Until 1926, for instance, Canada imposed a 35 percent tariff on imported cars and a roughly 30 percent tariff on imported car parts (Melanson 2009). In 1914, the tariff on cars imported to Japan was also 35 percent; Argentina and Norway imposed tariffs of 12 percent (U.S. Department of Commerce 1914).
Tariffs alone are, however, an incomplete explanation. First, they do not explain why price differences appear to have sometimes exceeded the tariff. Second, the tariff explanation leaves open the question of why Ford could not manufacture cars abroad at the same cost as he did in the United States. As Foreman-Peck (Reference Foreman-Peck1982) details, production by American car manufacturers abroad was hampered by limited economies of scale, limited managerial expertise, and more expensive input costs. The comparison to Canada is again instructive; it shows the difficulty of replicating the success of mass production in Highland Park even when production abroad meant production only 15 miles away. The Ford Motor Company of Canada began operations in Windsor, Canada, just across the river from Detroit, in 1904. The Ford plant in Windsor (then Walkerville) was at one point the largest automobile factory in the British Empire (Wilkins and Hill 2011, p. 113). But Ford in Windsor could not manufacture cars at the same cost or at least sell them at the same price as the company did in Michigan. Certainly, there were few barriers to knowledge; engineers and managers could easily travel back and forth between Windsor and Detroit. Nor were economies of scale the obvious problem. Ford Canada sold Model Ts not only in Canada, but also throughout the British Empire (except to Great Britain itself). And Henry Ford himself thought that Ford Canada did not suffer any cost disadvantages from its scale (Aikman Reference Aikman1926, p. 77). Yet before WWII, the magic of Ford’s mass production in Michigan did not even extend across the Detroit River.
CONCLUSION
Perhaps no single consumer product transformed American life more than the Model T. When Nevins (Reference Nevins1954) said that mass production of the Model T was a “lever to move the world” (p. 447), he was engaging in little exaggeration. We have shown that the introduction of the Model T was associated with the transformation of the car from a luxury to a mass-market good, and we have argued that the relative lack of success of the Model T abroad likely explains part of the U.S. car ownership lead.
That the United States adopted the car so quickly—in part a consequence of the Model T—mattered not only for the interwar economy. It may still matter today. Today the United States continues to have an unusually large number of vehicles per capita. In 2019 data, the United States had a quarter more vehicles per capita than Canada, and a third more than western Europe.Footnote 35 Furthermore, differences in car ownership may understate differences in local transportation between the United States and other countries. Circa 2005–2010, the average American took 25 trips on public transport per year, compared to, for instance, 55 trips per year in Canada, 87 in France, and 139 in Germany (Buehler and Pucher Reference Buehler and Pucher2012, figure 1, p. 543). The enduring dominance of the car in the United States has many causes, of course. But one possible cause is path dependence from the years of the Model T. That the United States adopted the car decades earlier than other countries meant U.S. cities began to be (re)designed for cars sooner; it meant that cars changed culture earlier; and it meant that public transportation faced competition from the car earlier, before it was protected by large-scale public involvement. By contrast, in Europe cars only became widespread after WWII, when governments were large and heavily involved in providing public transportation. Quantifying the extent to which the later adoption of the car mattered for local transportation outcomes today is outside the scope of this paper, but we suspect it did.
It was not until 1974, for instance, that France reached the per-capita level of vehicle ownership reached by California in 1926.Footnote 36 In 1926, public transit was extensive in California, with, for instance, a well-used streetcar network in the Los Angeles area of more than 1,000 miles (Morrison Reference Morrison2021). But this public transit was privately provided and could not compete against cheap car transportation. In 1974, by contrast, public transit in France was public; it did not need to win a market competition with the car to survive. When readers of this paper in California drive to work and those in France take a train, we may see the long shadow of the Model T.
Appendix: Car Registration Data in Canada
Data on motor vehicle registrations in Canada was published annually before WWII by the Dominion Bureau of Statistics, Transportation and Public Utilities Branch. These publications, titled “The Highway and Motor Vehicle in Canada” reported registrations for each province, with some data also given at a more local level. We take all data from the Dominion Bureau of Statistics (1939, pp. 28–33). Provinces began collecting registration data at different times. Ontario, the first province to do so, began in 1904. By 1909, data are available for all of Canada except Prince Edward Island and the Yukon and Northwest territories. So that changes in car registrations do not reflect changes in geography, we take “Canada” before 1941 to be the provinces with car registration data beginning in 1909, for example, the entire country except Prince Edward Island and the Yukon and Northwest territories.Footnote 37
By 1923 all provinces separately reported registration numbers for passenger cars, commercial vehicles, and motorcycles. Earlier in the period, however, there is often only a number given for passenger car registrations or total registrations. We use the total number of motor vehicles in a province when data for passenger cars alone are unavailable. This biases upward the number of passenger cars per capita in Canada in early years.
A complication arises with the data for Ontario. According to Dominion Bureau of Statistics (1939, p. 5):
Before reciprocal arrangements were made in regard to the operation of motor vehicles registered in other provinces and in the United States a large proportion of the cars registered in Ontario were owned outside the province, principally in the United States.
We do not want to count cars owned in the United States as part of the stock of cars in Canada, so we do our best to exclude these cars from the Canadian count. Dominion Bureau of Statistics (1939, p. 5) gives numbers for outside registrations in 1906 (659 outside registrations), 1908 (1,165), and 1914 (6,405). It also specifies that outside registrations were an issue only between 1906 and 1916; by 1917, there were a minimal number (386) of outside registrations. We estimate outside registrations in years for which no exact figures were given (in other words, in 1907, 1909–1913, and 1915–1916) by assuming that outside registrations grew at the rate between the two closest years for which a figure is given. In other words, we estimate that outside registrations in 1915 were or 1914 * (1 + g), where or 1914 is the number of outside registrations given for 1914 and g is the annual growth rate of outside registrations between 1908 and 1914.
For computing per-capita figures, population data for Canada are Census figures from series A2-14. We interpolate between Census years (1901, 1911, 1921, and so on) using the method outlined in the note to Figure 2. Motor vehicle registrations appear to be end-of-year (or close to end-of-year) numbers. See, for example, Dominion Bureau of Statistics (1939, pp. 36–37). The 1901 Canadian Census reported population as of 1 March; the 1911–1931 Census reported population as of 1 June. Given our argument that car adoption was much more rapid in the United States than abroad, we choose to accept an upward bias in per capita vehicle figures for Canada by associating motor vehicles as of 31 December in year t with population on 1 June of year t.


 Open access