


The transition from high school to college is a time marked by both opportunity and stress, including navigating new academic and social contexts, increased academic workload, and emerging financial responsibilities. College students also report changes in various areas of health and well-being during this time, including greater perceived stress, increases in mental health symptoms, and alterations in sleep patterns (Doane et al., Reference Doane, Gress-Smith and Breitenstein2015; Kerr et al., Reference Kerr, Johnson, Gans and Krumrine2004; Kroshus et al., Reference Kroshus, Hawrilenko and Browning2021). Theory and empirical evidence suggest that associations between mental health, stress, and sleep are bidirectional (Kahn et al., Reference Kahn, Sheppes and Sadeh2013; Tavernier & Willoughby, Reference Tavernier and Willoughby2014). However, less is known regarding within-person bidirectional links between stress, sleep, and depression across adolescents’ transition into and through college. Recognizing recent increasing strides that Hispanic/Latino/aFootnote 1 students are making in higher education (i.e., 63% of Latino/a young adults transitioning to college in the U.S.; Hussar et al., Reference Hussar, Zhang, Hein, Wang, Roberts, Cui, Smith, Bullock Mann, Barmer and Dilig2020), it is critical that developmental research examines these questions among Latino/a college students, for whom these questions have not been extensively studied. Harnessing the strengths of a longitudinal sample of self-identified Hispanic/Latino/a adolescents, the present study investigated within-person reciprocal associations between school/college stress, sleep problems, and depressive symptoms across Latino/a students’ transition into and through college (i.e., spring of senior year of high school to spring of the fourth year of college).
Adjustment during the college years
Much research has focused on various aspects of adjustment during the transition to college, among them being stress (i.e., general, college-specific), mental health (i.e., depression, anxiety), and sleep (i.e., problems, duration). Indeed, empirical work suggests that adolescents who are transitioning to college often report increases in perceptions of stress (Kerr et al., Reference Kerr, Johnson, Gans and Krumrine2004), heightened depressive symptoms (Kroshus et al., Reference Kroshus, Hawrilenko and Browning2021; Sasser et al., Reference Sasser, Waddell and Doane2023a), and alterations in sleep health (e.g., better/worse sleep quality, greater variability in sleep timing; Doane et al., Reference Doane, Gress-Smith and Breitenstein2015; Park et al., Reference Park, Chiang, Irwin, Bower, McCreath and Fuligni2019). Latino/a students may be particularly affected by stress during this time, as ethnic/racial minority students often encounter sources of both general (i.e., college) and minority-specific stress (e.g., discrimination), which are linked with poorer sleep quality and increased mental health symptoms among Latino/a college students (Arbona et al., Reference Arbona, Fan and Olvera2018; Pichardo et al., Reference Pichardo, Molina, Rosas, Marbella and Sanchez-Johnsen2021). Evidence also highlights race-based disparities in health, with Latino/a college students experiencing elevated sleep problems, increased depressive symptoms, and unmet needs for mental health relative to non-Hispanic White students (Lipson et al., Reference Lipson, Kern, Eisenberg and Breland-Noble2018; Okuagu et al., Reference Okuagu, Athey, Prichard, Williams, Jean-Louis, Killgore, Gehrels, Alfonso-Miller and Grandner2018). Thus, additional work examining indicators of health and well-being across Latino/a adolescents’ transition to college is needed to capture meaningful within-group variability that may help inform how to best promote student well-being during this time.
As noted above, the transition to college is marked by fluctuations across numerous indices of adjustment (e.g., stress, sleep, depression), which are likely to influence one another. Despite this, limited research has examined these adjustment indices longitudinally across several college years, and no known research has examined these questions in predominantly Latino/a samples. Whereas extant work has documented challenges associated with the initial transition to college for Latino/a students (e.g., balancing multiple roles/responsibilities, financial obligations, worsened mental health; Katsiaficas et al., Reference Katsiaficas, Suárez-Orozco and Dias2015; Sánchez et al., Reference Sánchez, Esparza, Colón and Davis2010; Sasser et al., Reference Sasser, Waddell and Doane2023a), less work has followed Latino/a students through later college years to assess how aspects of well-being may change and co-occur over time. This is important, as previous work suggests significant ebbs and flows in psychological well-being throughout the college years (i.e., varying patterns of change; Bewick et al., Reference Bewick, Koutsopoulou, Miles, Slaa and Barkham2010). Further, experiences of stress, sleep problems, and depressive symptoms are dynamic and may fluctuate across the college years due to changing demands and responsibilities associated with different phases of college. Thus, longitudinal relations between college student health and well-being may be better understood through the examination of how within-person variation (e.g., “better” or “worse” stress, sleep, and depression, relative to a student’s typical levels) are reciprocally related to each other over time.
Stress, sleep, and depressive symptoms across the college years
The established bidirectional links between stress, sleep problems, and depressive symptoms in adolescence and young adulthood can be understood through the biopsychosocial model, in which biological (e.g., sleep phase delay, stress reactivity), psychological (i.e., rumination, worries), and social mechanisms (i.e., stress from peers/family) interact to determine health outcomes (Blake et al., Reference Blake, Trinder and Allen2018). In emerging adulthood, sleep is an integral factor that has been associated with psychosocial functioning, especially in college contexts (Lund et al., Reference Lund, Reider, Whiting and Prichard2010; Tavernier & Willoughby, Reference Tavernier and Willoughby2014). In this way, sleep has been considered a regulatory process that relates to an individual’s arousal, attention, and affect, such that changes in sleep are linked to developmental psychopathology (Dahl & Harvey, Reference Dahl and Harvey2007; Dahl, Reference Dahl1996). Further, disruptions in sleep have been associated with alterations in diurnal patterns of the hypothalamic-pituitary-adrenal axis and increased subsequent risk of depressive symptoms (Kuhlman et al., Reference Kuhlman, Chiang, Bower, Irwin, Seeman, McCreath and Fuligni2020). On the other hand, a large body of evidence suggests that affective states (e.g., stress, depressed mood) are also predictive of short (e.g., daily) and long-term (e.g., chronic) sleep disruptions (Dinis & Bragança Reference Dinis and Bragança2018; Kahn et al., Reference Kahn, Sheppes and Sadeh2013; Wallace et al., Reference Wallace, Boynton and Lytle2017), highlighting the bidirectional nature of these relations. Notably, both emotional and academic stress have been identified as key contributors to sleep problems in college students specifically (Lund et al., Reference Lund, Reider, Whiting and Prichard2010). Thus, the regulation of stress and sleep are both important to understanding prospective relations between these factors and mental health in college students.
Existing work investigating longitudinal reciprocal links between stress, sleep, and mental health in adolescence and young adulthood set the groundwork for the current study’s aims and hypotheses. For example, in a sample of high-school-aged adolescents (68% White), Kelly et al. (Reference Kelly, Zeringue and El-Sheikh2022) found evidence for reciprocal links between sleepiness and depression and anxiety, such that more severe symptoms of depression and anxiety at age 16 predicted greater sleepiness at age 17, which in turn predicted more severe symptoms at age 18. Moving into late adolescence, another study (54% European American) examined reciprocal relations between sleep, depression, and anxiety across the transition to college and found that higher depressive symptoms prior to the college transition were associated with increased subjective and objective sleep problems (e.g., sleep latency, start time variability, subjective problems) in the first semester of college, but not vice versa (Doane et al., Reference Doane, Gress-Smith and Breitenstein2015). Finally, in a longitudinal study of Canadian emerging adults attending university, authors observed bidirectional links between self-reported sleep quality and intrapersonal adjustment (i.e., depressive symptoms, stress, self-esteem), such that better sleep quality during the first year of university was linked with improved intrapersonal adjustment the next year, which in turn predicted better sleep quality the following year (Tavernier & Willoughby, Reference Tavernier and Willoughby2014). These findings provide compelling evidence that stress, sleep, and mental health are reciprocally related across adolescence and young adulthood. However, it is important to highlight (a) the existing gap in the literature examining these research questions among Latino/a samples, a largely represented ethnic/racial group in higher education (Hussar et al., Reference Hussar, Zhang, Hein, Wang, Roberts, Cui, Smith, Bullock Mann, Barmer and Dilig2020), (b) each of the studies above utilized standard cross-lagged panel models (CLPM), a popular method for examining bidirectional relationships, but one that has become increasingly criticized due to the conflation of within- and between-person processes, which may lead to erroneous conclusions driven by “trait-like” individual differences (Hamaker et al., Reference Hamaker, Kuiper and Grasman2015).
Emerging research has called for the need to disaggregate within- and between-person variance attribution when examining cross-lagged effects over time (Hamaker et al., Reference Hamaker, Kuiper and Grasman2015), to account for how deviations from an individual’s typical (i.e., trait-stable) levels in a variable relate to subsequent within-person deviations in other variables. Acknowledging that each year of college can bring new/differing demands that may result in changes in health and well-being (e.g., Bewick et al., Reference Bewick, Koutsopoulou, Miles, Slaa and Barkham2010), especially for Latino/a youth who often balance multiple experiences of stress (Sasser et al., Reference Sasser, Doane, Su and Grimm2023b), it is critical that developmental research examines how within-person fluctuations in adjustment are longitudinally related across time. For example, examining relations among within-person variations in stress, sleep, and depressive symptoms may offer insight into developmental timing of student adjustment across the transition to college, wherein a certain period of this transition may be particularly challenging for adolescents (Sasser et al., Reference Sasser, Waddell and Doane2023a; Shi et al., Reference Shi, Wang and Zhu2023). The separation of within- and between-person variance may also help clarify well-documented comorbidity among stress, sleep problems, and symptoms of depression, by uncovering whether reciprocal relations between these variables appear to be within-person or between-person driven (Waddell et al., Reference Waddell, Sternberg, Grimm and Chassin2021). Specifically, within a RI-CLPM framework, within-person estimates are particularly valuable for uncovering temporal patterns while controlling for unobserved individual differences (i.e., trait-stable levels of stress, depression, and sleep) that may confound between-person estimates within a traditional CLPM. These within-person insights can help detect if, within people, there is a certain time that they may be predisposed to a specific behavior in the future (e.g., periods of heightened stress preceding a period of more depressive symptoms than usual). This information can have meaningful implications for the timing of future prevention and intervention efforts (i.e., targeting students during specific windows across the transition to college).
Though no known study has examined within-person cross-lagged relations between stress, sleep, and depression across the college years, a previous study of two-year college students utilized a multilevel modeling approach and found that both episodic (i.e., within-person) and chronic (i.e., between-person) depression was linked with increased sleep problems (i.e., trouble falling asleep, hypersomnia), whereas chronic (i.e., between-person) stress was associated with hypersomnia only (Wallace et al., Reference Wallace, Boynton and Lytle2017). In addition, a 14-day daily diary study of first-year Canadian university students found that increases in sleep quality predicted lower levels of stress and negative affect the next day (i.e., daily/within-person effect), whereas significant correlations were observed between sleep, affect, and stress averaged across all days (i.e., between-person; Galambos et al., Reference Galambos, Dalton and Maggs2009). Collectively, these findings highlight the presence of within- and between-person relations among college student adjustment. However, additional longitudinal work is needed examining the directionality (i.e., developmental specificity) of within-person effects, a key strength of the random intercept cross-lagged panel model (Hamaker et al., Reference Hamaker, Kuiper and Grasman2015), which may help pinpoint whether there are specific periods during the college transition that require certain attention for intervention and developmental research.
The present study pulls from a sample of Latino/a youth transitioning to college (Doane et al., Reference Doane, Sladek, Breitenstein, Park, Castro and Kennedy2018) that has been previously examined in the literature, particularly through a longitudinal lens in culturally relevant domains such as discrimination (Castro et al., Reference Castro, Sasser, Sills and Doane2022; Gusman et al., Reference Gusman, Safa, Grimm and Doane2023), sociocultural contexts (Park et al., Reference Park, Sasser and Doane2021), ethnic racial identity (Sladek et al., Reference Sladek, Gusman and Doane2023), bicultural competence (Gusman et al., Reference Gusman, Safa, Grimm and Doane2023; Safa et al., Reference Safa, Gusman and Doane2022), and family and stress in relation to cultural neurobiological processes (Doane et al., Reference Doane, Sladek, Breitenstein, Park, Castro and Kennedy2018; Sasser et al., Reference Sasser, Doane, Su and Grimm2023b). This study is among the first to use data across the five-year study, spanning prior to college entry through participants’ senior year of college to examine longitudinal, reciprocal associations between sleep, stress, and depressive symptoms. Further, we focus on physical and mental health factors that are relevant across race/ethnicity, advancing the call to examine typical psychological domains among ethnic/racial minority youth, rather than fixating exclusively on cultural components (Causadias et al., Reference Causadias, Vitriol and Atkin2018).
Current study
Recognizing the increased proportion of Latino/a students entering higher education (Hussar et al., Reference Hussar, Zhang, Hein, Wang, Roberts, Cui, Smith, Bullock Mann, Barmer and Dilig2020), as well as observed alterations in stress, sleep, and depression during the college years (Doane et al., Reference Doane, Gress-Smith and Breitenstein2015; Kroshus et al., Reference Kroshus, Hawrilenko and Browning2021), the present study investigated longitudinal reciprocal associations between school/college stress, sleep problems, and depressive symptoms during Latino/a adolescents’ transition to and through college. Specifically, we examined adjustment indices beginning in spring of the senior year of high school and annually until spring of the fourth year of college (five-year span). Acknowledging that reciprocal relations are driven by sources of within-person variance (e.g., deviations around within-person mean) and between-person variance (e.g., deviations around sample mean), we utilized random intercept cross-lagged panel models (RI-CLPM) to disaggregate within- and between-person variance in these relations across time. Further, because stressors related to college-specific demands can have unique implications for student health and well-being (e.g., Arbona et al., Reference Arbona, Fan and Olvera2018), the present study examined school/college-specific stress (e.g., academic, social, financial), rather than general perceived stress. Based on previous work, we hypothesized that, at the between-person level (i.e., trait-stable levels across all time points), college stress, sleep problems, and depressive symptoms would be significantly positively related (Hypothesis 1). In addition, we predicted that there would be significant within-person cross-lagged (e.g., reciprocal) relations between college stress, sleep problems, and depressive symptoms over time (Hypothesis 2a). The only hypothesis with regards to developmental timing was that reciprocal relations between within-person fluctuations in adjustment would be particularly evident during the initial transition to college, such that within-person increases in stress, sleep problems, and depression in the first year of college would co-occur within this year, and would be prospectively related to second year adjustment (e.g., more stress than usual in the first year of college would be linked with more sleep problems and higher depressive symptoms than usual in the first and second year of college; Hypothesis 2b). No other specific hypotheses were made regarding the timing of cross-lagged effects, due to a lack of previous research examining these questions at the within-person level and across several years of college.
Method
Participants
In total, 209 Latino/a adolescents (M age = 18.10, SD = 0.41; 64.4% female) were recruited during the spring or summer of their senior year of high school prior to transitioning to a large public bachelor’s degree-granting university in the Southwestern United States. Participants were recruited via orientation sessions at the focal institution, e-mail, text messaging, and phone communication. Inclusion criteria required that participants: (a) were accepted to attend the focal university and submitted (or waived) a deposit, (b) were a current senior in high school (or recently graduated), (c) identified as Hispanic/Latino/a, and (d) lived within 60 miles of the focal institution during recruitment. Participants all identified as Hispanic/Latino/a, with the majority identifying as Mexican (85.1%), South or Central American (10.1%), Cuban (5.3%), and Other (4.3%). Regarding immigrant generation status, 10.6% of participants were first-generation immigrants (born outside the U.S.), 62.0% were second generation (born in the U.S. with at least one parent born outside of the U.S.), and 27.4% were third generation or greater (participant and both parents born in the U.S.). Parents’ average education level was diverse: 33.7% of parents had not obtained a high school diploma, 21.6% of parents had obtained a high school degree or GED, 24.2% had completed some college, 15.9% had obtained a bachelor’s degree, and 3.8% had completed above a bachelor’s degree (e.g., graduate education). The current study utilized five time points, each which took place during spring/summer, approximately one-year apart: senior year of high school (T1; 2017; N = 209), first year of college (T3; 2018; N = 196), second year of college (T5; 2019; N = 178), third year of college (T7; 2020; N = 192), and fourth year of college (T8; 2021; N = 162). Participants who had valid questionnaire data (and were attending college) for at least two of the four college time points were included in subsequent analyses (N = 181).
Procedure
The Institutional Review Board at Arizona State University approved all study procedures prior to beginning data collection. Informed consent and assent (for participants below the age of 18 at the start of the study) were obtained from participants and their parents in their preferred languages (e.g., English or Spanish). At each time point, participants completed an online questionnaire, which included measures of demographic information, stress experiences, sleep behaviors, and psychological well-being. At T8, additional measures were included to assess the impact of the Coronavirus disease (COVID-19). Upon completing the survey, participants were financially compensated for their time.
Measures
School/College stress
The 18-item College Stress Scale (CSS; Rodriguez et al., Reference Rodriguez, Myers, Morris and Cardoza2000) was used to assess general school/college stress. At each time point, participants were asked to rate how stressful certain experiences had been since the beginning of the semester using a 5-point scale ranging from 1 (does not apply) to 5 (extremely stressful). The CSS was composed of three dimensions: seven items assessing academic stress (e.g., “Taking exams,” “Handling your school/academic workload”), six items measuring social stress (e.g., “Balancing your social and school/academic commitments,” “Handling personal relationships”), and five items assessing financial stress (e.g., “Paying for bills and living expenses”; “Paying for food”). At T1, items that were less applicable for high school students were adapted (e.g., “paying for tuition and student fees” was re-worded to “paying for sport, club and extracurricular activity fees,” “academic workload” was re-worded to “school workload”). Items within each subscale were averaged to create a score for the three stress dimensions, which were averaged to create an overall measure of school/college stressFootnote 2 , with higher scores indicating greater levels of stress. Internal consistencies were excellent across all time points (T1α = .87, T3α = .90, T5α = .93, T7α = .95, T8α = .91) The CCS was developed and validated in a sample of Latino college students (Rodriguez et al., Reference Rodriguez, Myers, Morris and Cardoza2000) and has since been used in other Hispanic college student samples (e.g., Arbona et al., Reference Arbona, Fan and Olvera2018).
Sleep problems
Sleep problems were assessed using the Pittsburgh Sleep Quality Index (PSQI; Buysse et al., Reference Buysse, Reynolds, Monk, Berman and Kupfer1989). The PSQI is a 19-item scale that assesses subjective sleep quality and disturbances over the past month. The PSQI is composed of seven sleep component scores: sleep duration, sleep quality, sleep disturbance, sleep latency, habitual sleep efficiency, daytime dysfunction, and the use of sleep medication. At each time point, participants responded to open-ended items (i.e., “During the past month, how many hours of actual sleep did you get at night?”) as well as items on a four-point Likert scale ranging from “0” (not during the past month) to “3” (three or more times a week). Example items included “During the past month, how often have you had trouble sleeping because you cannot get to sleep within 30 min” and “During the past month, how often have you had trouble staying awake while driving, eating meals, or engaging in social activity?”. Scores were summed across each of the seven sleep components to yield a global sleep problems score, with a possible range of 0–21. Higher scores were indicative of more severe sleep problems. Across time points, the percentage of participants who met criteria for clinical sleep problems (scores>5; Buysse et al., Reference Buysse, Reynolds, Monk, Berman and Kupfer1989) was as follows: 53.9% (T1), 47.5% (T3), 51.5% (T5), 49.2% (T7), and 55.8% (T8). The PSQI has demonstrated reliability in samples of Latino/a college students (e.g., Pichardo et al., Reference Pichardo, Molina, Rosas, Marbella and Sanchez-Johnsen2021).
Depressive symptoms
Depressive symptoms were assessed using the 20-item Center for Epidemiological Studies Depression Scale (CES-D; Radloff, Reference Radloff1977). At each time point, participants were asked to indicate the severity of depressive symptoms over the past week on a four-point Likert scale ranging 0 (rarely or none of the time (less than 1 day)) to 3 (most or all of the time (5–7 days)). Example items were “I felt depressed” and “I had crying spells.” The four positively worded items (e.g., “I was happy”) were reverse coded prior to calculating an average CES-D score. Average scores, rather than sum scores, were used to account for potential item missingness. Scores ranged from 0 to 4, with higher scores indicating higher severity of depressive symptoms. Sum scores were also calculated for the purpose of reporting established CES-D clinical cutoffs: normal (<16), mild (16–22), and moderate to severe (>22) symptoms (Roberts et al., Reference Roberts, Andrews, Lewinsohn and Hops1990). The percentage of the sample that met criteria for mild or moderate to severe symptoms (≥16) at each time point were as follows: 46.9% (T1), 45.5% (T3), 47.6% (T5), 49.4% (T7), and 52.0% (T8). Internal consistencies were good across all five time points (T1α = .89, T3α = .91, T5α = .92, T7α = .92, T8α = .93). The CES-D has been validated and used among Hispanic college students (Arbona et al., Reference Arbona, Burridge and Olvera2017). Sensitivity analyses were conducted removing the CES-D item that asked about sleep (“My sleep was restless”) and results stayed consistent. Thus, the original 20-item CES-D scale is reported for the primary analysis.
Covariates
Several variables were examined as potential covariates, including participant sex (0 = female, 1 = male), average parent education level, immigrant generation status, and living situation (i.e., 0 = lived at home with parents/relatives during all college time points, 1 = lived away from home during all college time points). Additionally, because the final two time points were collected near the beginning of (T7) and during the COVID-19 pandemic (T8), two additional covariates were included to account for the impact of the pandemic on student adjustment. First, a binary dummy variable was created to indicate whether participants completed the T7 questionnaire before or after March 11th, 2020 (i.e., the date that the World Health Organization declared COVID-19 a national pandemic; the date that the focal institution announced the transition to remote/online learning; 0 = participated before March 11th, 1 = participated after March 11th). Second, negative impact of the pandemic was measured using the average of three items from the COVID-19 Impact Survey (National Alzheimer’s Coordinating Center, 2020), assessed at T8. Items were “how worried are you that you will get COVID-19 (or, if previously infected, worried that you will get it again)?,” “how isolated or cut off from family and friends are you feeling due to COVID-19?,” and “how disruptive has the COVID-19 pandemic been to your everyday life?”. Item responses ranged from 1 (Not at all) to 5 (Extremely) and average scores were calculated, with higher scores indicating a more negative COVID-19 impact.
Data analytic plan
First, preliminary analyses were conducted using latent growth curve modeling to examine trajectories of school/college stress, sleep problems, and depressive symptoms across the study waves. Specifically, separate growth models were fit for each study variable, which included a latent intercept (i.e., mean levels at T1/high school), linear slope factor (i.e., linear growth or rate of change), and quadratic slope factor (i.e., quadratic rate of change). Previous studies utilizing RI-CLPM have implemented similar preliminary steps to delineate trajectories of study variables over time (e.g., Zhou et al., Reference Zhou, Cao, Liu, Wu, Liang, Xu, Meng, Zang, Hao, An, Ma, Fang and Zhang2020).
To test the primary study hypotheses, a RI-CLPM was fit in Mplus version 8.0 (Muthén & Muthén Reference Muthén and Muthén1998–2017) to examine within-person autoregressive and reciprocal associations between school/college stress, sleep problems, and depressive symptoms. Maximum likelihood estimation with robust standard errors were estimated and Full Information Maximum Likelihood was used to account for data missingness (Little’s MCAR test indicated data were missing completely at random, p > .05; Little, Reference Little1988). In comparison to the standard cross-lagged panel model (CLPM), the RI-CLPM includes a random intercept to account for between-person (i.e., trait-stable) variance, thus disentangling between- and within-person processes (Hamaker et al., Reference Hamaker, Kuiper and Grasman2015). Specifically, the RI-CLPM examines how within-person deviations (i.e., compared to one’s typical levels) in one variable relates to within-person deviations in one or more other variables, while simultaneously estimating how the random intercepts (i.e., trait-like differences) relate to one another, and thus still capture between-person associations over the study period. Covariates were included in the model as predictors of the random intercepts. Within-person parameters in the RI-CLPM were allowed to freely covary at each time point (i.e., concurrent, yearly relations), and the random intercepts (e.g., stress, sleep problems, depressive symptoms) were also allowed to freely covary (i.e., “trait-like” or between-person relations). Because the current study expected there to be developmentally specific within-person effects, we opted not to constrain cross-lagged effects to be equal across time. Model fit was assessed using published criteria: RMSEA values near or below .06, CFI/TLI values near or above .95, and SRMR values below .08 were considered acceptable model fit (Hu & Bentler, 1999). Nonsignificant covariates were trimmed from the final model. Lastly, in the event of potential mediation, indirect effects were tested using the product of coefficient method (MacKinnon et al., Reference MacKinnon, Lockwood, Hoffman, West and Sheets2002).
Results
Descriptive statistics and bivariate correlations
Descriptive statistics and bivariate correlations are presented in Table 1. In general, school/college stress, sleep problems, and depressive symptoms were correlated within and across study waves. Over time, correlations among sleep problems ranged from r = .32 to r = .52, ps < .001, correlations among school/stress ranged from r = .41 to r = .65, ps < .001, and correlations among depressive symptoms ranged from r = .34 to r = .66, ps < .001.
Bivariate correlations and descriptive statistics

Note. N = 181. T1: Spring/Summer 2017; T3: Spring/Summer 2018; T5: Spring/Summer 2019; T7: Spring/Summer 2020; T8: Spring/Summer 2021; Sex: 1 = male, 0 = female; Immigrant generation: 0 = participant, parents, and both sets of grandparents born outside U.S., 7 = all were born in U.S.; Parent education: 1 = completed less than high school, 10 = graduate degree; Living situation: 1 = living away from home in university dorms or apartment, 0 = living at home with parents or other relatives; T7 COVID-19 Timing: 0 = participated before March 11th, 2020, 1 = participated after March 11th, 2020.
† p < .10, *p < .05, **p < .01, ***p < .001.
Preliminary analyses: trajectories of stress, sleep, and depressive symptoms
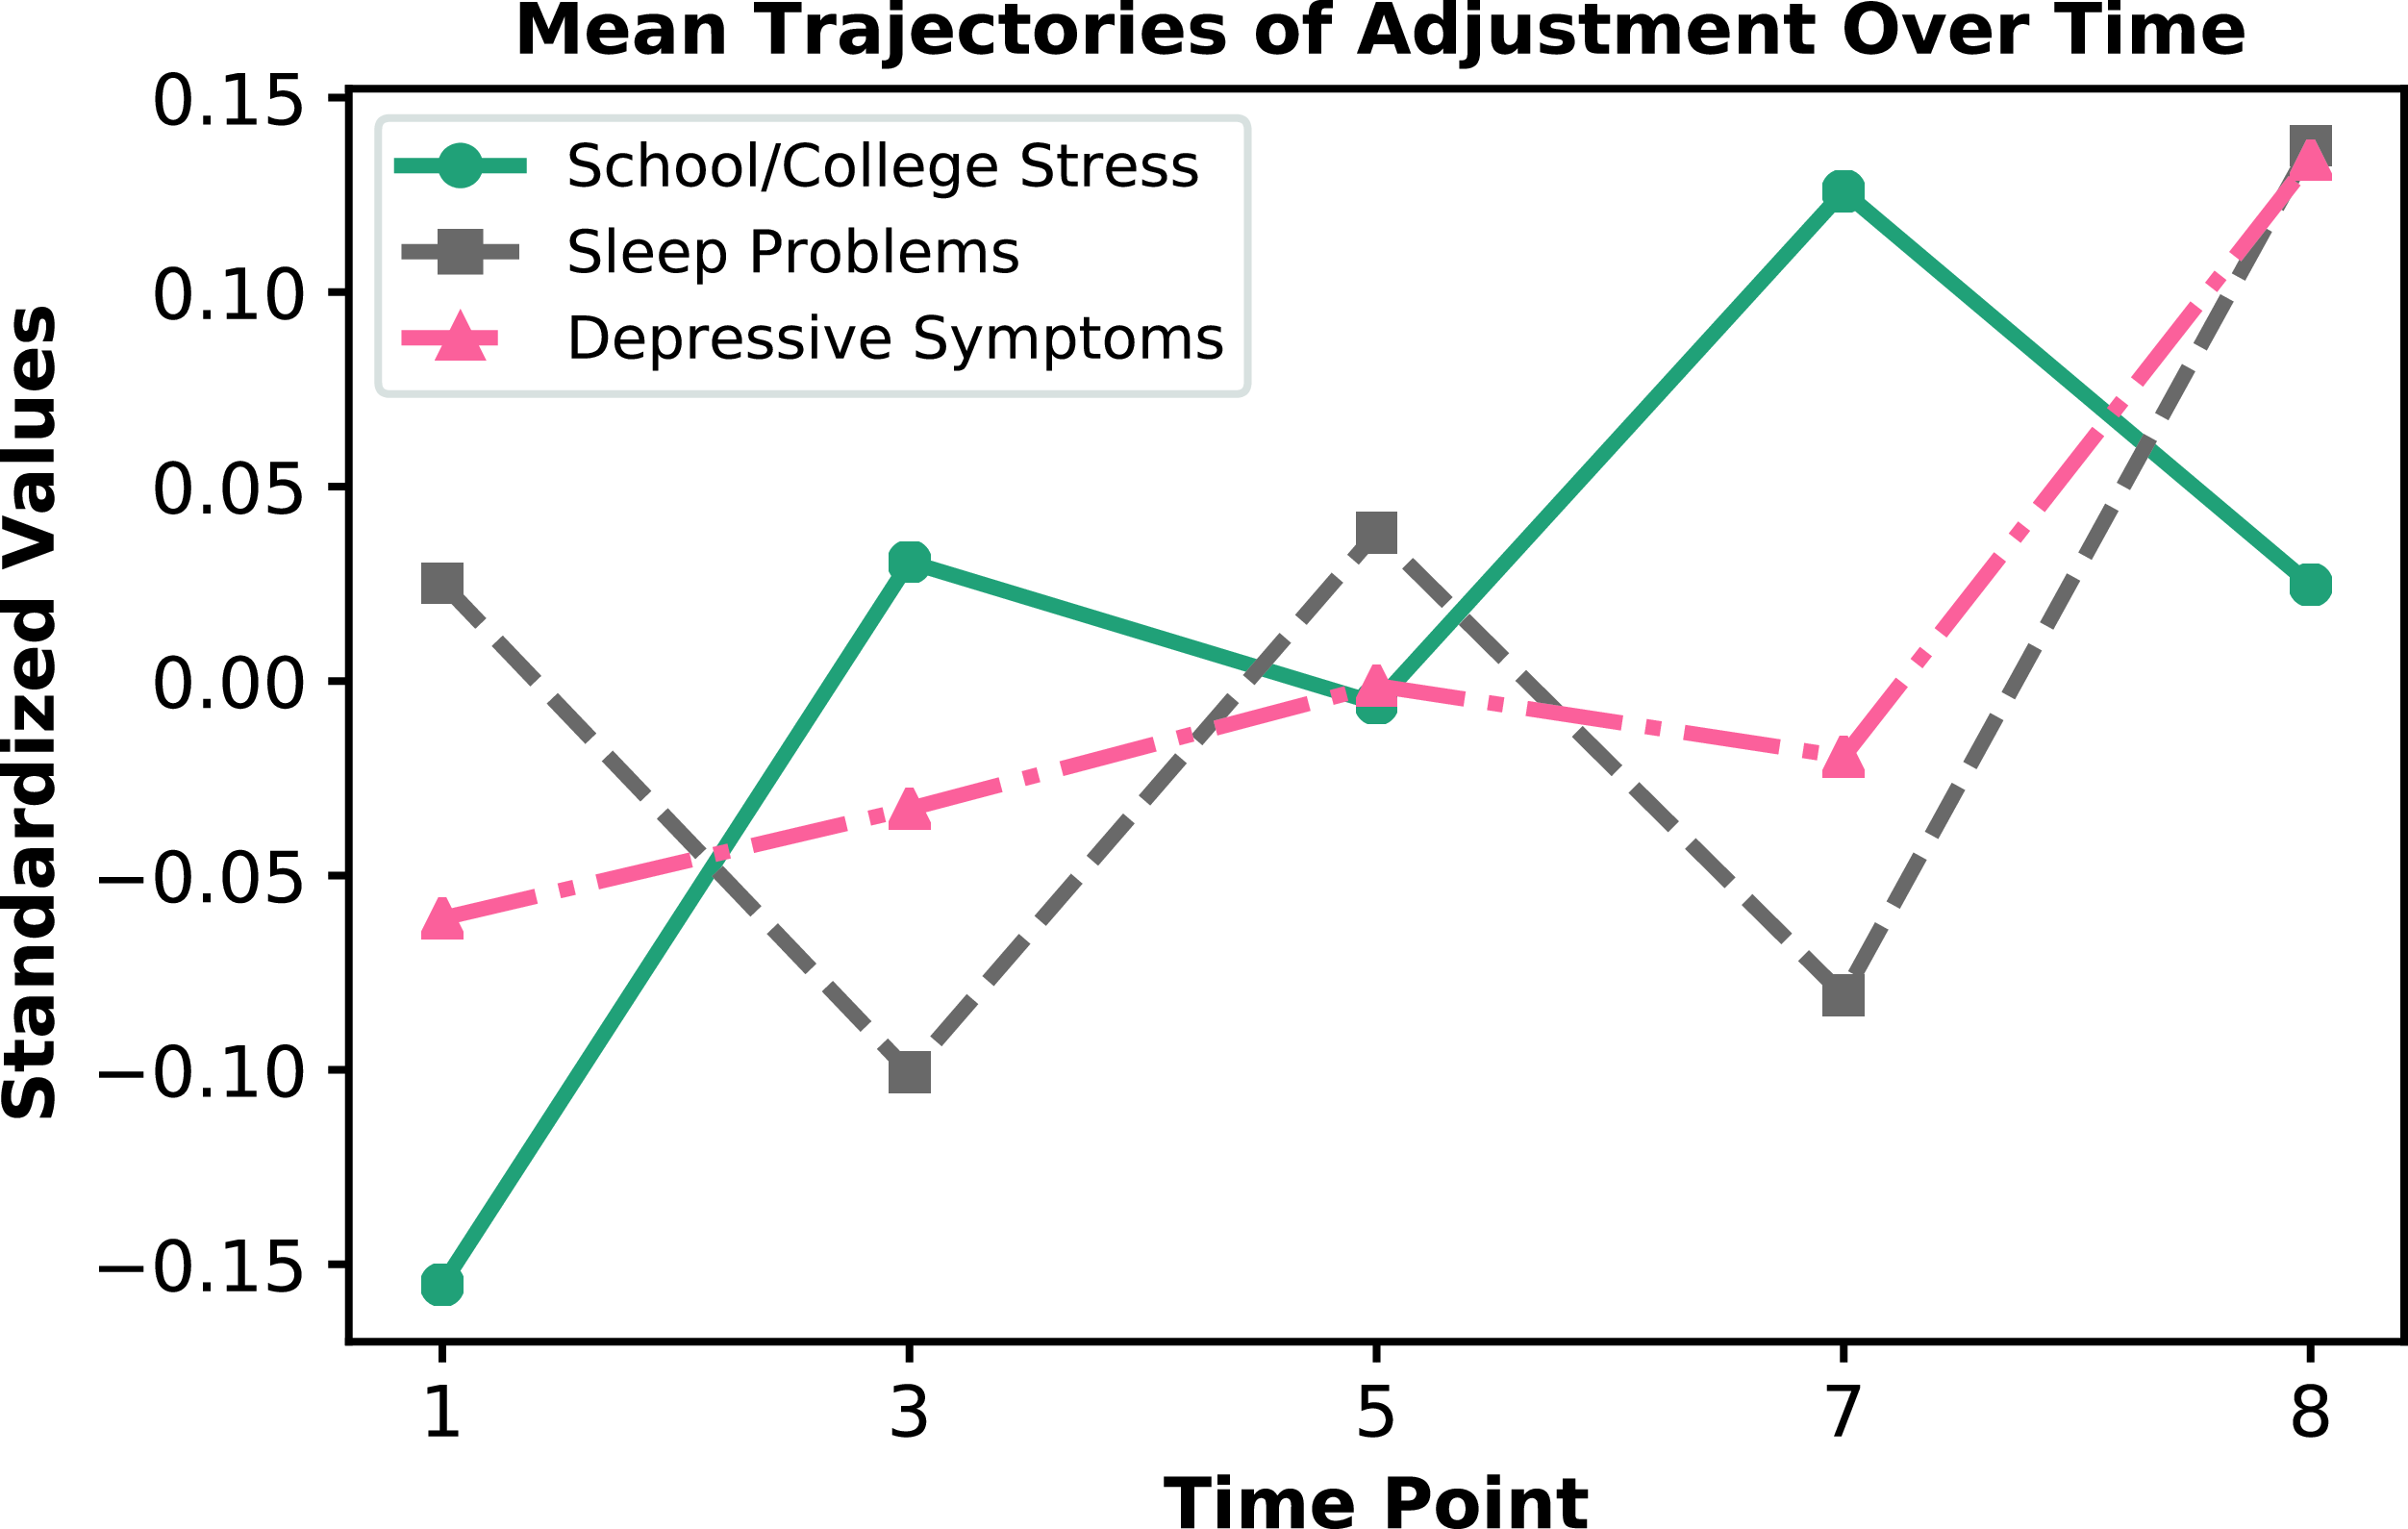
To examine developmental trajectories of school/college stress, sleep problems, and depressive symptoms across the study span, a series of latent growth curve models were estimated (see Fig. 1 for plotted mean trajectories over time). The quadratic growth model for sleep problems demonstrated adequate model fit: X 2 (6) = 11.87, p = .06, RMSEA = .07, CFI = .97, SRMR = .03. The initial starting point of sleep problems (i.e., in high school) was estimated to be 6.06 (SE = .20, p < .001) and was significantly different than zero. There was significant variability in the intercept (Est = 3.79, SE = 1.19, p < .001), such that there were individual differences in scores on the PSQI at T1. The mean of the linear slope (Est = -.29, SE = .19, p = .13) and the quadratic slope factor (Est = .09, SE = .05, p = .08) for sleep problems were not significantly different from zero, indicating that there was no overall linear or nonlinear change in sleep problems across the study. The linear and quadratic slopes did not significantly vary (Linear: Est = .78, SE = 1.0, p = .45; Quadratic: Est = .07, SE = .06, p = .24), suggesting that individuals changed over time at similar rates.
Average growth trajectories of school/college stress, sleep problems, and depressive symptoms over the study span. Note. Adjustment indices were standardized for visualization purposes. Time point: 1 = senior year of high school, 3 = first year of college, 5 = second year of college, 7 = third year of college, 8 = fourth year of college.
The quadratic growth model for depressive symptoms fit the data well: X 2 (6) = 7.62, p = .27, RMSEA = .04, CFI = .99, SRMR = .03. The estimated intercept of depressive symptoms was significantly different from zero (Est = .85, SE = .04, p < .001) and there was significant variability in the intercept (Est = .09, SE = .04, p = .027), such that individuals had significantly different levels of depressive symptoms at T1. The estimated mean linear slope (Est = .001, SE = .04, p = .97) and quadratic slope factor (Est = .004, SE = .01, p = .63) for depressive symptoms were both nonsignificant, suggesting no overall linear or quadratic growth over time. Slopes did not significantly vary (Linear: Est = .02, SE = .04, p = .58; Quadratic: Est = .001, SE = .00, p = .78), suggesting a similar rate of change over time across individuals.
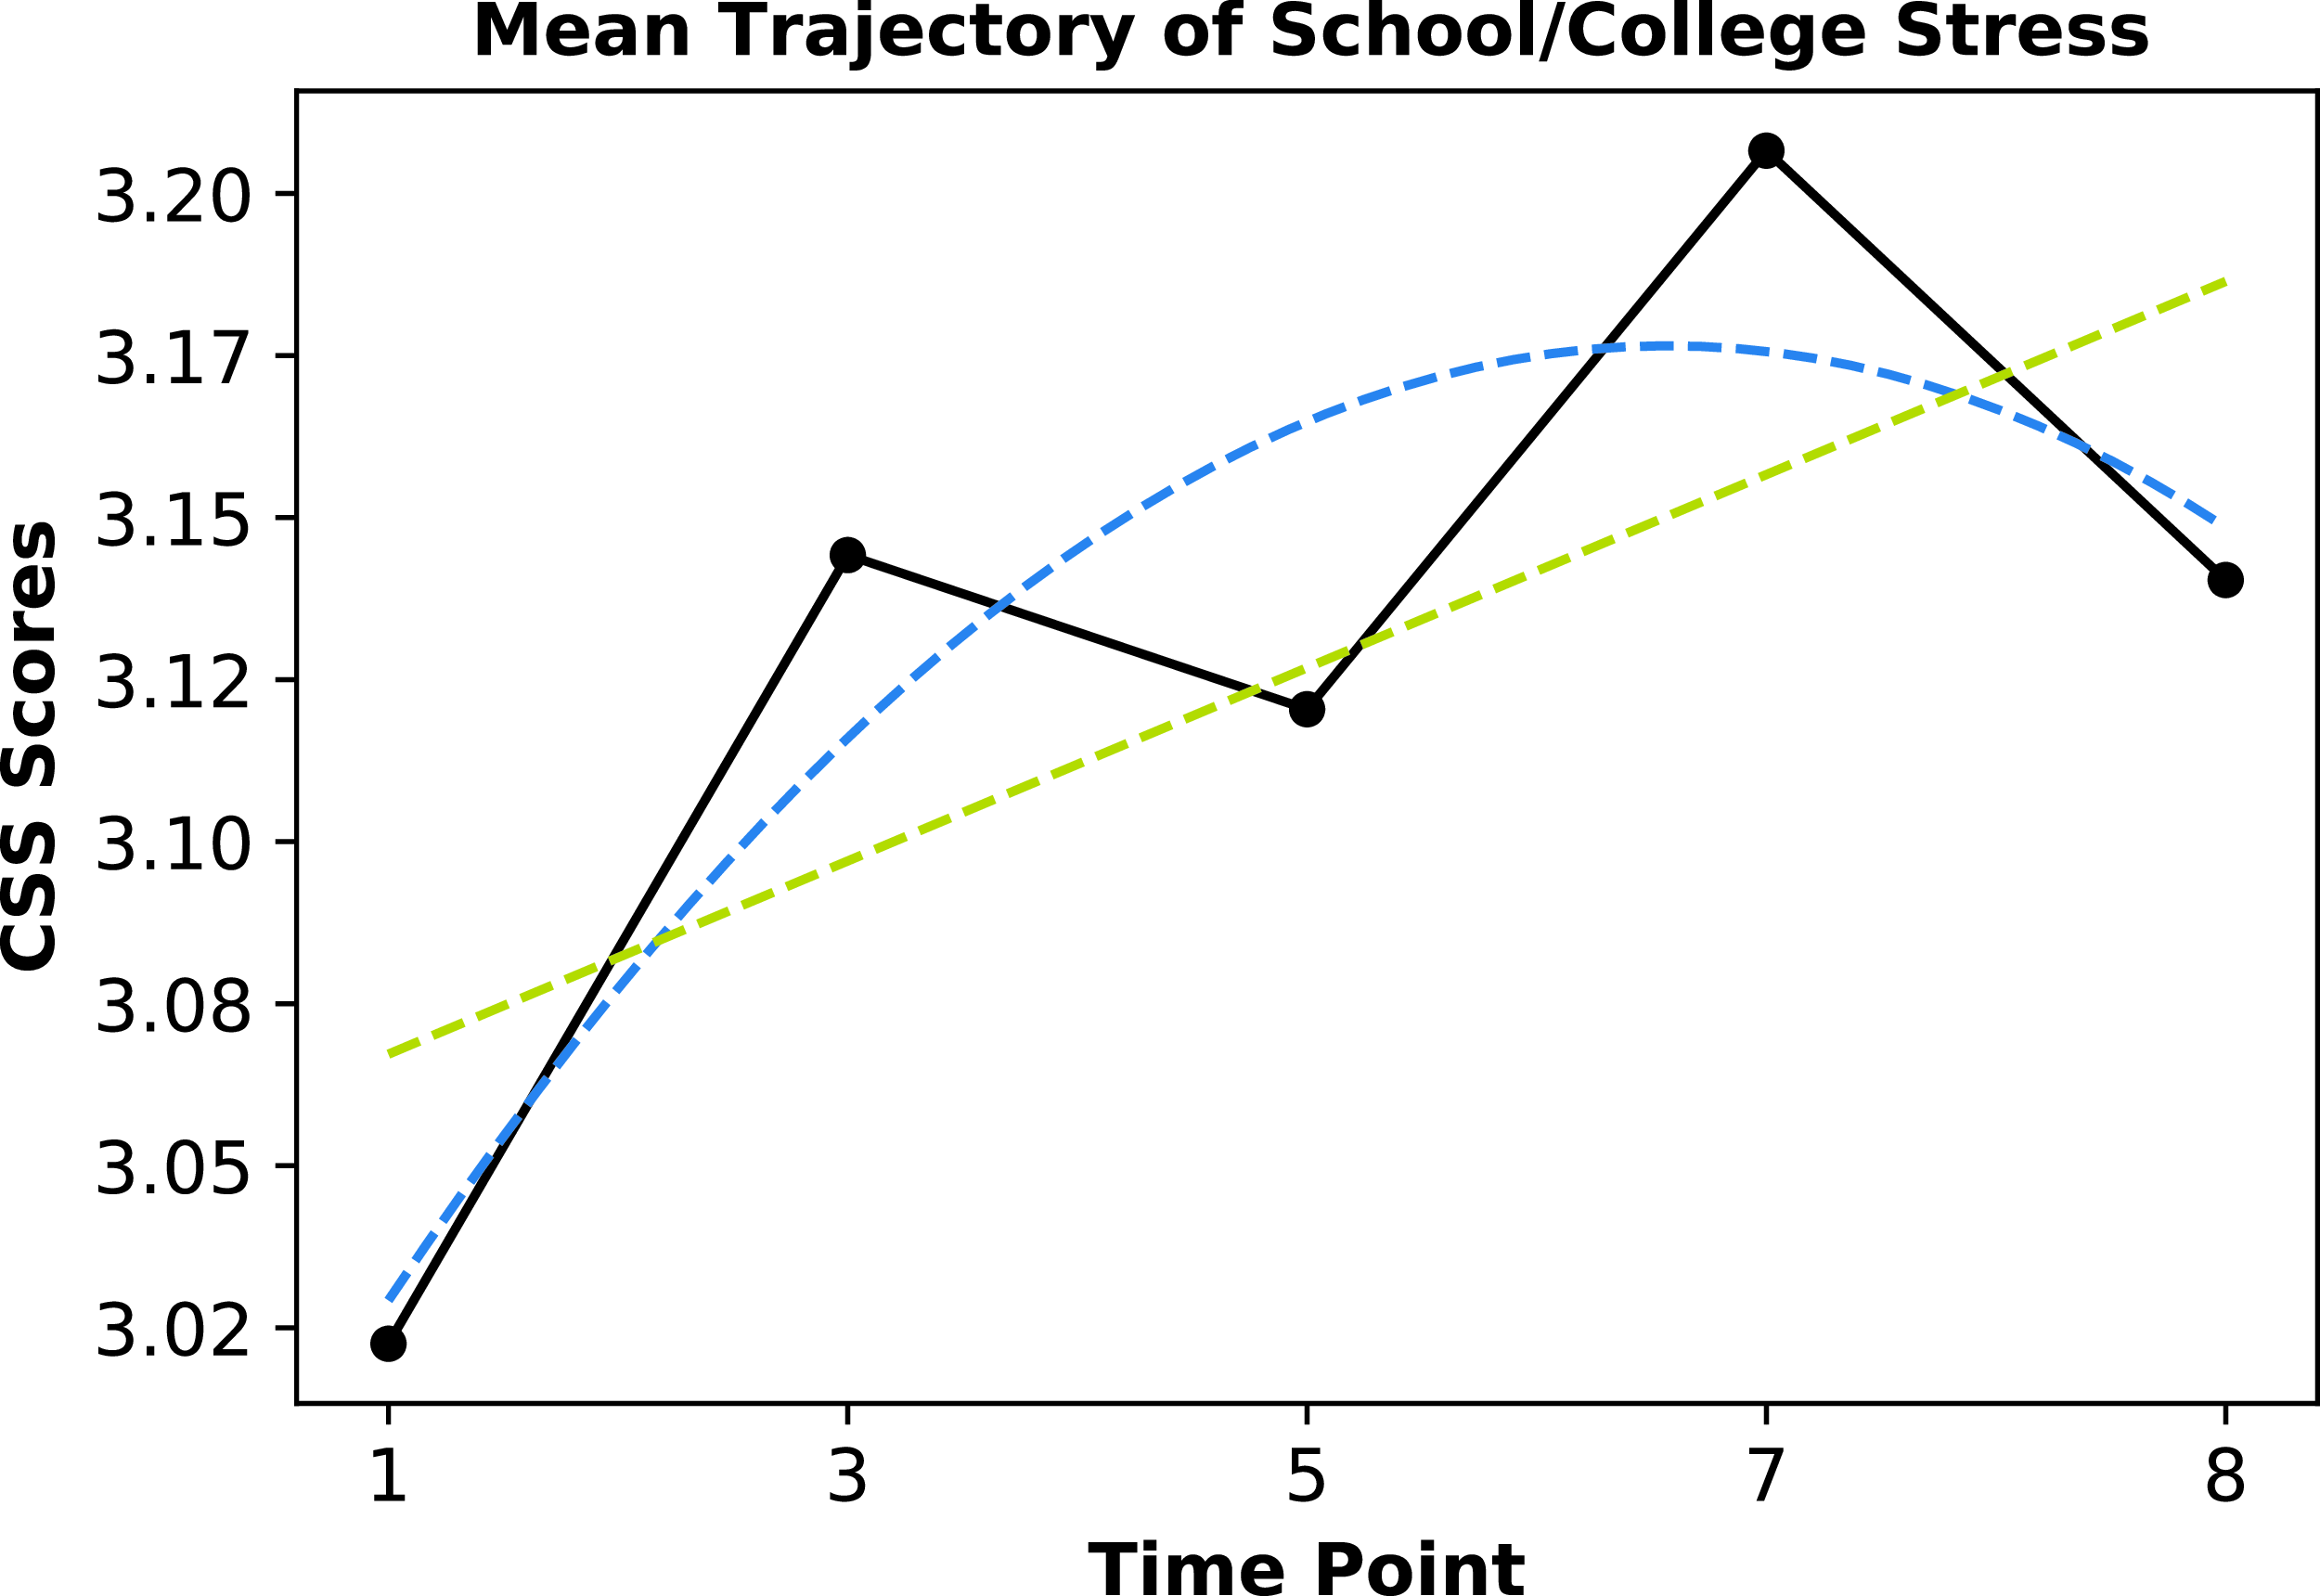
Lastly, the quadratic growth model for school/college stress demonstrated a good fit to the data: X 2 (6) = 6.78, p = .34, RMSEA = .03, CFI = .997, SRMR = .05. The mean estimate of school stress in high school was significantly different from zero (Est = 3.03, SE = .05, p < .001) and there was variability in the intercept (Est = .26, SE = .06, p < .001), such that there were individual differences in school stress levels at T1. Further, the estimated linear slope (Est = .11, SE = .04, p = .007) and quadratic slope factor (Est = -.02, SE = .01, p = .038) were both statistically significant, suggesting a curvilinear trend in school/college stress levels across the five time points (see Fig. 2). The linear and quadratic slopes did not significantly vary (Est = .08, SE = .05, p = .091; Est = .003, SE = .00, p = .31, respectively), suggesting that growth trends tended to look similar over time across individuals.
Average growth trajectory of school/college stress scores over the study span. Note. CSS: College Stress Scale. Time point: 1 = senior year of high school, 3 = first year of college, 5 = second year of college, 7 = third year of college, 8 = fourth year of college. Linear and quadratic fits are shown in green and blue, respectively.
Random intercept cross-lagged panel model (RI-CLPM)
First, to determine the extent of within-person variability across time points, intraclass correlations were calculated for each of the study variables. Intraclass correlation coefficients were as follows: .51 (school/college stress), .42 (sleep problems), and .50 (depressive symptoms). This indicates that between 42 and 51% of the variance in these variables could be attributed to between-person (i.e., trait-like) differences, leaving 49 to 58% of the variance attributable to within-person differences across time, rendering the RI-CLPM a suitable approach to parse out within- and between-person sources of variance. The resulting RI-CLPM fit the data well (X 2 (84) = 88.52, p = .35, RMSEA = .017, CFI = 1.00, SRMR = .05; Fig. 3). Full results for this model can be found in the Supplemental Materials, Table S1.
RI-CLPM disaggregating between- and within-person effects in reciprocal relations between school/college stress, sleep problems, and depressive symptoms. Notes. Paths drawn between time points (T1-T8) indicate deviations in the construct of interest relative to the individuals’ average levels across the study (i.e., higher than usual stress at T1 predicting higher than usual stress at T3). Standardized estimates are shown in the figure. Grey lines from random intercepts are all p < .001. Dashed lines indicate p-values less than .10 but greater than .05. † p < .10, *p < .05, ** p < .01, *** p < .001.

Random intercept (between-person) findings
The random intercepts for school/college stress, sleep problems, and depressive symptoms had significant factor variances across all five time points (see Fig. 3). The random intercept of depressive symptoms was significantly positively correlated with random intercepts of school/college stress and sleep problems, indicating that higher person-level depressive symptoms was associated with higher person-level school/college stress and sleep problems (i.e., between-person relations). The random intercepts of school/college stress and sleep problems were not significantly related to one another. Regarding covariate effects, participant sex was significantly associated with all three random intercepts, such that males reported lower person-level school/college stress, less sleep problems, and lower depressive symptoms. Parent education was significantly related to school/college stress, such that participants whose parents obtained more education (i.e., higher average parent education) reported lower overall school/college stress levels. Lastly, negative impact of COVID-19 was significantly related to all three random intercepts, such that a more negative impact (due to the pandemic) was associated with higher person-level school/college stress, more sleep problems, and higher depressive symptoms.
Cross-lagged (within-person) findings
Concurrent associations
There were several concurrent, or yearly relations between within-person deviations in stress, sleep, and depression across time (see Fig. 3). Notably, within-person increases in depressive symptoms were associated with within-person increases in both school/college stress and sleep problems at all five time points. In other words, during years that students reported more depressive symptoms than usual (i.e., relative to their trait-stable levels), they also reported greater school/college stress and more sleep problems than what was typical for them. Within-person deviations in college stress and sleep problems were correlated within students’ first and third year of college, such that experiencing more stress than usual during the first and third year of college was linked with more sleep problems than usual during the same year.
Prospective associations
Within-person cross-lagged relations between stress, sleep problems, and depressive symptoms are shown in Fig. 3 and Table S1. There were a few significant autoregressive paths observed across time. Specifically, students who reported higher school stress during the senior year of high school, relative to their typical levels across the study, also reported higher college stress than usual during the first year of college. Further, adolescents who reported more sleep problems than usual in the first year of college went on to report more sleep problems than usual during their second year of college. Lastly, students who experienced more depressive symptoms than usual in the second year of college also reported higher depressive symptoms than what was typical for them in the third year of college.
In addition, there were several significant within-person cross-lagged paths. A within-person increase in stress during the first year of college predicted a within-person increase in sleep problems during the second year of college (i.e., students who experienced greater stress during the first year of college, relative to their typical levels across the study, went on to report more sleep problems than usual the next year). The reverse path was also significant, such that adolescents who experienced more sleep problems than usual in their first year of college went on to report higher stress levels than usual in the second year of college. These standardized cross-lagged regression parameters were comparable in effect size, with the effect of sleep problems on college stress only slightly larger than the reverse path (i.e., .260 vs. .226). Further, students who reported higher depressive symptoms than usual in their second year of college went on to report higher stress levels in their third year, which in turn predicted higher-than-usual depressive symptoms in their fourth year of college. However, the indirect effect of second year depressive symptoms on fourth year depressive symptoms through third year college stress was not statistically significant (b = .07, SE = .05, 95% CI = [−.004, .185]). Lastly, a within-person increase in sleep problems during the third year of college predicted a within-person increase in college stress during the fourth year of college (i.e., more sleep problems than usual during the third year predicted more stress than usual in the fourth year of college). Full results for the RI-CLPM, including nonsignificant paths, are presented in Fig. 3 and Table S1.
Discussion
Bidirectional associations exist between stress, sleep, and mental health (Kahn et al., Reference Kahn, Sheppes and Sadeh2013) and may be particularly evident during a major sociocultural shift such as the transition to and through college (Doane et al., Reference Doane, Gress-Smith and Breitenstein2015; Tavernier & Willoughby, Reference Tavernier and Willoughby2014). Whereas a large body of evidence has demonstrated reciprocal links between adjustment indices in adolescence and young adulthood, the current study extended this literature by examining these associations in a sample of Latino/a college students, a group that is becoming increasingly represented in higher education settings (de Brey et al., Reference de Brey, Musu, McFarland, Wilkinson-Flicker, Diliberti, Zhang, Branstetter and Wang2019). Further, this study employed a RI-CLPM to partition between-person (i.e., trait-like) differences from within-person reciprocal processes over time (Hamaker et al., Reference Hamaker, Kuiper and Grasman2015). Our findings revealed significant within- and between-person relations among stress, sleep, and depressive symptoms during Latino/a students’ transition to and through college. Specifically, overall (i.e., trait-like) levels of depressive symptoms were related to trait-like school/college stress and sleep problems, whereas overall school/college stress and sleep problems were not related. Within-person fluctuations in adjustment indices tended to co-occur within study years. In addition, there were longitudinal, within-person reciprocal links between college stress and sleep problems across the first two years of college, wherein greater stress than usual during the first year predicted more sleep problems than usual during the second year of college, and vice versa (i.e., more sleep problems than usual predicted increased college stress the next year). Further, within-person increases in depressive symptoms during students’ second year of college predicted increased college stress in the third year of college, which predicted increased depressive symptoms in the fourth year of college. Finally, more sleep problems than usual during the third year of college predicted higher college stress during the fourth year of college. These findings provide evidence for within-person cross-lagged relations among stress, sleep, and depression, while controlling for trait-like differences at the between-person level.
Developmental trajectories of adjustment over time
Latent growth curve modeling revealed a nonlinear trend in school/college stress across the study; in contrast, depressive symptoms and sleep problems followed more dynamic patterns (i.e., not characterized by linear or nonlinear growth). The finding that adjustment indices tended to fluctuate, at the mean-level, over time is consistent with previous studies identifying ebbs and flows in college student adjustment (e.g., psychological distress, depressive symptoms, sleep quality), rather than linear growth in these processes (Bewick et al., Reference Bewick, Koutsopoulou, Miles, Slaa and Barkham2010; Galambos et al., Reference Galambos, Vargas Lascano, Howard and Maggs2013; Sasser et al., Reference Sasser, Waddell and Doane2023a). In addition, findings highlight developmental trends in school-specific stress over time, with an inversed U-shape pattern that is positive and linear up until T7 (i.e., third year of college), where stress begins to dip down. Future research should expand on this work by investigating academic, social, and contextual factors that contribute to these developmental trajectories. Collectively, these trends set the groundwork for the examination of within- and between-person differences in stress, sleep, and depressive symptoms, as well as their interrelations, across the college years.
Between-person relations in adjustment
Findings from the RI-CLPM revealed significant relations among between-person, or “trait-like” levels of school/college stress, sleep problems, and depressive symptoms over time. Specifically, as expected, higher trait-stable depressive symptoms were related to higher trait-stable school/college stress and sleep problems. These findings mirror a large body of research that has identified chronic stress and sleep problems as key correlates of depressive symptoms in adolescence and young adulthood (Dinis & Bragança, Reference Dinis and Bragança2018; Kahn et al., Reference Kahn, Sheppes and Sadeh2013; Lovell et al., Reference Lovell, Nash, Sharman and Lane2015). Further, our results are similar to previous work that utilized multilevel modeling and found negative between-person links between depressive symptoms and sleep quality and duration in adolescence and young adulthood (Waddell & Sasser, Reference Waddell and Sasser2022; Wallace et al., Reference Wallace, Boynton and Lytle2017). However, despite our expectations, trait-stable school/college stress and sleep problems were not significantly related at the between-person level. Though surprising, this may be explained, in part, by the several concurrent and longitudinal within-person associations observed between college stress and sleep problems in the current study (discussed in detail below), which may suggest that the connection between stress and sleep is highly within-person driven (i.e., context and time dependent) during the college years. Indeed, these findings highlight the importance of disaggregating within- and between-person differences in adjustment over time, to better isolate within-person reciprocal processes, while controlling for between-person, trait-like individual differences among students. Such information suggests that for relations between stress and sleep, we need to focus on the timing and context, whereas for depressive symptoms, stress, and sleep, we need to focus on the “for whom” and chronic links between these health factors.
Within-person reciprocal relations
Concurrent associations
Several concurrent (yearly) relations were observed between within-person deviations in adjustment indices. Specifically, within-person increases in school/college stress and sleep problems co-occurred with increases in depressive symptoms at each time point. In other words, higher stress and greater sleep problems than usual for a student, during a particular year, were linked with more severe depressive symptoms that same year. Concurrent, within-person relations between college stress and sleep problems were more varied, such that higher stress and more sleep problems than usual co-occurred in the first and third years of college only. In general, these findings align with previous work that found college students reported greater sleep disturbances on occasions that they perceived higher stress (Galambos et al., Reference Galambos, Vargas Lascano, Howard and Maggs2013), and complement existing evidence documenting the co-occurrence between stress, sleep problems, and depressive symptoms in young adulthood (Buysse et al., Reference Buysse, Angst, Gamma, Ajdacic, Eich and Rössler2008; Doane et al., Reference Doane, Gress-Smith and Breitenstein2015; Ramón-Arbués et al., Reference Ramón-Arbués, Gea-Caballero, Granada-López, Juárez-Vela, Pellicer-García and Antón-Solanas2020).
Prospective associations
In addition, we also found significant within-person cross-lagged effects between adjustment indices over time. Perhaps one of the most interesting findings was the reciprocal relation between college stress and sleep problems across the first and second year of college. These findings indicated that within-person increases in college stress and sleep problems (i.e., more stress and more sleep problems than usual) not only co-occurred within the first year of college, but were also prospectively related to within-person increases in sleep problems and college stress, respectively, the following year. Notably, effect sizes of these cross-lagged paths were comparable in size, suggesting that this was a rather symmetric reciprocal relation, rather than stress or sleep having a causally dominant influence on the other (e.g., Hamaker et al., Reference Hamaker, Kuiper and Grasman2015). These findings align with research highlighting the bidirectional nature of stress and sleep (Kahn et al., Reference Kahn, Sheppes and Sadeh2013), as well as results from a similar study design that observed bidirectional associations between adjustment (i.e., stress, depressive symptoms, self-esteem) and self-reported sleep quality across the first three years of college (Tavernier & Willoughby, Reference Tavernier and Willoughby2014). Further, there was also a positive, within-person relation between sleep problems and college stress across the third and fourth year of college. These findings provide evidence that sleep problems may serve as a contributor to subsequent increases in college stress, namely during the second half of college. When taking into consideration the onset of the COVID-19 pandemic, another interpretation is that greater sleep problems than usual near the beginning/prior to the peak of COVID-19 (T7) was predictive of more frequent/severe college stress in the midst of the pandemic (T8). The latter interpretation aligns with previous work linking reduced sleep quality with greater stress perceptions in college students during the pandemic (David et al., Reference David, Vieira, de Lima Leôncio, dos Santos Neves, Bezerra, de Mattos and de Matos2022; Gusman et al., Reference Gusman, Grimm, Cohen and Doane2021) and supports the notion that improved sleep quality may support or protect against future perceptions of stress.
In addition, we found that a within-person increase in depressive symptoms during students’ second year of college was associated with a within-person increase in college stress in the third year, and that more stress than usual during the third year predicted subsequent increases in depressive symptoms the next year. These findings support a bidirectional relation between depressive symptoms and college stress, such that increased depressive symptoms may serve as a risk factor for greater stress perceptions within and across years, and these fluctuations in stress may affect both concurrent (i.e., same year) and subsequent (i.e., next year) increases in depressive symptoms. These findings are especially interesting when considering the role of COVID-19. Namely, within-person increases in depressive symptoms prior to the pandemic were predictive of higher college stress immediately before or at the beginning of the COVID-19 pandemic, which in turn predicted higher depressive symptoms amid the pandemic, accounting for individual differences in the impact of COVID-19. This finding partially supports vulnerability-stress models of psychopathology (Ingram & Luxton, Reference Ingram, Luxton, Hankin and Abela2005), wherein students who were experiencing more depressive symptoms than usual before the pandemic were especially at-risk for increases in stress near the onset of COVID-19 (a global and uncontrollable stressor), which in turn predicted more severe symptoms of depression. These findings also align with a previous study that found college students with depression prior to COVID-19 were at greater risk for various perceptions of stress (e.g., overall, financial, family, work-related) during the pandemic (March-April 2020; Husky et al., Reference Husky, Kovess-Masfety, Gobin-Bourdet and Swendsen2021). Lastly, it is important to note that the indirect effect of second year depressive symptoms on fourth year depressive symptoms via college stress was not statistically significant. Though we had a relatively large indirect effect size, this nonsignificant result was likely due to our sample size and relatively large standard errors, which is a noted drawback of the RI-CLPM (Hamaker, Reference Hamaker2018). Still, these findings provide meaningful insight into the directionality of relations between stress and depressive symptoms across the college years, with preliminary evidence that elevated depressive symptoms may provide vulnerability for subsequent increases in both stress and sleep problems. In this way, assessing for depressive symptoms as part of initial screening criteria for students at the start of college may be beneficial in detecting students at-risk for problems with stress and sleep during their college years.
Limitations, strengths, and future directions
The results of this study should be interpreted alongside its limitations. First, the participants who took part in the study were recruited based on their intention to attend a large, public university in the Southwestern United states, and were required to live within 60 miles of this institution at the time of recruitment. As such, these findings may not generalize to young adults who choose to attend universities further away from home, attend community colleges, two-year colleges, or vocational or technical institutes, or who choose not to attend college immediately following high school. Regarding methodology, stress, sleep, and depressive symptoms were each measured via participant self-report (e.g., single reporter) and varied in their time frame of measurement (e.g., retrospective report of past week, month, semester). This approach is consistent with other studies (e.g., Doane et al., Reference Doane, Gress-Smith and Breitenstein2015; Tavernier & Willoughby, Reference Tavernier and Willoughby2014; Wallace et al., Reference Wallace, Boynton and Lytle2017) that used varying time frames to measure sleep (i.e., past month), depressive symptoms (i.e., past week or weeks), and stress (e.g., past month or not specified) with similar findings to the current study. While this decision was made to be consistent with validated measures containing clinical criteria (Buysse et al., Reference Buysse, Reynolds, Monk, Berman and Kupfer1989; Radloff, Reference Radloff1977), the mismatch in reference frame and frequency of assessment may have reduced the specificity of our findings. Future studies would be strengthened by obtaining reports with consistent time frames from multiple informants to limit reporter bias and confirm the robustness of these findings. Similarly, the current study examined sleep problems using the PSQI, a validated and widely used measure for subjective sleep problems (Buysse et al., Reference Buysse, Reynolds, Monk, Berman and Kupfer1989). Future studies should seek to examine actigraphy-measured sleep, to understand whether objective sleep quality parameters (e.g., efficiency, latency) reveal similar findings. Further, although the examination of school/college stress (versus general perceived stress) was a strength of this study, it should be noted that the CSS was developed and validated in a sample of college students (Rodriguez et al., Reference Rodriguez, Myers, Morris and Cardoza2000), which could have led to differences in students’ responses during high school due to less relevance or applicability of some items. However, these differences are expected and meaningful in the context of the current study, as they help capture the degree to which specific stress experiences may become more or less salient for adolescents as they transition into college contexts. Additionally, the final two time points of this study were assessed near the beginning and during the COVID-19 pandemic (Spring/Summer 2020 and 2021), which inadvertently poses threat to the internal and external validity of the study (i.e., history effects). Yet, the present study sought to account for and interpret this by controlling for the timing and impact of COVID-19. Lastly, the RI-CLPM yielded effect sizes in the small-to-medium range, which may be due to the 1-year time interval between measures, as well as our focus on well-being outcomes with multiple determinants.
Despite these limitations, the present study harnessed the strengths of a diverse sample of self-identified Latino/a adolescents and, as such, examined within-group heterogeneity through a longitudinal study design that spanned five years to investigate reciprocal relations among three key indicators of adjustment among Latino/a college students. Further, to disaggregate within- and between-person variance in reciprocal relations over time, the current study employed a RI-CLPM to examine within-person, cross-lagged paths across the transition to and through college. This was a strength of the current study, as most existing work studying similar questions utilized standard CLPMs (which do not differentiate between within- and between-person levels in reciprocal processes). Additionally, rather than examining nonspecific perceptions of stress, which has been the standard in existing similar work, we examined developmentally-salient stress forms that are particularly relevant for college students (e.g., academic, social, financial; Rodriguez et al., Reference Rodriguez, Myers, Morris and Cardoza2000), which has not yet been done in an intensive longitudinal study. Future research should extend these results by examining additional forms of stress that are commonly experienced by Latino/a college students (e.g., discrimination, bicultural stress), and how these are reciprocally associated with sleep and mental health across the transition to and through college (e.g., Castro et al., Reference Castro, Sasser, Sills and Doane2022; Sladek et al., Reference Sladek, Doane and Park2020).
Conclusion
The current study examined longitudinal, within-person reciprocal links between adjustment indices in a sample of Latino/a adolescents making the transition from high school to college. Our findings indicate significant relations between within-person fluctuations (i.e., state-like differences) in school/college stress, sleep problems, and depressive symptoms, as well as stable, trait-like individual differences in adjustment across the study period. We observed within-person reciprocal relations between college stress and sleep problems during the first two years of college, whereas within-person increases in college stress and depressive symptoms, as well as sleep problems and college stress, were prospectively linked later in college. These results contribute to a large body of research examining bidirectional associations between stress, sleep, and mental health, and provide additional specificity by parsing out within- and between-person relations in adjustment. Findings may help inform future intervention and prevention programs for incoming Latino/a college students. For example, developing effective stress coping responses and improving sleep health during the initial transition to college may help combat against depressive symptoms and reduce the negative impact of stress. In addition, targeting mental health symptoms early in college may be important to prevent future stress and future increases in depressive symptoms.
Supplementary material
The supplementary material for this article can be found at https://doi.org/10.1017/S0954579423001578.
Funding statement
This research was supported by a William T. Grant Foundation Scholars Award (184370) to Dr. Leah Doane.
Competing interests
None.


 Open access