


I. Introduction
There have been significant regulatory initiatives to increase gender diversity on corporate boards in many countries over the past two decades. In the United States, pressure on firms to appoint women directors increased with the passage of a 2018 California law requiring female representation on boards, which has subsequently been repealed. Recent years have also seen institutional investors actively advocate for gender diversity on corporate boards. These mechanisms use regulatory mandates and external pressure to bring about changes in firm policies. In this article, we examine a hitherto unexplored channel that does not rely on regulatory mandates and that links the large literature on female political representation with board gender diversity. Specifically, we examine the spillover effect from women’s political leadership to women’s representation on corporate boards.
Women’s political leadership has been shown to impact voters’ gender attitudes. Women political candidates serve as role models for other women and are associated with more girls indicating an intention to be politically active (Campbell and Wolbrecht (Reference Campbell and Wolbrecht2006)). In addition, female political leadership has been associated with a change in voter attitudes toward women (Beaman, Chattopadhyay, Duflo, Pande, and Topalova (Reference Beaman, Chattopadhyay, Duflo, Pande and Topalova2009)). Though women’s political leadership has been shown to impact voters’ gender attitudes, there is little understanding, as yet, of whether these changes have spillover effects outside political behavior, particularly in the corporate world.
A study of the effect of women’s political leadership on women’s corporate leadership (as proxied by appointments to corporate boards) is difficult due to the underlying endogeneity. Women’s leadership in the political world is not random, and underlying omitted factors, such as a region’s prevailing gender norms, are likely to influence the importance of women in both the political and corporate worlds. To address this endogeneity, we examine close elections (i.e., elections decided by a narrow margin) involving women and implement a regression discontinuity (RD) estimation. Districts where women narrowly win or narrowly lose are likely to have similar attributes, including underlying gender norms, so any effect on subsequent board gender diversity is likely to be due to the treatment effect of women candidates winning the election.
We begin by examining whether electoral wins by women candidates in close elections lead to an increase in the number of women directors in firms located in the same districts. We examine House, Senate, and gubernatorial elections where a nonincumbent woman candidate runs against a male candidate over the period 2004–2016. This results in a sample of 365 elections. For each election, we calculate the Woman Win Margin—the difference in the fraction of votes obtained by the woman candidate minus the fraction obtained by the male candidate—which ranges from −1 to +1. The treatment variable, Woman Win, takes the value of 1 when the Woman Win Margin is greater than 0. Consistent with the RD’s identifying assumption, we find that narrow wins and narrow losses by women candidates are locally random, as shown by the continuity of the forcing variable at the cutoff and an insignificant McCrary (Reference McCrary2008) density test.
We obtain board data for S&P 1500 firms headquartered in the zip codes spanned by our election sample and examine the change in the number of women directors in the year after the election. We control for firm characteristics, especially the lagged number of women directors, along with county demographic characteristics. In our sample of close elections, an OLS estimation shows a significant increase in female directors in the years after election wins by women candidates. These results hold in an RD estimation. To ensure the validity of the RD design, we check for, and find no, discontinuities in the covariates around the cutoff point. Our base RD specification, which is a local linear regression function with a triangular kernel and an optimally determined bandwidth, shows that women’s election wins have a significant causal effect on the increase in the number of women directors for firms headquartered in those zip codes. We estimate and report specifications with different bandwidths, polynomials of varying order, and different kernels, and we find qualitatively similar results.
Imbens and Lemiuex (Reference Imbens and Lemiuex2008) and Catttaneo, Idroba, and Titunik (Reference Cattaneo, Idroba and Titiunik2019) recommend falsification tests to check the validity of the RD design. In line with that, we i) implement placebo outcomes around arbitrary chosen cutoffs for winning and ii) examine the change in the number of women directors in the year prior to women’s election wins. We find no evidence of an increase in female directors either after the placebo wins by women candidates or for firms in districts where there is a subsequent electoral win by a woman candidate. These results mitigate concerns that districts’ underlying characteristics cause both electoral wins by women candidates and increases in women directors. The results also allay concerns about reverse causality.
Several nonmutually exclusive mechanisms may account for the effect of women candidates’ electoral wins on board diversity. First, elections convey information about the electorate’s consensus views. Stangor, Sechrist, and Jost (Reference Stangor, Sechrist and Jost2001) find that stereotypes and prejudices are likely to change if participants are informed that the consensus view is different from their own and that this change in belief persists over time. The change arises because the relevance of stereotypic beliefs lies in the individual’s perception that those beliefs are shared by others. Lowery, Hardin, and Sinclair (Reference Lowery, Hardin and Sinclair2001) propose a “social tuning” hypothesis where shared reality—that is, the sense that social beliefs are shared—is thought to establish and maintain social bonds and causes individuals to adjust or attune their beliefs to others. Women candidates’ election wins convey, to the citizens, the fact that the majority supports women leadership, which may influence others to move toward the perceived consensus or mainstream view. Second, election wins by women expose the citizens to exemplar women, and this exposure to counter-stereotypic group members may change the citizens’ beliefs (Dasgupta and Greenwald (Reference Dasgupta and Greenwald2001)). Third, Appelbaum, Audet, and Miller (Reference Appelbaum, Audet and Miller2003) point out that women’s leadership style differs from men’s. If this is the case, then electoral wins by women candidates may result in increased exposure to and acceptance of women’s leadership styles. Whether by aggregating and conveying the majority views or by exposing citizens to exemplar women or differing leadership styles, all three mechanisms imply a change in local gender-related norms and a resulting increase in board gender diversity after women candidates’ election wins.
To provide empirical support for the proposed mechanisms, we study instances when the underlying mechanism leads to disparate treatment effects. First, we examine election characteristics that increase the effect of the election and the salience of gender on social norms. We show that wins by woman candidates in more consequential (i.e., Senate and gubernatorial but not House) elections, elections when the woman candidate’s media coverage is high, and elections when her base is more energized all result in larger treatment effects. Second, we identify firm characteristics that make the firm more responsive to local changes in gender norms. Firms in which a higher fraction of the board lives locally and firms where local institutions hold a higher fraction of shares are likely to be more responsive to changes in local norms. Consistent with this, we find larger treatment effects for such firms. We also find that boards where directors have negative ISS recommendations, which results in greater pressure from shareholders, are more responsive to wins by women candidates.
As the treatments effects are confined to election wins by nonincumbent visible women candidates and do not extend to wins by incumbent women candidates and those with low visibility, the results are unlikely to be due to anticipation of female friendly regulation and policies which should arise from all women wins (see Brogaard, Gerasimova, and Rohrer (Reference Brogaard, Gersimova and Rohrer2024)). We also examine and find no connections between the winning women candidates and the newly appointed female directors; this mitigates the concern that the new director appointments reflect political connections.
The RD design allows us to estimate the causal effect of electoral wins by women candidates on board gender diversity. The estimated coefficient implies that the increase in the number of women directors following close electoral wins by women candidates is three times higher than the unconditional increase. As the RD estimate is locally estimated, its effects cannot be extrapolated to the whole sample. However, the results show a continued significance of the RD treatment effect at larger bandwidths, as well as when the effect is estimated in the whole sample. As these results do not rely on close elections, they suggest that the RD estimate is relevant for overall firm behavior and policy decisions.
The article is among the first to link the large literature on female political representation and its impact on voter attitudes with the rapidly growing literature on board gender diversity. The article finds significant spillovers of female political leadership into the corporate world, which manifest in greater gender diversity on boards. While there is a growing literature on the role of social norms on firm policies, few studies examine the mechanisms that change underlying social norms. Along with Duchin, Simutin, and Sosyura (Reference Duchin, Simutin and Sosyura2021), who examine early childhood exposure to gender norms and its effect on CEOs’ gender attitudes, this article documents the role of women candidates’ electoral wins in changing underlying gender norms and board gender diversity.
Gender diversity on corporate boards has received academic as well as regulatory attention over the past two decades. Though the number of women directors has increased in recent decades, barriers to women still arise from “discrimination and culture” (Adams and Kirchmaier (Reference Adams and Kirchmaier2015)). Our results suggest a potential way to address concerns about gender diversity on boards.
The rest of the article is organized as follows: In Section II, we briefly discuss the related literature. In Section III, we discuss the data. Section IV details the empirical implementation and robustness checks, and Section V discusses heterogeneous RD effects. Section VI concludes.
II. Literature Review
Several studies have examined the effect of female political candidates on voters’ gender attitudes. In addition to Campbell and Wolbrecht’s (Reference Campbell and Wolbrecht2006) findings (discussed earlier), Atkeson (Reference Atkeson2003) documents that the presence of competitive female political candidates is associated with a greater likelihood of political engagement by female citizens and that this effect is immediate. Along with being effective role models, female political leaders are associated with changes in voter attitudes toward women. Beaman, Chattopadhyay, Duflo, Pande, and Topalova (Reference Beaman, Chattopadhyay, Duflo, Pande and Topalova2009) find that gender mandates in India change voter preferences and that in areas where female leaders are elected by mandate, women are more likely to run for office and get elected. Baskaran and Hessami (Reference Baskaran and Hessami2018) document that female candidates for lower office in Germany are more successful if females also occupy higher positions. This electoral gain for women is due to a reduction in voters’ anti-female biases that arises from females occupying higher office.
Though women political candidates have been shown to change voters’ gender attitudes, no study has examined whether these changes spill over from the political sphere into the corporate world. There are several channels through which election outcomes could impact broader social norms that effect corporate decisions.
First, electoral wins convey information about mainstream views to the citizenry. We, therefore, draw on the literature that examines the malleability of stereotypes and prejudices and how they respond to social and contextual influences (see Blair (Reference Blair2002) for a review). In particular, Stangor, Sechrist, and Jost (Reference Stangor, Sechrist and Jost2001) find that stereotypes can be changed when people receive consensus information that goes against the stereotype they hold. In that study, a group of European American students answering a question on the positive and negative traits of African Americans become more favorable in their assessments when they are provided with the consensus feedback that others are being more favorable. On the other hand, when the consensus view endorses the stereotypes, these beliefs become more resistant to change. Further, Stangor, Sechrist, and Jost (Reference Stangor, Sechrist and Jost2001) find that the change in beliefs persists over time.
Lowery, Hardin, and Sinclair (Reference Lowery, Hardin and Sinclair2001) argue that by adjusting their perspectives to the attitudes of others, individuals achieve the common ground that is necessary to sustain social interaction. Specifically, the authors find that participants exhibit less negativity toward Blacks when in the presence of a Black experimenter. Electoral wins facilitate a clear communication of the majority’s attitudes, which may lead individuals to change their own attitudes to be more in tune with the mainstream.Footnote 1
In line with this proposed effect of election outcomes on social norms, several studies document the effect of Donald Trump’s win in the 2016 presidential election on individual behavior. Specifically, Bursztyn, Egorov, and Florin (Reference Bursztyn, Egorov and Fiorin2020) find an increase in individuals’ willingness to express xenophobic views, Huang and Low (Reference Huang and Low2017) find an increase in men’s aggressiveness in negotiations with women, and Edwards and Rushin (Reference Edwards and Rushin2018) document an increase in the prevalence of hate crimes.
Second, Dasgupta and Greenwald (Reference Dasgupta and Greenwald2001) propose another channel for bringing about a change in attitudes. They show that when participants are immersed in situations that frequently expose them to admirable members of stigmatized groups and to disliked members of valued groups, the participants’ beliefs shift in important ways. Notably, Dasgupta and Greenwald (Reference Dasgupta and Greenwald2001) find that participants who are exposed to admired Black Americans display less prejudice.Footnote 2 This exposure-to-exemplars hypothesis implies that victories by women candidates showcase exceptional women and thus make attitudes toward all women more favorable. Consistent with the notion that election wins highlight exemplars, Plant et al. (Reference Plant, Devine, Cox, Columb, Miller, Goplen and Peruche2009) document a reduction in anti-Black prejudices after Barack Obama’s victory.Footnote 3
Along with conveying information about mainstream beliefs and generating awareness of exemplar women, women’s election wins may affect corporate boards via a third channel: an increase in citizens’ exposure to women’s leadership style. Appelbaum, Audet, and Miller (Reference Appelbaum, Audet and Miller2003) point out that women’s leadership style differs from men’s, and though both styles can be effective, socialization is likely to lead to a persistent perception that the women’s style is less effective.Footnote 4 Winning women candidates may help change that attitude. They allow the electorate to see that while women’s leadership styles are different, women can still be effective and win, thus facilitating more leadership by women in the corporate world.
These studies together underscore the importance of election wins in changing social attitudes. Women in close elections against men are likely to bring attention to gender issues, though it is their winning that is likely to significantly impact gender-related attitudes. A woman’s loss in a close election reaffirms gender stereotypes rather than encouraging a reevaluation of these norms. Andreoni and Bernheim (Reference Andreoni and Bernheim2009) point out that “the norm of 50–50 appears to have considerable force in a wide range of economic environments.”Footnote 5 This points to a tipping point at the 50–50 norm and predicts that a woman candidate’s win, even with a small margin (say 51%), is likely to have a significant effect on subsequent gender-related norms, relative to a loss with a small margin (say 49% support). We perform placebo tests at random cutoffs for winning and find no effect on board diversity around these cutoffs. These results emphasize the significance of the 50–50 cutoff.
The article is also related to the large and growing literature on board gender diversity. Norway mandated a 40% representation for women directors in 2004, and several countries have mandated hard or soft quotas for women directors since then (see Adams (Reference Adams2016) for further details). Adams and Kirchmaier (Reference Adams and Kirchmaier2015) examine barriers to gender diversity on boards across a sample of 22 countries and find that female labor force participation and other supply side factors are important, but they also stress that “measures of discrimination and culture” impact the career progression of qualified women (see Bertrand (Reference Bertrand2011)). Duchin, Simutin, and Sosyura (Reference Duchin, Simutin and Sosyura2021) document the importance of early childhood experiences in shaping gender-related norms. Our article contributes by documenting that electoral wins by women have a causal effect in increasing the number of women directors. And while institutional investors have put greater pressure on boards to add women directors in recent years,Footnote 6 our results, which reflect the 2004–2016 period, predate the increasing importance of gender diversity for these investors that was documented by Gormley et al. (Reference Gormley, Gupta, Matsa, Mortal and Yang2023).
III. Data
We study the effect of elections over the period from 2004 to 2016. We end in 2016, as the period after that saw a substantial increase in institutional investors’ push for board gender diversity along with the 2018 passage of the California law mandating the appointment of a woman director to each board. The period prior to these major changes is a cleaner setting in which to study the effect of electoral outcomes on board gender diversity. We examine House, Senate, and gubernatorial elections, as Campbell and Wolbrecht (Reference Campbell and Wolbrecht2006) find that these visible and important elections get more attention. We focus on nonincumbent women candidates, as Wolbrecht and Campbell (Reference Wolbrecht and Campbell2017) show that they are more likely to generate discussion of gender and increase gender’s salience in the election.
Data for the analysis come from multiple sources. The national election results data—U.S. House of Representatives constituency (district)-level outcomes from 2004 to 2016 and U.S. Senate state-level results from 2004 to 2016—are from Election Lab at MIT.Footnote 7 We obtain the state-level results for gubernatorial elections from Dave Leip’s Atlas of U.S. Presidential Elections. We identify the women House, Senate, and governor candidates using the data from Center for American Women and Politics (CAWP) at Rutgers University. This data set also identifies the women candidates as challengers, incumbents, or contestants for an open seat. We include all House, Senate, and gubernatorial elections held from 2004 to 2016 where a nonincumbent woman runs against a male candidate, resulting in a final sample of 365 elections.
The board data are from the Institutional Shareholder Services (ISS) Directors database and span 2003–2017. We use Compustat to obtain the zip code of each firm’s headquarters and other accounting data for the firms in our sample. To match the firm-level data with the election results data, we get the congressional district to zip code matching files from the Census Bureau’s website.Footnote 8 Figure 1 (Figure 2) plots the geographic distribution of corporate headquarters for our sample of (close) elections, indicating where women candidates win or lose.
Figure 1 displays the distribution of sample firms headquartered in zip codes where Senate, House, and gubernatorial elections involved a nonincumbent woman candidate running against a male candidate from 2004 to 2016.

FIGURE 1 Long description
A choropleth map of the United States divided by zip code boundaries. The map highlights specific zip codes where corporate headquarters are located in areas with 2004 to 2016 elections involving nonincumbent women.
* The legend at the bottom indicates that red represents Woman Candidate Lose and green represents Woman Candidate Win.
* In the West, there is a high concentration of red and green zip codes along the California coast and in Arizona.
* The Midwest and Great Lakes regions show scattered clusters of both red and green, particularly around Illinois, Michigan, and Ohio.
* The Northeast Corridor, from Washington D C up to Boston, shows a dense concentration of red zip codes with occasional green spots.
* The South has scattered data points, with notable clusters in Texas, Florida, and North Carolina.
* Alaska and Hawaii are shown in the bottom left corner, with Hawaii containing a small green zip code and Alaska remaining unshaded.
Figure 2 displays the distribution of sample firms headquartered in zip codes where Senate, House, and gubernatorial elections involved a nonincumbent woman candidate running against a male candidate from 2004 to 2016 with an election win margin of less than 9.4%, the optimal bandwidth of our base RD specification.

FIGURE 2 Long description
A choropleth map of the United States divided by county or zip code boundaries. The map uses a color-coded system to identify corporate headquarters locations.
* Red areas represent locations where a woman candidate lost an election.
* Green areas represent locations where a woman candidate won an election.
* White areas represent regions without sample firms in the specified close-election criteria.
Geographical Distribution:
* West: Concentrations of green are visible in Western Washington, Western Oregon, and Northern California. A large red area is located in Southern Arizona near the border.
* Midwest: Scattered clusters of both red and green are found around the Great Lakes region, particularly in Illinois, Michigan, and Ohio.
* Northeast: High density of both red and green areas throughout the Northeast corridor, including Massachusetts, New York, New Jersey, and Pennsylvania.
* South: Notable clusters appear in Florida, with a mix of red and green in the southern and central parts of the state. Scattered red and green points are also visible in North Carolina and Georgia.
* Alaska and Hawaii: These states are shown in the bottom left corner with no highlighted corporate headquarters in the sample.
The outcome variable is the change in the number of women directors on the boards of firms with headquarters in the zip codes covered by our sample elections. Specifically, Change in Female Directors is the change in the number of women directors from the prior year. We indicate the year’s timing relative to the election by the variable Post, which takes the value of 1 for the year after the election and 0 for the year of the election.Footnote 9 The final sample consists of 2,441 firm years after elections (i.e., years where Post equals 1). We also run placebo tests for the change in the number of women directors in the year prior to the election—that is, in years where Post equals 0 (also referred to as Preelection)—and have 2,462 firm-year observations for this sample.Footnote 10
Table 1 presents the summary statistics for Change in Female Directors. On average, firms in the sample have an increase of 0.075 women directors over the sample period. There is no difference in the unconditional change in the number of women directors between firms in zip codes where women candidates win and firms in zip codes where women candidates lose. To capture the importance of women directors on the board, we also examine the change in the number of women on two important board committees: audit and compensation. The average change in the number of women on these committees is 0.068 with no significant difference between zip codes where women candidates win or lose. The patterns look similar prior to the election.

TABLE 1 Long description
The table is divided into two main sections: Outcome variables and Covariates. Values are presented as Mean with Standard Deviation in parentheses, or t-Stat for differences.
Outcome variables section:
* Post equals 1, Change in female directors: Full Sample 0.075 (0.46); Woman Win A 0.102 (0.42); Woman Win B 0.069 (0.47); Difference 0.032 (1.35).
* Post equals 1, Change in female committee members: Full Sample 0.068 (0.48); Woman Win A 0.080 (0.48); Woman Win B 0.065 (0.48); Difference 0.015 (0.59).
* Post equals 0, Change in female directors: Full Sample 0.073 (0.46); Woman Win A 0.063 (0.44); Woman Win B 0.075 (0.47); Difference minus 0.012 (minus 0.51).
* Post equals 0, Change in female committee members: Full Sample 0.041 (0.44); Woman Win A 0.037 (0.44); Woman Win B 0.041 (0.44); Difference minus 0.004 (minus 0.89).
* Woman Win: Full Sample 0.186 (0.39).
Covariates section:
* Lag number of female directors: Full Sample 1.220 (1.02); Woman Win A 1.283 (0.99); Woman Win B 1.205 (1.02); Difference 0.078 (2.08).
* Lag number of female committee members: Full Sample 1.034 (0.94); Woman Win A 1.108 (0.93); Woman Win B 1.017 (0.94); Difference 0.091 (2.65).
* Log of total assets: Full Sample 7.871 (1.62); Woman Win A 7.847 (1.56); Woman Win B 7.877 (1.62); Difference minus 0.030 (minus 0.51).
* Return on assets R O A: Full Sample 0.047 (0.09); Woman Win A 0.058 (0.07); Woman Win B 0.044 (0.10); Difference 0.014 (4.08).
* Institutional ownership I O: Full Sample 0.705 (0.27); Woman Win A 0.707 (0.26); Woman Win B 0.705 (0.27); Difference 0.002 (0.15).
* Log Personal income per capita: Full Sample 10.825 (0.34); Woman Win A 10.756 (0.25); Woman Win B 10.841 (0.36); Difference minus 0.085 (minus 6.80).
* Log Population: Full Sample 13.801 (1.03); Woman Win A 13.735 (1.06); Woman Win B 13.816 (1.02); Difference minus 0.080 (minus 2.13).
* Proportion of women: Full Sample 0.512 (0.01); Woman Win A 0.513 (0.01); Woman Win B 0.512 (0.01); Difference 0.001 (4.65).
* Female-male income ratio: Full Sample 0.703 (0.05); Woman Win A 0.707 (0.05); Woman Win B 0.702 (0.06); Difference 0.004 (2.19).
* Female labor force participation: Full Sample 74.397 (3.13); Woman Win A 75.626 (2.46); Woman Win B 74.116 (3.20); Difference 1.510 (13.36).
* Male labor force participation: Full Sample 85.612 (3.26); Woman Win A 85.829 (2.89); Woman Win B 85.563 (3.34); Difference 0.267 (2.23).
* Female unemployment rate: Full Sample 7.327 (1.70); Woman Win A 7.286 (1.82); Woman Win B 7.337 (1.67); Difference minus 0.050 (minus 0.80).
* Male unemployment rate: Full Sample 7.731 (1.81); Woman Win A 8.115 (1.82); Woman Win B 7.644 (1.80); Difference 0.472 (7.14).
We gather data on firm characteristics that are likely to impact the number of women directors. We include the lagged number of female directors, as a greater number of existing female directors may reduce the likelihood that another female director is appointed. We obtain total assets and return on assets (ROA) to control for firm size and performance. We also consider ownership by institutional investors (IO), as it may lead to greater gender diversity on boards. Firms in zip codes where women candidates win have, on average, more existing female directors and female board committee members. There is no difference in the firm size or institutional ownership of firms in areas where women candidates win, relative to in firms where they lose. However, firms in zip codes with winning women candidates have better firm performance.
We also gather data on the demographic characteristics of the county where the firm is headquartered, including per capita personal income, total population, proportion of women, female-to-male income ratio, female and male labor force participation rates, and female and male unemployment rates.Footnote 11 Firms in zip codes where women win have lower per capita personal income, smaller populations, a slightly higher proportion of women, higher female-to-male income ratio, and higher female labor force participation. Note that these are average values for the entire sample and not for the sample of close elections. Later in the article, we test for, and find no evidence of, discontinuity in the covariates at the cutoff—that is, when the Woman Win Margin is 0.
IV. Empirical Implementation
The forcing variable, Woman Win Margin, is the difference between the share of votes obtained by the woman candidate minus the share obtained by the male candidate and takes values between −1 and 1. When values of Woman Win Margin are greater than 0, the women candidate wins and the indicator variable Woman Win takes the value of 1. We begin by estimating OLS regressions in a sample of close elections followed by the RD estimation.
A. OLS Estimation
We first estimate an OLS model of change in the number of female directors for all firms located in zip codes where nonincumbent women run against male candidates in close elections. The main variable of interest is the interaction of Woman Win with Post, which captures the effect of a woman’s election win on board diversity in the year after the election. We include industry fixed effects to control for industries that are more likely to have women directors and for industries, like oil and gas, that are less likely to have them.Footnote 12 We also include year fixed effects to control for the trend of an increasing number of women directors and cluster the errors at the state level. Panel A of Table 2 tabulates the results for the sample where the Woman Win Margin is within 5%. The coefficient of the interaction of Woman Win with Post is positive and significant, suggesting that firms in counties where women win close elections significantly increase their number of female directors after the election. The results are robust to including firm and county characteristics, as discussed previously, including the lagged number of female directors (column 2). The results are qualitatively similar when we increase the sample to include all elections where women win or lose within a margin of 10% (Panel B).

TABLE 2 Long description
The table presents O L S results for the outcome variable Change in Number of Female Directors. It is divided into Panel A for a 5 percent Win Margin (Models 1 and 2) and Panel B for a 10 percent Win Margin (Models 3 and 4).
Row 1: Woman Win. Model 1: minus 0.014. Model 2: minus 0.007. Model 3: minus 0.017. Model 4: minus 0.020. T-statistics in brackets range from minus 0.17 to minus 0.54.
Row 2: Woman Win times Post. Model 1: 0.147 with two asterisks. Model 2: 0.144 with two asterisks. Model 3: 0.131 with two asterisks. Model 4: 0.130 with two asterisks. T-statistics range from 2.17 to 2.30.
Row 3: Post. Model 1: 0.050 with one asterisk. Model 2: 0.062 with one asterisk. Model 3: minus 0.056. Model 4: minus 0.041.
Row 4: Intercept. Model 1: minus 0.514 with three asterisks. Model 2: minus 0.716. Model 3: 0.100. Model 4: 0.132.
Row 5: R-squared. Model 1: 0.10. Model 2: 0.17. Model 3: 0.07. Model 4: 0.13.
Fixed Effects and Controls: All models include Clustering of errors by state, Industry fixed effects, and Year fixed effects. Covariates are included in Models 2 and 4 but not in 1 and 3.
Number of observations: 779 for Panel A and 1389 for Panel B.
For robustness, we also estimate models around arbitrary cutoffs for winning. Specifically, instead of examining close elections around the cutoff of 0, we estimate the model in samples of close elections with the winning cutoff points being −10%, + 10%, −20%, and + 20%. The variable Woman Win Placebo takes the value of 1 if Woman Win Margin is greater than the chosen cutoff point. As seen in Table 3, there is no significant evidence of an increase in female directors after placebo election wins by women candidates.
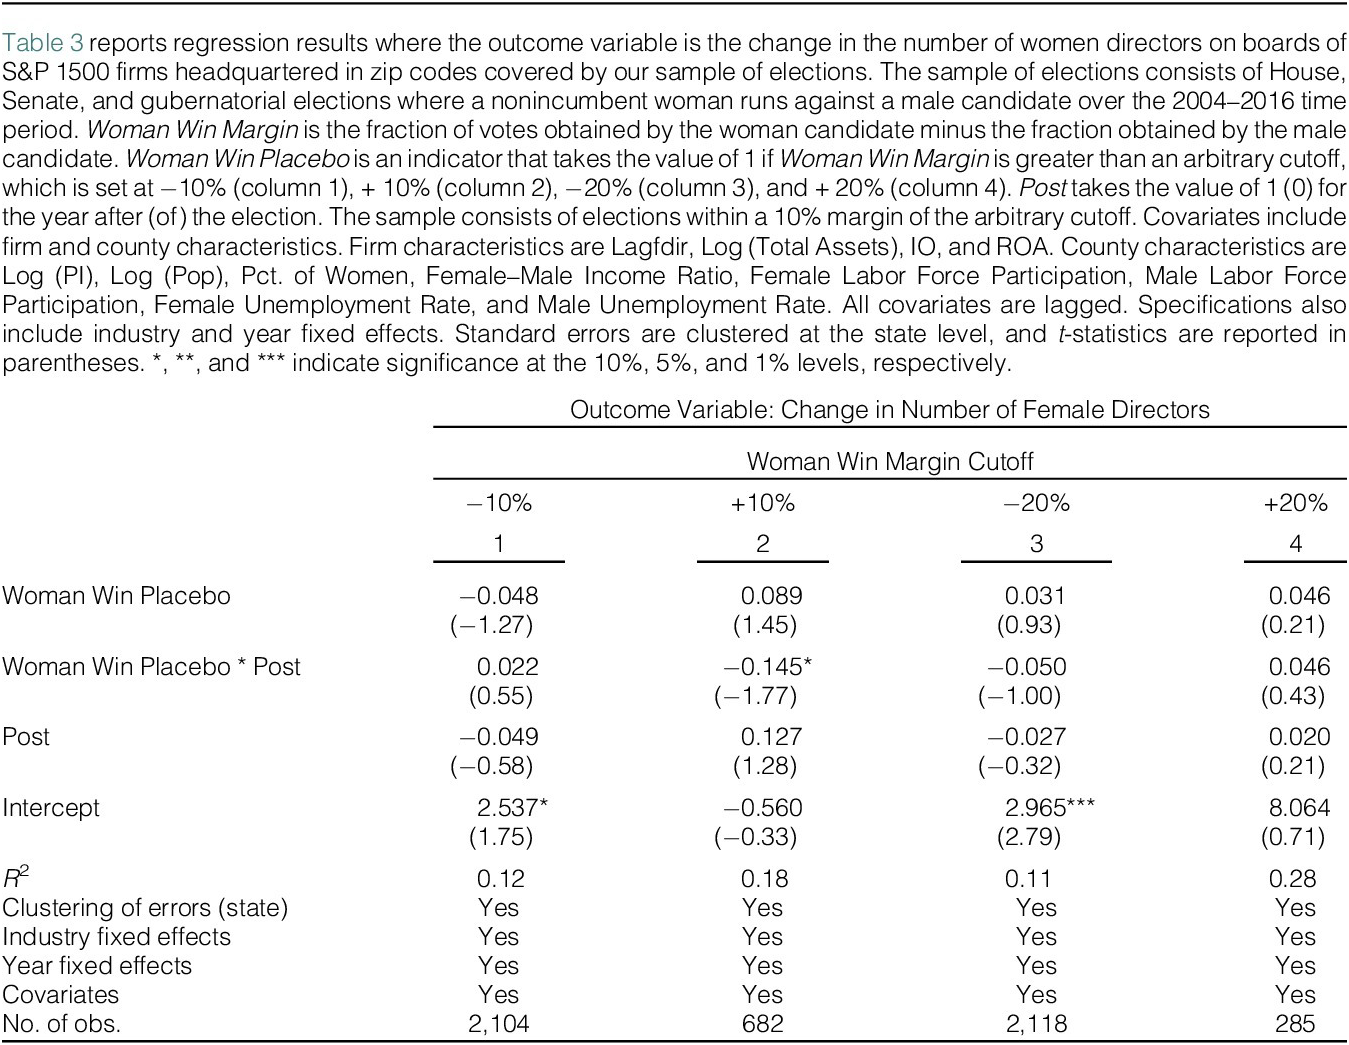
TABLE 3 Long description
The table presents results for the outcome variable Change in Number of Female Directors across four columns representing Woman Win Margin Cutoffs of minus 10 percent, plus 10 percent, minus 20 percent, and plus 20 percent.
Row 1: Woman Win Placebo. Values are minus 0.048 (t-stat minus 1.27), 0.089 (t-stat 1.45), 0.031 (t-stat 0.93), and 0.046 (t-stat 0.21).
Row 2: Woman Win Placebo times Post. Values are 0.022 (t-stat 0.55), minus 0.145 asterisk (t-stat minus 1.77), minus 0.050 (t-stat minus 1.00), and 0.046 (t-stat 0.43).
Row 3: Post. Values are minus 0.049 (t-stat minus 0.58), 0.127 (t-stat 1.28), minus 0.027 (t-stat minus 0.32), and 0.020 (t-stat 0.21).
Row 4: Intercept. Values are 2.537 asterisk (t-stat 1.75), minus 0.560 (t-stat minus 0.33), 2.965 super asterisk asterisk asterisk (t-stat 2.79), and 8.064 (t-stat 0.71).
Row 5: R-squared values are 0.12, 0.18, 0.11, and 0.28.
Bottom section: All four columns include Yes for Clustering of errors (state), Industry fixed effects, Year fixed effects, and Covariates. The number of observations for columns 1 through 4 are 2,104, 682, 2,118, and 285 respectively.
B. RD Estimation
In this section, we implement an RD design to estimate the causal effect of women’s electoral wins on the number of female directors. As the assignment to the treatment group (where women candidates win) is deterministic, there is a sharp discontinuity at the cutoff point of 0, allowing us to implement a sharp RD design.
The identifying assumption of the RD design is that districts where women candidates win or lose by a narrow margin are similar in characteristics, so any effect seen on the change in women directors can be attributed to the treatment effect of the woman candidate winning. This requires that the forcing variable, Woman Win Margin, be continuous around the cutoff value of 0. Figure 3 plots the histogram for Woman Win Margin and shows no discontinuity at the cutoff.Footnote 13 This suggests that districts where women win or lose by a small margin are comparable in voter gender attitudes. The more formal McCrary (Reference McCrary2008) density test, shown in Figure 4, also looks for discontinuity at the cutoff, and the estimate is small and insignificant.
Figure 3 plots the histogram for the forcing variable, Woman Win Margin, in House, Senate, and gubernatorial races over the 2004–2016 period where a nonincumbent woman candidate runs against a male candidate. Woman Win Margin is the fraction of votes obtained by the woman candidate minus the fraction obtained by the male candidate. As the number of elections is small (365), we have plotted the histogram with a 3% bin size.

FIGURE 3 Long description
The histogram features a horizontal X axis labeled Woman Candidate Win Margin with a scale from minus 1 to 1 in increments of 0.5. The vertical Y axis is labeled Percent with a scale from 0 to 10 in increments of 2. The data is represented by tan-colored vertical bars with a 3 percent bin size.
* The distribution begins around minus 0.75 on the X axis with low frequency bars below 2 percent.
* A significant cluster of bars rises between minus 0.5 and 0.25.
* The highest peak occurs just to the left of the minus 0.25 mark, reaching approximately 9 percent.
* A secondary sharp peak is visible at approximately minus 0.4.
* The frequency of bars gradually tapers off as the win margin moves toward 0 and into positive territory.
* Beyond 0.25 on the X axis, the bars are sparse and remain below 1 percent, extending to approximately 0.75.
Figure 4 shows the McCrary (Reference McCrary2008) test for discontinuity in the density of the Woman Win Margin in a sample of 365 House, Senate, and gubernatorial elections where a nonincumbent woman ran against a male candidate over the 2004–2016 period. The discontinuity estimate is −0.0455, and the standard error is 0.32.

FIGURE 4 Long description
The x-axis is labeled Woman Candidate Win Margin and ranges from minus 1 to 1. The y-axis is labeled Percent and ranges from 0 to 3. A vertical black line is positioned at the 0 mark on the x-axis. To the left of the 0 line, the data points (open circles) form a bell-shaped curve that peaks at approximately minus 0.2 on the x-axis with a percent value near 2. A thick black trend line with thinner confidence interval lines follows this curve, ending abruptly at the 0 threshold. To the right of the 0 line, there is a visible drop in the density of data points. The trend line restarts at a lower point, approximately 1 on the y-axis, and slopes downward toward 0 as the win margin increases. The gap between the two trend lines at the 0 threshold represents the discontinuity estimate mentioned in the caption.
We begin by estimating and reporting an OLS estimation for the full sample for the year after the election. Note that this is different from Table 2, which reports OLS results in a sample of close elections over the sample period. We include the lagged number of female directors, firm size and performance, institutional ownership, and county demographic characteristics as before. We also include industry and time fixed effects. As seen in column 1 of Table 4, the estimated coefficient of Woman Win is positive but not significant.

TABLE 4 Long description
The table presents results for the outcome variable: Change in the Number of Female Directors After Elections (Post = 1). It is organized into 9 columns representing different bandwidths and regression functions.
Regression Functions and Bandwidths:
Column 1: None (O L S), Global, Bandwidth 1.000.
Column 2: Linear, Global, Bandwidth 1.000.
Column 3: Linear, h, Bandwidth 0.094.
Column 4: Linear, h, Bandwidth 0.094.
Column 5: Linear, h/2, Bandwidth 0.0472.
Column 6: Linear, 2 h, Bandwidth 0.189.
Column 7: Linear, h, Bandwidth 0.094.
Column 8: Quadratic, h, Bandwidth 0.094.
Column 9: Cubic, h, Bandwidth 0.094.
Key Data Rows:
Woman Win (Coefficient): Values range from 0.044 in Column 1 to 0.453 in Column 9. Significant positive results (indicated by triple asterisks) appear in Columns 2 (0.130), 4 (0.228), 5 (0.435), 6 (0.149), 7 (0.205), 8 (0.441), and 9 (0.453). Column 3 shows a double asterisk significance at 0.246.
Control Variables and Settings:
Clustering of error (state): Yes for all columns.
Industry fixed effects: Yes for all except Column 3.
Year fixed effects: Yes for all except Column 3.
Covariates: Yes for all except Column 3.
Kernel: None for Column 1; Uniform for Column 7; Triangular for all others.
Number of observations: 2,441 for Columns 1 and 2; 673 for Columns 3, 4, 7, 8, and 9; 379 for Column 5; and 1,358 for Column 6.
In column 2, we report an RD specification with a linear regression function estimated over the entire sample. The estimated coefficient for Woman Win is positive and significant. Columns 3 and 4 display results for the RD estimation, without and with covariates, respectively, in an optimally chosen bandwidth.Footnote 14 The estimated coefficient of Woman Win in column 4 (our base specification) is positive and significant at the 1% level.
Reducing the bandwidth (column 5) results in a higher estimated coefficient, while increasing the bandwidth (column 6) leads to smaller estimates with the coefficient always significant at the 1% level (see Meyersson (Reference Meyersson2014) for a discussion of the relevant specifications). Using a uniform kernel (column 7), quadratic polynomial (column 8), or cubic polynomial (column 9) results in positive coefficients that continue to be significant. Overall, the results show that close election wins by women candidates cause a significant increase in the number of women directors on the boards of firms headquartered in those zip codes. Figure 5 displays a graphical illustration of the RD estimation, which shows a jump in the change in female directors at the cutoff.Footnote 15
Figure 5 shows an RD estimation where the outcome variable is the change in the number of women directors in the year after the election—that is, for Post equal to 1. The forcing variable is Woman Win Margin, which is the share of votes obtained by the woman candidate minus the share obtained by the male candidate. The estimation includes the same covariates and fixed effects as in Table 4.

FIGURE 5 Long description
A scatter plot with a regression function fit. The horizontal X axis is labeled Woman Win Margin and ranges from negative 0.5 to 0.5. The vertical Y axis is labeled Change in Number of Women Directors and ranges from negative 0.1 to 0.2. A vertical dashed line at X equals 0 represents the threshold. To the left of the threshold, where the woman candidate lost, the data points and a downward-sloping concave polynomial fit of order 2 show a decrease in the outcome variable as the margin approaches zero. To the right of the threshold, where the woman candidate won, there is a sharp upward jump in the intercept. The data points to the right are fitted with a U-shaped convex polynomial curve. Grey dots represent the sample average within bins with vertical error bars. A legend on the right identifies the dots as Sample average within bin and the solid lines as Polynomial fit of order 2.
The estimated RD effect of 0.228 in column 4, the base specification, suggests that the increase in the number of female directors after women candidates’ electoral wins is three times higher than the unconditional increase.Footnote 16 The estimated RD effect is large, reflecting the stronger effect of close wins by women candidates. As seen later in the robustness section, the magnitude and significance of the estimated coefficients decrease as the bandwidth increases. It might seem counterintuitive that as the margin of victory for women candidates increases (larger bandwidths), the estimated coefficients drop. Note that the districts where women candidates win by large margins are likely to have pro-female gender attitudes and higher female board representation even prior to the election and, therefore, see a smaller increase in the number of female directors afterward. As the RD estimate is locally estimated, it is difficult to extrapolate these results to the full sample. As seen in column 2, the global RD coefficient estimated over the whole sample is also significant. As this does not depend on close elections, it supports the relevance of the RD estimates for a broader sample.
C. Placebo Tests
Meyersson (Reference Meyersson2014) and Cattaneo, Idrobo, and Titiunik (Reference Cattaneo, Idroba and Titiunik2019) recommend examining placebo outcomes to validate the RD design. One placebo outcome is to examine the change in the number of female directors in the same zip code prior to the election. If the change in the number of female directors is due to the election win by the woman candidate, there should be no effect in the prior year.
We, therefore, implement the RD estimation in the year prior to the election (i.e., when Post equals 0). Table 5 replicates all the specifications displayed in Table 4 for the prior year. The coefficient of Woman Win is not significant in any specification. This can also be seen in Figure 6, the graphical representation of the regression function fit around the cutoff for the year prior to the election. Because many of the estimated coefficients of Woman Win in the placebo tests are positive, we also test whether they are significantly different from the estimated coefficients from the year after the election. The last row in Table 5 tests for the difference in the estimated coefficient of Woman Win in Table 5 (placebo sample) and in the same column in Table 4 (treated sample). The estimated coefficient is different from the placebo coefficient in most specifications.

TABLE 5 Long description
The table presents the outcome variable: Change in Number of Female Directors Prior to the Election (Post = 0).
Columns 1 and 2 use None (O L S) regression with Global bandwidth.
Columns 3 through 7 use Linear regression with bandwidths h, h, h/2, 2 h, and h respectively.
Column 8 uses Quadratic regression with bandwidth h.
Column 9 uses Cubic regression with bandwidth h.
Key data rows:
* Woman Win: Values range from -0.043 to 0.137, with t-statistics in parentheses ranging from -0.94 to 1.12. None are statistically significant.
* Bandwidth (h): 1.000 for columns 1-2; 0.121 for columns 3, 4, 7, 8, 9; 0.06 for column 5; and 0.242 for column 6.
* Clustering of errors (state): Yes for all columns.
* Industry fixed effects, Year fixed effects, and Covariates: Yes for all columns except column 3 (No).
* Kernel: None (Col 1), Uniform (Col 7), and Triangular (Cols 2-6, 8-9).
* Number of observations: 2,462 (Cols 1-2), 828 (Cols 3, 4, 7, 8, 9), 474 (Col 5), and 1,759 (Col 6).
* Difference between Post = 1 and Post = 0 (Z score): Values range from 1.52 to 4.14. Significant results are noted in columns 3 (2.55***), 4 (2.76***), 5 (4.14***), 6 (1.71*), 7 (2.17**), 8 (4.14***), and 9 (2.32**).
Figure 6 shows an RD estimation where the outcome variable is the change in the number of women directors in the year prior to the election—that is, for Post equal to 0. The forcing variable is Woman Win Margin, which is the share of votes obtained by the woman candidate minus the share obtained by the male candidate. The estimation follows the same covariates and fixed effects as in Table 5.

FIGURE 6 Long description
A scatter plot with a regression function fit.
* The Y axis is labeled Change in Number of Women Directors, with a scale from minus 0.1 to 0.15.
* The X axis is labeled Woman Win Margin, with a scale from minus 0.5 to 0.5.
* A vertical dashed line at 0 on the X axis marks the threshold for the R D estimation.
* To the left of the threshold (negative win margin), a polynomial fit of order 2 shows a concave curve peaking around minus 0.25 and declining as it approaches zero.
* To the right of the threshold (positive win margin), the polynomial fit starts at a higher intercept than the left side and follows a downward sloping curve.
* Data points are represented by grey dots labeled Sample average within bin, each with vertical error bars indicating confidence intervals.
* The legend on the right identifies the grey dots as Sample average within bin and the solid black line as Polynomial fit of order 2.
The results from the placebo sample show that firms headquartered in areas where women candidates will later win elections are associated with no significant increase in women directors prior to those elections. This evidence mitigates concerns that gender norms in the area account for both the women candidates’ electoral wins and the increases in board gender diversity. It also addresses the reverse causality concern that an increase in the number of women directors resulted in the woman candidate’s subsequent electoral win in that zip code.
We also estimate the model at arbitrary cutoffs for winning that are different from 0. Specifically, Woman Win Placebo takes the value of 1 if the Woman Win Margin is greater than the cutoff of −10% (columns 1 and 3) or + 10% (columns 2 and 4). As seen in Table 6, there is no evidence that placebo election wins by women candidates result in changes in the number of female directors in the subsequent year.

TABLE 6 Long description
The table presents results for the outcome variable: Change in Number of Female Directors, using a linear regression function. It is divided into Panel A (Post equals 1) and Panel B (Post equals 0).
Header Rows:
- Cutoff for Winning: minus 10 percent and plus 10 percent for both panels.
- Bandwidth (h): Columns 1 and 2 correspond to Panel A; Columns 3 and 4 correspond to Panel B.
Data Rows:
- Woman Win Placebo: Column 1 (minus 10 percent) is 0.001 with a standard error of 0.01. Column 2 (plus 10 percent) is 0.048 with a standard error of 0.46. Column 3 (minus 10 percent) is 0.093 with a standard error of 1.23. Column 4 (plus 10 percent) is minus 0.005 with a standard error of minus 0.09.
- Bandwidth (h): 0.100 for all columns.
- Clustering of errors (state), Industry fixed effects, Year fixed effects, and Covariates: All marked as Yes for all columns.
- Kernel: Triangular for all columns.
- Number of observations: Column 1 is 1,048; Column 2 is 342; Column 3 is 1,056; Column 4 is 340.
- Difference between Post equals 1 and Post equals 0 (Z score): minus 0.87 star for the minus 10 percent cutoff and 0.45 for the plus 10 percent cutoff.
D. Checking for Discontinuity in Covariates
The validity of the RD estimation requires that there be no discontinuity in the covariates at the cutoff point. To check this assumption, we implement the base RD estimation—that is, with a linear regression function, triangular kernel, and optimally determined bandwidth—with each covariate as the outcome variable and Woman Win as the treatment variable. The results, displayed in Table 7, show that the coefficient of Woman Win is not significant for any of the covariates except the log of the per capita personal income. Overall, there appears to be little evidence of discontinuity in the covariates at the cutoff point.

TABLE 7 Long description
The table contains 12 columns representing different covariates: 1 Log Asset, 2 I O, 3 R O A, 4 Lagfdir, 5 Log P I, 6 Log P O P, 7 P C T Women, 8 Female-Male Income Ratio, 9 Female Labor Force, 10 Female Unemploy. Rate, 11 Male Labor Force, and 12 Male Unemploy. Rate.
Row 1: Woman Win coefficients. Values are -0.348, -0.044, 0.016, -0.277, -0.315 with two asterisks, -0.262, -0.004, -0.023, -1.383, 0.524, 0.797, and 0.264.
Row 2: Standard errors in brackets. Values are -1.48, -0.77, 1.37, -1.54, -2.18, -0.72, -0.80, -1.17, -1.17, 0.80, 0.81, and 0.42.
Row 3: Bandwidth h. Values range from 0.073 to 0.153.
Row 4: Cluster state. All columns are marked Yes.
Row 5: Covariates. All columns are marked No.
Row 6: Kernel. All columns are marked Tri.
Row 7: Num. of obs. Values range from 500 to 1,202.
E. Robustness
In this section, we perform a series of tests to examine the robustness of our results to underlying assumptions.
1. RD Specifications
Imbens and Lemieux (Reference Imbens and Lemiuex2008) recommend an extensive sensitivity analysis of the RD specification with respect to bandwidth and control function. Table 8, Panel A reports the coefficient of Woman Win for different bandwidths and polynomial orders in the control function. The columns have different variations in bandwidths, while the rows have different polynomial orders. The estimated coefficients are all positive, and most are significant. The magnitude and significance of the estimated coefficients increase as the bandwidth is reduced and as the polynomial order of the control function increases.

TABLE 8 Long description
The table is organized into five columns of bandwidths: 1, 0.5, 0.25, 0.1, and 0.05.
Panel A: For the Year After the Elections (Post equals 1).
- None (O L S): Coefficients range from 0.044 to 0.119, with significance at the 0.1 and 0.05 bandwidths.
- Linear: Coefficients increase from 0.130 to 0.419 as bandwidth narrows, all significant at the 1 percent level.
- Quadratic: Coefficients increase from 0.152 to 0.533, all significant at the 1 percent level.
- Cubic: Coefficients increase from 0.206 to 0.601, all significant at the 1 percent level.
- Quartic: Coefficients increase from 0.254 to 0.719, all significant at the 1 percent level.
- Number of observations decreases from 2,441 to 392 as bandwidth narrows.
Panel B: For the Year Prior to the Election (Post equals 0).
- None: Coefficients are mostly negative, ranging from minus 0.022 to 0.009, none significant.
- Linear: Coefficients range from minus 0.014 to 0.069, with significance only at the 0.05 bandwidth.
- Quadratic: Coefficients range from minus 0.030 to 0.092, none significant.
- Cubic: Coefficients range from minus 0.068 to 0.068, with significance at the 0.1 and 0.05 bandwidths.
- Quartic: Coefficients range from minus 0.076 to 0.139, with significance only at the 0.05 bandwidth.
- Number of observations decreases from 2,462 to 387 as bandwidth narrows.
Panel C: Z Scores (Panel A minus Panel B).
- None: Scores range from 1.43 to 1.71.
- Linear: Scores increase from 1.52 to 7.32, becoming highly significant at narrower bandwidths.
- Quadratic: Scores increase from 1.48 to 10.76, becoming highly significant from 0.5 bandwidth downward.
- Cubic: Scores increase from 2.50 to 13.00, all significant at the 5 percent or 1 percent level.
- Quartic: Scores range from 2.90 to 7.08, all significant at the 1 percent level.
Panel B of Table 6 reports the coefficients of Woman Win from the placebo sample—that is, the change in the number of women directors prior to the election in the same zip code. Most of the coefficients are not significant. The exception is at the smallest bandwidth (0.05), where the coefficient is significant for some control functions. Even in these cases, however, the estimated coefficient is significantly smaller for the placebo sample than for the treated sample. Panel C reports the z values of a test for the difference between the coefficients estimated in the treated and placebo samples and shows that those for the treated sample are significantly larger.Footnote 17
2. Controlling for Google Search Trends
Giannetti and Wang (Reference Giannetti and Wang2023) document that heightened public attention to gender equality is associated with an increase in board gender diversity. To see if public attention to gender equality explains some of our results, we follow Giannetti and Wang (Reference Giannetti and Wang2023) and use Google Search Trends data on “gender equality” to construct two variables: Gender Equality SVI and Gender Equality SVI (State). Footnote 18 We estimate our base specification including these variables as covariates. As seen in Panel A1 of Table 9, inclusion of Gender Equality SVI (State) does not materially change the results, as the coefficient of Woman Win is significant for the year after the election (Post = 1) and insignificant for the year prior (Post = 0). Panel A2 shows that the inclusion of Gender Equality SVI as a covariate leads to similar results.Footnote 19 Overall, these results suggest that controlling for public attention (as captured by Google Trends data) does not materially impact the results.

TABLE 9 Long description
The table is divided into five panels, A through E. Each panel compares results for Post equals 1 and Post equals 0 across two sub-categories.
Panel A, Public Attention to Gender Equity, shows that when a woman wins, the S V I state and S V I scores are significantly positive at 0.245 and 0.228 respectively for Post equals 1, while Post equals 0 results are near zero and statistically insignificant. Z scores for the difference are 3.39 and 2.76.
Panel B, Presidential Election Cycle, shows Woman Win coefficients of 0.209 for Presidential cycles and 0.249 for Nonpresidential cycles when Post equals 1. The Z score is significant only for Nonpresidential cycles at 2.66.
Panel C, Alternate Measures of Board Diversity, measures the change in the fraction of female directors. For both All Directors and Independent Directors, the Woman Win coefficient is significant at 0.021 and 0.025 respectively when Post equals 1. Z scores are 2.38 and 3.57.
Panel D, Female Directors on Board Committees, shows significant positive coefficients for Woman Win in both the change in number (0.142) and fraction (0.015) of female directors when Post equals 1.
Panel E, Political Affiliation of County, shows the change in number of female directors. In Democratic counties, Woman Win is 0.328 for Post equals 1 and minus 0.066 for Post equals 0. In Republican counties, it is 0.577 for Post equals 1 and 0.161 for Post equals 0. Both show highly significant Z scores above 4.1.
3. Controlling for Presidential Election Cycles
Elections that are part of presidential election cycles get higher voter turnouts, which may garner greater voter attention for the woman candidate. However, voter attention to the presidential election may also reduce the salience of House and Senate races. To examine whether the presidential election cycle affects our results, we estimate the model in separate subsamples. Results for sample elections that were part of the presidential cycle—that is, in 2004, 2008, 2012, and 2016—are tabulated in Panel B1 of Table 9, while the results for the remaining elections are tabulated in Panel B2. The coefficient of Woman Win is significant in both subsamples in the year after the election and higher than in the year prior to the election. These results show that the presidential election cycles do not have a material impact on the results.
4. Alternate Measure of Board Gender Diversity
The dependent variable is the change in the number of female directors, as we think that the addition of a woman director, irrespective of board size, is the most relevant outcome variable. However, an alternate measure of board diversity—the fraction of the board that is female—might better capture women’s overall importance on the board. We, therefore, also estimate the base specification with the change in the fraction of women directors as the dependent variable. The results, which are tabulated in Panel C1 of Table 9, are similar to those for the number of women directors, as a win by a woman candidate is associated with an increase in the fraction of women directors in the year after the election. We also construct the change in the ratio of female directors within independent directors and find that this does not change our results (see Panel C2 of Table 9).
5. Board Committees
Though regulators and institutional investors have long advocated for more women on boards, others have argued that higher board representation does not necessarily represent an increased role for women. Field, Southern, and Yore (Reference Field, Souther and Yore2020), for example, document that although the number of women on boards has increased, women are still less likely to be members of important board committees (see also Chidambaran, Liu, and Prabhala (Reference Chidambaran, Liu and Prabahala2022)). To gauge changes in the importance of women directors, we examine their membership on two important board committees: audit and compensation.Footnote 20 The outcome variable for this analysis is the change in the number of women directors on these committees in Panel D1 and the change in the fraction of women directors on these committees in Panel D2.
As seen in Panel D of Table 9, we find that the coefficient of Woman Win is positive and significant for both specifications. Firms increase the number and fraction of female directors on important board committees after close election wins by women candidates. These results point to broader gains for women directors arising from electoral wins by women candidates.
6. Democratic and Republican Counties
To examine if the results are influenced by voters’ political affiliations, we classify counties as Democratic (Republican) if they voted for the Democratic (Republican) candidate in the previous two presidential elections.Footnote 21 As seen in Panel E of Table 9, we find a significant effect of winning women candidates on board gender diversity in both samples. For Republican counties (Panel E2), we find a significant effect even prior to election, though the increase in female directors is significantly higher after the election. The results suggest that a win by women candidates is followed by increased board diversity irrespective of a county’s political affiliation.
V. Mechanisms
The underlying mechanism we propose for the results is that women’s electoral wins change gender-related social norms in the local area. Firms headquartered in the area respond to these changes by increasing gender diversity on their boards. To provide evidence for our proposed channel, we would ideally document the changes in gender norms after women’s election wins, as well as firms’ responses to those changes. This is a difficult approach, given that data on gender norms, their geographic distribution, and how they change over time are scarce. Therefore, we adopt an alternate strategy, which is to examine cross-sectional differences in the treatment effects implied by the proposed mechanism. Specifically, we first examine the election characteristics that lead to differences in the importance of gender and thus result in differing impacts on social norms and board gender diversity. Next, we examine firm characteristics that result in disparate responses to changes in local social norms. Lastly, we use the limited data available from the General Social Survey (GSS) to shed some light on changes in gender norms.
A. Election Salience
Elections differ in their impact and potential to bring about change in social norms. Campbell and Wolbrecht (Reference Campbell and Wolbrecht2006) and Wolbrecht and Campbell (Reference Wolbrecht and Campbell2017) document stronger role model effects of nonincumbent women candidates in House, Senate, and gubernatorial elections, as these elections are more important and visible. In line with their findings, our main sample consists of these elections. Below, we identify other election characteristics that are likely to have disparate effects on local gender norms.
1. House Elections Relative to Senate and Gubernatorial Elections
Senate and gubernatorial elections are more consequential than House elections and impact voters across the state. Being more visible, they increase the salience of gender and, hence, are more likely to change gender norms. We, therefore, estimate our base specification separately for firms in sample House elections and firms in Senate and gubernatorial elections. As seen in Panel A of Table 10, the results are significant for both. In line with the proposed mechanisms, however, the estimated coefficient of Woman Win is significantly higher in the year after women’s Senate and gubernatorial election wins than in the year after women’s House election wins, suggesting a higher impact of election wins in Senate and gubernatorial elections.

TABLE 10 Long description
The table is divided into three panels, all using ‘Change in the Number of Female Directors’ as the outcome variable.
Panel A: Senate/Gubernatorial Versus House Elections.
- For Post equals 1: Senate/Gov shows a Woman Win coefficient of 0.806 (t-stat 11.46) and House shows 0.276 (t-stat 3.51). The Z score difference between them is 5.02.
- For Post equals 0: Senate/Gov shows -0.026 and House shows 0.005. The Z score difference is -0.39.
- Z score comparing Post equals 1 and Post equals 0 is 11.21 for Senate/Gov and 2.48 for House.
Panel B: Media Coverage.
- For Post equals 1: High coverage shows a Woman Win coefficient of 0.250 (t-stat 4.61) and Low coverage shows 0.073 (t-stat 1.00). The Z score difference is 1.93.
- For Post equals 0: High coverage shows 0.049 and Low coverage shows 0.185. The Z score difference is -1.12.
- Z score comparing Post equals 1 and Post equals 0 is 2.40 for High and -0.88 for Low.
Panel C: Local Voter Turnout.
- For Post equals 1: High turnout shows a Woman Win coefficient of 0.267 (t-stat 6.42) and Low turnout shows 0.061 (t-stat 0.66). The Z score difference is 2.01.
- For Post equals 0: High turnout shows 0.058 and Low turnout shows 0.156. The Z score difference is -0.71.
- Z score comparing Post equals 1 and Post equals 0 is 2.13 for High and -0.67 for Low.
All panels include Industry and Year F E and covariates. Bandwidth h varies between 0.048 and 0.106 across the models.
2. Media Coverage
Elections where the woman candidate has higher visibility are more likely to bring attention to gender and to generate discussion around gender issues. Consequently, those elections may have a stronger impact on gender-related social norms. We use media coverage garnered by the woman candidate to proxy for the attention she receives and expect a stronger treatment effect on board gender diversity when the winning woman candidate has higher coverage.
We collect data, from the Dow Jones Factiva database, on the number of articles that mention the woman candidate’s name from 6 months prior to 6 months after the election. We create the High (Low) Media group consisting of all firms located in zip codes where women candidates enjoy above (below) median media coverage. To determine the median media coverage, we use only House candidates, as Senate and governor candidates receive higher media coverage on account of their races being statewide and are always classified in the High Media group.Footnote 22 In line with Meyerson (Reference Meyersson2014), the median value is determined in the sample of close elections that is used for the RD estimation (i.e., those in the 0.10 bandwidth), as this makes the split more relevant.
As seen in Panel B of Table 10, the coefficient of Woman Win for Post equal to 1 is positive and significant for the High Media group and not significant for the Low Media group, with the difference between the two groups’ coefficients being significant. Thus, the treatment effect of women’s electoral wins is confined to elections where the woman candidate is sufficiently visible. We estimate a similar specification for the placebo sample—that is, when Post is equal to 0—and find that the coefficient of Woman Win is marginally significant for the Low Media group, but not significantly different from when Post is equal to 1. In other words, the election did not change the increase in female directors for firms located in districts where women candidates receive lower media coverage.
In sum, firms in counties where winning women candidates receive high media coverage significantly increase their number of female directors in the postelection year, relative both to the prior year and to firms in counties where women candidates are less visible. These findings support a causal effect of women’s election wins on the increase in the number of women directors in this group.
3. Local Engagement with the Election
The election outcome and the information it conveys are likely to be more meaningful and to bring about more change if the voters are engaged. In districts where voters are actively involved with election issues and energized to vote, citizens are more likely to follow the election outcomes and be impacted by the woman candidate’s electoral win. We gather data on voter registration and voter turnout at the county level for the elections in our sample from David Leip’s Atlas of U.S. Presidential Elections. Firms located in counties with higher than median voter turnout (estimated in the sample of close elections within the 0.10 bandwidth) are classified as the High Turnout group; others are in the Low Turnout group.Footnote 23
The results, tabulated in Panel C of Table 10, show that the firms located in High Turnout counties increase the number of female directors more than firms in Low Turnout counties. There is no significant effect in either group in the placebo sample. The higher treatment effect when there is higher local engagement with the election supports the notion that changing local attitudes are the underlying mechanism for the observed treatment effect.
B. Firms’ Responsiveness to Local Changes
Firms differ in how closely tied they are to the local community and, hence, how much they are impacted by its changing social norms. If a large fraction of the board and senior executives reside locally and thus experience the election-induced change in gender norms, the firm may be more inclined to appoint a women director. We create two proxies (discussed below) to capture a firm’s ties to the local community.
Boards may also be more responsive to electoral wins by women candidates if they are under shareholder pressure to change. We, therefore, examine the responses of boards where some directors have negative recommendations from ISS and boards where shareholders have proposed gender-related changes.
1. Proportion of Local Directors
To capture the proportion of the board that resides locally, we use data on the residences of directors constructed through LexisNexis searches by Bernille, Bhagwat, and Yonker (Reference Bernille, Bhagwat and Yonker2018).Footnote 24 A director is characterized as being local if his or her residence is within 50 miles of the firm headquarters. On average, the firms in the 0.10 bandwidth have about 44% of the board residing locally. As before, we divide the sample into boards with a High and Low fraction of local directors, based on whether the fraction is above or below the median. As seen in Panel A of Table 11, the coefficient of Woman Win is significant for both the High and Low groups but is significantly larger for the High group.Footnote 25 While the coefficient for the High group is marginally significant prior to the election, it is still significantly lower before the election than after it, supporting a causal effect of women’s election wins in firms with a higher fraction of local directors.

TABLE 11 Long description
The table is divided into four panels, all using ‘Woman Win’ as the primary independent variable.
Panel A: Proportion of Local Directors.
Outcome: Change in the Number of Female Directors.
For Post = 1, High local directors shows a coefficient of 0.473 (t-stat 7.77) and Low shows 0.206 (t-stat 2.55).
For Post = 0, High shows 0.146 and Low shows -0.022.
Z score difference between High and Low for Post = 1 is 2.64.
Panel B: Ownership by Local Institutional Investors.
Outcome: Change in the Number of Female Directors.
For Post = 1, High ownership shows 0.510 (t-stat 9.41) and Low shows 0.197 (t-stat 3.01).
For Post = 0, High shows 0.233 and Low shows -0.003.
Z score difference between High and Low for Post = 1 is 3.68.
Panel C: I S S Recommendations and Board Responsiveness.
Outcome: Change in the Number of Female Directors.
For Post = 1, Negative I S S shows 0.517 (t-stat 14.87) and No Negative I S S shows 0.176 (t-stat 3.46).
For Post = 0, Negative I S S shows 0.335 and No Negative I S S shows -0.145.
Z score difference between Negative and No Negative I S S for Post = 1 is 5.54.
Panel D: Gender-Related Shareholder Proposals.
Outcome: Fraction of Gender-Related Shareholder Proposals.
For Post = 1, the coefficient is 0.007 (t-stat 1.97).
For Post = 0, the coefficient is -0.002 (t-stat -0.70).
Z score between Post = 1 and Post = 0 is 2.02.
All panels include Industry and Year Fixed Effects (F E) and covariates with a bandwidth of 0.10 (except Panel D which uses 0.062 and 0.068).
2. Local Institutional Investors
Like local directors, local shareholders are likely to make the firm more aware and responsive to local changes. Local institutional investors, in particular, have been shown to be more effective monitors, as they are more informed about firm policies and share social networks with the firm’s executives (Chhaochharia, Kumar, and Niessen-Ruenzi (Reference Chhaochharia, Kumar and Niessen-Ruenzi2012) and Gasper and Massa (Reference Gasper and Massa2007)). Local institutional investors are also associated with higher firm CSR activities (see Chang, Kabongo, and Li (Reference Chang, Kabongo and Li2016)) and may be more likely to initiate a discussion with the firm regarding board diversity. The greater the influence of local institutional investors, the larger the expected treatment effect of women’s electoral wins.
We get the zip codes of mutual funds’ locations from the CRSP mutual fund database and match the CRSP database with the Thomson Reuters mutual fund holdings database using the MFLINKS file. We calculate the firm’s fractional ownership of local institutional shareholders and use it as a proxy for institutional shareholders’ influence. Local institutions are defined as mutual funds located within 50 miles of the firm’s headquarters. As before, we divide the sample into High and Low groups based on the median values in a sample of firms within 0.10 bandwidth. As seen in Panel B, the coefficient of Woman Win is significant for both the High and Low groups, but it is significantly higher for the High group than for the Low group. We find that the coefficient of Woman Win is also significant in the placebo sample for the High group. As seen in Table 7, there is no discontinuity in institutional ownership around the cutoff; that is, firms in counties where women win or lose by a small margin do not differ in their institutional ownership. Thus, high local institutional ownership isolates areas where firms were increasing women directors even prior to women candidates’ election wins.Footnote 26 However, as the estimated coefficient is significantly higher after the election than before it, women’s electoral wins still causally increase the number of women directors.
3. Negative ISS Recommendations
ISS recommendations have a significant impact on shareholder voting. Malenko and Shen (Reference Malenko and Shen2016) document that a negative ISS recommendation results in a 25% drop in shareholder support. Negative ISS recommendations and low shareholder support have been shown to have negative consequences for directors (see Cai, Garner, and Walkling (Reference Cai, Garner and Walkling2009), Fos, Li, and Tsoutsoura (Reference Fos, Li and Tsoutsoura2018), and Aggarwal, Dahiya, and Prabhala (Reference Aggarwal, Dahiya and Prabhala2019)). Directors that have negative recommendations from ISS are likely to be alert to and responsive to changes in the firm’s environment in order to improve their standing with shareholders.
We construct a (No) Negative ISS dummy, which takes the value of 1 if at least one (no) director has a negative recommendation from ISS. In line with the notion that boards with a director who has a negative recommendation are likely to be more responsive, we find that such boards are significantly more likely to increase the number of female directors after women candidate’s election wins, as seen in Panel C of Table 11. This increase is significantly higher than what was seen in these firms in the prior year and significantly more than what is seen for boards with no negative ISS recommendation.Footnote 27 These results suggest that boards under pressure are more vigilant and responsive to changes in their environment.
4. Gender-Related Shareholder Proposals
To study whether shareholders exert more pressure to improve gender diversity following wins by women candidates, we also examine the shareholder proposals submitted to firms.
We get shareholder proposal data from ISS Risk Metrics and identify gender-related proposals as those with “gender,” “diversity,” “women,” and other related words in their description.Footnote 28 We then examine if electoral wins by women candidates are associated with more gender-related shareholder proposals. The outcome variable Fraction of Gender Related Shareholder Proposals is the fraction of all shareholder proposals that are gender-related. As shown in Panel D, the coefficient of Woman Win is positive and significant in the year after the election and not significant in the year prior to the election.Footnote 29
The results suggest that firms receive more gender-related shareholder proposals after women’s election wins. Shareholder proposals may be a channel through which local shareholders influence firm behavior, but these results should be interpreted with caution for two reasons. First, the incidence of gender-related shareholder proposals is low, as only about 1% of shareholder proposals are gender related. Second, data limitations prevent us from knowing the location of the shareholder submitting the proposal. Therefore, though we see a higher fraction of gender-related shareholder proposals, we cannot say that they were submitted by local shareholders.Footnote 30
C. Change in Gender Norms
In this section, we examine changes in gender norms arising from women candidates’ electoral wins. To capture changes in attitudes, we use data from GSS and focus on three questions that capture gender norms and were consistently asked over several decades.Footnote 31 These questions, which are referenced in the GSS survey as fefam, fechld, and fepressh, were included in the surveys from 1977 to 2010 (see Appendix B for details).
We examine change in gender norms from 1990 to 2010, as this is the longest period of overlap between the election data and the GSS survey. Since the responses to the GSS questions are available only at the state level, we include only gubernatorial and Senate elections, both of which are statewide. In line with prior analysis, we only include elections where a nonincumbent woman candidate runs against a male candidate. We convert the responses to the three questions to a numeric value, with larger values indicating pro-female attitudes. We average the responses of all respondents in the state and across all three questions and then calculate the change after the election (for Post = 1) and prior to the election (Post = 0). To ensure that we compare change in gender attitudes for the same state around elections, we include an election in the sample only if we have an observation for the state for both Post = 1 and Post = 0.
The final sample comprises 46 elections, with women losing 27 and winning the rest. As the sample is small, we cannot implement an RD design. We report the results from an OLS regression in Table 12. As seen in columns 1 and 2, the coefficient of Woman Win is positive and significant after the election (Post = 1) but not before it (Post = 0), and the two coefficients are significantly different from each other. The change in response is significant for the question fepresch (columns 3 and 4) but not for the other two questions.

TABLE 12 Long description
The table is organized into nine columns. The first column lists the Dependent Variables and statistical metrics, while columns 2 through 9 are grouped in pairs under four main categories: Change in Overall Response, Change in f e p r e s c h Response, Change in f e c h l d Response, and Change in f e f a m Response. Each category compares Post equals 1 and Post equals 0.
* Intercept Row: Values for Post equals 1 across the four categories are minus 0.057, minus 0.067, minus 0.059, and minus 0.047. Values for Post equals 0 are 0.027, 0.029, 0.011, and 0.042.
* Woman Win Row: Values for Post equals 1 are 0.108 asterisk, 0.184 double asterisk, 0.099, and 0.039. Values for Post equals 0 are minus 0.054, minus 0.040, minus 0.039, and minus 0.082.
* Number of observations: All columns report 46.
* R super 2 percentage: Values for Post equals 1 are 5.9, 12.0, 4.1, and 0.5. Values for Post equals 0 are 2.3, 1.1, 0.9, and 2.4.
* Z score (Post equals 1 and Post equals 0): Reported only for the Post equals 1 columns as 1.93 asterisk, 2.32 double asterisk, 1.45, and 1.07.
The sample size is small, and although the results for all three gender-related questions are in the same direction, they are significant for only one of them. The results thus provide a tentative indication of a change in gender-related social norms.
D. Alternate Mechanisms
Brogaard et al. (Reference Brogaard, Gersimova and Rohrer2024) document that winning women candidates increase the proportion of U.S. government contracts that go to women-owned business and that this effect increases with the female representative’s tenure and if she is on a powerful congressional committee. This suggests that boards could increase the number of female directors in anticipation of female-friendly regulatory policies. As documented before, we find that the treatment effects are mostly confined to visible women candidates and are seen in local firms. If expectation of women-friendly regulation is the underlying mechanism, the effect on board diversity should be related to all wins by women and not confined to women that had greater visibility. Further, the effect should be seen for all firms and not just local ones.
To further explore this mechanism, we examine elections involving incumbent women candidates, which have been excluded from our analysis so far. Incumbent women candidates are likely to be more senior and more established, and their wins should further solidify their position and increase the likelihood of pro-female policies. In our test, however, we find no evidence of a change in female directors after wins by incumbent women candidates (see Table A1). As these are established women, their election wins do not generate a discussion on gender (Wolbrecht and Campbell (Reference Wolbrecht and Campbell2017)) and, hence, have little impact on local gender norms, which is in line with our proposed mechanism.

TABLE A1 Long description
Panel A presents results from O L S Regression. The outcome variable is the Change in the Number of Female Directors. It is divided into Panel A 1 for Win Margin less than or equal to 5 percent (columns 1 and 2) and Panel A 2 for Win Margin less than or equal to 10 percent (columns 3 and 4).
* Incumbent Woman Win: 0.050 (1.49) in col 1, 0.056 (1.35) in col 2, 0.059** (2.31) in col 3, and 0.073** (2.07) in col 4.
* Incumbent Woman Win times Post: -0.027 (-0.54) in col 1, -0.020 (-0.42) in col 2, -0.047 (-0.80) in col 3, and -0.044 (-0.75) in col 4.
* Post: 0.048 (1.54) in col 1, 0.045 (1.76) in col 2, -0.037 (-0.38) in col 3, and -0.025 (-0.28) in col 4.
* Intercept: -0.504 (-14.54) in col 1, 1.082 (0.64) in col 2, -0.427 (-3.95) in col 3, and 1.752 (1.06) in col 4.
* R-squared values range from 0.06 to 0.15. All columns include clustering of errors by state, industry fixed effects, and year fixed effects. Covariates are included in columns 2 and 4. Number of observations is 636 for A 1 and 974 for A 2.
Panel B presents results from R D Estimation. It is divided into Panel B 1 for Post equals 1 (columns 1 and 2) and Panel B 2 for Post equals 0 (columns 3 and 4). All columns use a Linear regression function and a Bandwidth h of 0.100.
* Incumbent Woman Win: -0.072 (-0.25) in col 1, -0.244 (-0.79) in col 2, -0.056 (-0.19) in col 3, and -0.122 (-0.46) in col 4.
* Kernel: Triangular in cols 1 and 3; Uniform in cols 2 and 4.
* Number of observations is 485 for B 1 and 487 for B 2.
* Z score for Post equals 1 and Post equals 0 is -0.04 in col 1 and -0.30 in col 2.
It is also possible that the newly appointed female directors are politically connected to the winning woman candidate and represent the local firm’s attempt to build political connections rather than its response to a change in local gender norms. To study this, we searched for and obtained data on the background of all the new women directors. Most had corporate backgrounds, with some being attorneys, consultants, or advisors. We found little evidence that they had political backgrounds or were politically connected to the winning woman candidate.
VI. Conclusion
We use an RD design to document a causal effect of women candidates’ electoral wins on increasing the number of female board directors at firms located in these zip codes. The underlying mechanism we propose for this result is that women’s electoral wins change gender-related social norms in the local area, and firms headquartered there respond by increasing the gender diversity on their boards. We find support for this mechanism. The treatment effect varies in measures of the election’s consequence, the woman candidate’s visibility, and local voters’ engagement with the election, which suggests that elections with a greater potential for social change produce higher treatment effects. The treatment effect is also higher when the firm is more likely to be integrated with, and responsive to, the local community, which further supports the notion that the treatment effect arises from local changes in norms.
A growing literature documents the effect of gender-related norms on firm policies, and this study contributes by being one of the few that examine a mechanism for bringing about change in underlying gender norms. The effect of women candidates’ electoral wins on board gender diversity does not involve regulatory mandates or other forms of external pressure. As the effect of electoral wins is organic and voluntary, it has the potential to bring about broader gains for women. Evidence of the spillover of gender attitudes from the political to the corporate world links the literatures on each and suggests that even small changes toward gender equality in one dimension may have larger overall impacts on reducing the gender gap.
Appendix A. Data Sources and Variable Construction
- Woman Win Margin
-
The vote share of the woman candidate minus the vote share of the male candidate. Source: MIT Election Lab, Rutgers CAWP, David Leip’s Atlas.
- Woman Win
-
An indicator variable that takes the value of 1 if the woman wins the election. Source: MIT Election Lab, Rutgers CAWP, David Leip’s Atlas.
- Change in the number of female directors
-
Year over year change in the number of female directors. Source: ISS Risk Metrics Board Data.
- Change in the proportion of female directors
-
Year over year change in the fraction of the board that consists of female directors. Source: ISS Risk Metrics Board Data.
- Change in the number of female committee members
-
Year over year change in the number of female committee members. The committees considered are audit and compensation. Source: ISS Risk Metrics Board Data.
- Fraction of gender-related shareholder proposals
-
Fraction of all shareholder proposals that refer to gender-related issues. Source: ISS Shareholder Proposal Data.
- Total assets
-
Total assets (millions). Source: Compustat.
- ROA
-
Return on assets: operating income/total assets. Source: Compustat.
- IO
-
Institutional ownership, measured as the fraction of shares outstanding held by institutional investors. Source: 13F, Thomson Reuters.
- Lagfdir
-
Lagged value of the number of female directors on the board. Source: ISS Risk Metrics Board Data.
- Lagfcomm
-
Lagged number of female directors on the audit and compensation. Source: ISS Risk Metrics Board Data.
- Log (PI)
-
Log of personal income per capita at the county level. Source: Bureau of Economic Analysis (BEA).
- Log (Pop)
-
Log of total population at the county level. Source: Bureau of Economic Analysis (BEA).
- PCT women
-
Proportion of women at the county level. Source: SEER data (https://seer.cancer.gov/popdata/).
- Female-to-male income ratio
-
Female-to-male income ratio at the county level. Source: American Community Survey data.
- Female labor force participation
-
Percentage of total number of working age women in the labor force at the county level. Source: American Community Survey data.
- Male labor force participation
-
Percentage of total number of working age men in the labor force at the county level. Source: American Community Survey data.
- Female unemployment rate
-
Percentage of female labor force that is unemployed at the county level. Source: American Community Survey data.
- Male unemployment rate
-
Percentage of male labor force that is unemployed at the county level. Source: American Community Survey data
- Media coverage
-
Number of articles that mention the woman candidate during 1 year around the election. Source: Factiva.
- Local election turnout
-
County-level voter turnout. Source: David Leip’s Atlas of Presidential Elections.
- Local support for the woman candidate
-
Fraction of campaign contributions received locally by the woman candidate—fraction of campaign contributions received locally by the male candidate. Source: FEC website.
- Proportion of local directors
-
Fraction of directors that reside within 50 miles of the firm’s HQ. Source: Scott Yonkers Data.
- Number of local institutional investors
-
Number of institutional investors that are within 50 miles of the firm’s HQ. Source: CRSP Mutual Fund Data.
- Ownership by local institutional investors
-
Ownership by institutional investors that are within 50 miles of the firm’s HQ. Source: CRSP Mutual Fund Data, Thomson Reuters Mutual Fund Holdings Data.
Appendix B. Details About the GSS Survey
The following three questions from the GSS survey were included to capture gender norms and changes in gender norms.
Fefam: It is much better for everyone involved if the man is the achiever outside the home and the woman takes care of the home and family.
Years included in GSS: 1977, 1985, 1986, 1988, 1989, 1990, 1991, 1993, 1994, 1996, 1998, 2000, 2002, 2004, 2006, 2008, 2010.
Fechld: A working mother can establish just as warm and secure a relationship with her children as a mother who does not work.
Years included: 1977, 1985, 1986, 1988, 1989, 1990, 1991, 1993, 1994, 1996, 1998, 2000, 2002, 2004, 2006, 2008, 2010.
Fepresch: A preschool child is likely to suffer if his or her mother works.
Years included: 1977, 1985, 1986, 1988, 1989, 1990, 1991, 1993, 1994, 1996, 1998, 2000, 2002, 2004, 2006, 2008, 2010.
Calculating Change in Gender Norms
The table details the years of the GSS survey used to calculate the change in responses around elections. Column 1 lists the election year in the sample. Column 2 (3) lists the years over which we estimate the Post- (Pre-) election change in gender norms.

Long description
The table consists of three columns: Election Year, Post-election Change (Post equals 1), and Pre-election Change (Post equals 0).
* 1990: Post-election 1990 to 1993, Pre-election 1988 to 1990.
* 1992: Post-election 1993 to 1994, Pre-election 1990 to 1991.
* 1994: Post-election 1994 to 1996, Pre-election 1991 to 1994.
* 1996: Post-election 1996 to 1998, Pre-election 1994 to 1996.
* 1998: Post-election 1998 to 2000, Pre-election 1996 to 1998.
* 2000: Post-election 2000 to 2002, Pre-election 1998 to 2000.
* 2002: Post-election 2002 to 2004, Pre-election 2000 to 2002.
* 2004: Post-election 2004 to 2006, Pre-election 2002 to 2004.
* 2006: Post-election 2006 to 2008, Pre-election 2004 to 2006.
* 2008: Post-election 2008 to 2010, Pre-election 2006 to 2008.
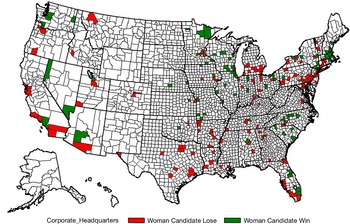
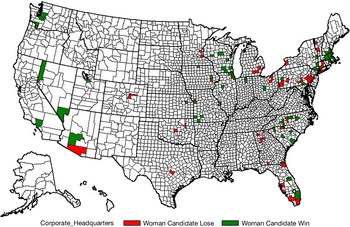
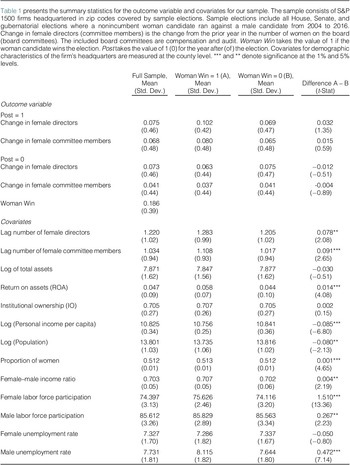
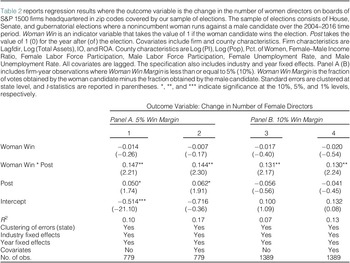
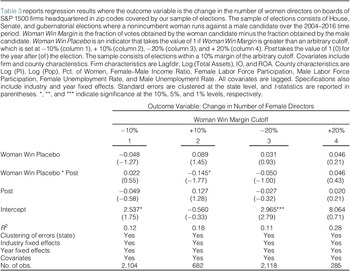
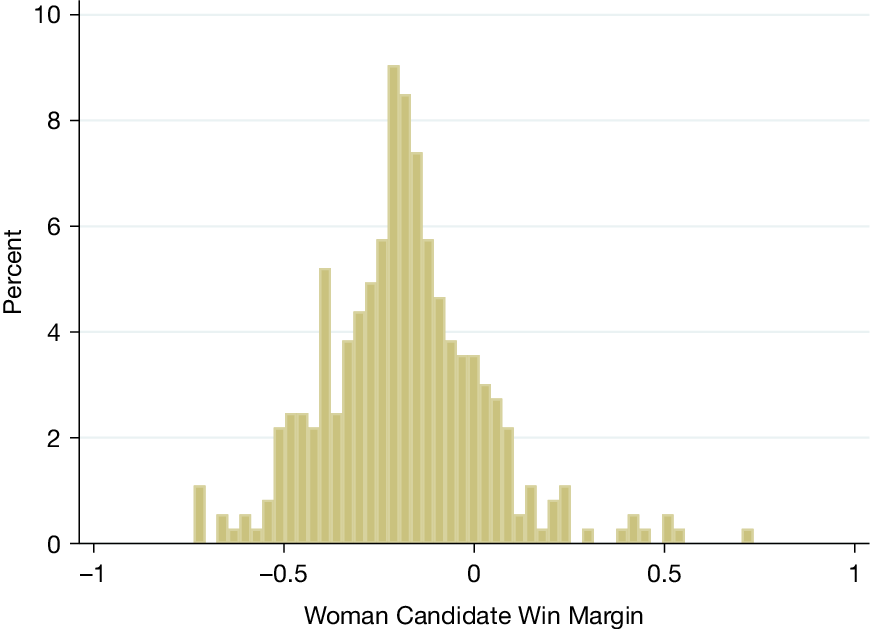
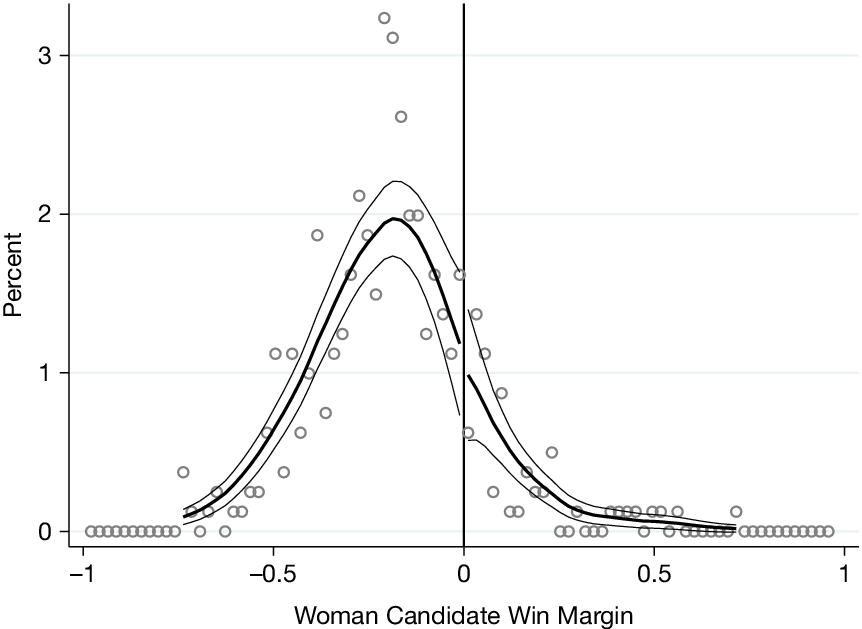
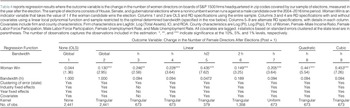
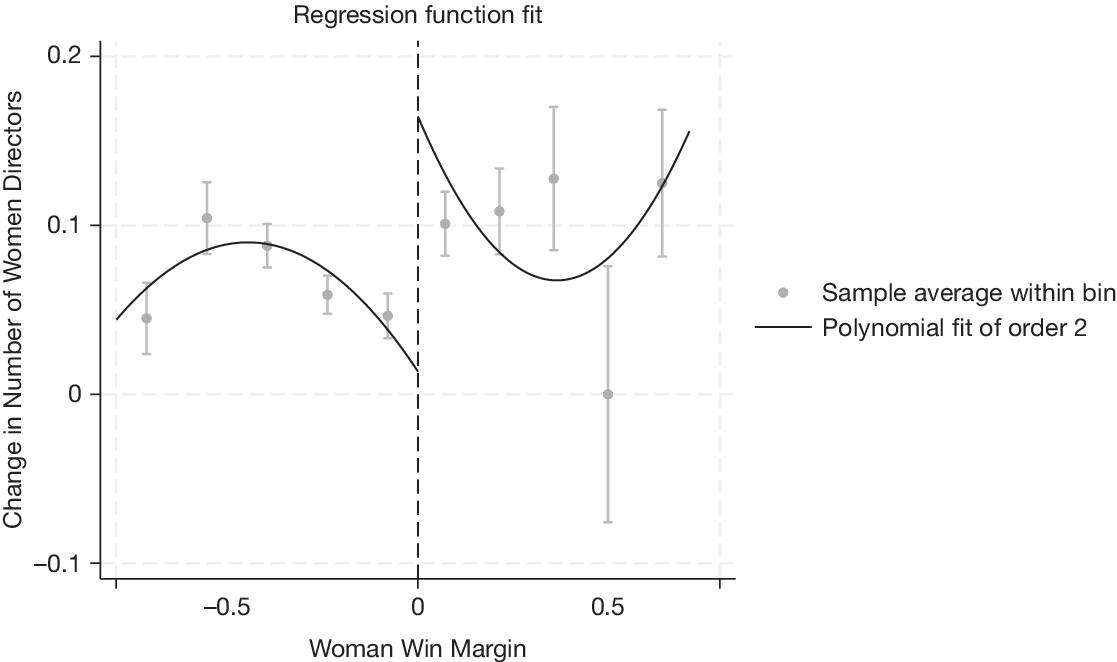
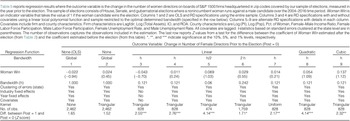
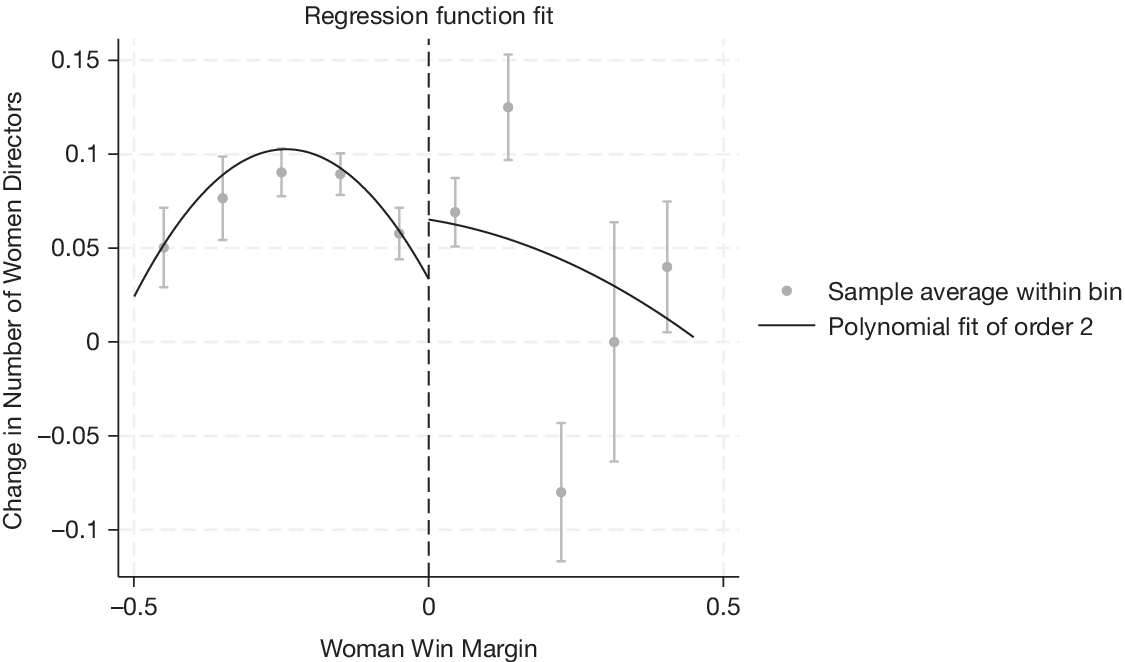
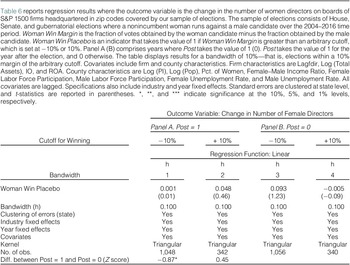
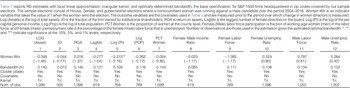
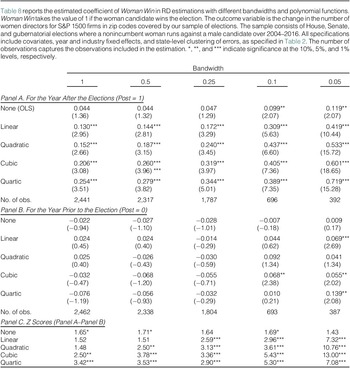
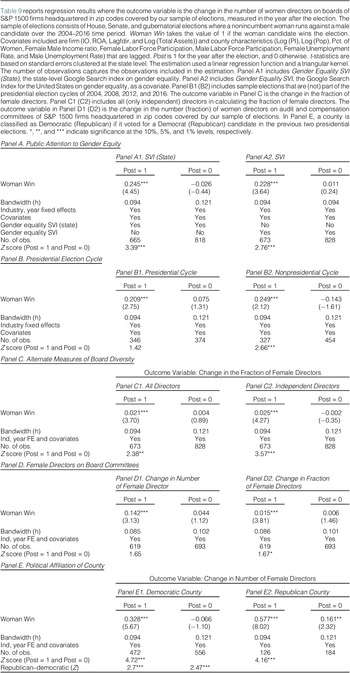

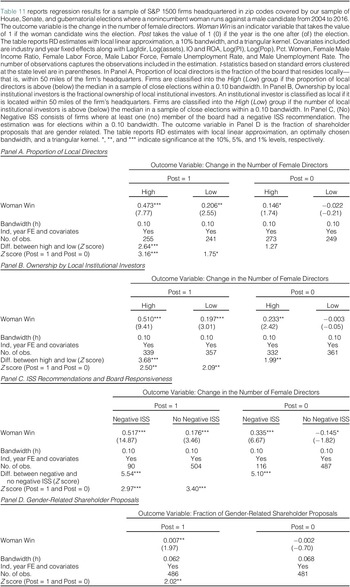
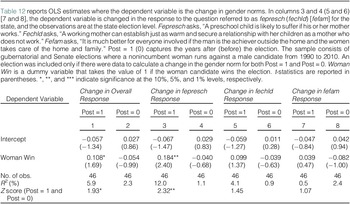
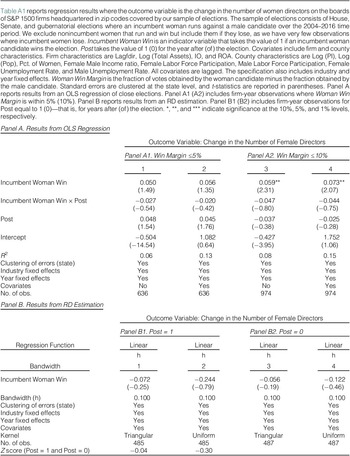

 Open access

