

INTRODUCTION
Supraglacial lakes are found in the surface layer of ice sheets and glaciers. They can be classified into ‘warm-environment’ lakes where the surface is at the melting stage, and ‘cold- environment lakes’ where the surface temperature is below the melting point. This research focuses on the largely overlooked cold-environment supraglacial lakes using data gathered in western Dronning Maud Land, Antarctica. These cold-environment supraglacial lakes behave quite differently from warm-environment supraglacial lakes, which are widespread in Greenland (Liang and others, Reference Liang2012).
A necessary condition for the formation of cold-environment supraglacial lakes is that solar radiation is able to accumulate heat below the surface enough to warm up and melt ice. Therefore, these lakes are found in blue-ice areas (Winther and others, Reference Winther, Elvehøy, Bøggild, Sand and Liston1996; Hoffman and others, Reference Hoffman, Fountain and Liston2008; Leppäranta and others, Reference Leppäranta, Järvinen and Mattila2013b) where albedo is low and transparency of ice is good. In the Dronning Maud Land, such blue-ice areas are typically found on the lee side of mountains. The mass balance of these lakes is simple, consisting of sublimation and compensating upwelling flow of ice.
Cold-environment supraglacial lakes are covered by ice, since longwave radiation and turbulent heat losses overcome the surface absorption of solar heat. This corresponds to the cool skin phenomenon in open water lakes and oceans in lower latitudes. The thickness of the surface ice layer is at its minimum at the peak of the summer. Resulting from local glacial melt, the lake water is very clear and possesses extremely low levels of geochemical impurities (Lehtinen and Luttinen, Reference Lehtinen, Luttinen and Ojala2005) and biota (Keskitalo and others, Reference Keskitalo, Leppäranta and Arvola2013). The lake body is an ice/water mixture and consists of two layers: an upper water/slush layer, and a lower layer with soft and hard sub-layers and sediments at the bottom (Leppäranta and others, Reference Leppäranta, Järvinen and Mattila2013b).
In fall, cold-environment supraglacial lakes start to freeze downwards from the upper surface, as lakes usually do (e.g. Leppäranta, Reference Leppäranta2015), and upwards from the bottom. In principle it is possible that pockets of liquid water survive over the winter, and then the supraglacial lake would become perennial. Thus far, this pattern has not been reported from field investigations in the Dronning Maud Land. In any case, cold-environment supraglacial lakes are sensitive to climatic conditions and thereby assist detection of regional climate change, but not much of their climate response is known from Antarctica.
In this research, one cold-environment supraglacial lake, Suvivesi in the western Dronning Maud Land was examined for the mass and heat balance. The work is a part of our ongoing research of proglacial lakes in the region. Fieldwork was carried out during the austral summers 2004/05, 2010/11 and 2014/15. In recent papers, Keskitalo and others (Reference Keskitalo, Leppäranta and Arvola2013) analysed water samples for abundance and species of plankton, and Leppäranta and others (Reference Leppäranta, Järvinen and Mattila2013b) examined the lateral and vertical evolution of the lake structure. In the present paper, the mass and heat balances are examined, with surface balance and solar heating also studied separately to better understand the life history and scaling of cold-environment supraglacial lakes.
MEASUREMENT CAMPAIGN
Site
The fieldwork was carried through in FINNARP (Finnish Antarctic Research Programme) expeditions in the vicinity of the Research Station Aboa during December–January 2004/05, 2010/11 and 2014/15. The station is situated in Vestfjella mountain ridge on Basen nunatak (height 584 m a.s.l.), near the grounding line of the Riiser-Larsen Ice Shelf in the Weddell Sea, ~125 km inland from the shelf edge. The length and width of Basen are 4 km and 1–2 km, respectively, and the nunatak is oriented southwest–northeast. In summer (December–January), the mean air temperature is −5.4°C, and the mean wind speed is 5.9 m s−1 at the Aboa Weather Station on Basen (Kärkäs, Reference Kärkäs2004). The dominant wind direction is northeast throughout the year due to local topography and easterly winds that are associated with the cyclones traveling eastwards parallel to the coast (Reijmer, Reference Reijmer2001; Kärkäs, Reference Kärkäs2004). Katabatic winds show up as a weak secondary peak in the wind directions.
Lake Suvivesi is located southwest of Basen at 73°02.8′S 13°28.7′W, 200 m a.s.l., on the lee side of the dominant winds (Fig. 1). The lake extends 4.4 km out from Basen, its maximum width is 1.9 km and its surface area is 3.61 km2. The surface of this lake is mostly bare caused by the lee turbulence. It forms and grows from patches (Leppäranta and others, Reference Leppäranta, Järvinen and Mattila2013b), and therefore it is difficult to determine the exact evolution of the surface area. The lake has formed every summer at least since 1990. Its lateral extent has not varied much but the production of liquid water in the vertical has varied by a factor of two at least.
(a) Part of the TERRA/ASTER image from 8 November 2001, showing the Basen nunatak and the snow-free surfaces with black and the blue-ice area with grey, southwest from the nunatak; the location of Aboa station is marked with a circle (© NASA). (b) Map of western Dronning Land with the location indicated in the small Antarctic chart. (c) Surface photograph of Lake Suvivesi, showing also household water pumping for Aboa station.

The lake is classified as an ultra-oligotrophic lake with very clean water and very low level of algae (Keskitalo and others, Reference Keskitalo, Leppäranta and Arvola2013). In mid-summer, the ice and water temperature are very close to 0°C down to 3 m depth, except that in the surface ice lower values (from −3 to −1°C) are observed due to surface heat losses. Electric conductivity is ~5 µS cm−1 (at 25°C reference), i.e. fulfils the requirement of purified water and is one order of magnitude lower than in clear lake waters.
Data material
Lake Suvivesi was visited weekly for observations and sampling, and an automated radiation station was deployed in the lake. The station was equipped with sensors above ice and in the water/slush body of the lake, recording the net radiation at the surface (based on all solar and longwave components), the spectrally integrated incoming and outgoing solar radiation at the surface, and quantum photosynthetically active radiation (PAR; 400–700 nm band) level in the lake down to 1 m depth. The recording time interval was 10 min. Net radiation was measured with a Kipp & Zonen NR Lite net radiometer; the spectral range was 200–105 nm. The instrument was mounted on the end of a pole, which was clamped onto a tripod with sensor head ~1 m above the ground. Downwelling and upwelling solar planar irradiances above the surface were measured with a Middleton EP-16 pyrano–albedometer system (spectral range 0.30–3.0 µm). The instrument is a modified thermopile pyranometer with an additional inverted sensor assembly. It was mounted close to the net radiometer in a similar manner. The PAR data were recorded by installing small (118 mm × 19 mm) cylindrical sensors (MDS-L, Alec Electronics Co. Ltd., Japan) in the lake body. These data provided the light attenuation coefficient.
The basic structure of the lake was mapped by drilling with a Kovacs drill (diameter 55 mm) for the layers of solid ice, water and slush (Fig. 2), and ice samples were taken with a core drill from the surface down to 1–2 m beneath the lake bottom into the solid ice sheet. The cores provided information about the lake history, crystal structure of ice and impurities. Lake geochemistry was mapped by regular sampling, and biological productivity was also examined in 2014/15.
Vertical profiles of Lake Suvivesi in the summers 2004/05, 2010/11 and 2014/15.

Weather data (air temperature, pressure, solar radiation, humidity, and wind speed and direction) were provided by Aboa weather station, located on Basen at 497 m altitude, ~300 m above Lake Suvivesi (see Kärkäs, Reference Kärkäs2004) and the automatic weather station-5 (AWS-5) located on the ice sheet was 10 km southeast from Aboa (see Van den Broeke and others, Reference Van den Broeke, Reijmer and Van de Wal2004). Air temperature, humidity and wind speed were taken from these data to estimate the turbulent fluxes over the lake. These fluxes were estimated using data from Aboa and AWS-5 weather stations. A flux profile method by Launiainen and Vihma (Reference Launiainen and Vihma1990) was adapted, based on the Monin–Obukhov boundary-layer theory and accounting for the stability of the stratification. In 2014/15 an attempt was made to measure the latent heat flux directly using an icebox, in the same manner as evaporation is measured from pans in hydrology. The box was made of transparent plastic and had lateral dimensions of 17.1 cm × 28.3 cm, and the height was 7.3 cm. The basin was filled with lake water and frozen in a freezer.
RESULTS
Mass budget
Supraglacial lakes are characterized as water bodies consisting of slush – ice pieces and liquid water – with varying ice and water proportions (Fig. 2). The mixture is described by its porosity ν = ν(x, y, z; t), which equals the relative volume of liquid water. In solid ice ν = 0, and in liquid water ν = 1. At ν = ν 0 ~ 1/2 solid ice loses its integrity, and a convenient definition of slush would be ν > ν 0, where mechanical strength is left just to resist the buoyancy but to provide no resistance to hand tool penetration. When the resistance is removed, slush rises up and melts. The structure can thus be idealized as a two-layer system: upper layer of liquid water and slush, and a lower layer of solid ice and slush sub-layers (Leppäranta and others, Reference Leppäranta, Järvinen and Mattila2013b).
We took the boundaries of a supraglacial lake defined by a box, large enough to contain the liquid water at its maximum extent. The lateral boundaries are fixed but mass and heat fluxes occur at the vertical boundaries. The top surface is always the lake/air interface, whether the lake has ice cover or not, the bottom surface is deep enough so that all solar radiation is absorbed within the box. In blue-ice regions, mass is lost by sublimation and any new snow flux must be drifted away to keep the surface bare. Thus, the surface mass balance of the lake is
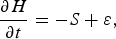 $$\displaystyle{{\partial H} \over {\partial t}} = - S + \varepsilon, $$
where H is the depth of the lake box, t is time and S is sublimation taken as ice equivalent, and ε is snow flux, which here averages to zero over synoptic timescales. The surface mass loss is compensated by upward flow of ice.
The latent heat loss averaged to 23.6 W m−2 in the three study seasons corresponding to sublimation by 0.79 mm d−1. In the individual seasons this was 0.92 mm d−1 in 2004/05, 0.93 mm d−1 in 2010/11, and 0.50 mm d−1 in 2014/15. This sublimation summed up to 5–10 cm during the summer season of 2–3 months.
In summer 2014/15 we measured sublimation also directly using the icebox. The box was deployed on 22 December and recovered on 27 January. The weight loss due to sublimation was 1.030 kg during the period of 36 d, averaging to 0.69 mm d−1 over the basin area. In this experiment the accuracy of the method was too low for higher frequencies, but the method is feasible and can be further developed.
In the beginning of summer, an extreme case of sublimation was observed in a small pond on top of Basen. Between 29 November and 5 December there was a 10 cm loss of ice from the surface, observed on the basis of vertical position of old pieces of cyanobacterial mats. During this period no surface melting is anticipated to have occurred, but there was an extreme storm with wind velocities exceeding 30 m s−1. The very high sublimation (10–15 mm d−1) was due to the storm wind and presumably also due to the absorption of solar heat by the cyanobacterial mats common in the ice. As a result they likely warmed the ice, increasing the saturation water vapour pressure at the surface.
Heat budget
In the lake body, heat gains and losses result primarily in phase changes, i.e. changes in the porosity. At 0 < ν < 1 the slush temperature is not far from 0°C: ice/water mixture is in general at the freezing point but in temperature soundings water temperatures up to 0.5°C were observed in liquid water pockets. This likely resulted from slow molecular diffusion and was checked with two well-protected thermometers. Since heat flows in the lake primarily in the vertical direction, fluxes through the lateral boundaries were ignored. The upper boundary is the lake surface (lake/atmosphere interface). The heat budget of the lake can then be expressed as
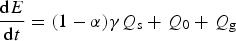 $$\hskip-54pt \displaystyle{{{\rm d}E} \over {{\rm d}t}} = (1 - \alpha )\gamma Q_{\rm s} + Q_0 + Q_{\rm g} $$
 $$Q_0 = (1 - \alpha )(1 - \gamma )Q_{\rm s} + Q_{\rm L} + Q_{\rm h} + Q_{\rm e}, $$
where E = E(x, y; t) is the heat content of the lake per unit area, Q s is incoming solar radiation, α is albedo, γ is the fraction of net solar radiation penetrating through ice surface, Q 0 is the surface heat balance, Q g is the heat flux from the deeper ice sheet, Q L is the net longwave radiation, Q h is the sensible heat flux, and Q e is the latent heat flux.
The accuracy of the heat balance is good. Incoming and outgoing solar radiation were measured, and their accuracy on the basis of temperature sensitivity, nonlinearity and sensor tilt can be estimated to be better than 3%. Much of this is removed by long-term averaging; also note that the horizontal orientation of the sensors was checked daily. This serves also for the net radiation. Therefore, neither albedo nor atmospheric emissivity is a problem for the radiation components. The turbulent fluxes were estimated from atmospheric data, and due to the local summer weather characteristics, the main source of inaccuracy is in the wind speed, which can be taken as 25%; the fluxes are approximately proportional to the wind speed. Another strength in the data is that the observed evolution of the liquid water volume serves as the control condition to the sum of external heating.
Table 1 shows the components of the mean summer heat balance. It is convenient to choose the reference (E 0) of the heat content to solid ice at 0°C and choose the box depth, H = 10 m, since there the temperature is equal to the annual mean temperature. This temperature is −15°C at Lake Suvivesi. Then E = E 0 + ΔE, and using Eqns (2a), (2b) the evolution of the term ΔE can be integrated. For heat flux of 35 W m−2, a 1 cm ice layer at 0°C melts in 1 d. Increasing the temperature of 1 cm ice layer by 1°C in 1 d needs just 0.22 W m−2.
Components of the heat budget in W m−2. Bold italics refer to the totals of the surface balance and net heating, The data of Lake Suvivesi are from three summers (December–January).
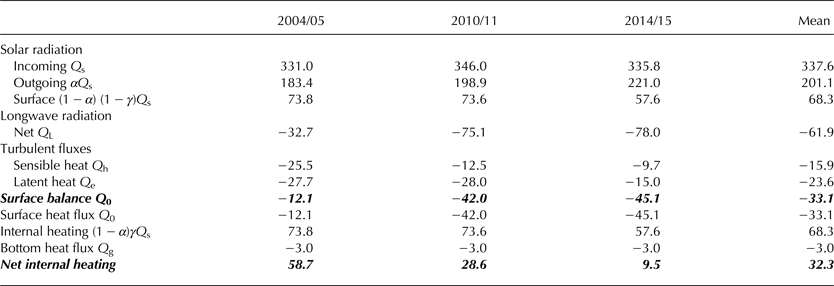
For the temperature change from 0 to −15°C across the 10 m depth, the bottom heat flux would be Q g = −3 W m−2, which is one order of magnitude smaller than the surface heat flux and direct solar heating. Its variations are anticipated small, and therefore we can fix the bottom heat flux to this level.
Albedo of the lake was close to 0.6, (0.55, 0.57 and 0.66 in the 1st, 2nd and 3rd seasons, respectively). The fraction γ was not possible to obtain from the present data, but it is known to be within 0.45–0.5 (see Curry and Webster, Reference Curry and Webster1999). Here the upper level of 0.5 was chosen due to the good transparency of the ice. Absorption of solar radiation at the surface and in the lake body was then determined. The mean incoming radiation was nearly the same in the three summers (330–350 W m−2) and significant differences to the net flux resulted from the albedo. The average net solar radiation was 137 W m−2.
Solar radiation was counteracted by longwave radiation and turbulent heat fluxes. Net longwave radiation averaged to −62 W m−2. As usual it was the dominant loss term and showed only minor short-term variability. The average surface balance of radiation was slightly positive, 6.4 W m−2. It is anticipated that sensible heat flux is small in ice-sheet environment, since the air temperature does not deviate much from the ice surface temperature. Here the mean value was −16 W m−2. But although the climate is cold, the Antarctic continental air is very dry and therefore the latent heat flux is important, averaging to −23.6 W m−2. Thus the surface balance was −33.1 W m−2, and the total of the loss terms was −102 W m−2.
The heat budget showed similar characteristics in different years. Mean summertime incoming solar radiation was 331–346 W m−2 but albedo ranged from 0.55 to 0.66 resulting in significant differences in solar heating. The highest albedo was in 2014/15 when the water volume was smallest. On the other hand, the net longwave radiation was largest in 2004/05 when the water volume was largest. Turbulent fluxes were between −25 and −50 W m−2 with the Bowen ratio of 0.5–1.0.
The surface heat balance was almost all time negative, and therefore the lake had an ice cover. In 2004/05 and 2010/11 the thickness was ~10 cm in middle of the summer but in 2014/15 it was much more, 20–30 cm. Since 35 W m−2 corresponds to melting rates 1 cm/day−1, the net internal heating (Table 1) corresponds to melting rates 1.7, 0.8, 0.3 cm d− 1. These represent well with what was observed by drilling the lake cross sections. Thus the lake profile data provided a most useful condition for the total heat flux.
Daily surface heat balance
The day-to-day variability of the surface heat balance was examined using the summer 2010/11 data (Fig. 3). The daily solar radiation ranged within 250–450 W m−2. There was no clear systematic variation during summer. The outgoing solar radiation followed the incoming radiation, with changes caused mainly by cloud cover. At mid-January outgoing radiation was relatively small, i.e. the albedo was at smallest. This may be due to surface roughness or thinning of the surface ice layer. The daily cycle was strong. In midsummer, the solar elevation ranged between 40.5° at solar noon and 6.5° at solar midnight that caused the large daily amplitude. The hourly average of incoming solar radiation was at minimum 18.5 W m−2 (at 1 h) while the maximum was 664.5 W m−2 at 14 h, and the level was above 200 W m−2 from 6 to 21 h.
The daily average radiation budget in 2010/11. The list of components on the right shows, from the top down: incoming solar radiation, outgoing solar radiation, net radiation, net surface radiation balance and solar radiation penetrating into the lake.

The net longwave radiation had quite small variability on the daily level. The mean level was −75 W m−2 and deviations were <20 W m−2 as seen clearly from the net radiation and net surface radiation balance curves (Fig. 3). The net longwave radiation was a stable component of the radiation balance. Here it was obtained directly from measurements, but it is also interesting to evaluate the standard empirical formula against the measurements. The empirical model is based on grey body laws as
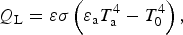 $$Q_{\rm L} = \varepsilon \sigma \left( {\varepsilon _{\rm a} T_{\rm a}^{\rm 4} - T_0^4} \right),$$
where ε ≈ 0.97 is the emissivity of the lake surface, ε a is the atmospheric emissivity, σ is Stefan-Boltzmann constant, T a is the air temperature and T 0 is the surface temperature. The atmospheric emissivity is 0.6–0.9 depending on cloudiness and humidity (e.g., Curry and Webster, Reference Curry and Webster1999). With atmospheric emissivity 0.75 and temperatures of 0°C the net longwave radiation becomes −75 W m−2, and the measured variations can be understood from the temperature varying within 5°C and from the cloud cover. To reach −32 W m−2 in the net longwave radiation, it needs to, e.g. raise the atmospheric emissivity to 0.83 and increase the air temperature by 5°C.
It is interesting to see how the surface radiation balance varied around zero and was never >25 W m−2 in absolute value. As a result, the radiation penetrating into the lake was very close to the net radiation (Fig. 3).
The day-to-day time series of the turbulent heat fluxes is shown in Figure 4. These are limited in a vast ice-sheet environment, since there the air temperature is not much different from the surface temperature. But even though the Antarctic atmosphere is cold, it is often dry and latent heat flux can be more significant than the sensible heat flux. The sensible heat flux varied from −60 to 20 W m−2, while latent heat flux was below zero with −60 W m−2 at minimum. Aperiodic fluctuations were caused by wind speed and by the air–surface temperature and humidity differences. The temperatures varied more, and more variability resulted in sensible heat fluxes. As in the case of radiation components, there were no systematic changes.
Daily average turbulent heat exchange in 2010/11.

The maximum air temperatures measured over Lake Suvivesi were 1°C. Our instantaneous field data indicated that the air and surface temperatures were usually within 1°C. The lake site is also well protected by the governing northeasterly winds (see Fig. 1). For wind speed 5 m s−1 and air–surface temperature difference of ±1°C, the sensible heat flux would be within ±10 W m−2 based on the bulk formula (e.g., Curry and Webster, Reference Curry and Webster1999). This bulk formula also suggests that for wind speed of 5 m s−1, air temperature of 0°C, and relative humidity of 50%, the latent heat loss is 40 W m−2. The heat loss of 30 W m−2 corresponds to sublimation by 1 mm d−1.
Lake body
The lake surface is in its frozen state due to the negative surface heat balance. In a few spots, except in summer 2014/15, the surface was ice free for a short time in the summer peak at mid-January. The thickness of the surface ice layer (η) comes from heat conduction through ice and heat loss to the atmosphere:
 $$\rho L\displaystyle{{{\rm d}h} \over {{\rm d}t}} + Q_{\rm w} = - k_i \displaystyle{{T_0} \over h} = - Q_0 (T_0 );\;T_0 \lt 0^\circ {\rm C},\;\; Q_0 \lt 0,$$
where ρ is the density of ice, L is the latent heat of melting, k i = 2.1 W m−1 °C−1 is the thermal conductivity of ice, and Q w is the heat flux from water to the ice bottom. This is the classical analytic ice growth model for lake ice (see Leppäranta, Reference Leppäranta2015). The left-hand side contains the heat available at the lower boundary of ice cover (latent heat and heat flux from water), the middle term gives steady-state conduction of heat through the ice, and the right-hand side is the surface heat loss. The system (4) needs to be simultaneously solved, but it is seen that it allows an equilibrium ice thickness h* when the surface loss equals the heat flux from water to ice. For example, for Q 0 = −30 W m−2 and T 0 = −1°C, we have h* = 7 cm.
The time scale of ice thickness change Δη is τ = ρLΔη/Q 0. For Q 0 ~ −30 W m−2 and Δη ~ 10 cm, we have τ ~ 10 d. In the present study lake, typical thickness of surface ice layer has been 10–15 cm in 2004/05 and 2010/11, but in the cold summer 2014/15 this layer was 30 cm thick. Thus, the thickness of the surface ice layer has been of the order of 10–30 cm and may change by 10 cm in a time scale of 10 d.
Figure 5 shows the measured net solar radiation at the surface and at 60 cm depth, and on the basis of the data the estimated light attenuation coefficient. The surface PAR level is about half of the net solar radiation at the surface. The light attenuation coefficient scale is 1 m−1 with variations from 0.5 to 2 m−1. The result agrees with other years as well. Attenuation is mainly due to scattering in ice and slush, and the thicker is the liquid water layer in the lake, the deeper sunlight can penetrate, and its variations are due to cloudiness, solar altitude and azimuth and the lake body structure. Thus, not only albedo, but also the attenuation depth, gives a positive feedback to the lake growth. The length scale of diffusion in ice is ~50 cm over 10 d (see Leppäranta, Reference Leppäranta2015); the attenuation depth is more, and therefore the lake is able to keep the gained solar energy. In water, the molecular diffusion length scale is half of that in the ice.
Light transfer in summer 2010/11: (a) net solar radiation at the surface, (b) scalar irradiance at 60 cm depth and (c) a section of the estimated light attenuation coefficient in the top 60-cm layer. Note that in (a) 400 W m−2 corresponds to 200 W m−2 PAR and in (b) 3000 µmol m−2 s−1 corresponds to 100 W m−2 planar irradiance.

The liquid water portion of the lake grows as long as the penetration of solar radiation overcomes the losses to the surface and bottom. The energy gain in this period is used to raise the temperature of ice and melt it. The height of the produced water column is:
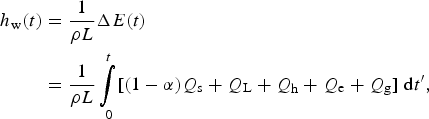 $$\eqalign{h_{\rm w} (t) & = \displaystyle{1 \over {\rho L}}{\rm \Delta} E(t) \cr & = \displaystyle{1 \over {\rho L}}\mathop {\int} \limits_0^{t} [(1 - \alpha )Q_{\rm s} + Q_{\rm L} + Q_{\rm h} + Q_{\rm e} + Q_{\rm g} ]\;{\rm d}t^{\prime},}$$
where the time origin refers to the beginning of summer. The deeper solar radiation penetrates, the less heat comes out by molecular conduction. A snow layer is too opaque to generate a lake, but blue ice is clear enough. The depth scale of the lake is the produced water column divided by the mean porosity or D ~ h w·ν −1; for the mean heat flux of 50 W m−2 during 60 d, we have h w = 85 cm, and further with ν = 0.5, the depth scale is 1.7 m. This was the case in 2010/11, in 2004/05 the liquid water production was closer to 2 m and in 2014/15 <1 m.
The role of convection in the lake is an open question. In principle, the water can warm up from 0°C from solar radiation and start convection, but the heat will be soon used for melting. The lake is more or less an ice-water bath. We have measured temperatures up to 0.5°C but do not have the data to show whether convection followed, or have other authors studied this question.
DISCUSSION
The mass balance of supraglacial lakes consists of sublimation and compensating upwelling flow of ice. In our study lake, sublimation was estimated as 0.5–1.0 mm d−1 in summer. In snow patches in the nearby Basen nunatak, the magnitude of sublimation was measured using snow stakes as 10 cm w.e. for one summer (Leppäranta and others, Reference Leppäranta, Järvinen and Lindgren2013a).
With regard to the heat balance, solar radiation provided the heat to form the lake and was the dominant factor. The three study seasons were quite different when net heating was assessed. This was clearly visible in the resulting liquid water volume in the lake. In particular, in December 2014 the net heating was close to what it was in 2004 and 2010 but January 2015 was cold. The summer peak never developed but internal melting ceased. The surface heat flux is related to the thickness of surface ice cover and upward heat flux from the lake body, and also here there was consistency between the surface heat balance and evolution of the lake. Thus, regular lake mapping was a powerful method to constrain the heat budget. Often in boundary-layer studies there are large uncertainties, and the lake (or ground in general) provides a key condition for the total surface heat balance.
In a study of a perennial snow patch on Basen, the radiation balance was 20.2 W m−2, much lower than in the lake because of the higher albedo. The sensible and latent heat fluxes averaged to 0.2 and −15.5 W m−2, respectively (Leppäranta and others, Reference Leppäranta, Järvinen and Lindgren2013a). Both were lower (in magnitude) than over the lake by 10–15 W m−2. The reason is, likely air temperature was a little higher in the nunatak.
In a given blue-ice site, the formation of a cold-environment supraglacial lake depends on the initial temperature distribution in the beginning of summer, and summer heat budget. To examine the necessary conditions, we can employ the energy flux integral (Eqn (5)), but now for the temperature increase instead of melting. For the net heating by 10 W m−2 and time of 90 d, the temperature of a 1 m ice layer would increase by 40°C. This heating is able to open a lake at Basen, but in a much colder climate blue-ice spots would stay fully frozen through the summer. Optical properties are also crucial. For example, in the vicinity of the lake site, albedo was much higher (0.9) in snow-covered ice sheet and optical thickness of snow is ~10 cm (Järvinen and Leppäranta, Reference Järvinen and Leppäranta2013). The consequent net heating was too small; only for a short period in the peak of the summer a minor amount of liquid water was observed in the snow surface layer.
CONCLUSIONS
Cold-environment supraglacial lakes have so far been poorly studied. ‘Cold’ refers to the presence of surface ice layer due to negative surface heat balance. Thermodynamics of one lake was examined based on field data from three austral summers in the western Dronning Maud Land, Antarctica. Comparisons with other lakes in the nearby region indicated similar development (Keskitalo and others, Reference Keskitalo, Leppäranta and Arvola2013; Leppäranta and others, Reference Leppäranta, Järvinen and Mattila2013b).
Sublimation in summer was estimated as 0.5–1.0 mm d−1, averaging to 0.7 mm d−1 and summing up to 5–10 cm for the whole summer. It was estimated from latent heat flux, and also in one summer, directly using an icebox with results consistent with the flux method. The icebox method is a promising approach in a blue-ice environment. At maximum, the lake body consisted ideally of two layers, each ~1 m thick: an upper layer with thin ice on top, otherwise mainly liquid water, and a lower layer containing slush and hard ice sublayers and a sediment-rich slush pocket at the bottom.
Heat was provided by the solar radiation, while net longwave radiation, sensible heat flux and latent heat flux were all loss terms on average. Over the period of December–January, the average net solar heating was 137 W m−2, while the losses averaged to 62 W m−2 for the longwave radiation, 16 W m−2 for the sensible heat flux, 24 W m−2 for the latent heat flux and 3 W m−2 for the bottom flux; 32 W m−2 remained to deepen the lake by melting. Albedo was on average 0.6 and thus supraglacial lakes absorb solar energy ~4 times more effectively than the snow-covered ice sheet. The depth of the lake scaled with light attenuation distance was ~1 m. The net liquid water production was 0.5–1.0 m in summer. The potential formation of ice in winter is more than the summer melting, and thus the lake freezes up completely in winter in the present climatic conditions.
ACKNOWLEDGEMENTS
We are grateful to the help and advice of FINNARP logistics teams. Funding was provided by the Academy of Finland to our projects Seasonal snow in Antarctica II (2002–2005) and Evolution of snow cover and dynamics of atmospheric deposits in the snow in the Antarctica (2009–2012) and by FINNARP programme for the logistics in 2014/15. Further support was also provided by EU FP7 Project EuRuCAS (European-Russian Centre for Cooperation in the Arctic and Sub-Arctic Environmental and Climate Research). We also thank John Loehr for his English language checking of the manuscript.


 Open access