


Introduction
There is a considerable body of research suggesting that lexical access is more effortful for second language (L2) than first language (L1) speakers, and that this additional effort manifests itself in phenomena such as higher disfluency rates in free speech (de Jong et al., Reference de Jong, Groenhout, Schoonen and Hulstijn2015), more tip-of-the-tongue states (Gollan & Acenas, Reference Gollan and Acenas2004) and longer latencies in word naming (Botezatu, Misra, & Kroll, Reference Botezatu, Misra and Kroll2022) and picture naming (e.g., Gollan et al., Reference Gollan, Montoya, Fennema-Notestine and Morris2005) in L2 use than in comparable data from L1 speakers. Similar findings have been reported in the L1 of (late) bilinguals as compared to monolinguals (see, for example, Bergmann, Sprenger, & Schmid, Reference Bergmann, Sprenger and Schmid2015 and Schmid & Beers Fägersten, Reference Schmid and Beers Fägersten2010, for fluency in free speech; Baus, Costa, & Carreiras, Reference Baus, Costa and Carreiras2013, Köpke & Genevska-Hanke, Reference Köpke and Genevska-Hanke2018 and Schmid & Yılmaz, Reference Schmid and Yılmaz2021, for latencies and accuracy in picture naming; and Baus, Costa, & Carreiras, Reference Baus, Costa and Carreiras2013, Ivanova & Costa, Reference Ivanova and Costa2008; Lehtinen, Kautto, & Renvall, Reference Lehtinen, Kautto and Renvall2024, Linck, Kroll, & Sunderman, Reference Linck, Kroll and Sunderman2009 and Opitz, Reference Opitz2010 for productivity in lexical fluency tasks; for a comprehensive overview of lexical access in first language attrition see Jarvis, Reference Jarvis, Schmid and Köpke2019). Lexical access in all of a bilingual’s languages further appears to be affected by relative levels of proficiency in both languages, as well as length and frequency of exposure (Baus, Costa, & Carreiras, Reference Baus, Costa and Carreiras2013; Kasparian & Steinhauer, Reference Kasparian and Steinhauer2016; Linck, Kroll, & Sunderman, Reference Linck, Kroll and Sunderman2009).
Response latencies for both monolinguals and bilinguals have also consistently been shown to be affected by word frequency. For bilinguals, this factor exists in a further complex relationship with frequency of use and exposure to each language: a speaker who uses one of their languages only rarely may encounter even high-frequency words of that language less often than a prolific bilingual speaker or a monolingual encounters low-frequency ones. General effects of bilingualism in lexical access, which arise from the need to control two or more linguistic systems (Green & Abutalebi, Reference Green and Abutalebi2013), may therefore intersect with the time afforded to the individual speaker to expose themselves to each respective language (“weaker links” hypothesis, Gollan et al., Reference Gollan, Montoya, Fennema-Notestine and Morris2005, Reference Gollan, Montoya, Cera and Sandoval2008). In particular, availability of L1 items appears to be reduced mostly for low-frequency non-cognate items, and this reduction can be observed even after short immersion periods of a few months (Baus, Costa, & Carreiras, Reference Baus, Costa and Carreiras2013).
We thus hypothesize that, ceteris paribus, the effects of item frequency on bilingual word retrieval speed in both L1 and L2 will be modulated by the amount and context of exposure that individuals have with each of the languages in daily life, and that including bilingual experience as a predictor on the participant level can allow us to refine our understanding of how bilingualism affects lexical accessibility. While this is commonly recognized in the research design of studies of language attrition, which routinely include measures of frequency of use, it seems to not have been fully explored in investigations of lexical access among L2 speakers (see below). We therefore take an integrated approach, assessing speed of lexical access as well as language proficiency and frequency of language exposure/use for both of our bilingual participants’ languages, comparing them against monolingual reference groups, to assess how general properties of linguistic items interface with individual experience-related factors.
The frequency effect in lexical access
The observation that high-frequency lexical items are accessed faster by both monolinguals and bilinguals across a range of experimental paradigms is one of the least controversial findings in the field – Gollan et al. (Reference Gollan, Montoya, Fennema-Notestine and Morris2005, p. 1222) succinctly conclude that “words that are produced more often are easier to produce.” The effect of frequency on naming latency was first observed by Oldfield and Wingfield (Reference Oldfield and Wingfield1965) and has been reliably replicated ever since (e.g. Alario, Costa & Caramazza, Reference Alario, Costa and Caramazza2002; Strijkers, Costa & Thierry, Reference Strijkers, Costa and Thierry2010).
Theoretical underpinnings for the frequency effect on the individual level are provided in psycho-/neurolinguistic models of activation, which stipulate that the accessibility of items depends, among other factors, on the frequency and recency of previous instances of activation (e.g., Paradis, Reference Paradis2004). This is reflected in the notion of entrenchment – the idea that (linguistic) knowledge is not static but undergoes lifelong processes of reorganization and refreshment, dependent on experience and exposure (e.g., H.-J. Schmid, Reference Schmid and Schmid2017). These models all predict that strength of representation of linguistic items, and thus the ease with which they may be activated, increases with each instance of repetition/rehearsal, while disuse will cause decay, resulting in longer activation times (e.g., Langacker, Reference Langacker1987; Paradis, Reference Paradis, Köpke, Schmid, Keijzer and Dostert2007).
Ease of lexical access, however, is not only constrained by how frequently a speaker has encountered an item but also by the necessity to inhibit competitors, that is, to manage crosslinguistic interference. This factor affects monolinguals and bilinguals in a fundamentally different way, as bilinguals have to restrict the lexical access process to the target language and experience interference from competing items from the non-target one, while monolinguals only have to inhibit competitors from the target language (e.g., synonyms and homophones) (e.g., Green, Reference Green1998; Green & Abutalebi, Reference Green and Abutalebi2013; Shao, Meyer & Roelofs, Reference Shao, Meyer and Roelofs2013). This suggests that, while lexical access should be affected quantitatively by factors related to frequency, the impact of interference should differ qualitatively between monolinguals and bilinguals. A distinction has to be made here between nonselective inhibition, in which any unwanted response is suppressed (measured, e.g., in Stop-Go tasks), and selective inhibition, which relates to particular distractors. This type of inhibition manifests itself in effects such as cognate facilitation (e.g., Dijkstra et al., Reference Dijkstra, Miwa, Brummelhuis, Sappelli and Baayen2010) and the Stroop-like tasks, such as the Picture Word Interference paradigm (Shao, Roelofs, Martin, & Meyer, Reference Shao, Roelofs, Martin and Meyer2015; Starreveld & La Heij, Reference Starreveld and La Heij2017). In the latter type of task, bilinguals have to apply two levels of inhibition, one relating to the suppression of the distractor item, the other at the global level of the language (Neumann, Reference Neumann2018); while monolinguals only experience the former.
While item frequency has been shown to affect naming latency across different types of populations, from healthy monolingual adults through early and late bilinguals in both their L1 and their L2 to participants with developmental or acquired disorders, there are some differences in how the effect plays out across populations. In particular, L2 speakers are not only slower than monolinguals overall in naming both high frequency (HF) and low frequency (LF) items, but the slope for item frequency vs. naming latency is steeper for them. In other words, the bilingual disadvantage in the speed of lexical retrieval is amplified for low-frequency items (Gollan et al., Reference Gollan, Montoya, Fennema-Notestine and Morris2005, Reference Gollan, Montoya, Cera and Sandoval2008; Ivanova & Costa, Reference Ivanova and Costa2008). Such differences have been interpreted as an indirect frequency effect ascribed to the larger total number of lexical items competing for selection in the bilingual lexical repertoire, as well as the reduced total frequency of activation of each item in the bilingual as opposed to the monolingual experience. For example, the weaker-links hypothesis (Gollan et al., Reference Gollan, Montoya, Cera and Sandoval2008) compares being bilingual to having a monolingual lexicon that consists entirely of low-frequency words, and in which the reduced total number of instances that lexical items in each language are called upon leads to an attenuation of the link between semantics and phonology in either system and makes activation of each item more effortful. Similarly, Ramscar et al. (Reference Ramscar, Hendrix, Love and Baayen2013) show that the size of the overall repertoire impacts naming speed in a complex interaction between the frequency of occurrence and the size of the vocabulary. While Ramscar et al. investigate this in the context of lifelong learning (proposing that slower naming in healthy older participants is not necessarily an indication of cognitive decline but the outcome of more experience), a similar case can be made for bilinguals.
Frequency thus exists as a variable on both the item and the speaker level: lexical items are common or rare, and this factor is relatively constant for each word across the speech community, while individual (in particular bilingual) speakers are exposed to each language more or less in their daily activities. Frequency is a complex variable for research on bilingualism, since relative item frequency presumably affects monolinguals and bilinguals similarly (an item that is low-frequency in monolingual discourse is unlikely to be high-frequency for bilinguals, or vice versa), but is modulated by individual exposure to each language to different degrees. A bilingual individual interacting predominantly in Language A will have almost as many exposures to items across the frequency range as a monolingual of this language, while occurrences of even high-frequency items in Language B will be lower. A speaker who uses the languages approximately equally across their daily activities will have exposure which is reduced against the monolingual baseline in both.
Few studies of lexical access and naming latency in L2 development to date have measured bilingual exposure as an individual, scaled predictor; instead, it is usually treated as a categorical variable at the group level, differentiating bilinguals vs. monolinguals (e.g., Gollan et al., Reference Gollan, Montoya, Fennema-Notestine and Morris2005, Reference Gollan, Montoya, Cera and Sandoval2008) or trilinguals vs. bilinguals (Sullivan, Poarch, & Bialystok, Reference Sullivan, Poarch and Bialystok2018). Where bilingual populations are taken to be stratified, the different levels have also sometimes been assumed to be dichotomous, for example, in de Bruin, Della Sala, and Bak’s (Reference de Bruin, Della Sala and Bak2016) investigation of active vs. inactive heritage bilinguals or in Linck, Kroll, and Sunderman’s (Reference Linck, Kroll and Sunderman2009) study of immersed vs. classroom learners. While it has been acknowledged that more research into the various mechanisms underlying bilingual processing is needed, and that frequency of use is likely among the predictors (Shook, Goldrick, Engstler, & Marian, Reference Shook, Goldrick, Engstler and Marian2015), there are few studies attempting to establish the impact of frequency of exposure as an independently measured continuous variable at the individual level on naming speed in bilinguals. One recent exception is a study by Kastenbaum et al. (Reference Kastenbaum, Bedore, Peña, Sheng, Mavis, Sebastian-Vaytadden and Kiran2019), who extract a composite language exposure measure from a survey by means of Principal Component Analysis, and find it to be a significant predictor in a category fluency task (note that the impact of item frequency is more difficult to establish and control in such a task than in experimental paradigms where all participants produce the same items, such as picture naming).
On the other hand, there is a considerable body of work investigating frequency of exposure as a factor in the development of bilinguals’ L1, the process known as L1 attrition. While the item frequency effect observed for other populations is also reliably replicated in this context (e.g., Hulsen, Reference Hulsen2000; Yılmaz & Schmid, Reference Yilmaz and Schmid2012), the impact of frequency of individual exposure on the rate and extent of attrition effects has been surprisingly elusive (see Schmid, Reference Schmid, Schmid and Köpke2019, for an overview). These findings present a puzzle for accounts of the frequency effect by means of an activation or entrenchment narrative and the “use it or lose it” scenario predicted by accounts such as Langacker (Reference Langacker1987) or Paradis (Reference Paradis, Köpke, Schmid, Keijzer and Dostert2007).
Research questions and hypotheses
The present study seeks to contribute to an integrated picture of the impact of word frequency, frequency of exposure, proficiency, and the cognitive demands of managing two linguistic systems on naming latency and lexical access in both the L1 and the L2 of bilinguals with a broad range of experiential backgrounds, proficiency levels, and amount of exposure. We assess the impact of item-level characteristics (frequency and cognateness) and participant-level predictors (individual background factors, executive functions) on naming speed. In order to test the impact of inhibition demands, we use both a Picture Naming Task (PNT) and a Picture Word Interference Task (PWIT), in which target pictures are presented together with a distractor item in the form of a word printed across the picture, which the participant is instructed to ignore (e.g., Shao, Roelofs, Martin, & Meyer, Reference Shao, Roelofs, Martin and Meyer2015; Starreveld & La Heij, Reference Starreveld and La Heij2017; Sudarshan & Baum, Reference Sudarshan and Baum2019). Picture naming is used to measure the differential effects of the background factors on the accessibility of lexical items, while testing the impact of the presence of a distractor is used to probe whether the ability to selectively inhibit a distractor item in either of the languages of the bilingual is modulated by effects of frequency of use and/or proficiency level.
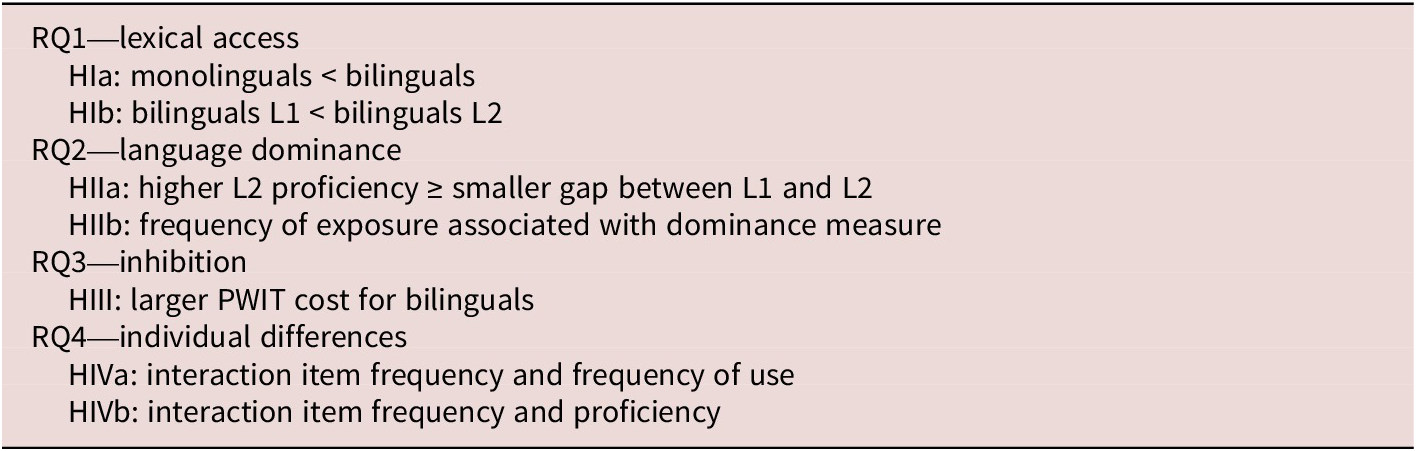
We address the following research questions (see Table 1 for a summary):
RQ1 (lexical access): To what extent does naming latency in a PNT and a PWIT differ between a monolingual reference population, a bilingual population naming items in their L1, and a bilingual population naming them in their L2?
Hypothesis Ia: Bilinguals will be slower to name items in both L1 and L2 than monolinguals of these languages
Hypothesis Ib: Bilinguals will be faster to name items in their L1 than in their L2
RQ2 (bilingual language dominance): To what extent does naming latency in these tasks differ between bilingual speakers naming the items in their L1 and the same bilinguals naming the same items in their L2?
Hypothesis IIa: Differences in naming speed between bilinguals’ L1 and L2 will be modulated by proficiency
Hypothesis IIb: Differences in naming speed between bilinguals’ L1 and L2 will be modulated by frequency of exposure
RQ3 (inhibition): What is the cost incurred when naming an item in the presence of a (semantically and phonologically unrelated) distractor in bilinguals’ L1 and L2, compared with a monolingual baseline?
Hypothesis III: Bilinguals will incur a larger cost for inhibiting the distractor word in the PWIT, as their overall inhibition effort has to extend not only to ignoring the unrelated distractor but also to suppress competitor items from the non-target language
RQ4 (individual differences): How do individual predictors relating to frequency of exposure, language proficiency, and executive function modulate lexical access, language dominance, and inhibition in bilinguals’ L1 and L2 across the item frequency range?
Hypothesis IVa: Item frequency will have a stronger effect on naming latency for less frequently used languages
Hypothesis IVb: Item frequency will affect participants with lower levels of proficiency more strongly
Summary of RQs and Hypotheses

Table 1. Long description
The table is structured into four main sections based on Research Questions R Q.
* R Q 1 Lexical access includes two hypotheses. H I a states monolinguals are less than bilinguals. H I b states bilinguals L 1 are less than bilinguals L 2.
* R Q 2 Language dominance includes two hypotheses. H I I a states higher L 2 proficiency is greater than or equal to a smaller gap between L 1 and L 2. H I I b states frequency of exposure is associated with dominance measure.
* R Q 3 Inhibition includes hypothesis H I I I, which states there is a larger P W I T cost for bilinguals.
* R Q 4 Individual differences includes two hypotheses. H I V a focuses on the interaction between item frequency and frequency of use. H I V b focuses on the interaction between item frequency and proficiency.
The study
Participants
Ethical approval for this investigation was obtained from the Faculty Ethics Committee of the Faculty of Social Sciences, University of Essex.Footnote 1 Informed consent was obtained before any of the tasks were attempted.
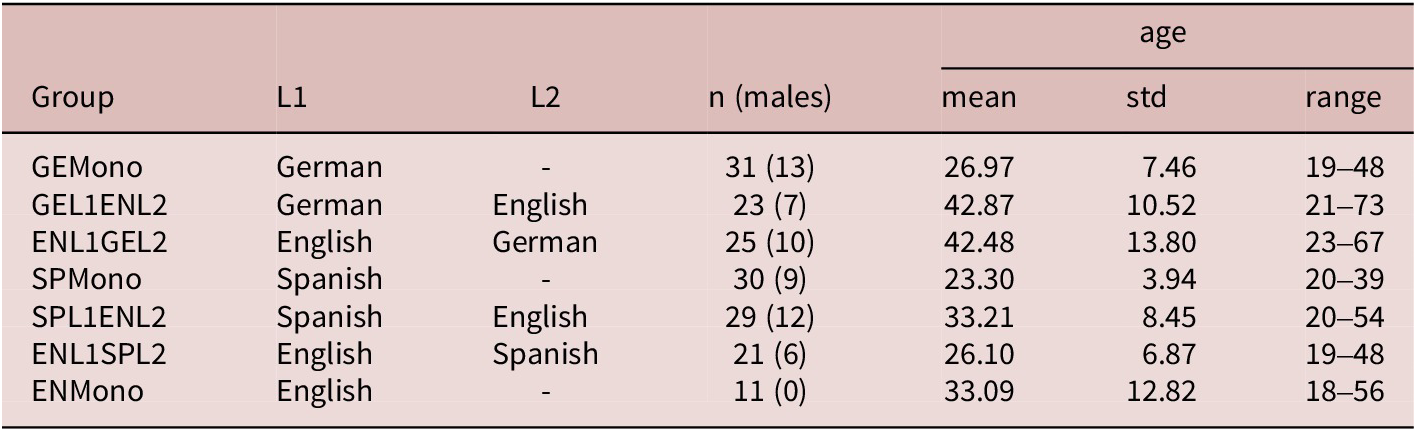
Participant recruitment was initiated through the authors’ personal networks, beginning with colleagues and students in the departments with which the authors were affiliated at the time and expanding to further contacts which participants were able to provide. The experiment was completed by 181 adult participants.Footnote 2 Of these, 83 (27 males) were functionally monolingual (no or low proficiency and infrequent exposure to languages other than their L1), with 31 (13) being native speakers of German (GEMono), 30 (9) of Spanish (SPMono), and 22 (5) of English (ENMono). The remaining 98 participants were fluent in two languages and had all started to learn the second language after age 10; 46 (16) of these had English as their L1, which was the L2 for the remaining 42 (28). Twenty-three (16) were L1 speakers of German (GEL1ENL2) and 29 (12) of different varieties of Spanish (SPL1ENL2). Of the 46 English native bilinguals, 25 (10) were L2 speakers of German (ENL1GEL2) and 21 (6) of Spanish (ENL1SPL2). Education levels were uniformly high, with just over half of participants attending or having attended university. The youngest participant was 19, the oldest was 73, with an average age of 32.81 (std 11.81).Footnote 3 These characteristics are summarised in Table 2.
Distribution of Gender, Age, and Education Level by Subgroup

Table 2. Long description
The table contains seven rows of data across seven columns. The columns are Group, L 1, L 2, Number of participants with males in parentheses, and Age which is subdivided into mean, standard deviation, and range.
* G E Mono: L 1 German, L 2 none, 31 participants (13 males), age mean 26.97, std 7.46, range 19 to 48.
* G E L 1 E N L 2: L 1 German, L 2 English, 23 participants (7 males), age mean 42.87, std 10.52, range 21 to 73.
* E N L 1 G E L 2: L 1 English, L 2 German, 25 participants (10 males), age mean 42.48, std 13.80, range 23 to 67.
* S P Mono: L 1 Spanish, L 2 none, 30 participants (9 males), age mean 23.30, std 3.94, range 20 to 39.
* S P L 1 E N L 2: L 1 Spanish, L 2 English, 29 participants (12 males), age mean 33.21, std 8.45, range 20 to 54.
* E N L 1 S P L 2: L 1 English, L 2 Spanish, 21 participants (6 males), age mean 26.10, std 6.87, range 19 to 48.
* E N Mono: L 1 English, L 2 none, 11 participants (0 males), age mean 33.09, std 12.82, range 18 to 56.
All bilingual participants as well as the English monolinguals resided in England at the time of testing, while monolingual Spanish and German participants were residents of Southern Spain and the Berlin region, respectively.
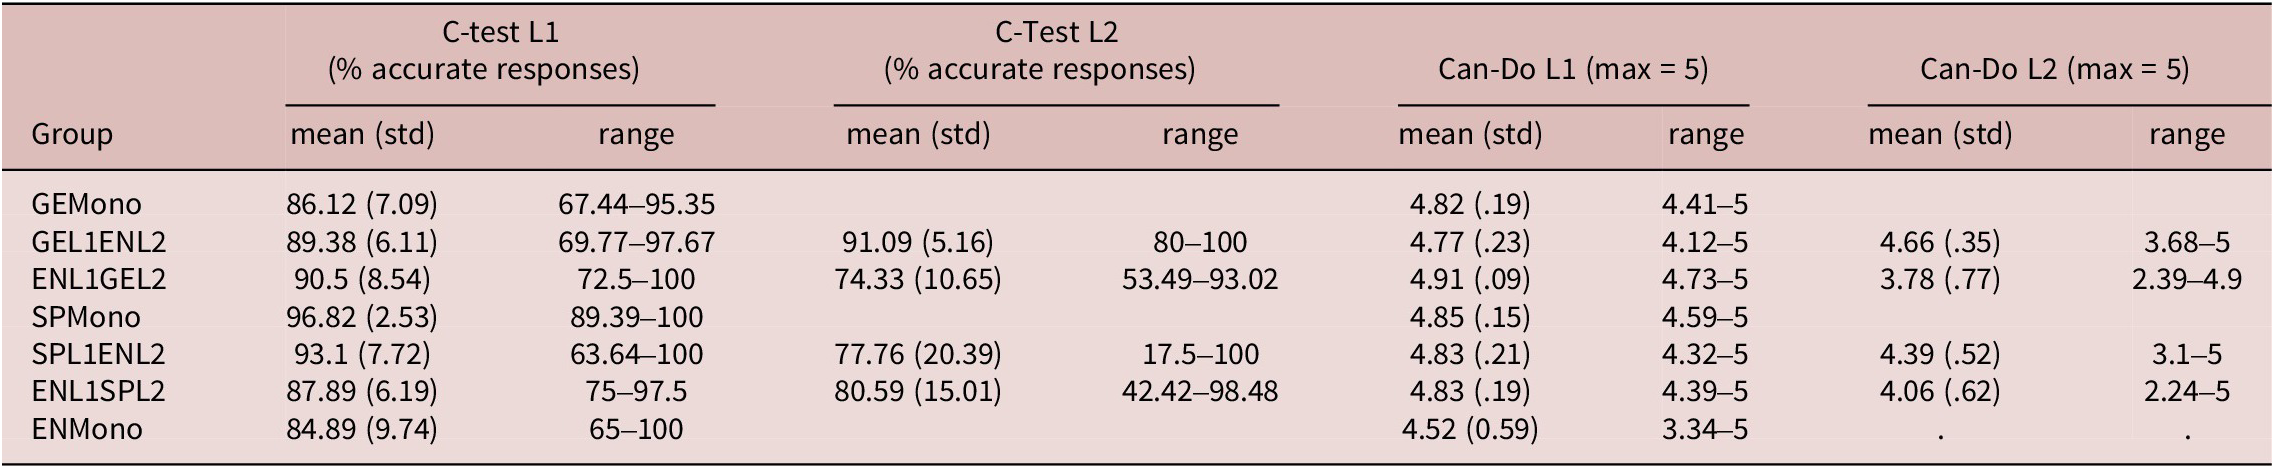
Prior to attending the naming experiment, participants completed an online Personal Background Questionnaire and a proficiency assessment on the MoodleX platform. This assessment consisted of a C-Test and a self-assessment (the rationale for these tasks is described in detail in Schmid, 2011; the version of the tasks we used is available in the three project languages on https://languageattrition.org/resources-for-researchers/) in both of each bilinguals’ languages or in the L1 of the monolinguals. The C-tests were scored by giving one point for each correctly filled-in gapFootnote 4 and then converting this score to a percentage of correctly completed gaps. The descriptive statistics in Table 3 suggest that the difficulty of the tests across the three languages may have been somewhat variable, as the Spanish version obtained higher average scores across all groups than the English or the German. We therefore calculated z-scores for the C-Test in each language and used those instead of the percentages reported here.
Proficiency Measures by Subgroup

Table 3. Long description
The table is organized into nine columns. The first column lists the Group, followed by C-Test L 1 percentage accurate responses (mean with standard deviation and range), C-Test L 2 percentage accurate responses (mean with standard deviation and range), Can-Do L 1 scores out of 5 (mean with standard deviation and range), and Can-Do L 2 scores out of 5 (mean with standard deviation and range).
* G E Mono: C-Test L 1 mean 86.12, range 67.44 to 95.35. Can-Do L 1 mean 4.82, range 4.41 to 5.
* G E L 1 E N L 2: C-Test L 1 mean 89.38, range 69.77 to 97.67. C-Test L 2 mean 91.09, range 80 to 100. Can-Do L 1 mean 4.77, range 4.12 to 5. Can-Do L 2 mean 4.66, range 3.68 to 5.
* E N L 1 G E L 2: C-Test L 1 mean 90.5, range 72.5 to 100. C-Test L 2 mean 74.33, range 53.49 to 93.02. Can-Do L 1 mean 4.91, range 4.73 to 5. Can-Do L 2 mean 3.78, range 2.39 to 4.9.
* S P Mono: C-Test L 1 mean 96.82, range 89.39 to 100. Can-Do L 1 mean 4.85, range 4.59 to 5.
* S P L 1 E N L 2: C-Test L 1 mean 93.1, range 63.64 to 100. C-Test L 2 mean 77.76, range 17.5 to 100. Can-Do L 1 mean 4.83, range 4.32 to 5. Can-Do L 2 mean 4.39, range 3.1 to 5.
* E N L 1 S P L 2: C-Test L 1 mean 87.89, range 75 to 97.5. C-Test L 2 mean 80.59, range 42.42 to 98.48. Can-Do L 1 mean 4.83, range 4.39 to 5. Can-Do L 2 mean 4.06, range 2.24 to 5.
* E N Mono: C-Test L 1 mean 84.89, range 65 to 100. Can-Do L 1 mean 4.52, range 3.34 to 5.
The Can-Do scales comprise 44 questions on participants’ ability to carry out certain tasks in both of their languages. They are modeled on the Can-Do scales for proficiency levels C1 and C2 developed in the Common European Framework of Reference by the Association of Language Testers in Europe (ALTE). Participants respond to each question on a scale from 1 (“I cannot do this”) to 5 (“I can do this with no effort”), with bilinguals indicating this for each of their languages. Reliability across the 44 questions was excellent (Cronbach α > .98 for each language), so a single overall average was calculated for each of the languages of each participant. The resulting proficiency measures correlated highly in participants’ L2 (Pearson’s r = .648, p < .001), but not in their L1 (Pearson’s r = .029, p = .702), suggesting participants were more realistic in assessing their proficiency levels in their L2 than in their L1.
Participants furthermore completed a survey on their language learning history and the use of and attitudes towards each of their languages (see Online Appendix, Table A1). This survey was presented to each participant in their L1 through the MoodleX platform and participants completed it online before attending the in-person part of the experiment. While questions were framed using the name of each language (e.g. “How often do you use English at work?”) we recoded responses so that they pertained to participants’ L1 or L2.
In order to explore the underlying structure of the responses collected in this survey, we followed the approach adopted by Kastenbaum et al. (Reference Kastenbaum, Bedore, Peña, Sheng, Mavis, Sebastian-Vaytadden and Kiran2019) and Schmid & Dusseldorp (2010), who recommend reducing the number of dimensions while preserving as much as possible of the inherent variability of such a survey through a Principal Component Analysis (PCA). The following 16 variables were entered into the analysis:
-
• proficiency in L1 and L2 (6 variables: z-transformed C-Test in L1 and L2, Can-Do Scales in L1 and L2, Likert-scale question about L1 and L2 proficiency with 1 = very poor and 5 = very good)
-
• frequency of use of L1 and L2 with friends, relatives, and at work (6 Likert-scale variables, 5 = daily, 1 = very rarely or never)
-
• language participant feels more comfortable using (1 Likert-scale variable, 1 = strong preference for L2, 5 = strong preference for L1)
-
• predominant language in social networks (1 Likert-scale variable, 1 = all friends are speakers of L2, 5 = all friends are speakers of L1)
-
• language use with pets (2 Likert-scale variables, 1 = never use L1/L2 with pets, 5 = daily use L1/L2 with pets)
The PCA employed Varimax rotation, listwise deletion of missing values, and components were selected based on Eigenvalues > 1. The rotated component matrix, showing full component loading after Varimax rotation,Footnote 5 is listed in the Online Appendix, Table A2 (loadings greater than .4 are considered significant). Six components were extracted based on this matrix, accounting for a total of 73.03% of variance.
The outcomes of the PCA fall into distinct categories, relating to language proficiency (Component 1 and 4) on the one hand, and language experience (Component 2, 3, 5, and 6) on the other. In several cases, measures relating to both L1 and L2 loaded onto the same component, suggesting that responses or scores for the two languages are not independent
The first component appeared to relate mainly to L2 proficiency, comprising high loadings for the two L2 proficiency measures (C-Test and Can-Do scale) as well as for the holistic self-assessment question. Interestingly, the L1 C-Test also loaded highly on this component. The second component related to the use of the L1 outside the home, i.e., with friends and at work, while the fourth component comprised the language use with relatives, with the L1 loading positively and the L2 negatively on this component,Footnote 6 The third component represented perceived L1 proficiency, comprising the holistic self-assessment question, the Can-Do scale, and the language preference question. The fifth component relates to the use of the L2 with friends and is composed of the frequency of L2 use with friends and the question of what the native language of most of the social contacts is. The final component was language use with pets (this did not emerge as a significant predictor in any of the preliminary models and was therefore not included in any of the analyses presented below).
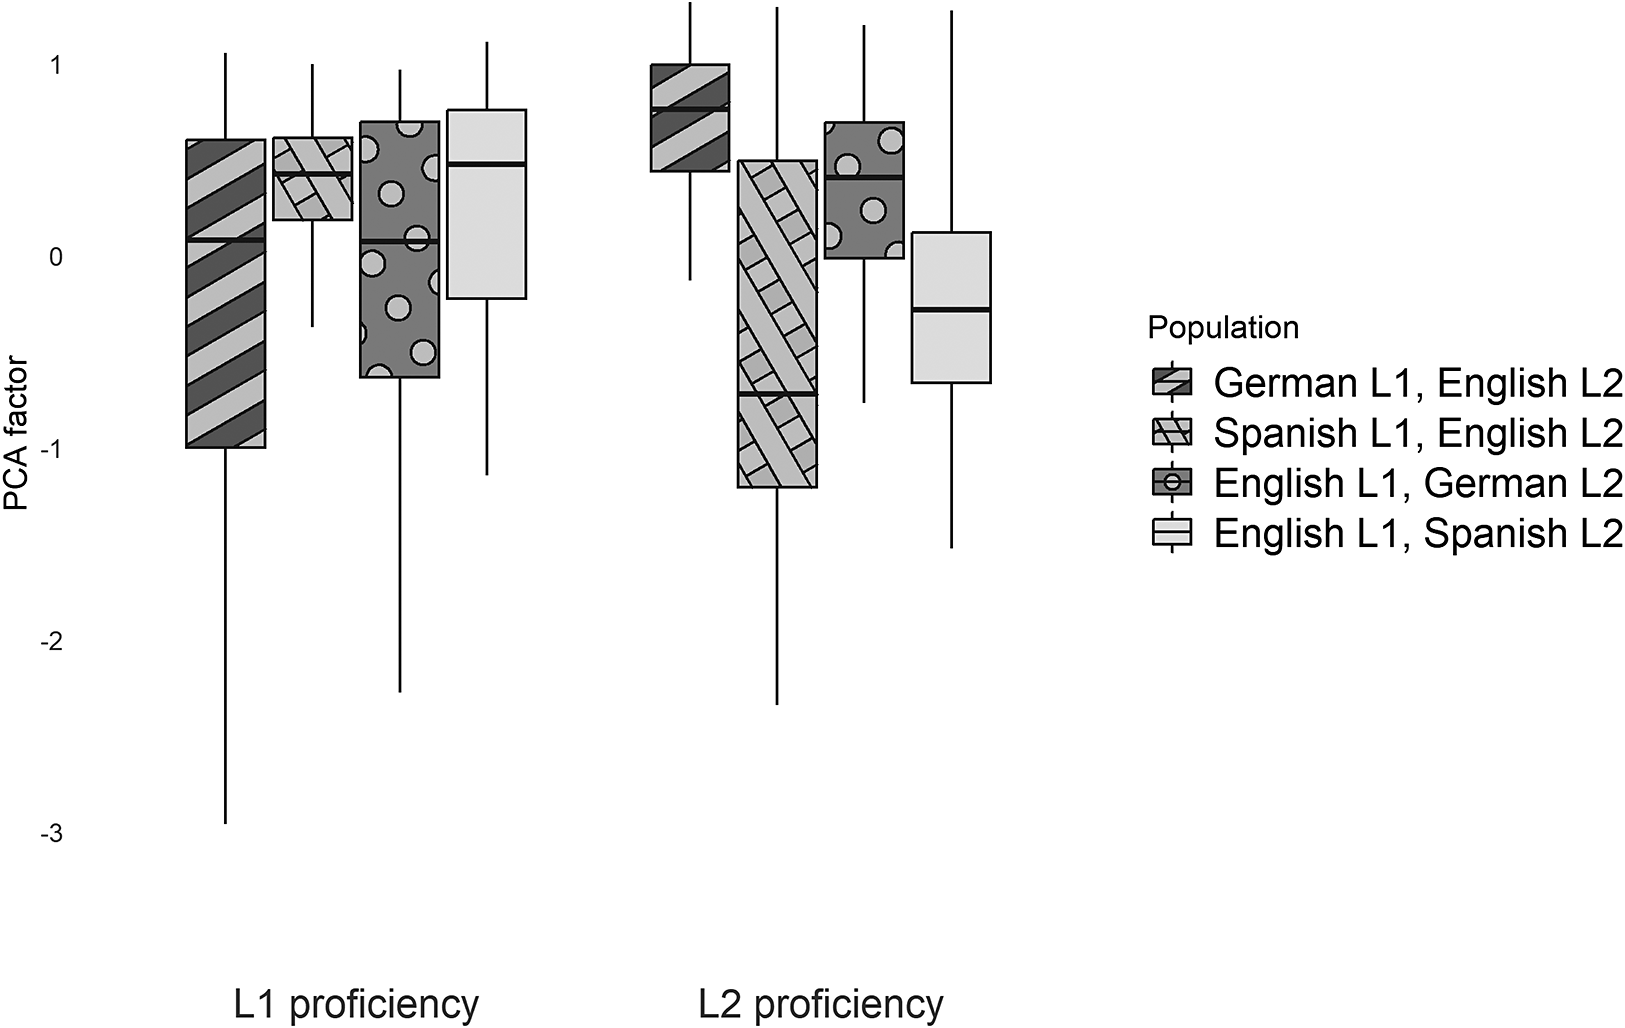
A preliminary group comparison by means of one-way ANOVA with Tukey Post-Hoc tests showed a main effect for Group on all five components (see Appendix Table A3 for details). With respect to L2 proficiency, the German native speakers outperformed the groups with Spanish as either their L1 or their L2, indicating that their proficiency in L2 English was higher than that of the Spanish natives and higher than the Spanish proficiency of the English natives. There was no difference between the L2 proficiency of either German L1 vs. German L2 or Spanish L1 vs. Spanish L2; nor between English natives German vs. Spanish L2 (see Figure 1).
Proficiency in the first and the second language across bilingual groups.

Figure 1. Long description
The y-axis is labeled P C A factor with a scale from negative 3 to 1. The x-axis has two main categories: L 1 proficiency on the left and L 2 proficiency on the right. A legend on the far right identifies four populations by box pattern: diagonal stripes for German L 1, English L 2; cross-hatch for Spanish L 1, English L 2; dots for English L 1, German L 2; and solid light gray for English L 1, Spanish L 2.
Under L 1 proficiency, the four boxes are clustered near the 0 mark. The German L 1 box has a median near 0 with a long lower whisker reaching negative 3. The Spanish L 1 box is higher and more compressed. The English L 1, German L 2 box has a median near 0 with a whisker extending to negative 2.2. The English L 1, Spanish L 2 box has the highest median in this group, around 0.5.
Under L 2 proficiency, the German L 1 box is the highest, with a median near 0.8. The Spanish L 1 box shows the greatest variance, with a median near negative 0.7 and a whisker reaching negative 2.3. The English L 1, German L 2 box has a median near 0.4. The English L 1, Spanish L 2 box has a median near negative 0.3.
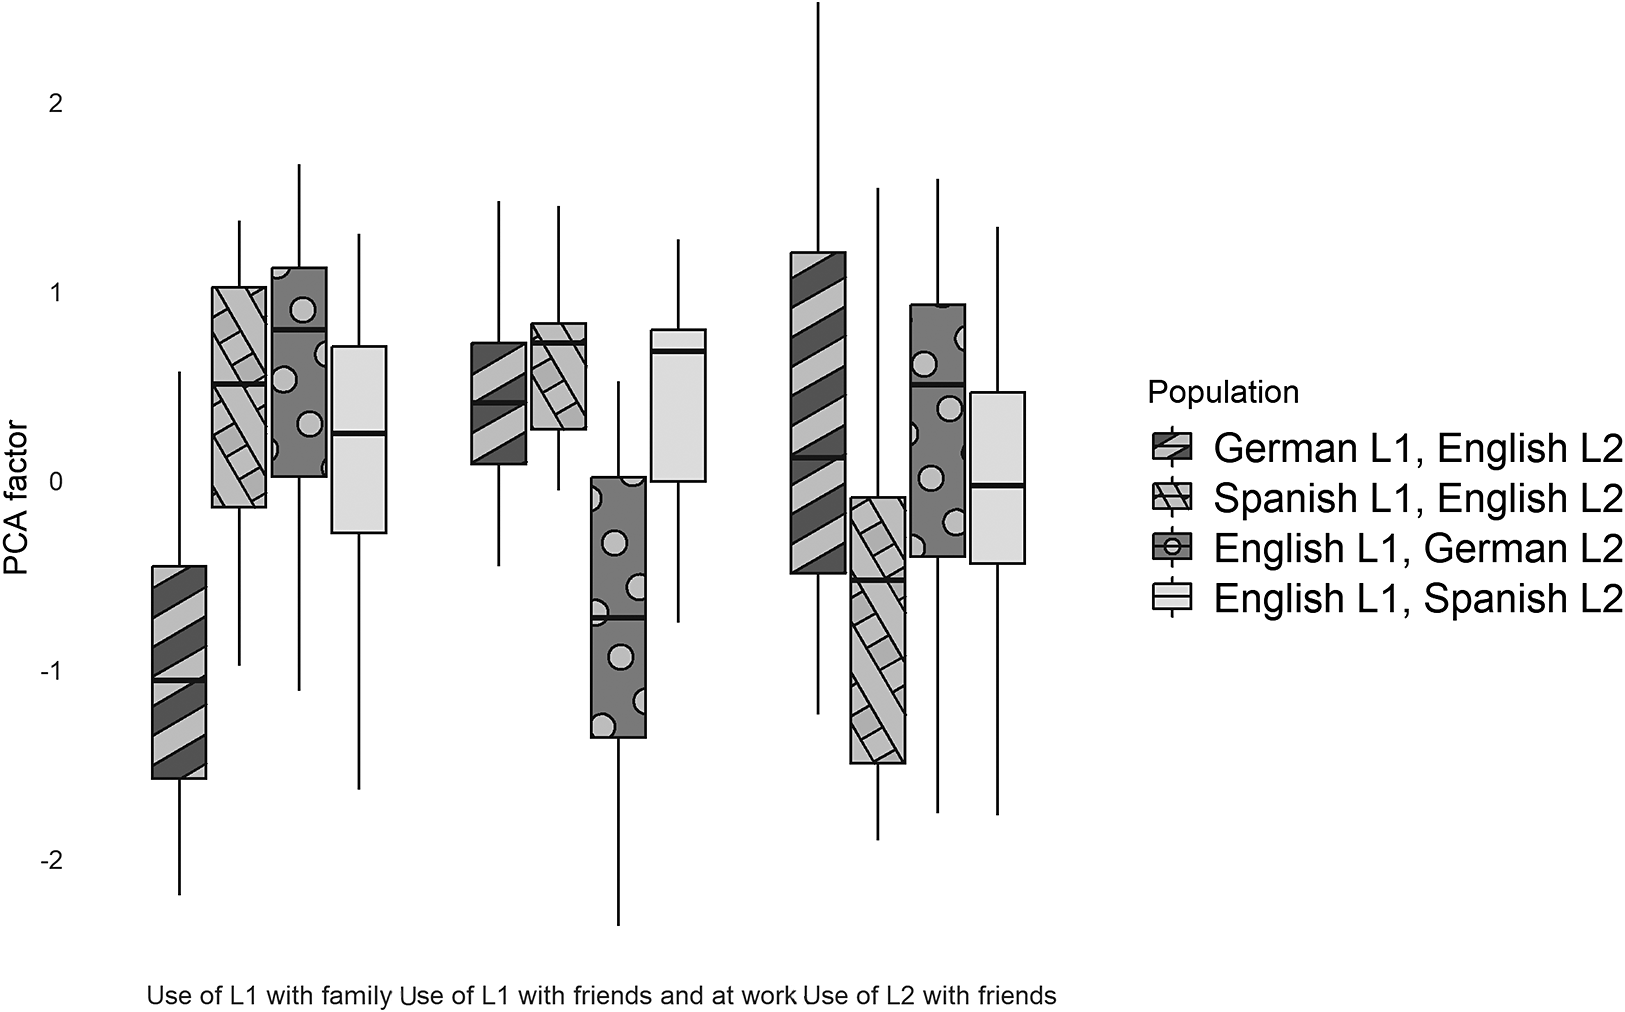
The pattern of frequency of use varied across domains (see Fig. 2): the German L1 speakers seemed to use the L1 less within the family domain than the other groups (who did not differ from each other). The English L1–German L2 speakers had a higher tendency to use their German L2 with friends and at work, while for the native Spanish speakers with English as their L2, there was comparatively little use of the L2 with friends.
The descriptive and inferential statistics for the predictors extracted by the PCA are given in the Online Appendix, Table A4.
Use of the L1 and the L2 across domains by bilingual populations.

Figure 2. Long description
A grouped boxplot chart. The y-axis is labeled P C A factor with a scale from negative 2 to 2. The x-axis contains three categories. Use of L 1 with family. Use of L 1 with friends and at work. Use of L 2 with friends. A legend on the right identifies four populations. German L 1, English L 2 represented by dark grey with diagonal stripes. Spanish L 1, English L 2 represented by light grey with a cross-hatch pattern. English L 1, German L 2 represented by medium grey with a white dot pattern. English L 1, Spanish L 2 represented by solid light grey.
In the first category, Use of L 1 with family, the German L 1 group has the lowest median near negative 1. The other three groups have higher medians between 0 and 1.
In the second category, Use of L 1 with friends and at work, the German L 1 and Spanish L 1 groups show positive medians around 0.5, while the English L 1, German L 2 group has a significantly lower median near negative 0.7. The English L 1, Spanish L 2 group has a median near 0.7.
In the third category, Use of L 2 with friends, the German L 1 group has a median near 0.2 with a very long upper whisker. The Spanish L 1 group has a median near negative 0.5. The English L 1, German L 2 group has a median near 0.5, and the English L 1, Spanish L 2 group has a median near 0.
Lexical access tasks
Picture naming task
The naming experiment was conducted in person in a quiet environment, with only the participant and the experimenter present.Footnote 7 All participants completed a timed Picture Naming Task (PNT) in their L1; bilingual participants also completed the task in their L2. Presentation of items was pseudo-randomized into two lists (counterbalanced), to ensure that no target item was semantically or phonologically similar to the preceding trial.
We selected 40 line drawings for the Spanish version of the task and 60 items for the German versionFootnote 8 from the database provided by the International Picture Naming Project (IPNP, Bates et al., Reference Bates, D’amico, Jacobsen, Székely, Andonova, Devescovi, Herron, Lu, Pechmann, Pléh, Wicha, Federmeier, Gerdjikova, Gutierrez, Hung, Hsu, Iyer, Kohnert, Mehotcheva and Tzeng2003), see Figure 3 for an example (the list of items is given in the Online Appendix, Table A5).
Example stimulus from Picture Naming Task.

The IPNP is a freely available database, based on a comparison of 512 line drawings of objects across seven languages in terms of a broad range of factors, including frequency, naming speed, and recognizability Matching lexical frequencies across languages is complex, as frequency counts depend on the size and characteristics of the corpora they were derived from,Footnote 9 and Bates et al. propose a “universal frequency” factor, derived through a principal component analysis of a range of frequency measures for the seven languages (see Bates et al., Reference Bates, D’amico, Jacobsen, Székely, Andonova, Devescovi, Herron, Lu, Pechmann, Pléh, Wicha, Federmeier, Gerdjikova, Gutierrez, Hung, Hsu, Iyer, Kohnert, Mehotcheva and Tzeng2003, for details).
The items chosen for the present experiment were spread across this universal frequency measure (mean .31, SD 1.07, range −1.36 to 2.93). This measure correlated with the language-specific log-transformed frequency measure for these items reported by Bates et al. (Reference Bates, D’amico, Jacobsen, Székely, Andonova, Devescovi, Herron, Lu, Pechmann, Pléh, Wicha, Federmeier, Gerdjikova, Gutierrez, Hung, Hsu, Iyer, Kohnert, Mehotcheva and Tzeng2003) at above .8 (English: .89, Spanish: .83, German: .87), and there was no significant difference between the frequency factor of the items included in each language (F(1, 177) = .42, p = .518; for full descriptive statistics see Appendix, Table A6). Word length (in characters) did not differ between languages (English: 5.29, German: 5.73, Spanish: 5.75, F(1, 177) = 2.033, p = .16; for full descriptive statistics see Appendix, Table A6). We had initially hoped to be able to exclude cognate items, but this proved to be impossible, and cognateness is therefore included as a dichotomous factor in the statistical models. Items were coded as cognates if the Spanish and German words shared clear phonological and orthographic similarity stemming from common etymology (e.g., Spanish león /lion or German Anker /anchor). Items were coded as non-cognates if the words were etymologically unrelated or showed substantial phonological divergence (e.g., manzana /apple; Hose /trousers). The resulting lists of items to be named had an average frequency value of .44 for the German version of the task and .30 for the Spanish version (the difference was not significant, t(101) = .633; p = .528), with 28 items in the German version and 15 in the Spanish one being cognates with English.
The pictures were presented on a 17-inch laptop screen with E-Prime version 2.0. Each trial started with a 100 ms beep and a fixation cross displayed in the middle of the screen for 500 ms, with the picture displayed immediately afterward. The display lasted for up to 4000 ms or until a verbal response was detected by the VoiceKey microphone. Each experiment began with eight practice items, after which the participant was given the opportunity to ask questions before proceeding to the main experimental block.
Picture-word interference task
In addition to the PNT, bilingual participants completed a Picture-Word Interference Task (PWIT) in both their languages and monolinguals in their L1. The task used the same stimulus items as the PNT, but a distractor word was added across the picture in sans-serif capitals in the language of the task (see Figure 4). The order of tasks was counterbalanced across participants.
Example stimulus from Picture-Word Interference Task.

Distractor items were semantically and phonetically unrelated to the target item. In all other respects, the experiment was identical to the procedure described under section “Picture naming task.” Presentation of the type (PNT vs. PWIT) and language (L1 vs. L2) of the task was counterbalanced across participants.
Repetition of items
All experiments used the same list of items, so that bilingual participants encountered each picture four times while monolinguals encountered them twice. For half of the participants, the first (or only) PNT (List 1) preceded the first (or only) PWIT (List 2); for the other half, it was the other way around. This order was reversed for each bilingual participant in the second session in the other language. Bilinguals attended two sessions: in the first, they were tested in German and Spanish; in the second (between 2 weeks and 4 months later), they were tested in English.
We opted for this design, as it allowed us to directly compare the impact of both the target language and the presence of the distractor item for each participant on an item-base (see below, Section “Results”); and this choice inevitably led to the repetition of pictures for each participant. Previous research has consistently shown repetition priming across short periods of time (several minutes) (e.g., Francis, Augustini, & Sáenz, 2003; Gollan et al., Reference Gollan, Montoya, Fennema-Notestine and Morris2005; Ivanova & Costa, Reference Ivanova and Costa2008). Repetition effects have been shown to be robust across item frequency (Gollan et al., Reference Gollan, Montoya, Fennema-Notestine and Morris2005; Ivanova & Costa, Reference Ivanova and Costa2008), but differences between monolinguals and bilinguals are not consistently affected across studies: while Gollan et al. (Reference Gollan, Montoya, Fennema-Notestine and Morris2005) found that the difference between monolinguals and bilinguals disappeared from the fourth repetition, Ivanova and Costa (Reference Ivanova and Costa2008) were unable to replicate this leveling.
We attempted to minimize the impact of repetition priming as far as possible within our design: each session administered the PNT and the PWIT in the same language, but counterbalanced the order—half of the participants encountered the PNT first, the other started with the PWIT. Several other tasks not reported here were completed between the two tasks, so that the second task typically started 20–30 minutes after the first. The English experiments were conducted in a separate session—due to participant and lab availability, the interval could not be kept constant, but the minimum time between sessions was 2 weeks.
In order to compensate for the effect of repetition priming, the order of tasks is furthermore included in our statistical models.
Data processing
All experiments were audio recorded on a Tascam recorder. Response latencies were subsequently manually measured in Praat (Boersma & Weenink, Reference Boersma and Weenink2024) by marking the onset of both the beep preceding the trial and the verbal response and then subtracting 500 ms (the time between the onset of beep/fixation cross and image) from the resulting interval. Responses were coded for accuracy, and inaccurate or empty responses, as well as responses preceded by a hesitation or false start (4.59%), were excluded from the analyses. It is customary in naming tasks to exclude very fast responses, which are unlikely to reflect complete cognitive processing and may represent anticipatory or accidental responses, as well as slow responses, which likely reflect lapses in attention or task disengagement rather than genuine naming latency. While there is no commonly agreed threshold for either of these cutoffs, the lower threshold is usually between 150 and 300 ms (e.g., Nappo et al., Reference Nappo, Galati, Bureca and Romani2022; Botezatu et al., Reference Botezatu, Misra and Kroll2022). Since the data had been hand-coded to eliminate false triggers, we opted for a lower threshold at the higher end of the range and excluded 231 responses below 250 ms (1.48%). For the upper threshold, we identified outliers by first trimming the data to exclude 234 responses >4000 ms in order to avoid extreme times distorting the calculation. RTs above the mean plus two standard deviations of the trimmed data per language were then also excluded (n = 519, 3.33%).
Split-half reliability was assessed by randomly dividing the target items into two halves across 100 iterations, calculating mean reaction times for each participant in each half, and correlating these values with the Spearman-Brown correction applied. All six Task × Language combinations demonstrated excellent internal consistency (mean corrected r > .90, see Figure 1, Appendix), indicating that participants’ reaction time patterns were highly stable across different item sets.
Results
In order to answer our Research Questions 1–3, we derived three different outcome variables from the PNT and the PWIT, respectively. The first variable was the log10-transformed naming latency, to determine absolute naming speed (RQ1). Secondly, we attempted to factor out response speed as an individual characteristic in order to measure dominance (RQ2). This was achieved by subtracting the log10-transformed response latency that the bilingual participants had for the same item on the same task in their L1 from that of their L2. So, if the item was, for example, “apple,” a positive value would indicate that a Spanish native speaker had been faster in saying manzana in the Spanish version of this task than apple in the English version (while a negative value would indicate a faster response in the L2 than in the L1), and vice versa for an English-Spanish bilingual. Finally, in order to assess how the necessity to inhibit the unrelated distractor item would impact response latencies (RQ3), we subtracted the log10-transformed item response latency in the PNT from that of the PWIT separately for each item in each of the participants’ languages, with a positive value indicating the participant had responded faster to the same item in the same language when there was no distractor than when there was. While all statistical models are based on the log10-transformed RTs, we used the millisecond measures for any visualizations, for ease of interpretation.
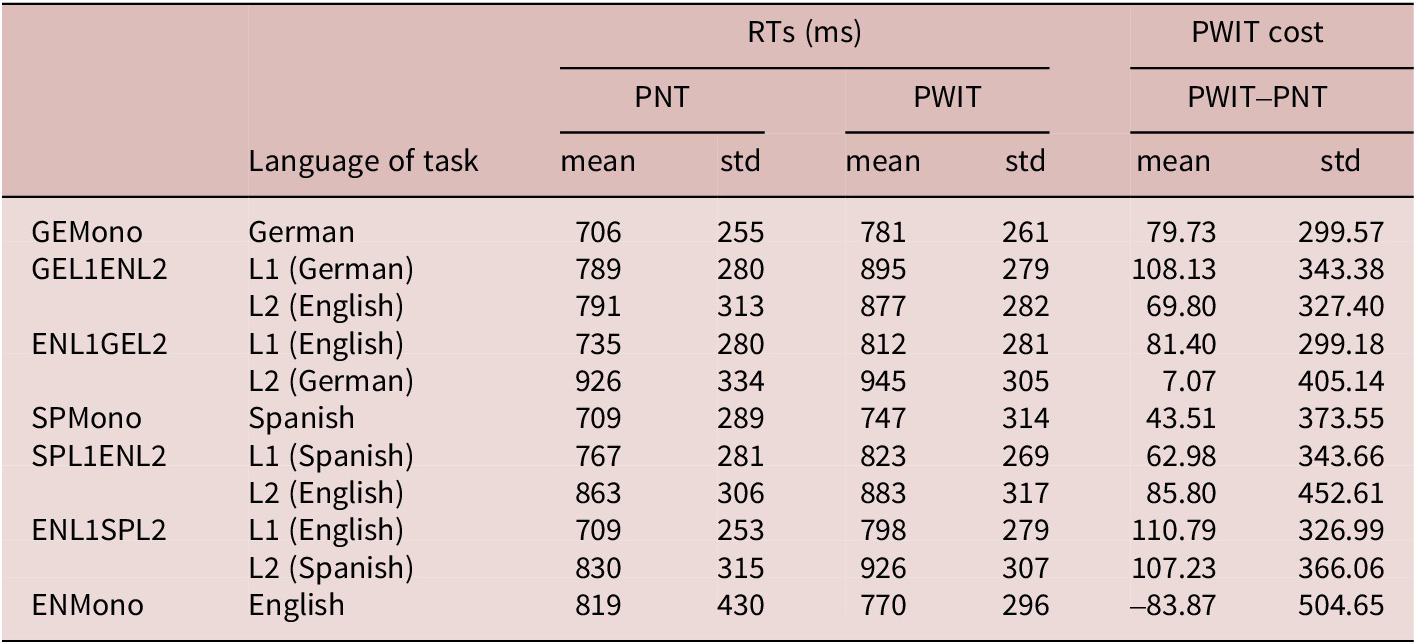
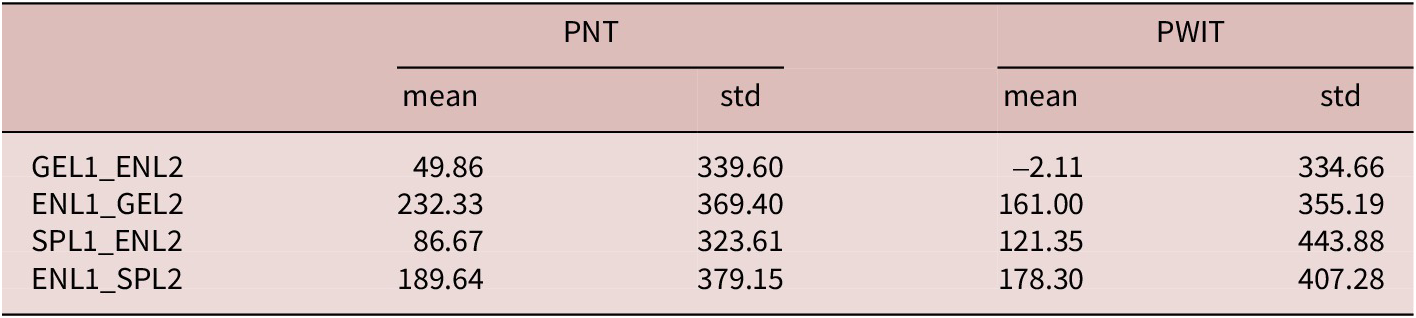
The descriptive statistics for these three variables are summarized in Tables 4 (RT and PWIT cost) and 5 (difference L1-L2). For ease of interpretation, these tables give the base values in place of the log-transformed RTs which we use in the models.
Average Naming Speed and PWIT Cost (ms) by Population

Table 4. Long description
The table is organized into columns for Population, Language of task, R T s in milliseconds for P N T and P W I T, and P W I T cost (P W I T minus P N T). Each metric includes mean and std (standard deviation).
* G E Mono (German): P N T mean 706, std 255; P W I T mean 781, std 261; Cost mean 79.73, std 299.57.
* G E L 1 E N L 2 (L 1 German): P N T mean 789, std 280; P W I T mean 895, std 279; Cost mean 108.13, std 343.38.
* G E L 1 E N L 2 (L 2 English): P N T mean 791, std 313; P W I T mean 877, std 282; Cost mean 69.80, std 327.40.
* E N L 1 G E L 2 (L 1 English): P N T mean 735, std 280; P W I T mean 812, std 281; Cost mean 81.40, std 299.18.
* E N L 1 G E L 2 (L 2 German): P N T mean 926, std 334; P W I T mean 945, std 305; Cost mean 7.07, std 405.14.
* S P Mono (Spanish): P N T mean 709, std 289; P W I T mean 747, std 314; Cost mean 43.51, std 373.55.
* S P L 1 E N L 2 (L 1 Spanish): P N T mean 767, std 281; P W I T mean 823, std 269; Cost mean 62.98, std 343.66.
* S P L 1 E N L 2 (L 2 English): P N T mean 863, std 306; P W I T mean 883, std 317; Cost mean 85.80, std 452.61.
* E N L 1 S P L 2 (L 1 English): P N T mean 709, std 253; P W I T mean 798, std 279; Cost mean 110.79, std 326.99.
* E N L 1 S P L 2 (L 2 Spanish): P N T mean 830, std 315; P W I T mean 926, std 307; Cost mean 107.23, std 366.06.
* E N Mono (English): P N T mean 819, std 430; P W I T mean 770, std 296; Cost mean minus 83.87, std 504.65.
Average Difference Measure in Naming Speed (ms) Between L1 and L2 by Population

Table 5. Long description
The table is organized into five columns. The first column lists the population groups, followed by two columns for P N T (mean and std) and two columns for P W I T (mean and std).
* G E L 1 underscore E N L 2: P N T mean 49.86, std 339.60; P W I T mean negative 2.11, std 334.66.
* E N L 1 underscore G E L 2: P N T mean 232.33, std 369.40; P W I T mean 161.00, std 355.19.
* S P L 1 underscore E N L 2: P N T mean 86.67, std 323.61; P W I T mean 121.35, std 443.88.
* E N L 1 underscore S P L 2: P N T mean 189.64, std 379.15; P W I T mean 178.30, std 407.28.
Summary of Results

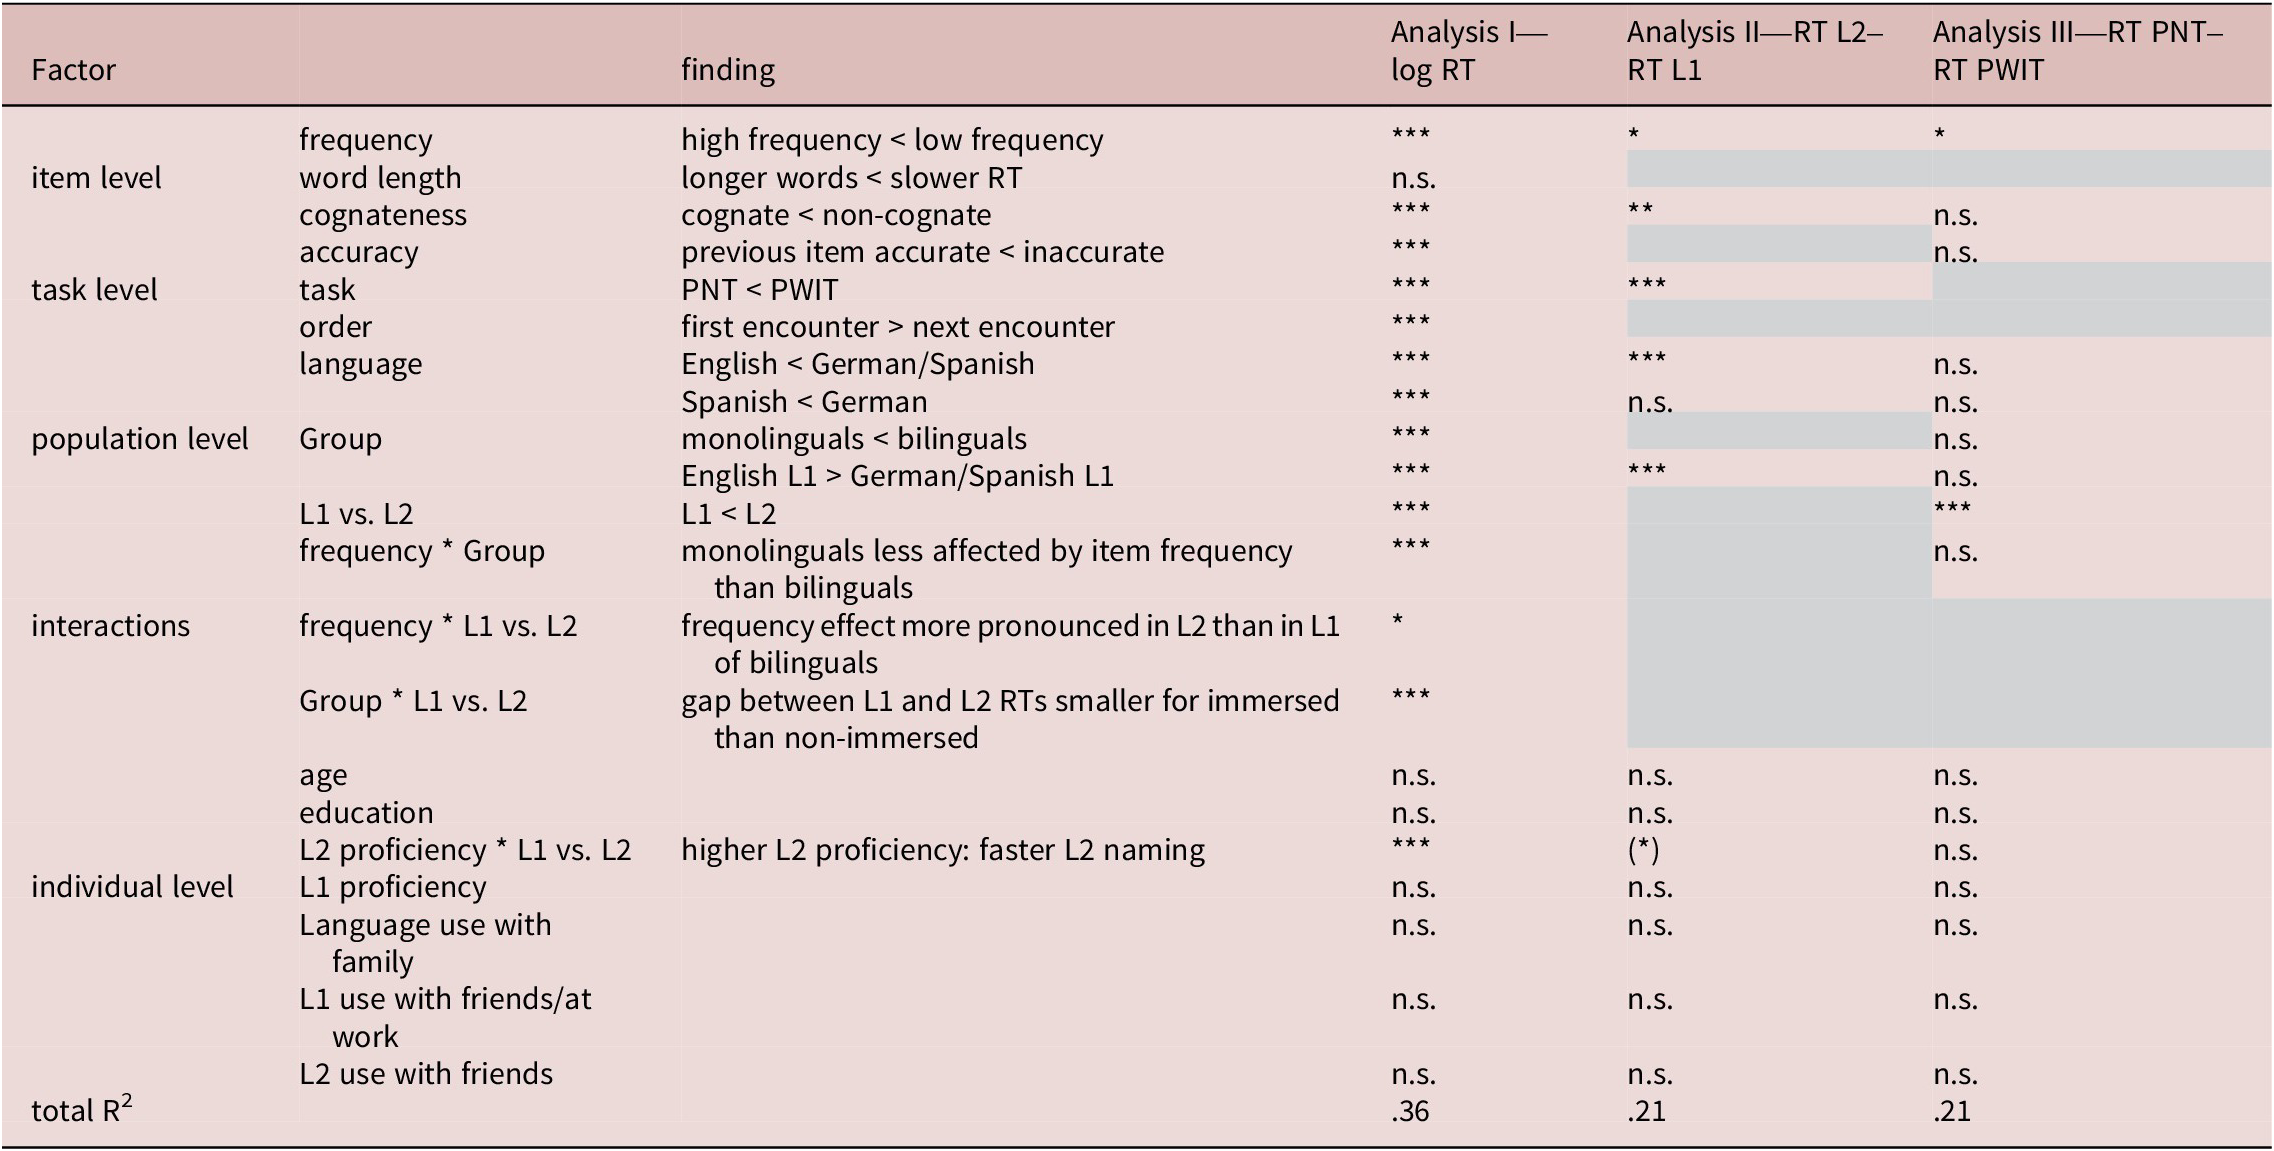
Table 6. Long description
The table consists of six columns: Factor, Sub-factor, Finding, Analysis I log R T, Analysis II R T L 2 minus R T L 1, and Analysis III R T P N T minus R T P W I T. Significance is denoted by asterisks where three asterisks indicate p less than .001, two indicate p less than .01, and one indicates p less than .05.
* Item level factors: Frequency (high frequency faster than low frequency) shows high significance across all analyses. Word length is not significant. Cognateness (cognates faster than non-cognates) is highly significant in Analysis I and II. Previous item accuracy is highly significant in Analysis I.
* Task level factors: Task (P N T faster than P W I T) and Language (English faster than German or Spanish) are highly significant in Analysis I and II. Order (first encounter slower than next) is highly significant in Analysis I.
* Population level factors: Group (monolinguals faster than bilinguals), L 1 versus L 2 (L 1 faster than L 2), and L 1 background are highly significant in Analysis I. L 1 versus L 2 is also highly significant in Analysis III.
* Interactions: Frequency by Group and Group by L 1 versus L 2 are highly significant in Analysis I. L 2 proficiency by L 1 versus L 2 is highly significant in Analysis I and marginally significant in Analysis II.
* Individual level factors: Age, education, L 1 proficiency, and various language use metrics with family or friends are all listed as not significant (n.s.) across all analyses.
* Total R-squared values are .36 for Analysis I, .21 for Analysis II, and .21 for Analysis III.
*: p < .05, **: p < .01, ***: p < .001, (*) = p <.1.
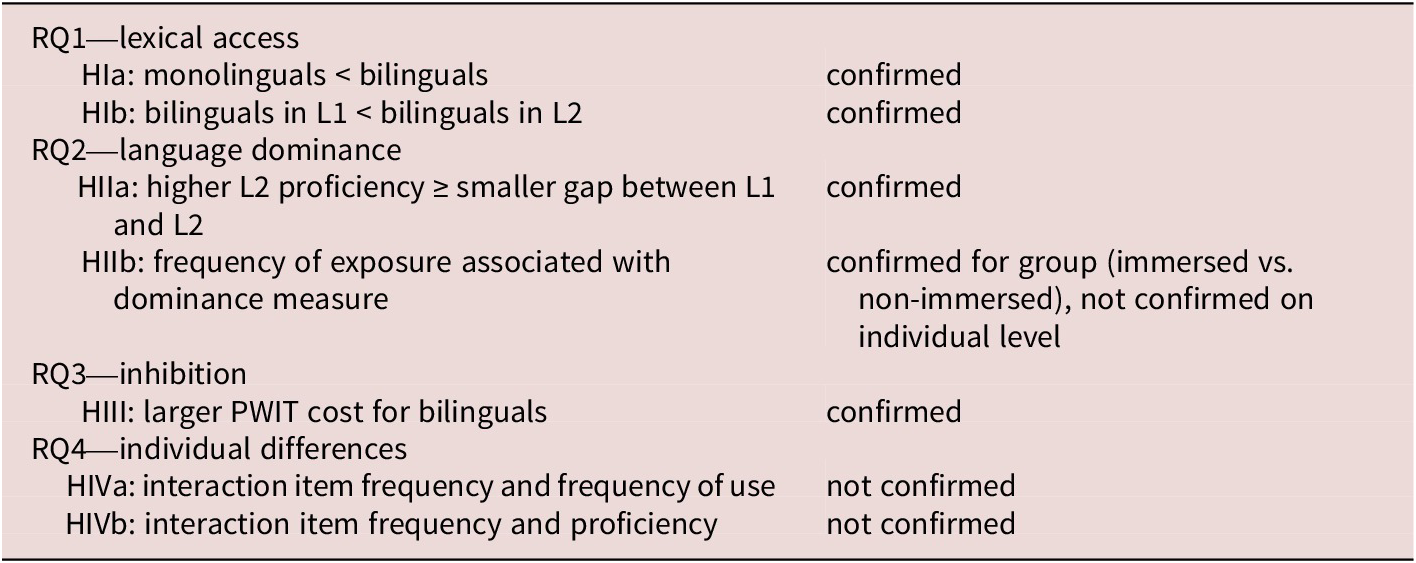
Summary of RQs, Hypotheses, and Findings

Table 7. Long description
The table is divided into four main sections based on Research Questions.
Section 1. R Q 1 lexical access.
- Hypothesis H I a. monolinguals are less than bilinguals. Finding. confirmed.
- Hypothesis H I b. bilinguals in L 1 are less than bilinguals in L 2. Finding. confirmed.
Section 2. R Q 2 language dominance.
- Hypothesis H I I a. higher L 2 proficiency is greater than or equal to a smaller gap between L 1 and L 2. Finding. confirmed.
- Hypothesis H I I b. frequency of exposure associated with dominance measure. Finding. confirmed for group immersed versus non-immersed, but not confirmed on an individual level.
Section 3. R Q 3 inhibition.
- Hypothesis H I I I. larger P W I T cost for bilinguals. Finding. confirmed.
Section 4. R Q 4 individual differences.
- Hypothesis H I V a. interaction item frequency and frequency of use. Finding. not confirmed.
- Hypothesis H I V b. interaction item frequency and proficiency. Finding. not confirmed.
We built three sets of Linear Mixed-Effects Regression (LMER) models, one for each of these different outcome variables. Since the experiment comprised three target languages (English, German and Spanish), with all bilingual participants completing half of the naming tasks in English, but being split into a Spanish and a German subgroup for the other two, we created nested contrasts to be able to represent this in the models. The first contrast compared the target language English with the two other target languages (Spanish and German) combined, whereas the second contrast compared German with Spanish. In addition, we created sum-coded contrasts (−.5, .5) to represent the binary variables of cognate status (cognate vs. non-cognate), Task (PNT vs. PWIT), accuracy of the previous item (accurate vs. inaccurate—inaccurate items were not included in the analysis; but there may be a delay in naming latency for an accurately named item following an error or failure to retrieve the previous item, and this delay may distort overall reaction times for bilinguals in their weaker language), and whether the language of the task was the participant’s L1 or L2. “List,” indicating the order of experiments (PNT first or PWIT first), was similarly sum-coded (−.5, .5). All models were built in R version 4.3.0 (R Core Team, 2023) with the lme4 package (Bates, Maechler, Bolker, & Walker, Reference Bates, Mächler, Bolker and Walker2015).
Log10-transformed RT in both tasks and both languages (Analysis I)
Our first analysis investigated RQ1 and the hypothesis that monolinguals would be faster, in absolute terms, than bilinguals when naming items, and that bilinguals would name them faster in their L1 than in their L2. Our initial model thus included the log10-transformed RT from all participants, all tasks, and all languages. (All full model specifications are available in the Appendix, an overview summary is provided in Table 6.)
Predictors were entered in two steps: the first step comprised predictors related to the experimental design: frequency of items, word length (number of characters), cognateness, accuracy of the previous item, task (PNT vs. PWIT), and item repetition (List 1 vs. List 2). It furthermore included the contrast-coded variables language of the task and Group, as well as the age and education level of the participants.
Word length, age, and education were not significant predictors and were therefore not included in the further analyses. All other predictors were highly significant: participants were faster to name more frequent (estimate = −0.025, SE = 0.001, t = −28.682, p < .001) and cognate (estimate = 0.036, SE = 0.002, t = 19.249, p < .001) items, and errors on an item caused a delay in the naming of the next one (estimate = −0.039, SE = 0.005, t = −8.454, p < .001) (recall that inaccurate items themselves were not included in the analyses). Items were named faster in the PNT than in the PWIT (estimate = −0.037, SE = 0.002, t = −22.069, p < .001), and faster when they were encountered for the second time within the same session (estimate = −0.020, SE = 0.001, t = −16.585, p < .001). Task language was significant, with responses in English faster than in the other languages (combined) (estimate = −0.018, SE = 0.002, t = −10.371, p < .001) and Spanish responses faster than German responses (estimate = 0.037, SE = 0.005, t = 7.476, p < .001). Bilinguals performed more slowly than monolinguals (estimate = −0.048, SE = 0.006, t = −7.376, p < .001) with speakers with English L1 outperformed by speakers with German or Spanish L1 (estimate = −0.042, SE = 0.008, t = −5.503, p < .001). An interaction term between frequency and group showed that the frequency effect was somewhat less pronounced in the monolingual groups than in the bilinguals (estimate = 0.002, SE = 0.001, t = 2.205, p < .05), while bilinguals with English as their L1 did not differ from bilinguals with German or Spanish as their L1 (estimate = 0.000, SE = 0.002, t = −0.034, p = 0.973). The total explained variance was .33.
In the second step, we reduced the dataset to comprise only bilingual participants, in order to be able to assess the impact of the bilingualism-specific predictors, retaining all predictors that had been significant in the previous step. We first determined to what extent participants’ response times would vary depending on whether they were naming an item in their L1 or their L2, and found that participants were faster in their L1 than in their L2 (estimate = 0.02, SE = 0.00, t = 7.300, p < .001). An interaction term between language of the task and item frequency was significant, indicating that frequency had a stronger effect in the L2 than in the L1 (estimate = −0.00, SE = 0.00, t = −2.554, p < .05). We also found a significant interaction between the group (L1 English vs. L2 English) and whether the task was in the L1 or in the L2: the immersed bilinguals for whom English was the second language were virtually equally fast in the L1 and the L2, whereas the non-immersed bilinguals were slower in their L2 (estimate = 0.06, SE = 0.00, t = 11.822, p < .001).
Finally, we added the five components that were derived from the Language Background Survey by means of the PCA (see above, section “Participants”) to the model, in each case calculating the interaction term with whether the task was completed in the participant’s L1 or L2. There was no interaction between L1 proficiency and the language of the task, but a highly significant interaction term between L2 proficiency and the language of the task (estimate = −0.01, SE = 0.00, t = −4.476, p < .001), indicating that participants with higher L2 proficiency were faster to name items in their L2, but no such effect was found for the L1. None of the measures of frequency of L1 use were significant, either on their own or in interaction with the language of the task. The total explained variance was .36.
Difference in naming latency per item in L1 vs. L2 (Analysis II)
The second set of analyses investigates language dominance among the bilingual populations, attempting to establish how the factors investigated in relation to absolute naming times above may modulate response latencies in the L1 vs. the L2—that is, how language dominance is affected. Since Analysis II was based on a variable that represented the difference in naming latency for each item in the participants’ L2 vs. their L1 (e.g., speed of saying apple minus speed of saying manzana ), the model was built using a subset of the data comprising the bilingual participants only, and the language in which the task was conducted or whether it was the participant’s L1 or L2 were not applicable predictors.
The gap between the L1 and the L2 was smaller for more frequent (estimate = −.007, SE = .003, t = 2.437, p < .05) and for cognate (estimate = .017, SE = .006, t = 2.812, p < .01) items. It was larger for the PNT than the PWIT (estimate = .031, SE = .005, t = 6.772, p < .001) and larger for English natives than for English L2 speakers (estimate = .040, SE = .012, t = 3.232, p < .001), but Spanish and German speakers did not differ from each other (estimate = −.013, SE = .023, t = −.581, p = .563). Age and education were again not significant predictors. None of the PCA components significantly impacted this measure of language dominance; the only marginally significant effect was that a higher level of L2 proficiency was associated with a smaller gap between L1 and L2 (estimate = −0.018, SE = 0.010, t = −1.879, p = .065). None of the measures relating to frequency of use or L1 proficiency emerged as significant. The total explained variance was .21.
Impact of picture-word interference paradigm (Analysis III)
In the final set of analyses, we investigated the impact of the presence of a (semantically and phonologically unrelated) distractor item printed across the picture. In order to calculate the effect of this manipulation, we subtracted the naming latency with which each participant had named an individual item in the PNT from that for the same item in the PWIT in the same language. The delay caused by the distractor was larger for more frequent items (estimate = .007, .003, t = 2.273, p < .05) but unaffected by cognate status, accuracy of the previously named item, item repetition, age, or education. There was no difference in the impact the presence of a distractor item had for monolinguals vs. bilinguals, or for the different bilingual subpopulations, but the gap was larger in participants’ L1 than in their L2 (estimate = .017, .004, t = 4.103, p < .001).
We again continued the analyses with a subset of the data comprising the bilingual participants. The analyses conducted on this subset only found a significant gap between participants’ L1 and their L2 (estimate = .019, .004, t = 4.649, p < .001). None of the composite scores derived by the PCA had a significant effect on the delay caused by the presence of a distractor item. The total effect size was .21.
Discussion
In this study, we assessed the speed of lexical naming in bilingual and monolingual populations. While the monolinguals only named items in their L1, bilinguals conducted the experiment in two sessions, one in their L1 and one in their L2. The items to be named were spread across the frequency range, from high-frequency items such as hand or house to low-frequency ones (rake, asparagus) (Bates et al., Reference Bates, D’amico, Jacobsen, Székely, Andonova, Devescovi, Herron, Lu, Pechmann, Pléh, Wicha, Federmeier, Gerdjikova, Gutierrez, Hung, Hsu, Iyer, Kohnert, Mehotcheva and Tzeng2003). We assessed a range of variables capturing the background, language habits, and proficiency of our participants: two tasks (a C-Test and a Can-Do scale) and various self-assessment questions were used to estimate L1 and L2 proficiency, and frequency of use of either language in a range of contexts. From these variables, we derived five composite descriptors of L1 and L2 proficiency and use.
We initially investigated the impact of factors relating to the stimuli or trials: item frequency, word length, cognateness, and recovery time after an item was named incorrectly or not retrieved. Word length was not a significant predictor of response speed, but our analyses confirmed previous findings for the other three factors: All groups named more frequent items faster than less frequent ones, and the slope associated with frequency was steeper in the second than in the first language and steeper for bilinguals than for monolinguals. Cognate items were named faster than noncognates, and the cognate facilitation effect was stronger in the L2 than in the L1. Errors or retrieval failure had a “spillover” effect on the next item to be named, and this recovery time was longer in participants’ L2 than in their L1. Of these factors, word frequency was the only one to impact the difference between response times in the presence vs. absence of a distractor item.
RQ1—Lexical access: In the next step, we assessed characteristics of the populations. Our first research question related to the differences in naming speed between the populations. We had two hypotheses here, namely, that bilinguals would a) perform slower than monolinguals in both their L1 and their L2, and b) perform slower in their L2 than in their L1, and both of these hypotheses were confirmed by Analysis I. There are three possible, and not mutually exclusive, explanations for this finding:
-
a) naming in bilinguals is delayed due to a larger repertoire (e.g., Ramscar et al., Reference Ramscar, Hendrix, Love and Baayen2013)
-
b) naming in bilinguals is delayed due to a lower frequency with which items are encountered (e.g., Gollan et al., Reference Gollan, Montoya, Fennema-Notestine and Morris2005; 2008)
-
c) naming in bilinguals is delayed due to the additional task of inhibiting competitors in the other language (e.g., Shao, Meyer, & Roelofs, Reference Shao, Meyer and Roelofs2013)
In order to assess to what extent these three explanations contribute to overall speed of lexical access for our participants, we included a range of predictors. Language proficiency was included on the assumption that a higher level of proficiency is a proxy of a larger repertoire (note that we did not include any tasks explicitly measuring vocabulary size). The potential impact of this variable is complex: higher L2 proficiency can be assumed to facilitate naming in the L2; however, if a larger repertoire leads to overall slower naming, higher L2 proficiency, which implicates a larger vocabulary, should slow down naming in the L1. This was not the case, with L2 proficiency indeed associated with faster L2 naming, but not with any delays in the L1.
The second potential explanation, namely that bilinguals are delayed due to the fact that they have to spread their time across their languages, is more complex. Our bilingual participants performed slower overall than the monolinguals, with the immersed participants (who presumably spend more time on their L2 and less on their L1) not only outperforming the non-immersed ones, but being almost equally fast in their L1 and their L2, while the non-immersed bilinguals performed much slower in L2 than in L1—however, both groups were almost equally fast in their L1. This finding implies that a higher frequency of use of a second language learned later in life allows RTs to speed up until they eventually catch up with the naming latencies of L1 items. On the other hand, a decrease in use of the L1 does not appear to cause a similarly substantive slowdown of naming speed. It is also interesting that, while the overall group effect demonstrates the differential effect of immersed vs. non-immersed bilingualism, the individual measures on reported usage of L1 and L2 across a range of contexts do not appear to play a role.
We will return to the third explanation listed here below, when we discuss RQ3.
RQ2—Language dominance: The second research question related to the relative speed with which individual bilinguals would name items in their L1 vs. their L2. This analysis was done in order to factor out the individual variable of overall response speed and focus on how much faster or slower each participant had named the same item in their L2 vs. their L1, on the assumption that naming in the dominant language would be faster. Two hypotheses were formulated here: firstly, that the difference measure would be associated with L1 and L2 proficiency, and secondly, that it would be modulated by individual frequency of exposure, with more use of the L1 associated with a larger gap, and more use of the L2 with a smaller one.
The descriptive statistics show that, out of the four bilingual groups, only the German speakers in the UK performed similarly fast in their L1 and their L2 at group level, and they were also the only population for whom the proficiency tests indicated a relatively balanced level; all other populations were faster at naming in their L1 and scored higher on the L1 proficiency tasks than in their L2. The statistical analyses confirmed Hypothesis IIa, in that higher L2 proficiency was associated with a marginally smaller difference between L2 and L1. With respect to frequency of use, we again found a group effect, showing a smaller gap between L1 and L2 response speed for the immersed bilinguals than for the non-immersed population, but no impact of the individual measures of differential frequency of use across a variety of domains.
RQ3—Inhibition: As predicted, all populations were slower to name items in the PWIT than in the PNT. We had hypothesized that the additional effort of selectively inhibiting an unrelated competitor item in the PWIT, which has been shown to incur demands similar to those of inhibiting competitors from the non-target language, would lead to a larger gap between PNT than PWIT for bilinguals (where the two inhibitory efforts compound each other). This hypothesis was confirmed. Unlike in the other analyses, there was no difference between the immersed and the non-immersed populations, but the gap between PWIT and PNT was larger in participants’ L2 than in their L1.
RQ4—Individual differences: Our final research question and set of hypotheses addressed the question of how item characteristics and individual characteristics would conspire to affect individual naming speed. Here, however, we drew a blank: while our analyses confirmed previous findings that item frequency would have a stronger impact on naming speed in the L2 than in the L1, and while there was some support for the assumption that immersed populations would have stronger L2 performance than non-immersed participants, we could not find any evidence of interactions between this factor and either proficiency or frequency of use in either language.
There are some interesting insights to be drawn from these findings beyond the fact that they confirm previous investigations with respect to the impact of frequency, cognateness, and bilingualism vs. monolingualism. While our predictions relating to the level of the population are largely borne out by our analyses, at the individual level, we find much less support for our assumptions. The exception here is the relatively straightforward measure of L2 proficiency, which has been shown to facilitate naming in the L2, leading to more balanced performance in both languages.
Much more confusing is the factor of language use. This factor poses a perennial puzzle in studies of L1 attrition, as has often been pointed out in the past (see Schmid, Reference Schmid, Schmid and Köpke2019, for an overview), and it does not disappoint here, either. Theories of entrenchment or activation thresholds predict a straightforward association, with more frequent use facilitating both access and accuracy, but this association has never been confirmed for the L1 of bilinguals, and it is not confirmed here, either. While we find that immersed speakers overall become faster in their L2, neither immersion vs. non-immersion nor any of the measures of individual use seem to facilitate or hinder L1 response latency. One possible explanation is that self-report data, on which the assessment of frequency of use in long-term bilinguals has to rely, may not be fine-grained or accurate enough—however, it is striking that a broad range of studies using different approaches to the measurement of bilingual language exposure and use have, to date, not been able to find a correspondence between these measures and any aspect of L1 performance in an attrition setting. Schmid (Reference Schmid, Köpke, Schmid, Keijzer and Dostert2007) proposes that late bilinguals, who use one language exclusively or virtually exclusively until they reach puberty, may reach a “saturation threshold” of activation levels which remain impervious to a decline in use and activation later on, and this seems to be what we have found here, as well.
Conclusion
This study set out to explore the impact of frequency as a predictor of naming speed in bilinguals, and in particular to explore interactions between the item-level variable of word frequency and the individual characteristic of frequency of language use in bilinguals’ first and second languages. While our analyses clearly confirmed earlier findings that higher-frequency items are named faster in both languages, with a steeper slope in participants’ L2 than in their L1, and while it seems that immersed bilinguals have an advantage over non-immersed ones with respect to naming speed in the L2, we did not find any suggestion that naming speed in the L1 is similarly affected by the linguistic environment, and neither L1 nor L2 naming was affected by self-reported individual levels of L1 or L2 use across a range of domains. This finding throws into question some widely held notions relating to the activation and entrenchment of linguistic items. We found that generally, even long-term immersed late bilinguals with high levels of L2 proficiency and frequent L2 use do not become faster at naming in the L2 than in the L1 (at most, some balanced bilinguals attain similar reaction times, but overall, the L1 remains faster). Particularly intriguing is the finding that bilinguals do appear to become slower in their L1 than monolinguals of the same language, but that this effect appears to be the outcome of adding an additional language, rather than of a decrease of exposure in that language. The slowdown in lexical retrieval observed in the L1 of bilinguals thus appears to be the outcome of the added cognitive pressure of managing more than one linguistic system, rather than of a weakening of entrenchment due to a decline in exposure.
The present study had some limitations, most obviously that our intended participant pool could not be attained, due to the pandemic. It is possible that the failure of some of the individual predictors to have a significant effect is due to a lack of power. Future work should aim to increase population sizes to assess this.
Supplementary material
The supplementary material for this article can be found at http://doi.org/10.1017/S0272263126101806.
Data availability statement
The anonymised data and scripts for the analyses reported here are available on OSF: https://osf.io/38b2j/overview?view_only=8f4c607d136a468e996a6950d29f5fab.
Acknowledgments
The study presented here was supported by a Research Priming fund from the University of Essex.
Competing interests
The authors declare none.


 Open access