
I. INTRODUCTION
Throughout our lifetime we seamlessly perform simple actions such as detecting and recognizing faces, identifying objects and events, and reading handwritten text on a daily basis. The human visual system is a powerful yet very efficient apparatus that is able to detect visible light and process it to extract and store a semantic representation of the environment. It acquires data thanks to light receptive sensors, i.e. the eyes, and generates electro-chemical impulses that are transmitted up to the visual cortex through neural pathways. While comprising a number of complex operations, such a process is very efficient and requires very few resources to be performed.
Man-made systems for image acquisition and processing, such as digital cameras, mimic a simplified version of the visual system. Images are acquired by sampling and quantizing the continuous light field on a lattice of pixels. Then, images are compressed in order to be efficiently stored or transmitted. Besides image acquisition and encoding, a large body of research addressed the problem of extracting semantic information from visual content. The first contributions to computer vision date back to the early 1960s [Reference Hu1], mainly devoted to a statistical characterization of visual patterns. Thereafter, computer vision emerged as a research community, addressing a large number of problems, e.g. character recognition, event and object detection, and image classification.
In the last two decades, visual features have been proposed and used as a powerful tool that enables a broad range of visual content analysis tasks. Visual features can be categorized in two main classes: local features that capture the visual characteristics of specific regions of interest within an image, and global features that condense the characteristic of a whole image in a single, compact signature. Due to their ability to concisely summarize the semantic content of an image, visual features are a cornerstone for many complex visual analysis pipelines, including object detection, tracking and recognition, image classification, image calibration, and many others.
Recently, several efforts have been made to integrate image acquisition, analysis and storage on low-power and distributed devices [Reference Baroffio, Cesana, Redondi and Tagliasacchi2]. Smartphones, visual sensor nodes, and smart cameras, are able to carry out complex tasks in a distributed fashion or interacting over a network. Besides acquiring and storing images and videos, they are able to recognize objects, people, landmarks and buildings, automatically detect hazardous events, and stitch shots so as to generate a unique, panoramic photograph. The traditional approach to distributed visual content analysis, hereafter denoted as “Compress-Then-Analyze” (CTA), heavily depends on a central processing node. According to such approach, a device acquires visual content in the form of still images or video sequences, compresses it resorting to either image or video coding techniques and transmits it to a central node, where a given analysis task is executed. Finally, the central unit transmits the results of the task back to the peripheral node. Although being successfully implemented in a number of applications, CTA has some limitations. The sink node relies on a lossy representation of the original signal, due to image or video compression, which contains coding artifacts that could possibly impair the results of the analysis. Furthermore, most visual content analysis tasks require only a succinct representation of the acquired visual content in order to be performed. Hence, sending pixel-level representations of the content might not be the most rate- and energy-efficient solution, yielding a possibly large transmission overhead [Reference Baroffio, Cesana, Redondi and Tagliasacchi3].
In recent years, with the advent of more and more powerful computing architectures and efficient computer vision algorithms, a novel approach is gaining popularity within both the scientific community [Reference Baroffio, Cesana, Redondi and Tagliasacchi2] and the industry [Reference Duan, Gao, Chen, Lin and Huang4]. Such an approach, hereafter denoted as “Analyze-Then-Compress” (ATC), moves part of the analysis directly on sensing nodes. As shown in Fig. 1, ATC and CTA represent concurrent paradigms that can be implemented to tackle distributed visual content analysis. In particular, according to ATC, sensing nodes acquire the content, extract semantic information from it in the form of visual features that are subsequently exploited directly on the node or compressed and transmitted to a central unit in order to carry out a given high-level task.
Pipelines for the “Analyze-Then-Compress” and “Compress-Then-Analyze” paradigms.

Most reference hardware and networking platforms that could possibly enable the ATC paradigm, such as smartphones or Visual Sensor Networks (VSN), have strict constraints on available computational capabilities, transmission bandwidth, and energy resources [Reference Baroffio, Cesana, Redondi and Tagliasacchi2]. Hence, efficient algorithms for visual feature extraction, compression, and transmission are key to the success of ATC. Since a decade ago, algorithms for feature extraction are being constantly improved, with the aim of generating compact, discriminative, and low-complexity descriptors.
To cope with bandwidth scarcity, ad hoc coding algorithms tailored to visual features have been recently proposed. Such algorithms can be split into two main categories: local feature compression and global feature encoding methods. The former exploits the inherent redundancy within a feature or within sets of feature to efficiently reduce the number of bits needed to represent a descriptor. Such approaches are usually inspired by traditional image and video coding techniques, comprising a transform aimed at exploiting spatial or temporal redundancy, or a projection of the signal into a lower-dimensional space, along with ad hoc entropy coding algorithms.
As to global feature encoding, local features extracted from a still image are aggregated so as to create a single signature [Reference Sivic and Zisserman5]. Global feature encoding algorithms aim at digesting the large amount of information pertaining to local features and to their spatial relationship, creating a signature that is able to effectively yet concisely describe the entire image. Such approach is particularly suitable to large-scale applications, in which matching sets of local features is computationally expensive or even unfeasible. Nonetheless, global features are not able to completely describe the spatial relationship between local features, thus being unsuitable to applications that require geometric verification, such as calibration, structure-from-motion, and object tracking.
Besides such two main coding approaches, entirely devoted to compression of visual features, several hybrid coding techniques are being proposed. They address the problem of jointly encoding images (or video sequences) and visual features. Within this broad category, several approaches are being pursued. On the one hand, some methods modify the traditional image or video coding pipelines so as to preserve the quality of the features that are extracted from lossy content [Reference Chao and Steinbach6]. On the other hand, features and visual content can be jointly encoded in an efficient fashion, achieving a tradeoff between the quality of visual content and the effectiveness of features [Reference Baroffio, Cesana, Redondi, Tagliasacchi and Tubaro7].
A recent line of research addresses the extraction and compression of visual feature starting from video sequences. To this end, the content is processed either on a frame-by-frame basis or considering Groups-Of-Pictures (GOP). Regarding the extraction of features, temporal redundancy can be exploited to speed up the feature extraction process [Reference Baroffio, Cesana, Redondi, Tubaro and Tagliasacchi8]. Besides, the problem of extracting temporally coherent features has been thoroughly addressed in the previous literature. Temporally stable detectors and consistent descriptors lead to significant improvements in both accuracy and coding efficiency, especially considering tracking scenarios [Reference Makar, Tsai, Chandrasekhar, Chen and Girod9]. As to the compression of features extracted from video, several different lossy and lossless architectures have been proposed, targeting either local [Reference Makar, Tsai, Chandrasekhar, Chen and Girod9,Reference Baroffio, Cesana, Redondi, Tagliasacchi and Tubaro10] or global [Reference Baroffio, Canclini, Cesana, Redondi, Tagliasacchi and Tubaro11] features. Such architectures usually take inspiration from the traditional video coding techniques, adapting the coding process to the signal at hand. As in the case of video coding, temporal redundancy can be exploited to encode visual features, providing a significant coding gain with respect to the case of still images.
Similar works in the previous literatures focus on either feature extraction [Reference Canclini, Cesana, Redondi, Tagliasacchi, Ascenso and Cilla12,Reference Miksik and Mikolajczyk13] or encoding [Reference Chandrasekhar14,Reference Chatfield, Lempitsky, Vedaldi and Zisserman15]. In this work, we propose a comprehensive survey on algorithms and methods for constructing and exploiting compact visual features, meticulously addressing each step of the pipeline, i.e. feature extraction, compression, and transmission. To the best of the authors’ knowledge, this is the first attempt at offering a complete overview of the problem.
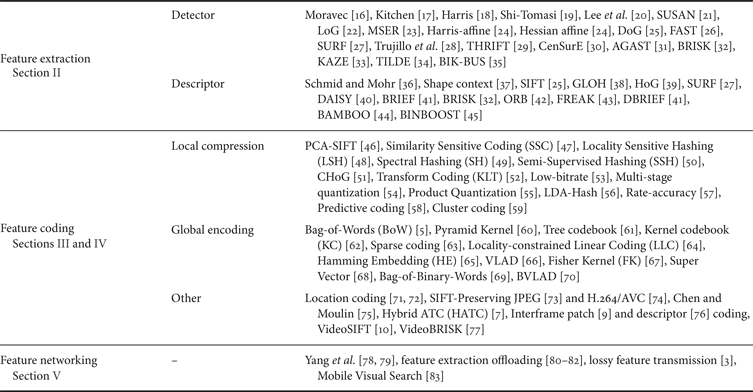
The rest of the paper is organized as follows: Section II presents visual feature extraction algorithms, highlighting their main characteristics. Feature encoding techniques are illustrated and compared in Section III. Section IV addresses the problem of extracting and encoding visual features from video sequences and Section V illustrates networking techniques tailored to the context of visual features. Finally, conclusions are drawn in Section VI. For the convenience of the reader, Table 1 offers a summary of methods and algorithms presented in this surveyFootnote 1 .
Summary of the methods presented in this survey.
II. LOCAL FEATURE EXTRACTION
We distinguish between two main classes of visual features: local features, capturing the local information of a given interest point or region of interest, and global features, yielding a compact signature for the input image, based on its content. Global representations are often built starting from a set of local features, by applying proper pooling or aggregation functions. Section III-C thoroughly explores the problem of building global representations starting from local features, whereas in the following we address the extraction of local features from visual content.
The definition of local feature is not univocal, heavily depending on the problem at hand and on the type of application. Nonetheless, the feature extraction process usually comprises two main steps: (i) a detector, that identifies keypoints (e.g. blobs, corners, and edges) within an image, and (ii) a keypoint descriptor that assigns to each detected keypoint a descriptive signature consisting of a set of (either real-valued or binary) values, based on the visual characteristics of the image patch surrounding such keypoint.
A) Keypoint detectors
Detecting interest points within an image is the first step toward visual feature extraction. A keypoint detector should be able to identify salient points under very different imaging conditions, such as illumination, contrast, point of view, etc. Hence, a key requirement for a feature detector is repeatability, that is, the ability of the algorithm to detect the same physical interest point in two or more images representing the same scene under different imaging conditions. Depending on the application, several different definitions of keypoints have been proposed. In particular, edges, corners, blobs, and ridges represent instances of interest points, each targeting and capturing peculiar image properties. Table 2 offers an overview and a taxonomy of the most common feature detection algorithms. In the following, we will describe the two most common classes of keypoint detectors, that is, corner and blob detectors.
Overview of the most common local feature detectors.

1) Corner detectors
The first attempts at extracting image features date back to the late 1970s. At that time, early computer vision systems were proposed, aimed at understanding scenes and enabling robot navigation. Such early attempts were able to detect corners by first applying segmentation to the input image to separate physical objects, and by subsequently analyzing their shapes. Such methods suffer from segmentation errors and their performance is consistently impaired by noise and cluttered textures.
Kitchen and Rosenfeld observe that corners correspond to changes of edge direction, and introduce an algorithm that is able to detect corners exploiting edge intensity and direction information [Reference Kitchen and Rosenfeld17]. Despite being effective on artificial and simple shapes, such an approach is sensitive to noise and not accurate when considering natural scenes.
Moravec was the first to define image features back in 1979, proposing an automated robot navigation system [Reference Moravec16]. According to his proposal, a point is considered a good visual feature if: (i) it can be detected in multiple views of the same scene, and (ii) it is sufficiently significant and distinguishable from other regions. In particular, Moravec [Reference Moravec16] identifies corners as good visual features and proposes a method to effectively detect them. The key observation behind his approach is that corners have a high variance along the two orthogonal directions. The algorithm tests each pixel within the input image to check whether a corner is present. To this end, the patch centered in a candidate corner is extracted, and the similarity between such a patch and nearby overlapping ones is evaluated. In particular, 25 neighboring patches are considered, sampled horizontally, vertically, and along the two diagonals. Given a candidate corner patch centered in (x, y) and a neighboring patch shifted by (Δ x, Δ y) pixels, both sampled from the image I, their similarity is evaluated by means of the sum of squared differences (SSD) as
 $$\eqalign{&d_{\Delta x, \Delta y} (x,y) \cr &\quad = \sum_{(x_i, y_i) \in {\cal N}(x, y)} [I(x_i, y_i) - I(x_i - \Delta x, y_i - \Delta y)]^2,}$$
where
 ${\cal N}(x_{i}, y_{i})$
represents the neighborhood of the candidate corner point (x, y).
${\cal N}(x_{i}, y_{i})$
represents the neighborhood of the candidate corner point (x, y).
Since a smaller SSD indicates a higher patch similarity and thus lower cornerness, the candidate corner strength, or cornerness measure, is defined as the minimum of the SSDs between the candidate patch and its neighboring ones. Finally, points corresponding to local cornerness maxima are detected as stable features. To this end, non-maxima suppression is performed: a keypoint is detected if its cornerness measure is higher than a given threshold and it is a local maximum within an arbitrarily sized neighborhood.
Despite its effectiveness, one of the main drawbacks of Moravec corner detector is that it is anisotropic, that is, it is not invariant to rotation. In fact, only edges along the four main directions – horizontal, vertical and, along the diagonal – are correctly discerned from corners.
Harris and Stephens propose a joint corner and edge detection algorithm [Reference Harris and Stephens18], overcoming the issues of Moravec's approach. They build upon the same idea, that is, corners are points with high-intensity variance along all directions. Exploiting Taylor expansion, the difference between a candidate corner patch and a neighboring one is:
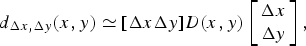 $$d_{\Delta x, \Delta y} (x,y) \simeq [\Delta x \Delta y] D (x,y) \left[\matrix{\Delta x \cr \Delta y} \right],$$
where D(x, y) is the structure tensor matrix, capturing the intensity structure of the candidate patch, based on local gradients. In particular, it is possible to infer information about the candidate patch intensity structure analyzing the two eigenvalues λ1 and λ2 of the structure tensor matrix. The values of such eigenvalues are proportional to the amount of intensity variation along the directions specified by the corresponding eigenvectors. In particular, the higher an eigenvalue, the faster the intensity variation along the corresponding direction. Hence, if both λ1 and λ2 are sufficiently large, a corner is identified, whereas if
 $\lambda_{1} \gg \lambda_{2}$
, an edge is identified. Harris measure is capable of efficiently capturing the cornerness of a candidate point (x, y) as
$\lambda_{1} \gg \lambda_{2}$
, an edge is identified. Harris measure is capable of efficiently capturing the cornerness of a candidate point (x, y) as
 $$R(x, y) = det(D(x, y)) - \alpha \cdot tr(D(x, y))^2.$$
Shi and Tomasi propose a keypoint detector inspired by the Harris corner detector, targeting object tracking scenarios [Reference Shi and Tomasi19]. Shi and Tomasi observe that a stable corner corresponds to two large eigenvalues of the structure tensor matrix and hence use the value of the smallest eigenvalue as a cornerness measure, i.e.
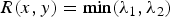 $R(x, y) = \min(\lambda_{1}, \lambda_{2})$
, where λ1 and λ2 are the two eigenvalues of the structure tensor matrix D(x, y) computed at a given point (x, y). Features are then ranked according to an ad hoc statistical measure that indicates the temporal consistency of each keypoint with respect to an affine image motion model.
$R(x, y) = \min(\lambda_{1}, \lambda_{2})$
, where λ1 and λ2 are the two eigenvalues of the structure tensor matrix D(x, y) computed at a given point (x, y). Features are then ranked according to an ad hoc statistical measure that indicates the temporal consistency of each keypoint with respect to an affine image motion model.
Lee et al. propose to use a wavelet transform to identify corners at different scales [Reference Lee, Sun and Chen20]. By representing the signal in the wavelet domain, they are able to detect both arcs and corners at multiple scales.
In 1995, Smith and Brady introduce Smallest Univalue Segment Assimilating Nucleus (SUSAN) [Reference Smith and Brady21], a combined edge and corner detector. The algorithm analyzes a circular region around a candidate edge or corner point. Within such region, the USAN value is computed as the number of pixels belonging to the region and having an intensity value similar to that of the nucleous, i.e. the center of the region. Corners and edges correspond to some characteristic USAN values, as shown in Fig. 2, and can thus be easily detected.
The key idea behind SUSAN. In flat regions (a), almost all the pixels have an intensity similar to that of the nucleous (white cross). In edge regions (c), approximately half of the pixels have an intensity similar to that of the nucleous. In corner regions (b), less than half of the pixels have an intensity similar to that of the nucleous.

Mikolajczyk and Schmid propose an affine-invariant version of the Harris detector [Reference Mikolajczyk and Schmid24]. Their approach is able to detect features at multiple scales and is robust to affine transformations, exploiting an affine Gaussian scale-space.
Features from Accelerated Segment Test (FAST) [Reference Rosten and Drummond26], introduced by Rosten in 2005, is the first instance of corner detectors based on the Accelerated Segment Test (AST). The main idea behind such approach is that every corner is surrounded by a circular arc of pixels whose intensities are all higher or lower than the circle center. Considering a Bresenham circle of radius r consisting of k pixels
 $p_{1}, \ldots, p_{k}$
, FAST compares the intensity of such pixels with the one of the pixel corresponding to the center of the circle. A candidate point is detected as a corner if at least n contiguous pixels, out of the k ones, are all brighter or darker than the center by at least a threshold t.
$p_{1}, \ldots, p_{k}$
, FAST compares the intensity of such pixels with the one of the pixel corresponding to the center of the circle. A candidate point is detected as a corner if at least n contiguous pixels, out of the k ones, are all brighter or darker than the center by at least a threshold t.
The AST can be efficiently implemented resorting to machine learning and decision trees, allowing negative corner responses to be discarded with just few operations, thus yielding a high computational efficiency. AGAST [Reference Mair, Hager, Burschka, Suppa and Hirzinger31] improves the performance of FAST by proposing an optimization framework tailored to the AST decision tree building process. Furthermore, AGAST allows for the definition of more generic, application-dependent AST and for the computation of the corresponding decision trees.
BRISK [Reference Leutenegger, Chli and Siegwart32] further refines the process, introducing a scale-invariance version of the AST-based detector.
2) Blob detectors
Early computer vision researchers identify corners as points of interest within an image and thus a good fit for feature extraction. Blobs represent regions of an image that differ in terms of one or more visual characteristics, such as color or brightness, compared with the surrounding area. Being peculiar regions of images that can be detected under different imaging conditions, blobs emerged as an effective alternative to corners.
Lindeberg observed that filtering an image with a Laplacian of Gaussian (LoG) leads to large positive and negative responses corresponding to dark and bright blobs, respectively [Reference Lindeberg22]. He proposes a scale-invariant blob detector that is capable of extracting arbitrarily sized blobs. To this end, given an input image I(x, y) and considering a given scale σ, a scale-space representation L(x,y,σ) is obtained by convolving the image with a Gaussian kernel:
 $$\eqalign{L(x,y,\sigma) &= I(x,y) \ast g(x,y,\sigma),\cr g(x,y,\sigma) &= {1 \over 2 \pi \sigma^2} e^{- x^2 + y^2/ 2 \sigma^2)}.}$$
Then, the Laplacian operator is applied to such scale-space representation according to
 $$\nabla^2 L(x, y, \sigma) = L_{xx} (x, y, \sigma) + L_{yy} (x, y, \sigma),$$
where L xx (L yy ) denotes the second-order partial derivative along the x (y)-axis.
Finally, blobs correspond to local extrema of the scale normalized LoG response
 $R(x, y, \sigma) = \sigma^{2} \nabla^{2} L(x, y, \sigma)$
, that consists in a three-dimensional (3D) space composed of both spatial coordinates (x, y) and scale σ. Thresholding and non-maxima suppression are usually exploited to identify such extrema.
$R(x, y, \sigma) = \sigma^{2} \nabla^{2} L(x, y, \sigma)$
, that consists in a three-dimensional (3D) space composed of both spatial coordinates (x, y) and scale σ. Thresholding and non-maxima suppression are usually exploited to identify such extrema.
Matas et al. propose Maximally Stable Extremal Regions (MSER), an alternative blob detector that allows for the extraction of affine regions sufficiently uniform in terms of pixel intensity [Reference Matas, Chum, Urban and Pajdla23]. Without loss of generality, consider a gray-scale image
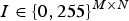 $I \in \{0, 255\}^{M \times N}$
. Furthermore, consider a thresholding I(τ) of the image I, obtained by fixing a proper threshold value τ within the set {0, 255}. In particular, assume that all the pixels whose intensity is lower than τ are set to zero (black), whereas the remaining one are set to 255 (white). If τ=0, all the pixels are white. Increasing the value of τ, some black regions appear, corresponding to local intensity minima. The Extremal Regions are all the spatially connected regions obtained by thresholding the image with all possible values of τ. The MSER are a subset of Extremal Regions that satisfy a stability criterion based on region areas. According to such criterion, regions are enforced to have similar shapes and dimensions across a large set of possible thresholds.
$I \in \{0, 255\}^{M \times N}$
. Furthermore, consider a thresholding I(τ) of the image I, obtained by fixing a proper threshold value τ within the set {0, 255}. In particular, assume that all the pixels whose intensity is lower than τ are set to zero (black), whereas the remaining one are set to 255 (white). If τ=0, all the pixels are white. Increasing the value of τ, some black regions appear, corresponding to local intensity minima. The Extremal Regions are all the spatially connected regions obtained by thresholding the image with all possible values of τ. The MSER are a subset of Extremal Regions that satisfy a stability criterion based on region areas. According to such criterion, regions are enforced to have similar shapes and dimensions across a large set of possible thresholds.
Simlarly, Kim and Grauman propose a Boundary-Preserving Local Region detector (BPLR) [Reference Kim and Grauman84], which robustly identifies different regions in an image in a shape and boundaries preserving manner.
Alongside the Harris affine corner detector, Mikolajczyk and Schmid propose an affine feature detector based on the Hessian matrix [Reference Mikolajczyk and Schmid24]. In particular, consider an affine scale space pyramid
 $L(x,y,\sigma_{1}, \sigma_{2})$
obtained by smoothing the input image with bivariate Gaussian kernels at different scales. For each point of the scale-space, consider the Hessian matrix
$L(x,y,\sigma_{1}, \sigma_{2})$
obtained by smoothing the input image with bivariate Gaussian kernels at different scales. For each point of the scale-space, consider the Hessian matrix
 $$H(x,y, \sigma_1, \sigma_2) = \left[\matrix{L_{xx}(x,y,\sigma_1, \sigma_2) &L_{xy}(x,y,\sigma_1, \sigma_2) \cr L_{xy}(x,y,\sigma_1, \sigma_2) & L_{yy}(x,y,\sigma_1, \sigma_2)} \right],$$
where L
xx
(L
yy
) is the second-order partial derivative along the x (y)-axis and L
xy
the second-order mixed derivative. Features corresponds to scale-space entries
 $L(x,y,\sigma_{1}, \sigma_{2})$
that correspond to extrema of both the determinant and the trace of the Hessian matrix. Differently from the case of Harris detector, picking the extrema of the determinant of the Hessian matrix penalizes elongated regions corresponding to edges.
$L(x,y,\sigma_{1}, \sigma_{2})$
that correspond to extrema of both the determinant and the trace of the Hessian matrix. Differently from the case of Harris detector, picking the extrema of the determinant of the Hessian matrix penalizes elongated regions corresponding to edges.
Lowe proposes to approximate the LoG operator by means of a Difference of Gaussians (DoG) [Reference Lowe25]. To this end, a scale-space is obtained by subsequently filtering the input image with Gaussian kernels with constantly increasing standard deviation. Then, adjacent Gaussian-smoothed images are subtracted to build a DoG scale-space. As in the case of LoG, local extrema of such scale-space, corresponding to stable features, can be detected by means of non-maxima suppression. DoG significantly reduces the computational complexity of the scale-space building process with respect to LoG. Nonetheless, DoG scale-space construction represents the computational bottleneck of the keypoint detection process, leaving space for further optimization.
Bay et al. propose Speeded Up Robust Features (SURF), a fast feature extraction algorithm [Reference Bay, Tuytelaars and Van Gool27]. It comprises both a keypoint detector and a keypoint descriptor. As to the former, it aims to efficiently compute an approximation of the Hessian matrix resorting to a combination of 2d box-like filters, and making use of integral images. Despite being computationally efficient, SURF filters are anisotropic and hence not completely robust against image rotations.
Agrawal et al. propose CenSurE [Reference Agrawal, Konolige, Blas, Forsyth, Torr and Zisserman30], a blob detection algorithm that, approximates the LoG operator by means of center-surround kernels, obtained as combinations of 2d box-like filters.
Alcantarilla and Bartoli propose KAZE [Reference Alcantarilla, Bartoli and Davison33], a scale-invariant feature detector based on the Hessian matrix. Differently from DoG and SURF, KAZE exploits non-linear diffusion filtering to build a scale-space representation of the input image, preserving edges and boundaries and thus yielding improved localization accuracy and distinctiveness.
3) Machine learned detectors
Visual feature detectors presented so far have been developed so that the extracted interest points satisfy given properties or possess particular characteristics. To this end, feature detection operators such as LoG, SUSAN, and FAST have been mostly handcrafted and optimized resorting to trial and error procedures. Nonetheless, with the advent of effective statistical and computational models and powerful computing hardware, machine learning techniques are being exploited to automatically learn effective feature detection operators. Differently from traditional approaches, driven by human-defined intuitions, such approaches aim to automatically learn detection operators resorting to a set of training examples.
In this context, Trujillo and Olague propose a genetic programming framework that is able to automatically synthesize keypoint detection operators [Reference Trujillo and Olague28]. According to such approach, the quality of a feature detector can be evaluated by means of three key properties: (i) separability between detected points, (ii) amount of local information content, and (iii) stability to imaging conditions. To learn detection operators that maximize such properties, a set of low-level operations (e.g. image derivatives and pixel-wise summation) are defined. Then, an instance of detection operator is defined as a combination of an arbitrary number of low-level operations. Finally, evolutionary models are exploited to explore the search space of operators instances, so that the key properties are satisfied.
In 2014, Verdie and Yi introduce TILDE [Reference Verdie, Yi, Fua and Lepetit34], a machine-learned detector that is invariant to drastic changes in imaging conditions (e.g. night/day, partial occlusion or clutter). First, they build a novel training dataset of image patches, corresponding to keypoints that are stably detected under a large set of different imaging conditions. Then, they exploit a linear regression procedure to define an operator that is able to accurately detect such stable features.
The performance of keypoint detection algorithms, in terms of detection stability under different imaging conditions and computational efficiency, have been thoroughly evaluated [Reference Canclini, Cesana, Redondi, Tagliasacchi, Ascenso and Cilla12,Reference Miksik and Mikolajczyk13,Reference Moreels and Perona85]. Efficient detectors based on AST, such as FASTFootnote 2 , AGAST, and BRISK, approach the performance of traditional algorithms such as SURF and DoG in terms of detection repeatability, at a much lower computational complexity.
Finally, a number of 3D keypoint detectors have been proposed [Reference Flint, Dick and Hengel29,Reference Filipe, Itti and Alexandre35]. Such algorithms are capable of identifying salient 3D structures in depth maps or 3D point clouds.
B) Keypoint descriptors
Early attempts at matching stereo images for tracking and image understanding are based solely on keypoint detectors. Moravec [Reference Moravec16], and Harris and Stephens [Reference Harris and Stephens18] algorithms represent the cornerstones of such early computer vision applications. Besides image keypoint positions, local image content (e.g. in terms of intensity, texture, and color) can be effectively exploited to match pairs of images. In this sense, keypoint descriptors aim to assign to each detected keypoint a concise signature, consisting of a set of values that capture local visual characteristics of the surrounding image patch. Zhang et al. [Reference Zhang, Deriche, Faugeras and Luong86] propose to use a simple descriptor, consisting of the intensity values of the pixels surrounding a given keypoint. Such pixel-level windows can be matched resorting to either the SSD or the Normalized Cross Correlation (NCC), in a process similar to video coding's motion estimation. On the one hand, such simple representation is sufficient to match contiguous frames extracted from the same video sequence and whose visual content is highly correlated. On the other hand, it is not sufficiently robust to changes in imaging conditions, and thus it is not suitable to general-purpose image matching.
In this context, more and more powerful keypoint descriptors have been devised. They can be categorized in two broad groups, according to the data type of the features they generate: (i) real-valued descriptors and (ii) binary descriptors. Table 3 offers an overview of the most common keypoint descriptors.
Overview of the most common local feature descriptors.

1) Real-valued descriptors
The first keypoint description algorithms assign to each detected keypoint a compact signature consisting of a set of real-valued elements. In [Reference Schmid and Mohr36], an image retrieval system is proposed, based on Harris corner detector and local grayvalue invariants. They assign to each detected corner a descriptor based on a set of differential invariants, up to the third order. In particular, such approach is invariant with respect to image rotation. Furthermore, scale invariance is achieved by computing descriptors at different scales.
The work in [Reference Belongie, Malik and Puzicha37] propose Shape Context, a feature extraction algorithm that captures the local shape of a patch. Considering a patch surrounding the point (x, y), edge detection is applied to identify edges. Then, a radial grid is applied to the patch, and a histogram centered in (x, y) counts the number of edge points falling in a given spatial bin.
David Lowe introduces Scale Invariant Feature Transform (SIFT) [Reference Lowe25]. SIFT computes for each keypoint a real-valued descriptor, based on the content of the surrounding patch in terms of local intensity gradients. In particular, considering a keypoint identified in a given spatial position (x, y) and at a given scale σ, an image patch centered in (x, y) and having size proportional to σ is extracted. Within such image patch, local gradients are computed and used to estimate the prominent keypoint orientation. Then, local gradients are pooled over a 4×4 grid, oriented according to the prominent keypoint orientation, as depicted in Fig. 3. Finally, local gradient orientations are quantized using eight angular bins, and for each one of the 16 regions composing the 4×4 grid, a weighted histogram of gradients is computed. In particular, each local gradient contributes to the bin corresponding to the nearest orientation, for an amount proportional to its magnitude. The final SIFT descriptor consists of 128 elements.
SIFT descriptor building process. (Left) Local gradients are computed and pooled on a 16×16 grid around the keypoint (shown as 8×8 here for simplicity). (Right) for each cell of the overlying 4×4 grid a 8D weighted histogram of gradients is computed.

Given its remarkable performance, SIFT has been often used as starting point for the creation of other descriptors.
Mikolajczyk and Schmid propose Gradient Location and Orientation Histogram (GLOH) [Reference Mikolajczyk and Schmid38], a descriptor inspired by SIFT. Instead of using a 4×4 spatial grid, they propose to pool the gradients in 17 radial bins. Furthermore, differently from SIFT, gradient orientations are quantized using 16 angular bins. Finally, Principal Component Analysis (PCA) is applied to the 272-dimensional descriptor in order to reduce its dimensionality, leading to a 128-dimensional real-valued descriptor.
Dong and Soatto propose DSP-SIFT [Reference Dong and Soatto90], in which pooling of gradient orientations is performed across different scales. Morel and Yu propose ASIFT [Reference Morel and Yu91], a fully affine invariant version of SIFT computed starting from a set of simulated images obtained from the original one. Another example of an affine-invariant approach is given by the ASR descriptor [Reference Wang, Fan and Wu92], which uses PCA to represent affine-warped patches compactly and efficiently.
Similarly to SIFT and GLOH, the DAISY [Reference Tola, Lepetit and Fua40] descriptor is obtained by spatially pooling local gradients within ad-hoc circular regions arranged on concentric circles of increasing radius. Differently from SIFT and GLOH, DAISY has been designed with the aim of extracting descriptors in predefined locations that are densely sampled on an uniform grid, bypassing the keypoint detection stage. Being densely sampled, multiple descriptors may exploit the same local gradients. DAISY optimizes the computation resorting to gradient channels, so that a local gradient is computed just one time and shared among multiple descriptors.
In the context of pedestrian detection, Dalal and Triggs propose Histogram of Oriented Gradients (HOG) [Reference Dalal, Triggs, Schmid, Soatto and Tomasi39], a descriptor based on spatial pooling of local gradients. Although the approach is similar to SIFT, to address the problem of detecting human-like shapes Histogram of Gradients are computed on a dense grid of locations, skipping keypoint detection. Dalaal and Triggs observe that gradient strengths have large variations due to local illumination properties, and thus propose a contrast normalization technique to enhance the descriptor accuracy.
Besides an efficient keypoint detector, SURF [Reference Bay, Tuytelaars and Van Gool27] includes a fast gradient-based descriptor. In particular, given a keypoint, its main orientation is computed by analyzing local gradient orientations, similarly to the case of SIFT. Local gradient responses along x- and y-axis are efficiently extracted exploiting particular wavelet filters, that can be computed fast resorting to integral images. Then, such responses are pooled on a 4×4 grid, and for each bin of the grid a compact representation is built by applying simple summations.
Fan et al. propose MROGH [Reference Fan, Wu and Hu87], a 192-dimensional local descriptor, which differs from the aforementioned ones in three aspects: (i) achieving rotation invariance without computing a dominant orientation for the keypoint, (ii) pooling intensity gradients in an adaptive strategy based on their intensity orders, and (iii) constructing the descriptors by relying on multiple support regions in order to increase their discriminative power.
Along the same line, Girod and co-workers propose rotation invariant features based on the Radial Gradient Transform [Reference Takacs, Chandrasekhar, Tsai, Chen, Grzeszczuk and Girod89]. According to such methods, the extracted gradients are intrinsically oriented and thus invariant to image rotations, allowing for very efficient computation of local features.
A different approach is taken by Wang et al. with their Local Intensity Order Pattern (LIOP) descriptor [Reference Wang, Fan and Wu93]. LIOP describes an image patch using local ordinal information of the pixels composing the patch, resulting in a 144-dimensional descriptor robust to intensity changes, image rotation, viewpoint change, image blur and compression.
2) Binary descriptors
Despite yielding a good matching accuracy for a large set of tasks, real-valued gradient-based local descriptors such as SIFT or HOG require computationally intensive processes to be extracted, especially when considering low-power devices such as mobiles, smart cameras, or visual network sensing nodes. Binary descriptors, usually based on pairwise intensity comparisons, recently emerged as an efficient yet accurate alternative to real-valued features. Most binary feature extraction algorithms do not require the computation of local image gradients or local derivatives, thus being computationally efficient. Furthermore, binary features can be efficiently matched resorting to fast Hamming distance computation [Reference Calonder, Lepetit, Strecha and Fua88], resulting in significant speedup, especially considering large-scale applications.
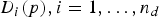
Calonder et al. introduce Binary Robust Independent Elementary Features (BRIEF) [Reference Calonder, Lepetit, Strecha and Fua88], a local binary keypoint description algorithm partially inspired by Random Ferns [Reference Ozuysal, Calonder, Lepetit and Fua94] and Local Binary Patterns [Reference Ojala, Pietikainen and Harwood95]. Exploiting pairwise comparisons between smoothed pixel intensities, it results in very fast computation. Considering a keypoint identified at location (x, y), the surrounding image patch is extracted. Within such patch, n
d
pairs of pixel locations
 $(x^{1}_{i}, y^{1}_{i})$
,
$(x^{1}_{i}, y^{1}_{i})$
,
 $(x^{2}_{i}, y^{2}_{i}), i = 1, \ldots, n_{d}$
are randomly selected. For each couple of pixel locations, a binary value is obtained performing a pairwise intensity comparison, defined as
$(x^{2}_{i}, y^{2}_{i}), i = 1, \ldots, n_{d}$
are randomly selected. For each couple of pixel locations, a binary value is obtained performing a pairwise intensity comparison, defined as
 $$D_i(p) = \left\{\matrix{1 & \hbox{if} p(x^1_i, y^1_i) \gt p(x^2_i, y^2_i) \cr 0 & \hbox{otherwise}}, \right.$$
where p represents a smoothed version of the original input image. Finally, the BRIEF descriptor for the keypoint under consideration is obtained by concatenating the n
d
binary values
 $D_{i}(p), i = 1, \ldots, n_{d}$
obtained by performing the n
d
pairwise intensity comparisons.
$D_{i}(p), i = 1, \ldots, n_{d}$
obtained by performing the n
d
pairwise intensity comparisons.
Leutenegger et al. propose Binary Robust Invariant Scalable Keypoints (BRISK) [Reference Leutenegger, Chli and Siegwart32], a binary intensity-based descriptor inspired by BRIEF. Each binary dexel (descriptor element) of BRISK is obtained, as in the case of BRIEF, by performing a pairwise intensity comparison. Differently from BRIEF, the location of the pairs of pixels are sampled on an ad hoc concentric pattern, as depicted in Fig. 4. Furthermore, differently from BRIEF, BRISK is able to produce scale- and rotation-invariant descriptors. In particular, considering the BRISK sampling pattern of pixel locations, long-range pairwise comparisons are exploited to estimate the prominent orientation of a feature, whereas short-range ones are used to build the actual binary descriptor. Scale invariance is obtained by rescaling the pattern according to the inherent scale σ of the detected keypoint.
(a) BRISK and (b) FREAK patterns of pixel locations (in red) used to perform pairwise intensity comparisons. Blue circles corresponds to Gaussian kernel used to smooth local pixel intensities.

Similarly to the case of BRISK, Fast REtinA Keypoints (FREAK) [Reference Alahi, Ortiz and Vandergheynst43] uses a novel sampling pattern of points inspired by the human visual cortex, whereas Oriented and Rotated BRIEF (ORB) [Reference Rublee, Rabaud, Konolige and Bradski42] adapts the BRIEF descriptor, so that it achieves rotation invariance.
Byrne and Shi propose Nested Shape Descriptors [Reference Byrne and Shi96], constructed by pooling oriented gradients over a large geometric structure, which is constructed with a nested correlation structure. Such descriptors are an example of binary descriptors using gradients instead of intensity comparisons and are shown to obtain performance very similar to SIFT on affine image-matching tasks.
3) Machine-learned descriptors
Similarly to the case of keypoint detectors, most of traditional feature descriptors are the result of human intuitions and thus handcrafted. Nonetheless, the availability of large sets of annotated training data is recently being exploited in order to learn effective yet compact feature descriptors.
Winder et al. [Reference Winder, Hua and Brown97] optimize the DAISY descriptor [Reference Tola, Lepetit and Fua40] exploiting a large dataset of image patches and resorting to machine-learning techniques.
Besides optimizing traditional handcrafted descriptors, machine learning can be used to implement feature extraction algorithms from scratch. Discriminative BRIEF (D-BRIEF) [Reference Trzcinski and Lepetit41] learns discriminative feature representations starting from the pixel-level data. In particular, consider the vector x containing all the pixel intensity values of the image patch p surrounding a given keypoint. Each D-BRIEF descriptor element
 $D_{i} (p), i = 1, \ldots, n_{d}$
is obtained as a thresholded projection of the values of the vector x, that is,
$D_{i} (p), i = 1, \ldots, n_{d}$
is obtained as a thresholded projection of the values of the vector x, that is,
 $$D_i(p) = \hbox{sgn}({\bf w}_i^T {\bf x} + \tau_i), i = 1, \ldots, n_d,$$
where w
i
is a vector containing the weights of the ith projection (or linear combination) of the input patch p and τ
i
is an arbitrary binarization threshold. The projection vectors
 ${\bf w}_{i}, i = 1, \ldots, n_{d}$
and the thresholds
${\bf w}_{i}, i = 1, \ldots, n_{d}$
and the thresholds
 $\tau_{i}, i = 1, \ldots, n_{d}$
are obtained by minimizing the classification error on the training dataset of patches, exploiting gradient descent. To obtain a fast extraction algorithm, each projection is approximated by means of a combination of few simple kernels (e.g. Gaussians and box-filters).
$\tau_{i}, i = 1, \ldots, n_{d}$
are obtained by minimizing the classification error on the training dataset of patches, exploiting gradient descent. To obtain a fast extraction algorithm, each projection is approximated by means of a combination of few simple kernels (e.g. Gaussians and box-filters).
Binary descriptors from AsymMetric BOOsting (BAMBOO) [Reference Baroffio, Cesana, Redondi and Tagliasacchi44] exploits a greedy boosting procedure inspired by Adaboost to learn a pattern of pairwise smoothed intensity comparisons, used to build a binary descriptor with a procedure similar to that of BRIEF. In particular, each pairwise comparison of smoothed pixel intensities can be expressed as a thresholding of a projection of the image patch, composed by two (or more) box filters, as shown in Fig. 5. Besides learning novel patterns, BAMBOO can be exploited to train traditional binary descriptors, such as BRISK and FREAK, on task-dependent patch datasets, significantly improving their accuracy by selecting their most discriminative descriptor elements.
The best 16 pairwise smoothed intensity comparisons learned by BAMBOO, exploiting a dictionary of box- and Haar-like filters.

BINary BOOSTed descriptor (BINBOOST) [Reference Trzcinski, Christoudias, Lepetit and Fua45] is a gradient-based binary descriptor obtained exploiting a boosting procedure. Considering the image patch surrounding a given keypoint, local intensity gradients are first computed similarly to the case of traditional real-valued descriptors such as SIFT or SURF. Then, SIFT would pool the resulting gradients on a handcrafted 4×4 grid. Instead, BINBOOST exploits a boosting procedure to learn discriminative gradient pooling functions. On the one hand, BINBOOST yields a high level of matching precision and a high grade of specialization, achieved by performing training on task-specific datasets. On the other hand, BINBOOST requires the computation of local gradients and complex pooling functions, resulting in a computational complexity comparable with that of SIFT.
Finally, Binary Online Learned Descriptor (BOLD) [Reference Balntas, Tang and Mikolajczyk98] combines the advantages of classical binary descriptors with the improved performance of learning-based descriptors. In particular, BOLD adapts the binary tests to the content of each patch and demonstrates performance that matches that of SIFT with a computational complexity similar to BRIEF.
Besides traditional machine learning approaches, the availability of fast parallel computation architectures such as GPU and cluster computing facilities have favored the deep learning revolution, and a whole new line of research is addressing the problem of extracting and matching local features resorting to deep learning techniques. For what concerns, feature extraction, deep learning have been successfully exploited to improve the quality of the descriptors and their invariance with respect to changes in imaging conditions [Reference Osendorfer, Bayer, Urban and van der Smagt99–Reference Simo-Serra, Trulls, Ferraz, Kokkinos, Fua and Moreno-Noguer101]. Deep-learning methods have been also applied to the context of 3D and multi-view features, again demonstrating dramatic improvements int the quality of local representations and allowing for the recognition and matching of complex 3D shapes [Reference Boscaini, Masci, Melzi, Bronstein, Castellani and Vandergheynst102,Reference Karpushin, Valenzise and Dufaux103]. Deep learning is also used for matching features. As an example, Fischer et al. proposed a feature matching strategy based on deep neural networks, achieving better results than the ones obtained by the traditional feature matching pipelines [Reference Fischer, Dosovitskiy and Brox104]. Finally, deep learning can be used to perform feature extraction and matching simultaneously: Han et al. propose MatchNet [Reference Han, Leung, Jia, Sukthankar and Berg105], a unified approach consisting of a deep convolutional network that extracts features from patches and a network of three fully connected layers that computes a similarity between the extracted features. Such a unified approach is shown to improve the accuracy over the previous state-of-the-art results on patch matching datasets. Nonetheless, the use of deep learning in the context of computing and matching local features is still vastly unexplored and it is still a hot topic. Being able to spot complex relationship between visual data, deep neural networks, coupled with very large dataset of image patches could lead to dramatic improvements in terms of feature invariance and robustness.
4) Performance evaluation
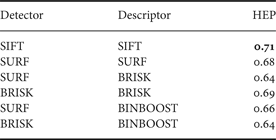
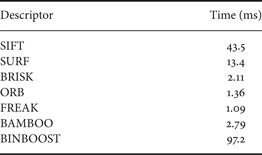
Many works have tried to compare the performance of different feature extraction algorithms. For instance, the works in [Reference Canclini, Cesana, Redondi, Tagliasacchi, Ascenso and Cilla12,Reference Miksik and Mikolajczyk13,Reference Mikolajczyk and Schmid24,Reference Mikolajczyk and Schmid38,Reference Moreels and Perona85] all describe comparative studies on the performance of both detectors and descriptors, each work incrementing the set of tested algorithms with the most recent advances in the field. A common denominator of such works is that they do not identify a single winning technology, as this would require extensive testing over all possible visual content analysis tasks. Therefore, such works generally compare different detector/descriptor combinations over a series of standard tests on publicly available datasets. For what concerns detectors, the processing time and the reliability (i.e., the ability to detect the same keypoint under different viewing conditions) are generally used as performance metrics. As for descriptors, the processing time and the percentage of correct true positive matches are generally adopted. Ad hoc performance measures may be used if a particular visual task is under test: as an example, in the case of image retrieval or object recognition, the Mean of Average Precision (MAP) is generally used. Conversely, in the case of object tracking, structure-from-motion or camera calibration, the precision in estimating the homography between two images is adopted [Reference Baroffio, Cesana, Redondi, Tagliasacchi and Tubaro10]. Tables 4 and 5 report the MAP value and the homography estimation precision obtained running different couples of feature detector/descriptor over several publicly available image datasets for image retrieval and object tracking, while Table 6 reports the processing time needed for feature extraction in different configurations. The inspection of such results confirms that SIFT features generally obtain very good results, and that is why they are widely accepted as the gold standard solution for feature extraction in several analysis tasks. At the same time, the computational time needed for their extraction is extremely high. This constitutes a limit in those cases where visual content analysis must be performed in real-time or using low-power hardware. Conversely, low-complexity binary features such as BRISK or BAMBOO sometimes perform at par or even outperform their real-valued counterpart such as SIFT or SURF, at just a fraction of the required computational time. This result is very promising as it forms the basis for visual content analysis on low-cost and low-power architectures such as embedded systems, mobile platforms, and VSN.
MAP on Oxford, Turin, and Zurich Building dataset.

Homography estimation precision on the Visual Tracking Dataset [Reference Gauglitz, Höllerer and Turk106].
Average amount of time required to compute 500 local descriptors.
III. VISUAL FEATURE COMPRESSION
In recent years, visual features have been successfully exploited in a number of high-level applications. Distributed analysis tasks such as augmented reality, content-based search, assisted navigation, require visual data, either in the form of pixel-level information (CTA) or visual features (ATC), to be transmitted over a network. Furthermore, most of such applications require visual content to be matched against large-scale databases.
Nonetheless, the whole visual content analysis process should be performed in an efficient fashion, since small delay, typically of the order of tens or hundreds of milliseconds, and high frame rates are required. To this end, feature compactness is key since it allows a very large amount of visual information to be efficiently stored and queried. Moreover, concise feature-based representations can be efficiently transmitted in bandwidth-constrained scenarios such as VSN or congested mobile networks [Reference Baroffio, Cesana, Redondi and Tagliasacchi2].
In this context, ad hoc coding methods tailored to visual features are key to the success of distributed visual analysis architectures. Again, such coding methods can be classified into two broad categories: local feature compression and global feature encoding. According to the former, thoroughly covered in Section III-A, local features extracted from an image are compressed resorting to either lossy or lossless coding. Usually, the location information of each feature is as well compressed and transmitted, allowing for the use of geometric verification methods to refine feature matches (see Section III-B).
A different approach is taken by global features, presented in Section III-C, that create a global representation of an entire frame by pooling and encoding a set of local features. Such global representations are essential when considering very large-scale applications, where matching efficiency is crucial. By discarding keypoint location information, such methods do not enable geometric verification. Nonetheless, some global feature encoding approaches are able to capture spatial information to some extent, by pooling and aggregating features using ad hoc spatial patterns. Table 7 offers an overview of the most common feature coding algorithms.
Overview of visual feature coding methods.

A) Local feature compression
The implementation of distributed visual analysis architectures calls for effective methods to reduce the dimensionality of local features. Gradient-based descriptors such as SIFT and HoG represent the state of the art for a number of applications, and since their introduction a growing body of research has been investigating effective compression techniques tailored to such signals.
1) Real-valued descriptors
Yan Ke and Sukthankar propose PCA-SIFT [Reference Ke and Sukthankar46]. Similarly to the case of SIFT, gradients are computed within the image patch surrounding each identified keypoint. Differently from SIFT, such gradients are not pooled and aggregated on a spatial grid. Instead, PCA is exploited to project the data into a lower-dimensional space. Such a projection can be learned offline, resorting to a large training set of patches along with the corresponding local gradients, and then efficiently applied to input samples. Efficiently projecting the gradient maps, PCA-SIFT generates very compact yet discriminative local features.
Shakhnarovich proposes SSC [Reference Shakhnarovich47], a machine-learning approach that learns how to embed a real space into a binary space, preserving distances between elements. Shakhnarovich tests such an algorithm on SIFT descriptors, to quantize their element into binary values, significantly reducing the number of bits needed to store local features.
Yeo et al. propose a novel local feature compression method, based on LSH [Reference Yeo, Ahammad and Ramchandran48]. Consider a random projection to be applied to a descriptor vector. In particular, such a projection splits the descriptor space in two regions by means of a hyperplane. The key intuition behind the approach is that, if two descriptors are close, then they lie on the same side of the hyperplane for a large set of projections. Hence, for each projection, a one-bit hash can be computed based on the side of the hyperplane a projected descriptor falls in. Finally, a binary hash is obtained by concatenating the results of a number of random projections, and descriptors can be matched resorting to Hamming distance. The process has been further refined by Kulis and Grauman [Reference Kulis and Grauman107].
Weiss et al. propose Spectral Hashing [Reference Weiss, Torralba and Fergus49,Reference Weiss, Fergus and Torralba108]. Instead of using random projections as in the case of LSH, such approach applies PCA on the input data to identify the k-principal components, and then creates a hashing function based on such components.
Wang et al. propose a set of SSH techniques [Reference Wang, Kumar and Chang50] that can be effectively applied to local features in the context of large-scale search. Such approaches exploit a partially annotated training dataset to learn a set of projections that lead to highly discriminative hashes of the input signal. In particular, Sequential Projection Learning offers the best performance iteratively optimizing the output hash. According to such a method, the projection learned at each step is able to improve the hash accuracy, making up for errors due to previously learned projections.
Strecha et al. introduce LDAHash [Reference Strecha, Bronstein, Bronstein and Fua56], a hashing technique tailored to real-valued local features. Such a technique exploits a large training dataset of descriptors. The descriptors are annotated, so as to recognize the ones corresponding to the same physical point. Then, a set of projections and binarization thresholds are learned, in order to map the real-valued descriptor space into a low-dimensional binary space. Regarding the projections, they are learned resorting to Linear Discriminant Analysis, so that the covariance between projected descriptors referring to the same physical entity is minimized, and at the same time the covariance between descriptors of different classes is maximized.
Chandrasekhar et al. propose Compressed Histogram of Gradients (CHoG) [Reference Chandrasekhar, Takacs, Chen, Tsai, Grzeszczuk and Girod51], a very compact gradient-based local feature. Similarly to SIFT and GLOH, it computes and pools gradients within the image patch surrounding each detected keypoint, so as to generate a descriptor composed of a number of histograms of gradients. CHoG models such descriptors as tree structures, and exploits tree coding algorithms to reduce the number of bits needed to encode each feature. Furthermore, a method to match descriptors in the compressed domain is proposed, so that descriptors need not to be decoded before being matched, yielding significant improvements in terms of both memory consumption and computational efficiency.
Moreover, Chandrasekhar et al. propose a compression architecture tailored to real-valued features, based on the Karhunen-Loève Transform (KLT) [Reference Chandrasekhar14,Reference Chandrasekhar, Takacs, Chen, Tsai, Singh and Girod52]. In particular, KLT is applied in order to decorrelate the input descriptor elements, the resulting transformed values are quantized and finally symbols are entropy coded.
Redondi and Cesana propose a coding architecture that exploits the correlation between features extracted from the same frame [Reference Redondi, Cesana and Tagliasacchi53]. In particular, the optimal descriptor coding order is computed so as to minimize the expected bitrate needed to encode the features in a predictive fashion. Similarly to [Reference Chandrasekhar, Takacs, Chen, Tsai, Singh and Girod52], KLT is used to decorrelate descriptor elements.
Jegou et al. propose a local feature compression algorithm based on product quantization [Reference Jegou, Douze and Schmid55]. According to such approach, a P-dimensional input descriptor d
i
is split into m subvectors, each consisting of P/m elements. Then, the m subvectors are quantized separately, yielding the m-quantized symbols
 $q_{i,1}, \ldots, q_{i, m}$
. The global quantization value Q
i
for the input descriptor d
i
is obtained as
$q_{i,1}, \ldots, q_{i, m}$
. The global quantization value Q
i
for the input descriptor d
i
is obtained as
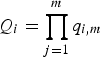 $Q_{i} = \prod_{j=1}^{m} q_{i,m}$
.
$Q_{i} = \prod_{j=1}^{m} q_{i,m}$
.
Chen et al. resorts to a multi-stage quantization process to improve coding efficiency [Reference Chen, Duan, Ji and Wang54]. First, they apply coarse vector quantization to a P-dimensional input descriptor. Being a lossy process, a P-dimensional residual error is generated. Then, product quantization is applied on such residual, yielding improved distinctiveness.
Even though many studies evaluate the performance of local feature compression algorithms [Reference Miksik and Mikolajczyk13,Reference Chandrasekhar, Takacs, Chen, Tsai, Makar and Girod109], it is difficult to identify the best approach for all tasks and scenarios. A common denominator of all the experiments is that the accuracy of compressed real-valued features tends to saturate at about 140–170 bits/feature. That is, 140–170 bits are capable of capturing the characteristics of the image patch surrounding a keypoint, whereas richer representations do not yield significant accuracy gains.
2) Binary descriptors
Most feature compression and hashing techniques are tailored to the class of real-valued features such as SIFT or HoG. Nonetheless, the advent of fast yet accurate binary feature extraction algorithms such as BRISK calls for effective coding methods tailored to such binary signals. In particular, the peculiar binary nature of such class of features should be taken into account when designing ad hoc coding algorithms. [Reference Redondi, Baroffio, Ascenso, Cesana and Tagliasacchi110] propose a lossless binary feature coding technique. The main idea behind such approach is that binary descriptor elements, usually being the result of pairwise intensity comparisons, are correlated. Thus, a greedy technique is developed so as to find the permutation of descriptor elements that minimizes the conditional entropy of the signal, so that coding efficiency is maximized.
Ascenso et al. propose a predictive coding architecture tailored to binary features [Reference Ascenso and Pereira58,Reference Monteiro and Ascenso111]. Similarly to what has been done in [Reference Redondi, Cesana and Tagliasacchi53], the correlation between features extracted from the same frame is exploited in order to improve coding efficiency. In particular, extracted binary descriptors are permuted so as to minimize the expected bitrate, resorting to a greedy procedure. Then, entropy coding is exploited to encode the prediction residual between couples of features that are contiguous within such permutation.
Furthermore, Ascenso et al. introduce a clustering-based coding technique tailored to binary local descriptors [Reference Monteiro and Ascenso59]. In particular, given a set of binary descriptors extracted from a frame, similar features are grouped in the same cluster. Then, within each cluster, correlation between features is exploited to efficiently encode the descriptors in a predictive fashion.
In summary, considering local binary descriptors, lossless compression yields a bitrate reduction of up to 30%.
B) Coding of keypoint locations
Keypoint location information is essential for a number of visual content analysis tasks such as object localization and tracking and structure from motion. Furthermore, content-based retrieval architectures based on local features often exploit a geometric consistency check to refine the matches between query and database images, and thus need to know the position of local features and their relationship. In this context, a body of research addresses the problem of efficiently encoding the location of keypoints detected in a frame. A naive approach is based on scalar quantization of keypoint coordinates, followed by entropy coding of the quantized symbols [Reference Baroffio, Cesana, Redondi, Tagliasacchi and Tubaro10]. Tsai et al. [Reference Tsai, Chen, Takacs, Chandrasekhar, Singh and Girod72] observe that feature are usually clustered around highly textured regions, and thus the probability of finding one or more keypoints in a given area depends on the presence of other keypoints nearby such area. To this end, a spatial grid is applied to the input frame, and a histogram counting the number of keypoints lying in each spatial bin is constructed. Then, a context-based arithmetic coder is used to efficiently encode the number of keypoints in each bin, exploiting the spatial context, that is, the number of keypoints lying in neighboring bins. Recently, the rate-accuracy performance of such histogram-based location coder has been enhanced resorting to complex coding contexts [Reference Tsai71].
C) Global feature encoding
Besides local feature compression methods, global features are proposed as a way of compactly representing visual content. The key idea behind these approaches is to create a global, compact signature for an entire image, based on the set of local features extracted from it. Global representations are much more concise than local ones, requiring a lower amount of memory to be stored and less bandwidth to be transmitted.
The simplest global feature encoding method is based on a well-known information retrieval model, i.e. “Bag-of-Words” (BoW). In the context of text-based retrieval, the key assumption of such a model is that, given a large dictionary of words, each document can be represented as a “BoW”, that is, a histogram counting the number of occurrences of each word within the document. Hence, each document is represented by a single histogram, that is, a vector of real-valued entries. Given a query document, it is possible to find the most relevant retrieval results by simply computing the distances between such histograms. Furthermore, since the size of the dictionary is much greater than the size of a document, histograms are sparse, and the matching efficiency can be improved making use of ad hoc tools such as inverted indices. Similarly, images can be represented by means of a BoW model. Although the meaning of “words” in the context of text-retrieval is straightforward, it should be clearly defined in the case of content-based image retrieval. In such a case, each word (or visual word) can be thought of as an image patch, having distinctive visual characteristics. Local features are an effective way of describing the characteristics of an image patch, and are thus a good fit for the problem at hand. In this respect, in the context of computer vision such a model is often referred to as as “Bag-of-Features” or “Bag-of-Visual-Words”. Considering P-dimensional real-valued or binary descriptors, a dictionary with K visual words can be represented by means of K P-dimensional descriptors, each representing a different visual word.
1) Global encoding of real-valued features
Sivic and Zisserman propose Video Google, an image-matching approach based on “BoW” [Reference Sivic and Zisserman5]. To construct a dictionary of visual words, a large number of real-valued P-dimensional descriptors
 ${\bf d}_{i} \in {\open R}^{P}$
are computed starting from a training set of images. Then, the descriptors are vector quantized into K clusters, whose centroids
${\bf d}_{i} \in {\open R}^{P}$
are computed starting from a training set of images. Then, the descriptors are vector quantized into K clusters, whose centroids
 ${\bf v}_{k}, k=1, \ldots, K$
, represent the actual visual words composing the dictionary V. Dealing with real-valued features, k-means is exploited to cluster the training set of descriptors into a number of visual words. Once the dictionary has been defined, a “BoW” representation can be computed for each input image. In particular, given an image, local features are extracted. Then, each feature is associated with the most similar visual word composing the dictionary, i.e. the dictionary centroid with minimal Euclidean distance with respect to the input feature, as shown in Fig. 6(a). Finally, the image is represented by means of a histogram that counts the occurrences of all dictionary words. A database is built by assigning a BoW representation to each image, so that it can be efficiently queried. To improve matching accuracy, histogram vectors are normalized according to a tf–idf scheme, which is common in the text-based retrieval [Reference Yang, Jiang, Hauptmann and Ngo112]. Finally, given a query image, a global BoW representation is built and it is matched against database entries, resorting to, e.g. cosine similarity. Relevant results correspond to database entries whose cosine similarity with respect to the query is higher than an arbitrary threshold.
${\bf v}_{k}, k=1, \ldots, K$
, represent the actual visual words composing the dictionary V. Dealing with real-valued features, k-means is exploited to cluster the training set of descriptors into a number of visual words. Once the dictionary has been defined, a “BoW” representation can be computed for each input image. In particular, given an image, local features are extracted. Then, each feature is associated with the most similar visual word composing the dictionary, i.e. the dictionary centroid with minimal Euclidean distance with respect to the input feature, as shown in Fig. 6(a). Finally, the image is represented by means of a histogram that counts the occurrences of all dictionary words. A database is built by assigning a BoW representation to each image, so that it can be efficiently queried. To improve matching accuracy, histogram vectors are normalized according to a tf–idf scheme, which is common in the text-based retrieval [Reference Yang, Jiang, Hauptmann and Ngo112]. Finally, given a query image, a global BoW representation is built and it is matched against database entries, resorting to, e.g. cosine similarity. Relevant results correspond to database entries whose cosine similarity with respect to the query is higher than an arbitrary threshold.
(a) “Bag-of-Features” assigns the input feature (green triangle) to its nearest visual word (b) Sparse Coding approximates the input feature as a combination of few words (c) Locality-constrained Linear Coding constraints the visual words composing the sparse combination to be near to the input feature in the descriptor space.

Considering systems based on the “BoW” model, the size of the visual vocabulary influences the matching accuracy. In the case of large-scale retrieval, up to hundreds of thousands or even millions of visual words are needed to obtain performance saturation. In this regard, Nister and Stewenius [Reference Nister and Stewenius61] refine the model proposed by Sivic et al. by introducing a vocabulary tree. In particular, the vocabulary is built as a hierarchical structure, where each level refines the partitioning of the descriptor space. Using such an architecture and ad hoc matching algorithms, large dictionaries can be seamlessly exploited, achieving high task accuracy, without significantly affecting matching performance.
“BoW” represents a simple model that enables fast yet accurate large-scale image matching. Nonetheless, by building a unique, global representation for a frame, it completely disregards the position of local features and their relationship. Such information, if included in the image representation, can significantly improve the discriminative and matching capabilities of a global feature. In this sense, Lazebnik et al. propose Spatial Pyramid Kernel [Reference Lazebnik, Schmid and Ponce60], a global feature encoding aimed to address such issue. Considering an input image, features are extracted resorting to state-of-the-art algorithms such as SIFT. Then the image is partitioned into increasingly fine non-overlapping spatial sub-regions, and a “BoW” representation is computed separately for each sub-region. Finally, a hierarchical global feature representation is obtained by concatenating the histograms corresponding to all the sub-regions. Besides such pyramidal feature encoding, ad hoc efficient distance metrics for the representations at hand are introduced, aimed to enable the matching of Spatial Pyramid Kernels.
Gemert et al. identify a few issues of the “BoW” model, and propose KC [Reference Gemert, Geusebroek, Veenman and Smeulders62]. In particular, according to traditional “BoW” approach, features are hard-assigned to the first nearest centroid in the descriptor space. Gemert et al. point out two main weaknesses related to such approach: (i) assignment plausibility and (ii) assignment uncertainty. As regards the former, it is strictly related to the curse of dimensionality [Reference Bellman and Bellman113]. Since visual vocabularies are usually learned by clustering a high-dimensional space (e.g., P=128 for SIFT), such space may not be densely covered by learned centroids. In this context, at encoding time, the nearest centroid of an input local feature may be really distant in the descriptor space, and the hard-assignment of such feature to the corresponding centroid may not be plausible. Furthermore, an input local feature may be almost equally distant to two or more visual words, and thus hard-assignment would pertain a high uncertainty, which significantly hurts the performance of the “BoW” approach. To tackle such an issue, Gemert et al. propose to soft-assign local features to multiple nearest visual words by using smoothing kernels, significantly improving the discriminative power of global representations. Philbin et al. propose a similar global feature encoding method based on Soft Coding [Reference Philbin, Chum, Isard, Sivic and Zisserman114], achieving comparable accuracy performance.
Jianchao Yang et al. [Reference Yang, Yu, Gong and Huang63] propose a soft-assignment approach based on Sparse coding. In order to learn a visual vocabulary, “BoW” applies k-means clustering to solve the following problem:
 $$\eqalign{\min_{{\bf q}_i, {\bf V}} &\quad \sum_{i=1}^N \Vert {\bf d}_i - {\bf q}_i{\bf V}\Vert^2 \cr \hbox{s.t.}& \quad \Vert {\bf q}_i \Vert_0 = 1, \Vert {\bf q}_i\Vert_1 = 1,}$$
where V represents the visual vocabulary, that is, a matrix with K rows
 ${\bf v}_{k}, k = 1, \ldots, K$
, corresponding to the K dictionary words, and q
i
a vector that assigns feature d
i
to the nearest word in the matrix V. Constraints force q
i
to be a vector of zeros, containing a single one, so as to hard-assign training feature d
i
to its first nearest neighbor when applying k-means clustering. Yang et al. propose to substitute k-means clustering with a Sparse coding approach, that aims to solve the following problem:
${\bf v}_{k}, k = 1, \ldots, K$
, corresponding to the K dictionary words, and q
i
a vector that assigns feature d
i
to the nearest word in the matrix V. Constraints force q
i
to be a vector of zeros, containing a single one, so as to hard-assign training feature d
i
to its first nearest neighbor when applying k-means clustering. Yang et al. propose to substitute k-means clustering with a Sparse coding approach, that aims to solve the following problem:
 $$\eqalign{\min_{{\bf q}_i, {\bf V}} & \quad \sum_{i=1}^N \Vert {\bf d}_i - {\bf q}_i{\bf V}\Vert^2 + \lambda \Vert {\bf q}_i \Vert_1 \cr \hbox{s.t.} & \quad \Vert {\bf v}_k \Vert_2 \le 1, \quad \forall k = 1, \ldots, K.}$$
The hard-assignment constraint in equation (9) is substituted with a penalization term that favors sparsity. That is, each training local features contributes to a small number of centroids (see Fig. 6(b)) and, in particular, λ controls the assignment sparsity. Sparse Coding is applied during both training and encoding, to learn the set of visual words composing the dictionary and to create global representations via soft histograms of words, respectively.
Wang et al. further improve the performance of global representations based on Sparse Coding, introducing LLC [Reference Wang, Yang, Yu, Lv, Huang and Gong64]. They observe that Sparse Coding approximates an input feature as a combination of few visual words. The selected visual words may be very distant to the input local feature in the descriptor space, possibly reducing the discriminative power of the global encoding. Instead, besides seeking a sparse combination of visual words that minimizes the distance with respect to the input features, LLC requires that the selected visual words are local to the input feature, that is, they are near to the input feature in the descriptor space, as shown in Fig. 6(c). Such constraint can be efficiently included in the optimization problem, yielding discriminative global representations that can be computed fast.
Jegou et al. present HE [Reference Jegou, Douze and Schmid65], an alternative approach to construct global representations starting from local descriptors, aimed to tackle the curse of dimensionality. Instead of exploiting soft assignment and high-dimensional dictionaries, HE defines a small number of coarse centroids and builds discriminative representations based on assignment residual. In particular, each input feature is hard-assigned to the closest centroid, but its location within the Voronoi cell defined by the centroid is refined with a short binary signature. In particular, each bit of the binary signature is obtained by analyzing the position of the feature with respect to a hyperplane that subdivides the Voronoi cell.
Jegou et al. also introduce Vector of Locally Aggregated Descriptors (VLAD) [Reference Jegou, Douze, Schmid and Perez66]. VLAD builds more complex yet representative global encodings by pooling the residual error due to the assignment of features to visual centroids. In particular, consider a P-dimensional descriptor
 ${\bf d}_{i} \in {\open R}^{P}$
extracted from an image, and a visual vocabulary V, consisting of K P-dimensional visual words, i.e.
${\bf d}_{i} \in {\open R}^{P}$
extracted from an image, and a visual vocabulary V, consisting of K P-dimensional visual words, i.e.
 ${\bf V} = \{{\bf v}_{k}\}, k = 1, \ldots, K$
. Assigning each descriptor to nearest centroid results in a P dimensional assignment residual, that is,
${\bf V} = \{{\bf v}_{k}\}, k = 1, \ldots, K$
. Assigning each descriptor to nearest centroid results in a P dimensional assignment residual, that is,
 ${\bf r}_{i} = {\bf d}_{i} - {\bf v}_{{\rm NN}_{i}}$
, where
${\bf r}_{i} = {\bf d}_{i} - {\bf v}_{{\rm NN}_{i}}$
, where
 ${\bf v}_{{\rm NN}_{i}} \in {\bf V}$
represents the nearest dictionary centroid with respect to the input feature d
i
. VLAD builds a global image representation by assigning each input descriptor to its nearest visual words, and by pooling the resulting assignment residuals. In particular, for each visual word
${\bf v}_{{\rm NN}_{i}} \in {\bf V}$
represents the nearest dictionary centroid with respect to the input feature d
i
. VLAD builds a global image representation by assigning each input descriptor to its nearest visual words, and by pooling the resulting assignment residuals. In particular, for each visual word
 ${\bf v}_{k}, k = 1, \ldots, K$
, a P-dimensional vector is obtained by summing the residuals r
i
relative to descriptors associated to such word. That is,
${\bf v}_{k}, k = 1, \ldots, K$
, a P-dimensional vector is obtained by summing the residuals r
i
relative to descriptors associated to such word. That is,
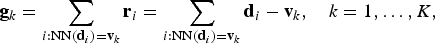 $${\bf g}_k = \sum_{i : {\rm NN} ({\bf d}_i) = {\bf v}_k} {\bf r}_i = \sum_{i : {\rm NN} ({\bf d}_i) = {\bf v}_k} {\bf d}_i - {\bf v}_{k}, \quad k = 1, \ldots, K,$$
where
 ${\bf g}_{k}, k = 1, \ldots, K$
is the set of K P-dimensional vectors composing the VLAD representation, and NN(d
i
) indicates the nearest neighbor of d
i
within the visual vocabulary V. The final VLAD representation is a K×P vector obtained by concatenating the vectors g
k
. Differently from “BoW”, that requires up to millions of visual words, VLAD yields discriminative global representations using as few as tens or hundreds of centroids. Finally, dimensionality reduction techniques such as PCA or Hashing can be used to reduce the dimensionality of the VLAD feature vector.
${\bf g}_{k}, k = 1, \ldots, K$
is the set of K P-dimensional vectors composing the VLAD representation, and NN(d
i
) indicates the nearest neighbor of d
i
within the visual vocabulary V. The final VLAD representation is a K×P vector obtained by concatenating the vectors g
k
. Differently from “BoW”, that requires up to millions of visual words, VLAD yields discriminative global representations using as few as tens or hundreds of centroids. Finally, dimensionality reduction techniques such as PCA or Hashing can be used to reduce the dimensionality of the VLAD feature vector.
Perronin et al. propose to use Fisher Kernels [Reference Perronnin and Dance115] to build an effective global representation, starting from a set of local features. Fisher Kernels are able to combine the power of generative models, e.g. Gaussian Mixture Models (GMM), and discriminative classifiers, e.g. SVM. In particular, a visual vocabulary is built by fitting a GMM to a large set of training descriptors. The GMM associates each feature vector d i to the mode (or centroid) v k with a strength q ik , based on the posterior probability of d i having been generated from such Gaussian mode. The values of q ik may be viewed as soft assignment weights. VLAD simply computes the deviation vector of feature d i with respect to the nearest centroid, and pools all the deviations relative to the same centroid. Similarly, Fisher Kernel computes the mean deviation vector of features with respect to each centroid, weighting each contribution with q ik . Besides first order statistics, that is, mean deviation, the covariance deviation vector with respect to each GMM centroid is computed. The final representation is obtained by concatenating both first- and second-order deviation vectors relative to all centroids. Perronin significantly improve the performance of Fisher Kernel encoding by introducing effective normalization techniques [Reference Perronnin, Sánchez and Mensink67], achieving state-of-the-art performance in terms of global encoding accuracy for image classification [Reference Chatfield, Lempitsky, Vedaldi and Zisserman15], as shown in Table 8.
Image classification accuracy achieved by global feature encoding algorithms as reported in [Reference Chatfield, Lempitsky, Vedaldi and Zisserman15].

Zhou et al. introduce Super vector coding (SV) [Reference Zhou, Yu, Zhang and Huang68]. Similarly to the case of Fisher Kernel, SV soft assigns each feature vector d
i
to codebook centroid v
k
by means of weight q
ik
. Then, a global representation is built based on two terms: (i) pooled first-order deviations and (ii) mass of feature clusters. As regards the former, identically to the case of Fisher Kernel, it is obtained by pooling the mean deviation of features with respect to centroids. As to the latter, for each centroid
 ${\bf v}_{k}, k = 1,\ldots,K$
, the associated cluster mass s
k
can be computed as
${\bf v}_{k}, k = 1,\ldots,K$
, the associated cluster mass s
k
can be computed as
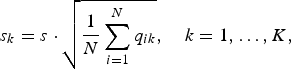 $$s_k = s \cdot \sqrt{{1 \over N} \sum_{i = 1}^N q_{ik}}, \quad k = 1,\ldots, K,$$
where s is a constant and N is the total number of input local features. In practical terms, the mass of cluster s
k
indicates how much the input features
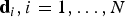 ${\bf d}_{i}, i = 1, \ldots, N$
contribute, in terms of weights q
ik
, to centroid v
k
.
${\bf d}_{i}, i = 1, \ldots, N$
contribute, in terms of weights q
ik
, to centroid v
k
.
Finally, a number of methods have been proposed in order to directly construct global image representations [Reference Lefebvre, Czyz and Macq116,Reference Oliva and Torralba117], without resorting to local features as an intermediate step, but are out of the scope of this survey.
In the context of image classification, the performance of global feature encoding approaches has been thoroughly evaluated and compared [Reference Chatfield, Lempitsky, Vedaldi and Zisserman15]. Table 2 shows the classification accuracy, in terms of Mean Average Precision, for a subset of encoding methods, as reported in [Reference Chatfield, Lempitsky, Vedaldi and Zisserman15]Footnote 3 . Global feature encoding has been recently outperformed by more complex methods based on deep neural networks [Reference Chatfield, Simonyan, Vedaldi and Zisserman118].
2) Global encoding of binary features
Traditional approaches aim to find a low-dimensional global representation for a set of real-valued features. With the advent of computationally efficient yet discriminative binary descriptors, a growing body of research is addressing the problem of constructing effective global encodings tailored to such category of local features. In particular, considering traditional real-valued features such as SIFT, the process of building a visual codebook is usually based on a clustering of the real-valued descriptor space
 ${\open R}^{P}$
. Instead, in the case of binary descriptors, alternative techniques should be developed in order to cluster the P-dimensional binary space {0, 1}
P
. To this end, k-means can be adapted to the peculiar nature of the signal at hand, or it can be substituted by means of ad hoc clustering algorithms such as k-medians or k-medoids, yielding comparable results [Reference Baroffio, Canclini, Cesana, Redondi, Tagliasacchi and Tubaro11,Reference Paratte69,Reference Galvez-Lopez and Tardos119].
${\open R}^{P}$
. Instead, in the case of binary descriptors, alternative techniques should be developed in order to cluster the P-dimensional binary space {0, 1}
P
. To this end, k-means can be adapted to the peculiar nature of the signal at hand, or it can be substituted by means of ad hoc clustering algorithms such as k-medians or k-medoids, yielding comparable results [Reference Baroffio, Canclini, Cesana, Redondi, Tagliasacchi and Tubaro11,Reference Paratte69,Reference Galvez-Lopez and Tardos119].
More recently, more effective global encodings tailored to binary local features have been proposed. Steinbach and co-workers propose BVLAD [Reference Van Opdenbosch, Schroth, Huitl, Hilsenbeck, Garcea and Steinbach70], an adaptation of the VLAD feature encoding algorithm to the context of binary local features. Similarly to VLAD, each local feature d
i
is assigned to the nearest centroid
 ${\bf v}_{{\rm NN}_{i}}$
, in terms of Hamming distance, and the assignment residual is computed as
${\bf v}_{{\rm NN}_{i}}$
, in terms of Hamming distance, and the assignment residual is computed as
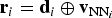 ${\bf r}_{i} = {\bf d}_{i} \oplus {\bf v}_{{\rm NN}_{i}}$
, where ⊕ represents the exclusive or (XOR) operator, i.e. a difference operator in the binary space. Identically to the case of VLAD, residual vectors are pooled over the centroids, and their dimensionality is reduced resorting to PCA.
${\bf r}_{i} = {\bf d}_{i} \oplus {\bf v}_{{\rm NN}_{i}}$
, where ⊕ represents the exclusive or (XOR) operator, i.e. a difference operator in the binary space. Identically to the case of VLAD, residual vectors are pooled over the centroids, and their dimensionality is reduced resorting to PCA.
D) Hybrid visual content/feature encoding
As described in Section I, the ATC paradigm is getting more and more attention in both the scientific community and the industry. ATC moves part of the analysis to sensing nodes, that extract, encode and transmit visual features to a sink node that performs higher level analysis. On the one hand, ATC makes a more efficient use of storage and transmission resources compared to the traditional CTA paradigm, yielding compact yet discriminative signatures. Furthermore, avoiding the image or video encoding process inherent to CTA, it generates visual features that are not affected by distortion introduced by pixel-level coding, such as ringing and block boundary artifacts. On the other hand, in ATC the pixel-level visual content is unavailable at the sink nodes and it can not be shown to the users or used for other purposes.
To overcome such issues, several hybrid paradigms for visual content analysis, aimed to combine the benefits of both ATC and CTA, have been proposed recently. In 2011, Chao and Steinbach propose to adapt the JPEG image compression method so as to preserve the quality of visual features that are extracted from lossy images [Reference Chao and Steinbach73]. Similarly, H.264/AVC video coding architecture can be modified, so that the lossy encoding process does not significantly affect the quality of visual features extracted from decoded frames [Reference Chao and Steinbach74].
Instead of modifying image or video coding primitives, a number of novel paradigms aim to efficiently encode and transmit both pixel- and feature-level representations. In particular, Chen and Moulin [Reference Chen and Moulin75] propose a solution to jointly encode images and global representations based on “BoW”. A feature enhancement layer is computed and attached to the traditional pixel-level stream, so as to improve the quality of global features extracted from lossy content, possibly impaired by coding artifacts. Similarly, Baroffio et al. propose “Hybrid-Analyze-Then-Compress” (HATC) [Reference Baroffio, Cesana, Redondi, Tagliasacchi and Tubaro7], a novel visual analysis paradigm aimed to encode and transmit both pixel-level representations and high-quality local features. In particular, since keypoint detection is strongly affected by coding artifacts, the location of keypoints extracted from original, lossless content is sent to the sink node, so that it is possible to detect stable keypoints. Furthermore, a descriptor enhancement layer is encoded and sent, so as to refine local descriptors possibly impaired by pixel-level coding.
IV. FEATURES EXTRACTED FROM VIDEO SEQUENCES
A number of visual content analysis tasks such as object tracking and event detection require visual features to be extracted and processed on a temporal basis, from a sequence of frames. In this context, a body of research is being carried out to introduce effective architectures for the extraction and compression of visual features starting from video sequences.
A) Feature extraction from video sequences
Typically, when considering applications based on video sequences, visual features are extracted and processed on a frame-by-frame basis [Reference Baroffio, Cesana, Redondi, Tubaro and Tagliasacchi8,Reference Baroffio, Ascenso, Cesana, Redondi and Tagliasacchi77]. In other cases, a GOP is processed concurrently to construct a feature-based temporal representation [Reference Baroffio, Canclini, Cesana, Redondi, Tagliasacchi and Tubaro11]. In the context of object tracking, stability and repeatability of keypoints detected in contiguous frames is key to achieving good performance. As comprensively presented in Section II, Shi and Tomasi [Reference Shi and Tomasi19] propose some modifications to the Harris corner detector, so that detected keypoints are stable over time and are thus suitable for tracking applications. Triggs [Reference Triggs, Pajdla and Matas120] thoroughly analyzes the problem of detecting keypoints that are robust with respect to changes in imaging conditions, such as illumination, contrast, and viewpoint. Kläser et al. [Reference Kläser, Marszałek and Schmid121] propose a spatio-temporal descriptor based on histograms of 3D gradients computed with respect to the two spatial dimensions and the temporal one. More recently, the works in [Reference Makar, Tsai, Chandrasekhar, Chen and Girod9] introduce a temporally coherent keypoint detector. According to such approach, only keypoints that can be accurately detected in a set of contiguous frames are retained, whereas non-repeatable detections are discarded, improving both task accuracy and feature coding performance.
Several tasks are time critical and require frames to be processed at a high rate. In this context, traditional feature extraction algorithms have been modified so that they can be efficiently run on low-power devices [Reference Baroffio, Canclini, Cesana, Redondi and Tagliasacchi122]. Furthermore, temporal redundancy inherent to video sequences can be exploited to efficiently detect keypoints on a frame-by-frame basis, significantly reducing the computational time needed to process each frame [Reference Baroffio, Cesana, Redondi, Tagliasacchi and Tubaro123].
B) Coding features extracted from video sequences
Besides extracting features from video content, several research studies have been conducted to address the problem of encoding visual features extracted from video sequences.
[Reference Baroffio, Cesana, Redondi, Tubaro and Tagliasacchi8,Reference Baroffio, Cesana, Redondi, Tagliasacchi and Tubaro10] propose VideoSIFT, a coding architecture tailored to real-valued local features such as SIFT or SURF, extracted from video sequences. The coding architecture is inspired by traditional video coding techniques, and it aims to adapt the main building blocks of well-established video coding architectures to the context of local features. A similar architecture [Reference Baroffio, Ascenso, Cesana, Redondi and Tagliasacchi77] has been proposed for binary local features such as BRISK and FREAK.
Makar et al. propose an architecture for encoding local features extracted from video sequences. According to such architecture, temporally coherent keypoints are detected, and the patches surrounding such keypoints are encoded in a predictive fashion [Reference Makar, Tsai, Chandrasekhar, Chen and Girod9]. Alternatively, descriptors can be encoded in place of patches in a predictive fashion [Reference Makar, Chandrasekhar, Tsai, Chen and Girod76]. The temporal correlation between video frames can be exploited to efficiently encode keypoint locations. In particular, methods presented in Section III-B can be adapted to the context of keypoints extracted from video content [Reference Baroffio, Cesana, Redondi, Tubaro and Tagliasacchi8,Reference Makar, Chandrasekhar, Tsai, Chen and Girod76].
Besides local features, the problem of encoding global representations extracted from contiguous frames has been recently addressed [Reference Baroffio, Canclini, Cesana, Redondi, Tagliasacchi and Tubaro11]. Finally, a number of works addressed the problem of building spatio-temporal features for action detection, recognition, and classification [Reference Wang, Kläser, Schmid and Liu124,Reference Wang and Schmid125], but they fall outside of the scope of the paper.
V. VISUAL FEATURE TRANS-MISSION AND NETWORKING
The last decades have seen huge technological leaps that are enabling a whole new range of applications and services. On the one hand, more and more powerful yet compact devices are being introduced. In particular, smartphones, tablets, and smart cameras pervade our everyday lives, and wearable devices will supposedly have a similar impact in next years. On the other end, Internet and the web are becoming ubiquitous, connecting billions of people in social networks, and offering advanced distributed services such as cloud computing. Besides, Wireless Sensor Networks (WSN) and cellular networks are expected to play a big role in the evolution toward an “Internet-of-Things”.
In the context of visual content analysis, a number of applications are performed in a distributed fashion, requiring cooperation between sensing devices and central processing nodes. Applications such as mobile visual search, smart camera networking, smart surveillance, computer-assisted driving are gaining popularity and are based on distributed computation. As presented in Sections I and III-D, CTA and ATC are alternative paradigms for distributed applications. The former is a traditional approach that has been successfully exploited in VSN and content-based search applications [Reference Paniga, Borsani, Redondi, Tagliasacchi and Cesana126,Reference Yu, Sahinoglu and Vetro127]. Methods based on such a paradigm have been thoroughly investigated and are out of the scope of the survey. Instead, we will present algorithms and methods for feature transmission, networking, and cooperation tailored to the ATC paradigm.
Low-energy consumption plays a crucial role in VSN. Computational and networking capabilities of sensing nodes are usually severely constrained to limit the energy consumption. In this context, ATC represents a promising solution, since it requires a small amount of data to be transmitted to central processing nodes [Reference Baroffio, Cesana, Redondi and Tagliasacchi2].
Yang et al. [Reference Naikal, Yang and Sastry78,Reference Yang, Maji, Christoudias, Darrell, Malik and Sastry79] propose a system for object recognition based on a smart camera network. In particular, a number of cameras are deployed over a region, so as to acquire the same scene from different point of views, and connected with a central processing node that performs the analysis. Since the acquired views refer to the same physical scene, features extracted from such views are correlated, too. Correlation is exploited to efficiently encode features from multiple views and to transmit them to the sink node.
Dan et al. [Reference Eriksson, Dan and Fodor80,Reference Dan, Khan and Fodor128,Reference Eriksson, Dan and Fodor129] propose an architecture for offloading part of the computational burden due to feature extraction on wireless sensor nodes. They consider a network composed of sensing nodes, that acquire visual content, and processing nodes, that can be exploited to offload part of the computation. In particular, each acquired image is split in subregions that are assigned to cooperating processing nodes. Each node performs a subtask by extracting features from the assigned regions. Furthermore, the computational load on network nodes can be balanced by properly assigning subtasks.
Similarly, Redondi et al. [Reference Redondi, Baroffio, Cesana and Tagliasacchi81,Reference Redondi, Cesana, Tagliasacchi, Filippini, Dán and Fodor82] propose a framework for cooperative feature extraction on low-power visual sensor nodes. Several different network configurations and protocols are proposed and empirically evaluated in terms of speed up of feature extraction task, network lifetime, and energy consumption.
Baroffio et al. [Reference Baroffio, Cesana, Redondi and Tagliasacchi3] show that network condition can severely affect the accuracy of visual content analysis tasks. In particular, noisy channels and transmission errors may lead to packet loss and transmission delay, impairing the performance of the system. Reliable transfer protocols achieve good task accuracy, since packet loss is prevented, at the cost of increased network delay.
Besides VSN, the ATC paradigm has been effectively implemented in the context of mobile visual search. Girod et al. [Reference Girod83] thoroughly analyze the problem and show that ATC represents the most effective option in terms of bandwidth-accuracy performance. In particular, they propose an object retrieval system based on the transmission of CHoG features [Reference Chandrasekhar, Takacs, Chen, Tsai, Grzeszczuk and Girod51] and compressed keypoint positions. The performance of the mobile visual search system is evaluated in terms of a number of key metrics such as query accuracy, response delay, transmission bitrate, and energy consumption.
VI. CONCLUSION
Distributed visual content analysis is an interesting problem related to a large number of applications, including advanced surveillance, mobile visual search, and augmented reality that is having a huge impact on our everyday lives. Until few years ago, handcrafted features such as SIFT and SURF represented the state of the art for visual content analysis. In particular, SIFT is widely regarded as the gold standard in the context of local feature extraction, and has been partially adopted by the MPEG Compact Descriptors for Visual Search (CDVS) [Reference Duan, Gao, Chen, Lin and Huang4,130] standard, which includes: (i) an optimized implementation of SIFT, along with a local feature compression architecture based on multi-stage quantization [Reference Chen, Duan, Ji and Wang54], (ii) a global feature algorithm based on Fisher Kernels, and (iii) a keypoint location coding module based on histograms of keypoint positions [Reference Girod83].
SIFT-based solutions have been successfully exploited in both centralized systems running on powerful servers and on portable devices like smartphones. Nonetheless, their computational complexity is still quite high- for low-power devices, and thus they could not be the better choice in the case of limited computational resources and high frame rates [Reference Canclini, Cesana, Redondi, Tagliasacchi, Ascenso and Cilla12].
Binary local features such as BRISK and FREAK have been introduced as fast alternatives to SIFT. Some studies proved that they approach the quality of SIFT in terms of discriminative power, while being up to 20 times faster [Reference Baroffio, Cesana, Redondi and Tagliasacchi44]. They are thus a good choice for scenarios in which computational resources are limited, like in the case of VSN nodes or any other low-power or battery-operated devices.
Traditional machine learning techniques like boosting and bagging have been successfully exploited to build effective descriptors [Reference Trzcinski, Christoudias, Lepetit and Fua45] or to improve the accuracy performance of existing methods [Reference Baroffio, Cesana, Redondi and Tagliasacchi44]. In the meanwhile, the use of deep learning techniques to detect and describe keypoints looks a promising area of research.
We proposed an overview of the most successful techniques for extracting, encoding, and transmitting compact representations of visual content, describing their evolution during the last two decades. Furthermore, we highlighted and compared the characteristics of each solution, providing indications for some different visual analysis tasks. Such overview may serve as an entry point and a reference for further research in the area.
ACKNOWLEDGEMENTS
The project GreenEyes acknowledges the financial support of the Future and Emerging Technologies (FET) program within the Seventh Framework Program for Research of the European Commission, under FET-Open grant number 296676.
Luca Baroffio received the M.Sc. degree (2012, cum laude) in Computer Engineering and the Ph.D. degree (2016) in Information Technology both from Politecnico di Milano, Milan, Italy. In 2013, he was visiting scholar at “Instituto de Telecomunicações, Lisbon”, Portugal. His research interests are in the areas of multimedia signal processing and visual sensor networks.
Alessandro E. C. Redondi received the M.S. in Computer Engineering in July 2009 and the Ph.D. in Information Engineering in 2014, both from Politecnico di Milano. From September 2012 to April 2013 was a visiting student at the EEE Department of the University College of London (UCL). Currently, he is an Assistant Professor at the “Dipartimento di Elettronica, Informazione e Bioingegneria – Politecnico di Milano” and his research activities are focused on algorithms and protocols for Visual Sensor Networks and on the analysis of computer networks data.
Marco Tagliasacchi is currently an Assistant Professor at the “Dipartimento di Elettronica e Informazione Politecnico di Milano”, Italy. He received the “Laurea” degree (2002, cum Laude) in Computer Engineering and the Ph.D. in Electrical Engineering and Computer Science (2006), both from Politecnico di Milano. He was visiting academic at the Imperial College London (2012) and visiting scholar at the University of California, Berkeley (2004). His research interests include multimedia forensics, multimedia communications (visual sensor networks, coding, quality assessment), and information retrieval. Dr. Tagliasacchi co-authored more than 120 papers in international journals and conferences, including award winning papers at MMSP 2013, MMSP2012, ICIP 2011, MMSP 2009, and QoMex 2009. He has been actively involved in several EU-funded research projects.
Stefano Tubaro completed his studies in Electronic Engineering at the Politecnico di Milano, Italy, in 1982. Since December 2004 he has been appointed as a Full Professor of Telecommunication at the “Dipartimento di Elettronica, Informazione e Bioingegneria of the Politecnico di Milano (DEIB-PoliMi)”. His current research interests are on advanced algorithms for video and sound processing. Stefano Tubaro authored over 150 publications on international journals and congresses. In the past few years, he has focused his interest on the development of innovative techniques for image and video tampering detection and, in general, for the blind recovery of the “processing history” of multimedia objects. Stefano Tubaro is the Head of the Telecommunication Section of DEIB-PoliMi, and the Chair of the IEEE SPS Italian Chapter; moreover he coordinates the research activities of the Image and Sound Processing Group (ISPG). He is a member of the IEEE MMSP and IVMSP TCs.


 Open access