

Introduction
The role of the oceanic heat flux as one of the key constituents of sea-ice energy and mass balance is clear (Reference Uusikivi and ShirasawaWettlaufer, 1991). turbulent fluxes under sea ice have been studied quite extensively in arctic waters. these studies have revealed that local variations in heat flux are small, but influences on the sea-ice thickness and extent are large, suggesting that the ice cover is sensitive to small differences in the local ocean heat flux (Reference McPhee, Kikuchi, Morison and StantonMcphee and others, 2003). this makes accurate and local heat-flux studies important. the areas studied previously are more or less affected by tidal currents. tides modify the current regime under the ice, making it quite different from areas without any tidal effect (Reference Shirasawa and IngramShirasawa and others, 1997). in particular, interactions between tidal currents, bottom topography and ice keels modify the turbulent current field under fast ice (Reference Marsden, Paquet and IngramMarsden and others, 1994). the northern baltic sea basin has no tidal effect, making it an ideal site for studying turbulent fluxes under conditions where current velocities are low.
The northern baltic sea region has a considerable seasonal ice-cover period ranging from a few months to half a year. there is a long tradition of sea-ice research in the baltic sea area, but despite this there is very little knowledge about turbulent flux properties under ice in the region (Reference Leppäranta, Makkonen, Palosuo and KuusistoLeppäranta and others, 2001). field experiments to measure turbulent heat fluxes from ocean to sea ice have been carried out in diverse ice conditions and have reported a wide spectrum of oceanic heat fluxes. it is of interest to compare to this study measurements performed in the landfast ice areas in the arctic and sub-arctic, with an average in resolute passage, canada, of 32wm–2 (Reference Shirasawa and IngramShirasawa and ingram, 1991a, Reference Shirasawa and IngramB, Reference Shirasawa and Ingram1997) and in saroma-ko lagoon, japan, of 57.9wm–2 (Reference Shirasawa and IngramShirasawa and others, 1997). both of these areas have significant tidal currents: up to 10cms–1 in resolute passage (Reference Marsden, Paquet and IngramMarsden and others, 1994) and 4–5 cms–1 in saroma-ko lagoon (Reference Shirasawa and IngramShirasawa and others, 1997).
The aim of this study is to investigate the magnitude of the turbulent fluxes under sea ice in the baltic sea and to examine how they might differ from the tidally influenced arctic and sub-arctic sea ice regions, and whether findings in those regions can be applied to the non-tide low-salinity baltic sea fast-ice areas. the main interest was to calculate the oceanic heat flux, friction velocity and the size of turbulent eddies. the information gathered in this study is helpful when developing a baltic sea ice salinity model and coupling it with ocean models. furthermore these results are of interest for biological sea-ice studies. the algae communities in and at the bottom of the ice cover are largely controlled by nutrient regeneration by turbulent transport from the water column. the rate of nutrient supply from the water column is a function of vertical turbulence in water layers immediately beneath the ice (Reference CotaCota and others, 1987).
Study Sites
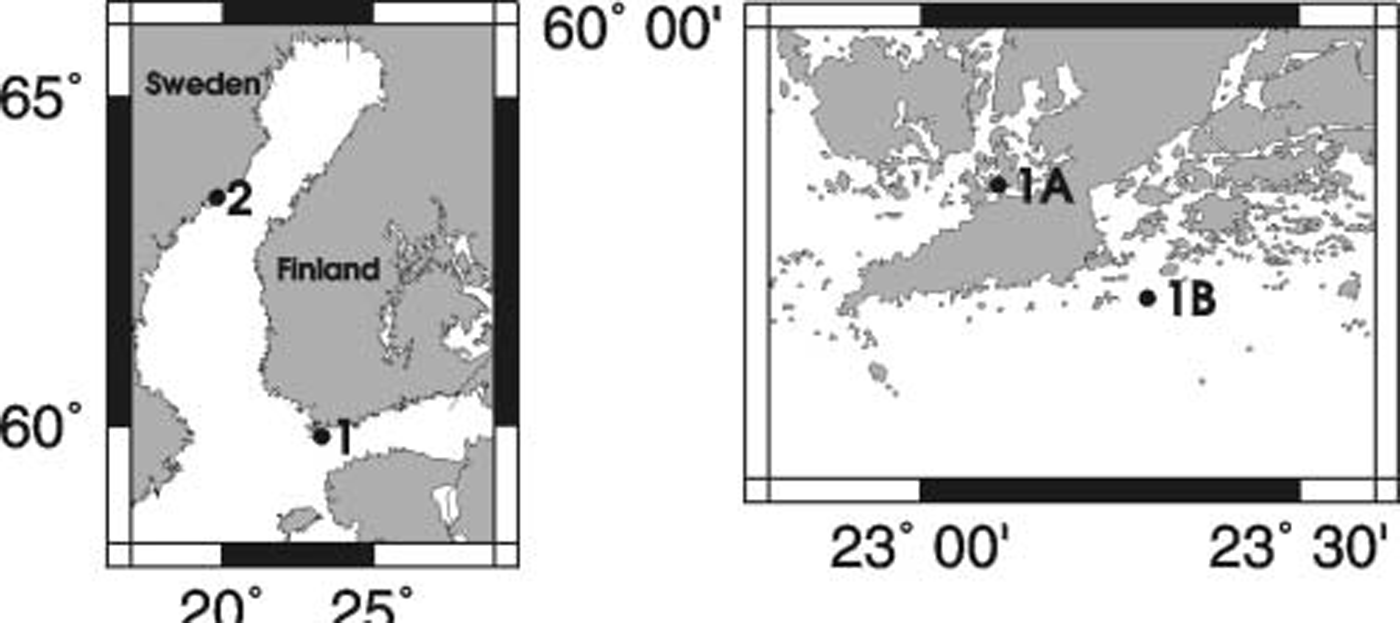
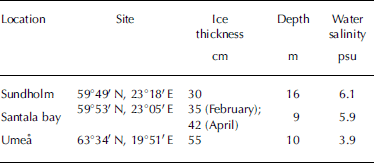
Measurements of under-ice turbulence were performed at two coastal areas in the baltic sea during two consecutive winters. in 2003 the experiment site was off the southern coast of finland, close to the hanko peninsula (fig. 1, location 1). from 10 to 12 february during the ice-growth period, measurements were performed in the sundholm area (fig. 1, location 1b) some kilometers off the coast outside the archipelago; and in the santala bay area (fig. 1, location 1a) close to the coast and sheltered from the open sea by the archipelago. the sundholm site was approximately 5 km north of the fast-ice edge, and during our measurements the entire gulf of finland was ice-covered. under such conditions, no direct wind forcing of under-ice currents was expected and none was observed. from 17 to 18 april, after ice decay had started, the measurements were made in santala bay only. see table 1 for ice-thickness and water-depth measurement.
Map of measurement locations: Hanko peninsula (1); Santala bay (1A); Sundholm (1B); and Umeå (2).
Ice thickness, water depth and water salinity of the measurement sites used
In 2004, measurements were undertaken in the central gulf of bothnia close to the city of umeå, sweden, in a semi-sheltered bay area near the coast. the measurement period was 16–19 march, when maximum ice thickness had been reached. the water depths at these sites are representative of landfast sea ice in the baltic sea (usually the landfast ice edge is located at the 5–15m isobath (Reference LeppärantaLeppäranta, 1981)).
Methods
Measurements of under-ice turbulence were performed using an acoustic doppler three-dimensional current meter (vector, nortek as) with an attached fast-repetition temperature–conductivity sensor (accct, pme). the current meter has a measurement accuracy of ±1mms–1, with a sampling volume of 884mm3 (diameter 15 mm, height 5 mm) and doppler noise of about 1%. conductivity measurements have an accuracy of 0.1% and temperature measurements an accuracy of 0.020˚c. sensors were deployed either through the ice to the underlying water column while suspended by a fiber-glass shaft from the ice, or mounted directly to the ice cover with the access hole insulated to prevent freezing in the hole.
Measurement depths varied between 0.22 and 3m beneath the ice bottom, with the majority of the measurements done 0.22–1.35m below the ice bottom. sampling rates varied from 8 to 16 hz, with measurement periods ranging from 20 min to 3 days per location. eddy correlation techniques were applied, and values for heat and salinity flux, friction velocity, roughness reynolds number and heat-transfer coefficient calculated. all measurements were checked for quality and divided into 10 min periods. data periods with <70% of measurements exceeding quality standards were rejected from the analysis.
Results and Discussion
Measurements show average 10 min horizontal velocities between 0.8 and 3.2cms–1 (fig. 2). earlier studies in the santala bay area have observed average current velocities of 2.6–3.6 cms–1 (Reference Shirasawa, Ingram and HudierUusikivi and Reference Shirasawa, Ingram and HudierShirasawa, 2004). Reference Shirasawa and IngramShirasawa and others (1997) measured 3.6–5.1cms–1 average velocities in the tidally influenced saroma-ko lagoon. in this experiment, average vertical velocities were small, 0.0–0.38 cm s–1, but the maximum measured instantaneous velocity was over 20 times higher, 9.4cms–1. all the highest velocities were observed in the region furthest from the coast. average horizontal velocities in the locations closer to the coast were in the range 0.8–2.2 cms–1.
Measured vertical velocity (a), horizontal velocity (b), temperature above freezing (c) and conductivity (d) from Umeå, 16 March 2004, 1500 h Central European Time (CET) onwards for 18 hours.
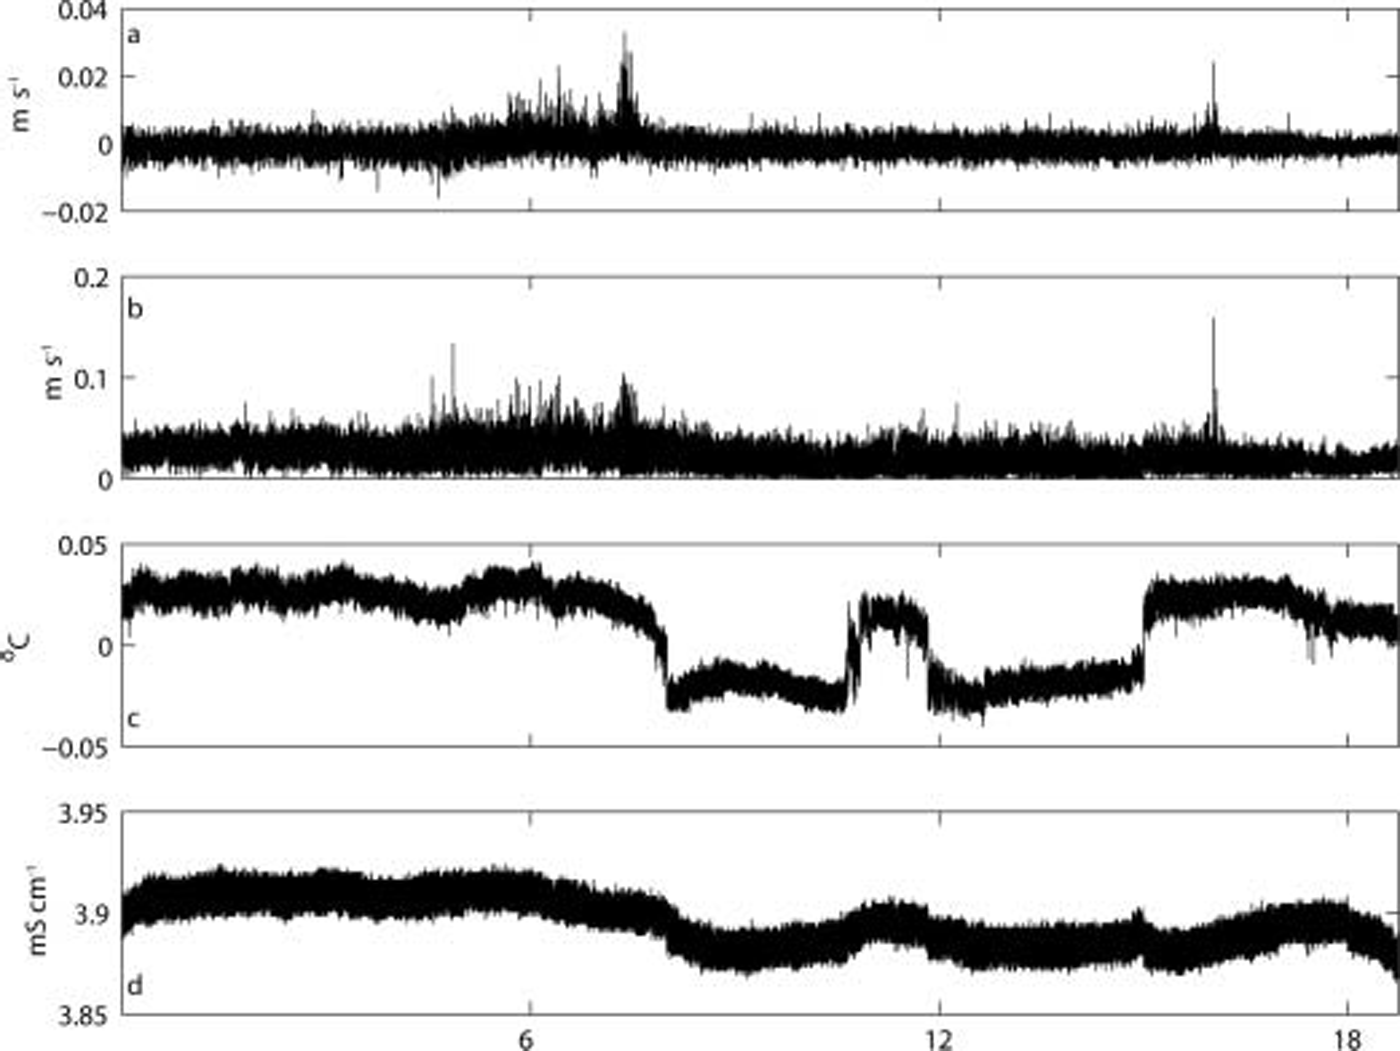
The range of measured water salinities was 3.9–6.1 psu (practical salinity units). these were calculated from temperature and conductivity measurements using unesco (Reference Fofonoff and MillardFofonoff and millard, 1983) algorithms. the unesco algorithms were also used to calculate the sea-water temperature above the freezing point, ΔT = T – T f(s). ΔT was large, 2.8–3.6˚c, during melting-period measurements, while in other measurements ΔT was small, 0.08 to –0.05˚c. these periods of supercooled water colder than –0.02˚c were all observed in the umeå area, and lasted from 1 min to up to 2 hours.
The surface layer consists of three types of flow regimes: a laminar flow regime close to the ice–water boundary, a transitional flow between the other two flow regimes and a turbulent flow regime furthest from the boundary. the reynolds number, re, and roughness reynolds number, re*, are used to determine the current flow regime and whether the flow is hydrodynamically rough or smooth. they are defined as (Reference Shirasawa and IngramShirasawa and ingram, 1991a, Reference Shirasawa and IngramB):
Where U is the current velocity, D is the distance from the ice bottom, v is the kinematic viscosity of sea water, u * is the friction velocity and z 0 is the roughness length, z 0 = 30k s, where k s is the mean height of roughness elements. k s can also be taken to be the standard deviation of ice thickness at one location (Reference Shirasawa and IngramShirasawa and others, 1997). z 0 was found to be 0.3–0.4mm at all locations, while z 0 estimates in other fast-ice region studies range from 0.1 to 2mm (Reference Shirasawa and IngramShirasawa and others, 1997; Reference McPheeMcphee, 2002).
Re was used to distinguish between fully turbulent and laminar or transitional flow situations. then the non-turbulent situations were excluded from the analysis and only the turbulent flow situations contributed to the statistics. re* indicated that all the measurements in this study were done with flow that was either hydrodynamically smooth or transitional from smooth to rough.
Turbulent flux quantities were obtained using 10 min averages and deviations from average: T0 = T = hTi, where T is the measured value and hi denotes the 10 min average value. using the formulation of Reference McPheeMcphee (1992, Reference McPhee2002), momentum, heat and salinity fluxes, т, F w and S w respectively, and friction velocity, u *, were calculated:
Where ρ w is the sea-water density, u' is the east deviation velocity, v' is the north deviation velocity, w' is the vertical deviation velocity, c p is the specific heat of sea water, T0 is the sea-water deviation temperature and S' is the sea-water deviation salinity.
Mean friction velocities in the umeå region were 0.04–0.2 cms–1, with an overall average of 0.08cm s–1. in the other
Sheltered areas, friction velocities were 0.04–0.1cms–1. at the sundholm site, the friction velocity was higher than at the other sites, with an overall average of 0.39 cm s–1(table 2). this site also had a higher mean velocity than the other sites. these values agree well with the findings of earlier studies performed in fast-ice areas in other oceans. Reference Shirasawa and IngramShirasawa and others (1997) measured 0.13cms–1 in the saroma-ko lagoon, and Reference Shirasawa and IngramShirasawa and ingram (1997) 0.56cms–1 in the arctic. measured friction velocities in the arctic pack ice are higher than ours (Reference McPheeMcphee, 1992, Reference McPhee2002). the highest 10 min average friction velocities were found to correlate well with the highest vertical velocity.
Roughness Reynolds number (Re*), friction velocity (u*), oceanic heat flux (F w), measurement depth below ice bottom and temperature above freezing (δT): overall averages for each site
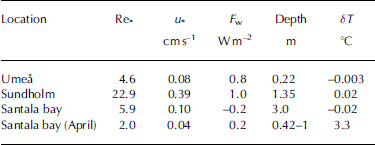
The maximum observed 10 min average heat flux was 18wm–2 at sundholm, 14wm–2 at umeå and 5wm–2 in santala bay. as with the friction velocity, changes in the heat flux correlated to changes in vertical currents (fig. 3). large negative (downward) heat fluxes were observed in santala bay during spring melting, and the 10 min maximum average was –10wm–2. the average heat flux was –0.2 to 1wm–2 at all sites, and in february the net heat flux was downward in santala bay.
Calculated 10 min average friction velocity (a) and oceanic heat flux (b) from Umea˚, 16 March 2004, 1500 h CET onwards for 18 hours.

Salinity transport was calculated from conductivity fluxes in the same manner as the heat flux. salinity flux was found to be small in all measurements, between –0.31×10⁻⁷ and –0.40×10⁻⁷ psums–1. transport was downward during winter months and upward during the spring melting period (average 0.24×10⁻⁷ psums–1). this upward transport of salinity might be created by a low-salinity surface layer under ice during the melting period and the related freshwater transport downwards. under the leads of the arctic perennial pack ice, the salinity flux has been measured as between –1.63×10⁻⁶ and –1.54×10⁻⁵ psums–1 (Reference McPhee, Ackley, Kottmeier and MorisonMcphee and stanton, 1996).
With knowledge of the local friction velocity and the heat-transfer coefficient, c H, estimates of interfacial heat flux can be made without detailed flux measurements, and these are also important in sea-ice models when resolving the ice energy budget. c H can be resolved according to Reference McPheeMcphee (1992):
The heat-transfer coefficient in the umeå area was 0.0062 and is close to the arctic pack-ice average value of 0.006 (Reference McPhee, Ackley, Kottmeier and MorisonMcphee and others, 1999; Reference Krishfield and PerovichKrishfield and perovich, 2005). in the hanko area, only a few reliable measurements were made during the ice formation period, so there is a large standard deviation in the heat-transfer coefficients. these measurements have c H = 0.0038, but more investigations should be made in this area before further conclusions can be made. all these c H values were obtained from data with negative δT situations removed.
Turbulent eddy size measurements were one of the primary targets of this study. eddy size was estimated using calculated power spectra and then assuming that frequency is proportional to wavenumber and that the scale of the largest (energy-containing) turbulent eddies is indicated by wavenumbers just below the start of the –5/3 energy cascade (Reference McPheeMcphee, 1992) (fig. 4).
Vertical turbulence power spectra calculated from Umea ˚ measurements, and –5/3 dissipation slope.

The main turbulent fluxes were accomplished by eddies with timescales from 0.5 to 8 min. horizontal length scales varied from 0.4 to 2.4m in the umeå area, from 2.7 to 7m in santala bay and from 8 to 9 m in the sundholm area. the difference between locations suggests that turbulent eddies are modified locally according to the prevailing conditions, such as bathymetry. under arctic pack ice, Reference McPheeMcphee (1992) reported turbulent eddies with length scales of the order of tens of meters.
Conclusions
Using turbulence measurements from three coastal locations in the baltic sea, under-ice turbulent fluxes and turbulence characteristics of the brackish water environment were estimated. the flow regime in these areas was either hydrodynamically smooth or transitional from smooth to rough.
Differences between the baltic sea and ocean areas where tides are significant are manifold, but there are also some similarities. the biggest dissimilarity is in the oceanic heat flux. this study indicated that heat flux in the baltic sea fast-ice region is much smaller than in fast-ice areas affected by tides. the average heat flux was –0.2 to 1 wm–2, thus confirming small oceanic heat flux in the baltic sea fast-ice areas. the heat-transfer coefficient was 0.0062 in the umea˚ area and somewhat smaller in the hanko peninsula region. this study possibly shows some variation in the heat-transfer coefficients, so further observations under different conditions in the baltic sea are required. the friction velocity was found to be similar to or smaller than that in other oceanic landfast ice areas. the average friction velocity ranged from 0.04 cms–1 at the more sheltered sites to 0.39 cms–1 at the more open sites with higher current velocities.
Acknowledgements
Support and funding for the work in sweden was provided by the umeå marine sciences centre, and funding for the work in finland was obtained from the walter and andrée de nottbeck foundation. the staff of the tvärminne zoological station provided logistical support and the use of their facilities.


