1. Introduction
In February 1991, as USCGC Polar Sea was en route to South America from McMurdo Station, unusually deep snow was observed on many floes in the central Ross Sea (Fig. 1)(Fig. 2). Unfortunately, it was not possible to go out on the floes to measure the snow depth and other parameters.

Fig. 1. Deep-snow-covered floe in the central Ross Sea, February 1991. The snow is estimated to be 1.0-1.25m deep and the ice surface is probably depressed below water level, i.e. the floe has a negative freeboard.

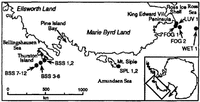
Fig. 2. Map of the location of sampling sites along the coast of 114arieByrd Land and north of Thurston Island, Ellsworth Land, West Antarctica. The inset map shows the location if the study area relative to the rest if Antarctica and the location (arrow) if deep-snow-covered floes observed in the central Ross Sea in February 1991.
In February-March 1992, during a cruise aboard USCGC Polar Sea in the eastern Ross, Amundsen and western Bellingshausen Seas off West Antarctica (Fig. 2), the primary research objective was to investigate the physical properties, structural characteristics and development of pack-ice floes Reference Jeffries, Shaw, Morris, Veazey and KrouseJeffries and others, 1994). However, deep snow was encountered once again, this time in the eastern Ross Sea and the Amundsen Sea. Thinner snow cover was observed on floes in the western Bellingshausen Sea.
In 1992, for both the Ross/Amundsen and Bellingshausen Seas regions, a data set on snow depth, density, load and oxygen-isotopic variations was compiled. The data set is not large but it is important in view of the relative sparsity of information on the nature of the snow cover on Antarctic sea ice and on snow-sea-ice interactions.
2. Study Area And Methods
From mid-February to mid-March 1992, GSCGC Polar Sea passed along the coast of Marie Byrd Land to Pine Island Bay before entering the western Bellingshausen Sea north of Thurston Island (Fig. 2).Snow samples and ice cores were obtained from floes near King Edward YII Peninsula, Mount Siple and in the western Bellingshausen Sea (Fig. 2).
At each site, a snow pit was excavated, the snow depth was measured and snow samples were removed using a 58 mm diameter, 500 cm-3 snow tube. A continuous sequence of snow samples was taken from the top to the base of the snow cover at each location. At sites where the ice surface was flooded and the base of the snow cover was soaked with sea water (LUV-1, FOG-1, FOG-2, WET-1, SPL-l, SPL-2 BSS-2), sampling stopped at the top of the soaked snow layer. Once samples were removed from the snow cover, the snow and tube were weighed and the density determined. These samples were then melted and placed in storage for later oxygen-isotope analysis. All sites were measured for density and isotopes, except LUV-1 and WET-1.
A total of 76 and 58 density measurements was made in the Ross/Amundsen and Bellingshausen Seas regions, respectively. A total of 93 and 59 oxygen-isotope measurements was made on samples from the Rossi/Amundsen and Bellingshausen Seas regions, respectively.
The oxygen isotope or 18O/16O ratios of melted samples was measured by mass spectrometer.They are expressed as δ18O in units of parts per thousand (%0).δ18O is the difference between the ratio of the heavy to light isotope in the sample and the isotopic ratio of a standard (V-SMOW, δ18O= + 0.07%0).
3. Snow Characteristics
3.1 Snow depth
In the central Ross Sea (Fig. 2), in February 1991, the surface of the snow cover on the majority of floes was estimated to be 0.3-2.0 m above water level. The depth of the snow and the character of the snow surface gave the floes a high, flat-topped appearance that was accentuated by the vertical walls of the margins of the snow cover (Fig. 1). Distinct layers and occasional overhangs were visible in the walls (Fig. 1). Many deep snow-covered floes, with characteristics similar to those seen the previous year in the central Ross Sea, were observed in February 1992 in the eastern Ross Sea and Amundsen Sea, offshore from Marie Byrd Land (Fig. 1). Commonly, the snow cover was 1-2 m deep (estimated) but a few floes had 3-4m (estimated) deep snow cover. Measured snow-depth values varied between 1.56 and 1.98 m (mean,1.5±0.49 m) in the Rossi Amundsen Seas region, and between 0.16 and 0.7 m (mean, 0.34 ±0.15 m) in the Bellingshausen Sea region (Fig. 3). There were no indications of melting, either at the snow surface (e.g. melt ponds) or within the snow cover (e.g. ice layers, lenses, pipes) in any region in 1991 and 1992.
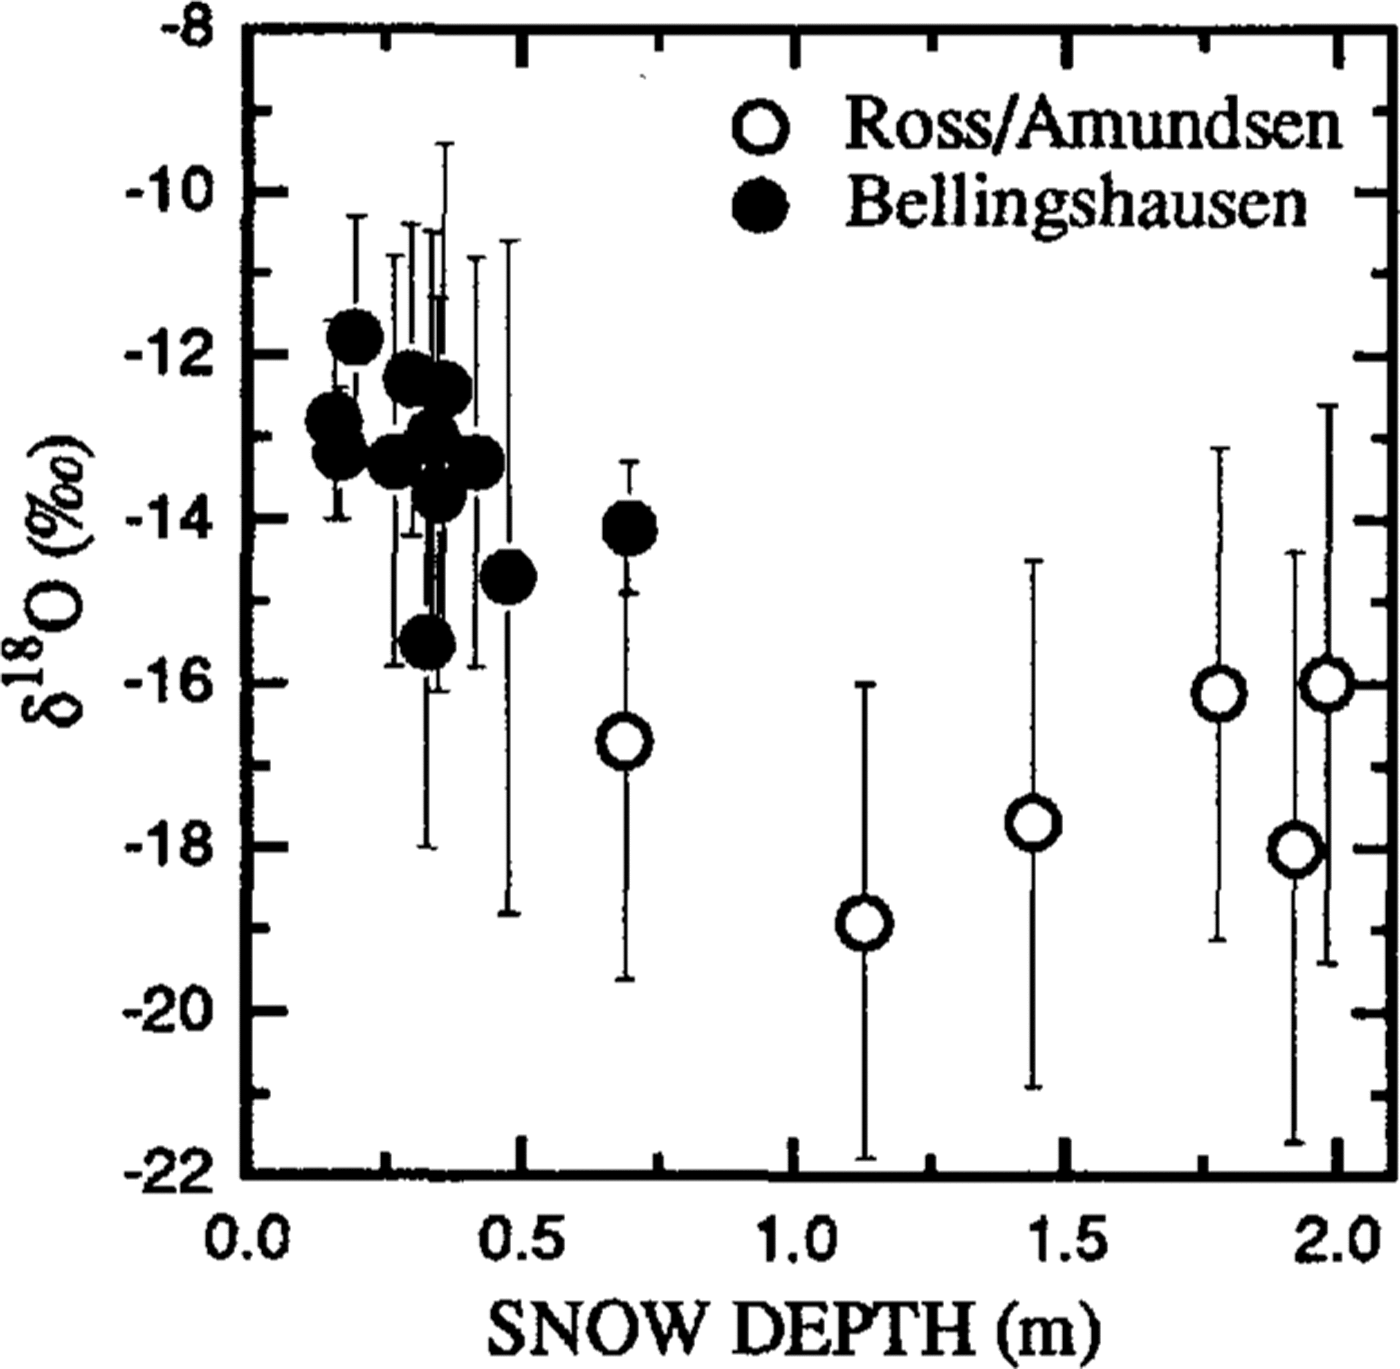
Fig. 3. Scatter plot of snow depth vs δ18O (mean ±1 standard deviation).
3.2. Snow density and snow load
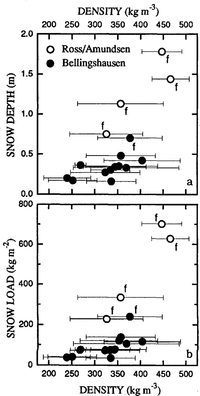
The minimum and maximum individual density values were 91 and 543 kg m-3, respectively. The lowest values occurred in soft, fresh snow. The highest values were associated with hard snow that fractured conchoidally during pit excavation. Mean density values of individual pits varied between 240 ±51 and 446±41 kg m3 (Fig. 4). The highest-density values were observed in the Rossi Amundsen Seas region but overall the difference between the Ross/Amundsen and Bellingshausen Seas density data is small (Fig. 4).

Fig. 4. Scatter Plots of density (mean ±1 standard deviation) vs total snow depth (a) and snow load (b). Those floes which were flooded with sea water are identified by a letter“f”.
The data indicate that the snow load was greater in the Ross/Amundsen Seas region (Fig. 4a).In the Bellingshausen Sea region, the total load on Hoes varied between 39 and 242kgm-2(mean 88 ±58kgm-2),whereas it varied between 277 and 702 kg m-2(mean 472 ±197 kg m-2) in the Ross/Amundsen Seas region(Fig. 4b).The mean snow-load values are conservative at those sites where the base of the snow cover was not sampled, because it was soaked with sea water(Fig.4).
3.3 Stable-isotopic composition
Individual δ18O values in the snow cover varied between -22.8 and -9.1%0.The mean δ18O value of all the snow samples in the western Bellingshausen Sea was-13.5±2.4%0 compared with a lighter mean δ18O value of -17.1±3.1%0 for the Ross/Amundsen Seas region (Fig. 3).
3.4 Density and δ18O variations as a function of depth
It was noted in section 3.1 that distinct layers were visible in the walls of the deep snow cover in the Ross/Amundsen Seas region (Fig. 2). Layering was also evident in the density and isotope profiles in that region. For example, at site SPL-l, distinct maxima and minima in the isotope profile suggest there are two full layers, plus part of a third at the base of the snow cover (Fig. 5b). Extrapolating the lines identifying the isotopic layers across to the density profile shows that density minima and maxima occur within one isotope layer, i.e. at best, there is a poor correlation between the density and isotope profiles (Fig. 5).

Fig. 5. Density and δ18O as a function depth in the snow cover at sites SPL-J and BSS-2. Possible annual units in the δ18O profiles are identified by horizontal, fine dashed lines and numbers in italics. For SPL-1, the dashed lines have been extrapolated across to the density profile to illustrate the poor correlation between isotopic minima and maxima and density minima and maxima.
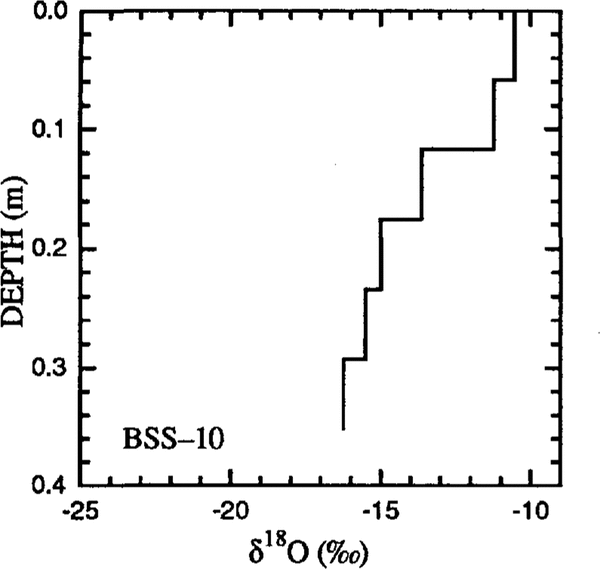
Other than fresh snow at the surface, there was less evidence of layering in the density profiles of Bellingshausen Sea sites (Fig. 5c).The only site in the Bellingshausen Sea region, where isotope maxima and minima indicated the presence of layering (one layer), was at BSS-2 (Fig. 5d). At the majority of Bellingshausen Sea sites, the most negative δ18O values occurred at the base of the snow cover and became more positive towards the surface (Fig. 6).

Fig. 6. Oxygen-isotope profile at site BSS-10 In the western Bellingshausen Sea.
4 Discussion
4.1 Snow density and snow load
Apart from low-density layers of fresh snowfall, the snow cover often had an extremely high density, with many values exceeding those quoted by Reference PatersonPaterson (1981) for wind-packed snow (350-400 kg m-3). The occurrence of conchoidal fracture during pit excavation and the character of the walls of the snow cover (Fig. 1) suggest a mechanically competent material. I t is unlikely that the high densities are due to overburden pressure. For example, a density of 400 kg m-3occurs at only 0.2 m below the surface at SPL-2(Fig. 5a);0.2 m of snow would provide insufficient compressive stress to density the snow. It is more likely that the high density values are evidence of snow deposition in a windy environment. The layered character of the dense, mechanically competent snow and the conchoidal fractures observed during snow-pit excavation are strong evidence that the snow cover had been subject to strong winds.
The high density and often considerable depth of the snow would account for the high snow loads on the floes and the flooding that was encountered during sampling (Fig. 4b). Heavy snow loads and consequent flooding are instrumental in the formation of snow-ice at the surface, a means by which Antarctic floes increase their thickness from the top upwards Uacka and others, 1987; Reference Lange, Schlosser, Ackley, Wadhams and DieckmannLange and others, 1990; Reference Lange, Hubberten, Macno and HondohLange and Hubberten, 1992; Reference Jeffries and WeeksJeffries and Weeks, 1993; (Reference Jeffries, Shaw, Morris, Veazey and KrouseJeffries and others, 1994). Except for site WET-1, snow-ice layers were found at the top of all the floes, whether they were flooded or dry at the time of sampling in 1992, indicating the role of the snow cover in sea-ice development in this region of the Southern Ocean Reference Jeffries, Shaw, Morris, Veazey and KrouseJeffries and others, 1994.
4.2 Snow depth and age of the ice
A comparison of the snow-depth data with reports from other sea-ice regions of the Southern Ocean indicates that, whereas the amount of snow on floes in the Bellingshausen Sea region is not unusual, the deep snow cover observed in the Ross/Amundsen Seas region is generally greater than amounts reported elsewhere (Reference Wadhams, Lange and AckleyWadhams and others, 1987; Reference Lange and EiekenLange and Eicken, 1991; Reference Jeffries and WeeksJeffries and Weeks, 1993; Reference Allison, Brandt and WarrenAllison and others, 1993). That such deep snow should have been encountered in the Ross/Amundsen Seas region and that it should have exceeded that in the Bellingshausen Sea region was unexpected.
One reason for the surprise at the amount of snow is the simple fact that there have been few if any reports of such deep snow on either Antarctic or Arctic ice floes. The second reason is that the ice sheet adjacent to the Bellingshausen Sea has the highest surface balance of all Antarctica, and seaward extrapolations from the continental-surface balance suggest that a greater amount of snow might be expected on the Bellingshausen Sea ice that on the Ross/Amundsen Seas ice (Reference Giovinello and BentleyGiovinetto and Bentley, 1985; Reference Giovinetto, Bromwieh and WendlerGiovinetto and others, 1992).
The most likely explanation for the snow-depth contrast between the Ross/Amundsen and the Bellingshausen Seas regions is a difference in the age of the ice. Anomalous ice conditions occurred in the Bellingshausen Sea in the austral summer of 1991, when it was almost ice-free (Reference Jacobs and CumisoJacobs and Comiso, 1993). Consequently, the majority of the floes that were investigated in the late austral summer of 1992 were probably barely I year old and had not existed long enough for a deep snow cover to accumulate on them. In a "normal" sea-ice year, perhaps a greater depth of snow might be observed on Bellingshausen Sea floes. Only future observations will determine whether or not this is the case.
4.3 Isotopic variations
Seasonal, temperature-dependent variations in the oxygen- isotopic. composition of precipitation, when winter precipitation with more negative δ18O values than summer precipitation creates annual units in the snow and ice, are important glaciological phenomena that have been used widely in ice-core studies of palaeo-environmental change (e.g. Reference Dansgaard, Johnson, Clausen and GundestrupDansgaard and others, 1973). Reference Lange, Hubberten, Macno and HondohLange and Hubberten (1992) reported isotopic minima and maxima in Weddell Sea ice snow cover and suggested they also represented annual units. It is quite possible that, despite the evidence for a windy depositional environment and potential for erosion and redistribution of snow, the isotopic minima and maxima observed in the Ross/Amundsen Seas snow cover (Fig. 5b) and at the Bellingshausen Sea site BSS-2 (Fig. 5d) represent winter and summer precipitation, i.e. there are annual units in the snow cover. The maximum number of annual units observed in the snow cover was two, plus an incomplete unit (Fig. 5b).This was typical of the Ross/Amundsen Seas snow cover and suggests 2-3 years of snow accumulation on ice of a similar age.
It is not uncommon for a single annual unit identified in an isotope profile to contain both density minima and maxima, e.g. SPL-2 (Fig.5). Benson (1962) drew attention to this fact and explained that it is due to the effects of individual storms and high winds. If the high density values in the study area are due to wind action, then the density layers observed in the snow cover might be a record of fluctuations in wind intensity or storminess in this region, and the layers observed in the walls of the snow cover and in the density profiles might represent individual wind slabs.
The form of the isotope profiles in the Bellingshausen Sea snow cover is probably additional evidence for the young age of the Bellingshausen Sea ice. Only the snow cover at BSS-2 (Fig. 6d) had a recognizable annual unit. Otherwise, the trend from the most negative δ18O values at the base of the snow cover to more positive δ18O values at the surface (Fig. 6) suggests there is less than a full year's accumulation on the other floes. Assuming that the most negative δ18O values at the base of the snow cover represent accumulation during particularly cold conditions, the ice might have started to form and snow accumulation to begin in mid-winter rather than early winter.
There are few continental isotope data with which to compare the marine-isotope data. Reference MorganMorgan (1982) has summarized the geographic distribution of mean δ18O values in the surface layers of the Antarctic ice sheet but the data are primarily for inland, high-elevation areas, and there are no data for the coastal regions of Marie Byrd and Ellsworth Lands. For a comparison of marine δ18O values, there are the late-winter Weddell Sea data of Reference Lange, Hubberten, Macno and HondohLange and Hubberten (1992): mean δ18O values for the snow cover at 23 individual sites range from -22.5 to -10.5%0 and the mean of all the sites is -16.5 ±3.3%0 (these values are interpolated from Figure 3 (Reference Lange, Hubberten, Macno and HondohLange and Huhberten, 1992)). These data arc not dissimilar to those found in the present study, particularly in the Ross/ Amundsen Seas snow cover (mean δ18O,-17.1%0). However, the mean δ18O value of the Bellingshausen Sea snow cover is 3%0 more positive than the mean δ18O value of the Weddell Sea and the Ross/Amundsen Seas snow cover.
Since the isotopic composition of precipitation is temperature-dependent (Reference Dansgaard, Johnson, Clausen and GundestrupDansgaard and others, 1973),the more positive δ18O values of the snow cover on the Bellingshausen Sea floes compared to the Ross/Amundsen Seas and Weddell Sea floes (Fig. 3) might be due to a climatic difference between the regions. A simple latitude effect, with more-negative δ18O values expected at more southerly, colder latitudes (Reference Dansgaard, Johnson, Clausen and GundestrupDansgaard and others, 1973),does not apply to the difference between the Bellingshausen and Weddell Seas samples. Although the Bellingshausen Sea sites were located between 70.55°and 71.56°S, the snow-cover δ18O values are more positive than those recovered from Weddell Sea floes located further north between about 63° and 70.3°S.
Seaward extrapolation of continental coastal mean annual temperatures suggests that the Ross/Amundsen Seas and Weddell Sea regions might be 5-l0°C cooler than the Bellingshausen Sea region (Reference Giovinetto, Waters and BentleyGiovinetto and others, 1990). With regard to the Weddell Sea, the Antarctic Peninsula is known to act as a climatic divide between the Bellingshausen and Weddell Seas regions, creating harrier winds and cooler temperatures along the eastern Weddell Sea side of the peninsula and warmer temperatures along the western Bellingshausen Sea side (Reference SchwerdtfegerSchwerdtfeger, 1984). The separation of the Weddell and Bellingshausen Seas by the Antarctic Peninsula also emphasizes the fact that the Weddell Sea is in the Atlantic Ocean sector of the Southern Ocean and the Bellingshausen Sea is in the Pacific Ocean sector. Consequently, it is possible that each region has a different moisture source. The same might apply to the Ross/Amundsen and Bellingshausen Seas regions.
There is some evidence that the Bellingshausen Sea region has a warmer climate than the Ross/Amundsen and the Weddell Seas regions. However, in view of the difference in the number of samples in the Ross/ Amundsen and Bellingshausen Seas data sets, the age difference of the snow cover from which the samples were recovered and the evidence for a windy depositional environment, a definitive statement on the climatic implications of the isotopic difference between the snow covers must wait for additional data to be obtained when "normal" sea-ice conditions prevail in each area. A possible moisture-source effect on the isotopic composition of precipitation on Antarctic sea ice requires more information on atmospheric circulation than is presently available.
5 Conclusion
The first data on the depth, density, load and isotopic composition of the snow cover on pack-ice floes at the end of summer in the eastern Ross, Amundsen and western Bellingshausen Seas have been presented. Although the data set is small, it indicates the potential value of information on the characteristics of the snow cover on sea ice. Snow densification to values of as much as 500 kg m-3 seems to occur in a short period of time, most probably due to strong winds. The isotopic data suggest that the Bellingshausen Sea region might have a slightly warmer climate than the Ross/Amundsen and the Weddell Seas regions. In both the Ross/Amundsen Seas and the Bellingshausen Sea regions, a heavy load of deep, dense snow can accumulate on the perennial ice, causing flooding. Although there is strong evidence that snow deposition and metamorphism occurs in a windy environment, isotopic minima and maxima in the snow cover might represent annual units and a means to estimate the age of the snow cover and the ice.
Acknowledgements
This study was funded by the Ocean and Climate Systems Program, Division of Polar Programs, U.S. National Science Foundation grant No. DPP-891.5863. We thank Captain C. G. Boyer (commanding officer), the officers and crew of USCGC Polar Sea for welcoming us aboard and contributing to the success of our work. There is too little space to name them all but we are particularly grateful to the many U.S. Coast Guard personnel who worked hard in their free time assisting us on the ice. The stable-isotope laboratory at the University of Calgary is funded by the Natural Science and Engineering Research Council of Canada. M. Sturm kindly read an early version of the manuscript and, together with C. Benson, provided advice on the interpretation of the data.