


Introduction
COVID-19 disease containment measures have included school closures, physical distancing, and home isolation. There has been widespread concern about the mental health impacts of such measures for children and adolescents (Holmes et al., Reference Holmes, O'Connor, Perry, Tracey, Wessely, Arseneault and Bullmore2020), with research showing twice as many youth experiencing clinical levels of anxiety and depressive symptoms compared to before the pandemic (Racine et al., Reference Racine, McArthur, Cooke, Eirich, Zhu and Madigan2021). Given the importance of social connection and peer interaction during childhood and adolescence, loneliness is considered a particular risk factor for mental health outcomes, particularly depression (Loades et al., Reference Loades, Chatburn, Higson-Sweeney, Reynolds, Shafran, Brigden and Crawley2020). For example, during the pandemic, higher levels of loneliness shown to be associated with increased psychological distress — including items related to depression — in adolescents (Cooper et al., Reference Cooper, Hards, Moltrecht, Reynolds, Shum, McElroy and Loades2021; Li et al., Reference Li, Beames, Newby, Maston, Christensen and Werner-Seidler2021). Given the potential importance of the relationship between loneliness and depressive symptoms, particularly in the context of COVID-19, it is important to quantify the relationship between loneliness and depressive symptoms to inform policymakers about the potential implications of school closures and social distancing restrictions on youth mental health outcomes during COVID-19 and in future crises.
Loneliness is a negative feeling resulting from a perceived discrepancy between the desired and actual quality of an individual's social relationships (Masi, Chen, Hawkley, & Cacioppo, Reference Masi, Chen, Hawkley and Cacioppo2011). Many young people feel lonely — specifically, up to 80% of youth under the age of 18, as well as 15–30% of the general population report levels of loneliness that significantly interfere with daily functioning (Hawkley & Cacioppo, Reference Hawkley and Cacioppo2010). While social isolation is not necessarily the same as loneliness (Wang, Mann, Lloyd-Evans, Ma, & Johnson, Reference Wang, Mann, Lloyd-Evans, Ma and Johnson2018), early research during the pandemic has found that loneliness in children and adolescents has worsened during the pandemic, with approximately 9 out of 10 adolescents reporting feeling lonely or isolated during lockdown (YoungMinds, 2020). Loneliness is associated with a range of adverse mental health outcomes and is considered a particular risk factor for depression compared to other forms of psychopathology, due to the importance of social connection for depressive outcomes (Cacioppo, Hughes, Waite, Hawkley, & Thisted, Reference Cacioppo, Hughes, Waite, Hawkley and Thisted2006; Loades et al., Reference Loades, Chatburn, Higson-Sweeney, Reynolds, Shafran, Brigden and Crawley2020). For example, conceptualisations of depression emphasise the importance of lack of social connection and dysfunctional interpersonal relationships in the aetiology and maintenance of depression, and highlight the importance of social support as a protective factor (Koenig, Isaacs, & Schwartz, Reference Koenig, Isaacs and Schwartz1994).
Accordingly, extant empirical research has examined the cross-sectional and longitudinal association between loneliness and depression. Meta-analytic research has shown a moderate and positive cross-sectional relationship between loneliness and depressive symptoms in adults (k = 88, r = 0.50) (Erzen & Çikrikci, Reference Erzen and Çikrikci2018). There have been fewer studies in child and adolescent samples, however a literature review indicated that correlations between loneliness and depressive symptoms in adolescents range from 0.40 to 0.60 (Heinrich & Gullone, Reference Heinrich and Gullone2006). A recent rapid systematic review conducted by Loades et al. (Reference Loades, Chatburn, Higson-Sweeney, Reynolds, Shafran, Brigden and Crawley2020) (k = 83) concluded that loneliness in children and adolescents is associated with depression at the time loneliness was measured and between 0.25 and 9 years later. However, to date, there has been no study that quantifies the overall degree of association between loneliness and depressive symptoms in both child and adolescent samples.
Determining whether the relationship between loneliness and depressive symptoms differs across age groups and gender during this developmental period may also be important. Loneliness may be a particular risk factor for depression in adolescents, compared to children or adults, due to the increased sensitivity to peer acceptance and rejection, paired with an increased need to feel a sense of belonging during this developmental period (Orben, Tomova, & Blakemore, Reference Orben, Tomova and Blakemore2020). There may also be gender differences in the association between loneliness and depressive symptoms. Some studies have shown that this association is stronger in females than males, perhaps due to females’ experience of more negative consequences of loneliness than males (Liu, Zhang, Yang, & Yu, Reference Liu, Zhang, Yang and Yu2019). However, another study found that loneliness is higher in depressed adolescent males, compared to adolescent females (Koenig, Isaacs, & Schwartz, Reference Koenig, Isaacs and Schwartz1994).
The aim of this paper is to extend the systematic review by Loades et al. (Reference Loades, Chatburn, Higson-Sweeney, Reynolds, Shafran, Brigden and Crawley2020) and quantify the overall cross-sectional relationship between loneliness and depressive symptoms in children and adolescents in a meta-analysis. We also aimed to explore whether age and gender moderated the relationship between loneliness and depressive symptoms.
Method
Search Strategy
A literature search was conducted using MEDLINE (Ovid), PsychINFO (Ovid), and Web of Science (Clarivate). The search was limited to journals published in English between 1900 and 2020 (October) inclusive, with human participants aged 0–18 years old. The search strategy was adapted to meet the truncation and Boolean operations in each database. The search terms were as follows: ‘loneliness’ or ‘isolation’ AND ‘depression’ AND ‘children’ or ‘adolescents (see Supplementary Appendix 1 for search strategy). The review was pre-registered in Prospero (CRD42020216814).
Inclusion and Exclusion Criteria
To be included in the meta-analysis, the following criteria were used:
(i) full-text available in English;
(ii) an original peer-reviewed empirical study;
(iii) involve child or adolescent population (mean age <19 years);
(iv) include a standardised and validated measure of depressive symptoms;
(v) include a standardised and validated measure of loneliness; and
(vi) report on a cross-sectional association between loneliness and depressive symptoms. For longitudinal or prospective studies, we included the baseline association only.
Exclusion criteria were:
(i) reviews, case reports, unpublished studies, or qualitative studies;
(ii) not reporting on the correlation between loneliness and depressive symptoms; and
(iii) reporting on a sample with atypical development or trauma as they may have propensities to loneliness that could influence depression.
Study Selection
Following removal of duplicates, the titles and abstracts of studies retrieved were screened and assessed against the inclusion criteria by the first author (CD), and a sample of 20% of the papers was assessed by the second author (GS). Due to very limited discrepancy between the ratters, the first author completed the screening process at this stage. Full-text revision of the articles for their relevance to the research question was conducted independently by both raters. Disagreements were resolved by consensus. The software program Covidence was used to aid with the study selection process and to record decisions.
Data Coding
The correlation coefficient between loneliness and depressive symptoms and sample size was extracted from each manuscript. To investigate moderators, additional variables were coded: age, gender (% female), measures of loneliness, and measures of depressive symptoms. All manuscripts were coded by the first author (CD).
Risk of Bias Within Studies
Studies were assessed for methodological quality and risk of bias using a modified version of the Effective Public Health Practice Project (EPHPP) Quality Assessment Tool for Quantitative Studies (Armijo-Olivo, Stiles, Hagen, Biondo, & Cummings, Reference Armijo-Olivo, Stiles, Hagen, Biondo and Cummings2012). The EPHPP has demonstrated strong inter-rater reliability when measuring the methodological quality of health research (Armijo-Olivo et al., Reference Armijo-Olivo, Stiles, Hagen, Biondo and Cummings2012). The EPHPP was modified to exclude the assessment of items relating to intervention studies, which reduced the original 22-item index to 12-items. Items in each domain were rated and a total quality score for each study was given. Studies were assigned an overall quality rating of weak (1.00), moderate (2.00), or strong (3.00). There was a mixed quality of studies that were evaluated using the EPHPP, ranging from weak (n = 4), to moderate (n = 14), and strong (n = 17). The results of the EPHPP are shown in Supplementary Appendix A.
Risk of Bias Across Studies
Publication bias was assessed by visually inspecting the presence of asymmetry in funnel plots. Formal evaluation of asymmetry was assessed using Egger's Test of the Intercept (Egger, Smith, Schneider, & Minder, Reference Egger, Smith, Schneider and Minder1997). Duval and Tweedie's Trim and Fill method was conducted to yield an adjusted effect size that takes account of the publication bias observed in the funnel plot (Duval & Tweedie, Reference Duval and Tweedie2000). A fail-safe N analysis was conducted to address the potential ‘file drawer’ problem (Rosenthal, Reference Rosenthal1979), such that only significant results are published.
Meta-Analytic Procedures
A Pearson product moment correlation coefficient (r) was calculated to measure the overall effect size of the association between loneliness and depressive symptoms. Correlation coefficients from each study were converted to the Fisher's z metric for analysis and converted back to correlations for intepretation (Hedges & Olkin, Reference Hedges and Olkin1985). As heterogeneity was expected across studies, a random-effects model was used. The correlation coefficient was interpreted based on the following recommendations: r = .1, r = .3, and r ≥ 0.5 are small, medium, and large effects, respectively (Cohen, 1982).
Heterogeneity was assessed using the I 2 statistic, with 0% indicating no observed heterogeneity, 25% as low, 50% as moderate, and 75% or above as high heterogeneity. We calculated the Q statistic (a test for homogeneity of effect sizes across studies) but only reported whether it was significant. Outliers were defined as studies in which the 95% confidence interval was outside the 95% confidence interval of the pooled studies (on both sides). Subgroup and meta-regression analyses were conducted with outliers removed.
To assess the moderating effect of age and gender, individual random-effects meta-regression analyses were conducted. Age was entered as the mean age in each study and gender was entered as the percentage of females in each study. A mixed-effect subgroup analysis comparing children (12 years and below) and adolescents (13 years and above) was also conducted as we expected age to be bimodally distributed across studies. The subgroup analyses used mixed-effect models. A random-effects model was used to pool studies within subgroups, and significant differences between the two subgroups were tested using a fixed-effects model. Analyses were conducted using Comprehensive Meta-analysis (Borenstein, Hedges, Higgins, & Rothstein, Reference Borenstein, Hedges, Higgins and Rothstein2009).
Results
Study Selection
Three thousand six hundred and sixty-four (3664) unique articles were identified following the removal of duplicates (n = 2071). The titles and abstracts of the articles were reviewed by the first author (CD) and a sample of 20% of the articles (n = 733) were reviewed by the second author (GS), with minimal discrepancy. Three thousand five hundred and fifty (3550) were excluded on the basis of the title and abstract search. One hundred and fourteen (114) articles were full text reviewed by both authors (CD; GS), and a further 79 articles were excluded as they did not meet full inclusion criteria. Disagreements were resolved through consensus. The final number of articles for inclusion in the meta-analysis was 35 with 44 studies. The process of study selection is shown in Figure 1.
PRISMA diagram of selection of studies.

Study Characteristics
The characteristics of the included studies are shown in Table 1 (refer to Supplementary Appendix C for a reference list of the included studies). Studies were published between 1983 and 2021 and reported on results for 27,214 children and adolescents between the ages of 9 and 18 (weighted mean age = 13.63). Roughly half of the participants were female (n = 13,877; 51%). The UCLA Loneliness Scale (Russell, Reference Russell1996) (n = 11) was the most frequently used measure for loneliness and the Children's Depression Inventory (Kovacs, Reference Kovacs2003) (n = 13) was the most frequently used measure for depressive symptoms.
Details of the Studies Includes in the Meta-Analysis
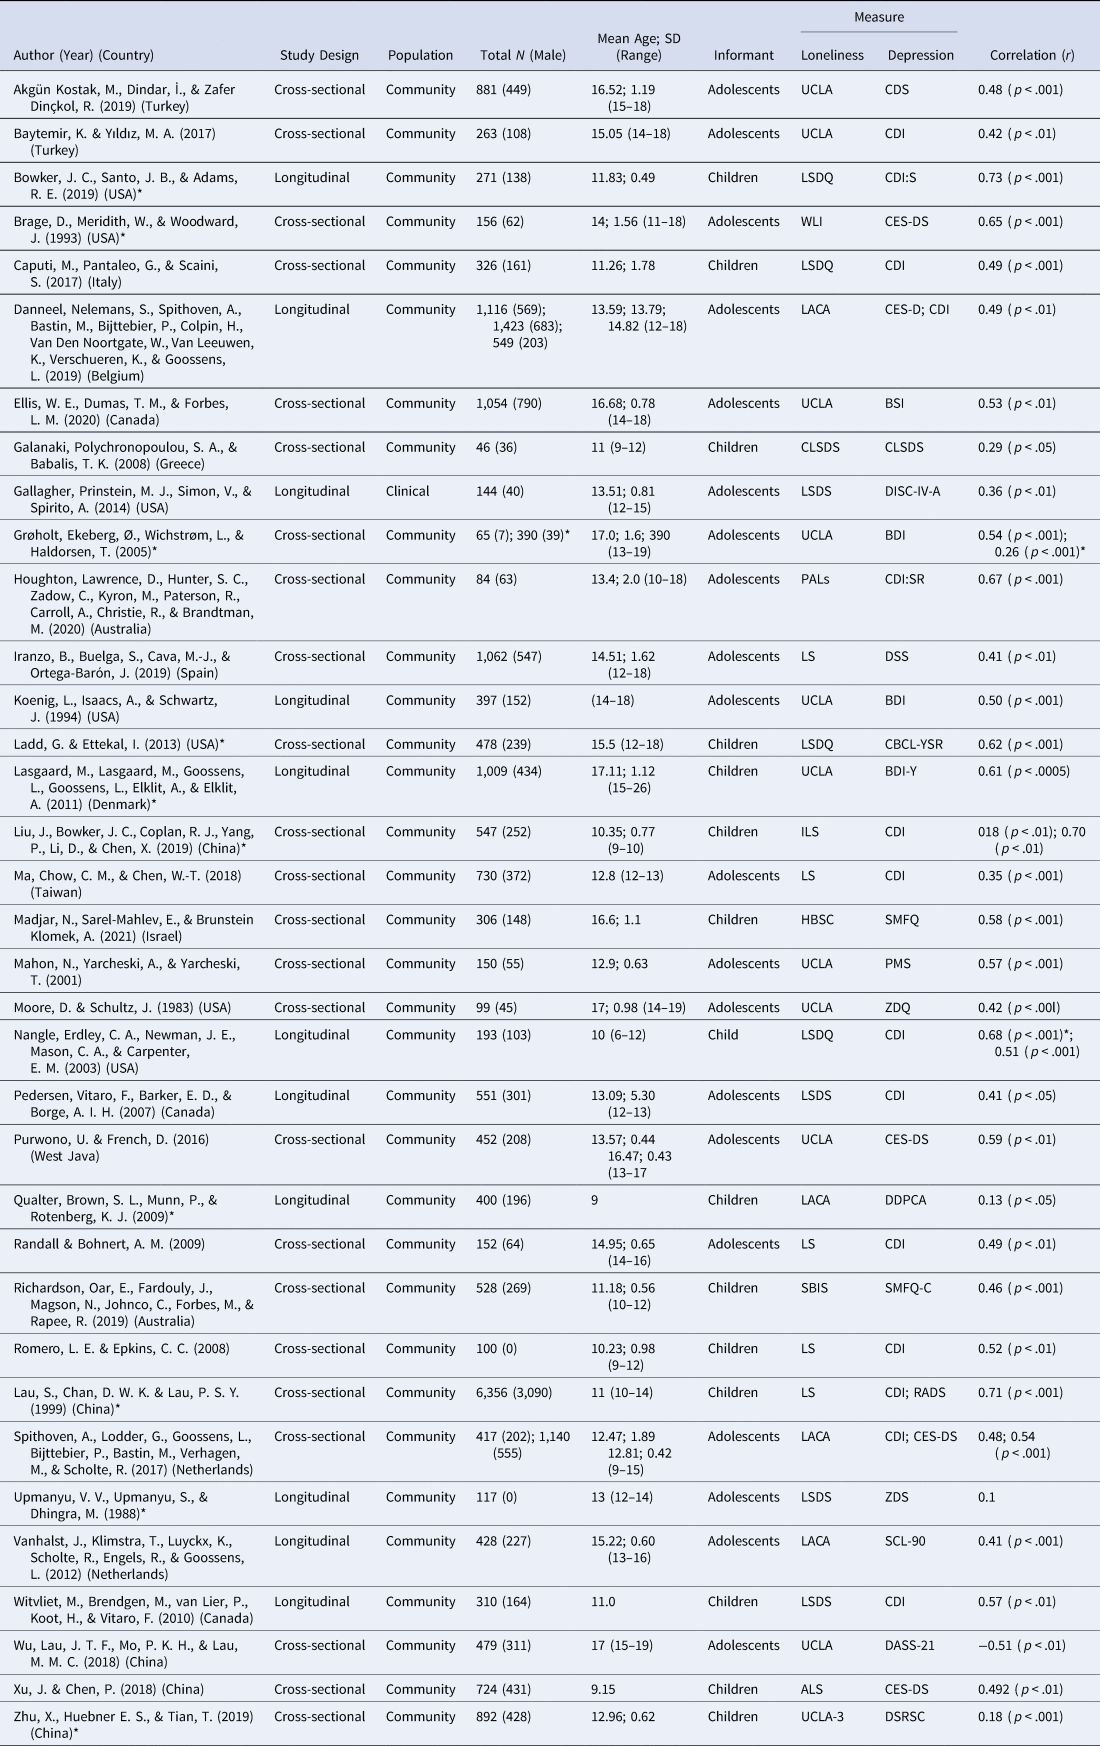
* denotes studies identified as outliers.
Synthesis of Results
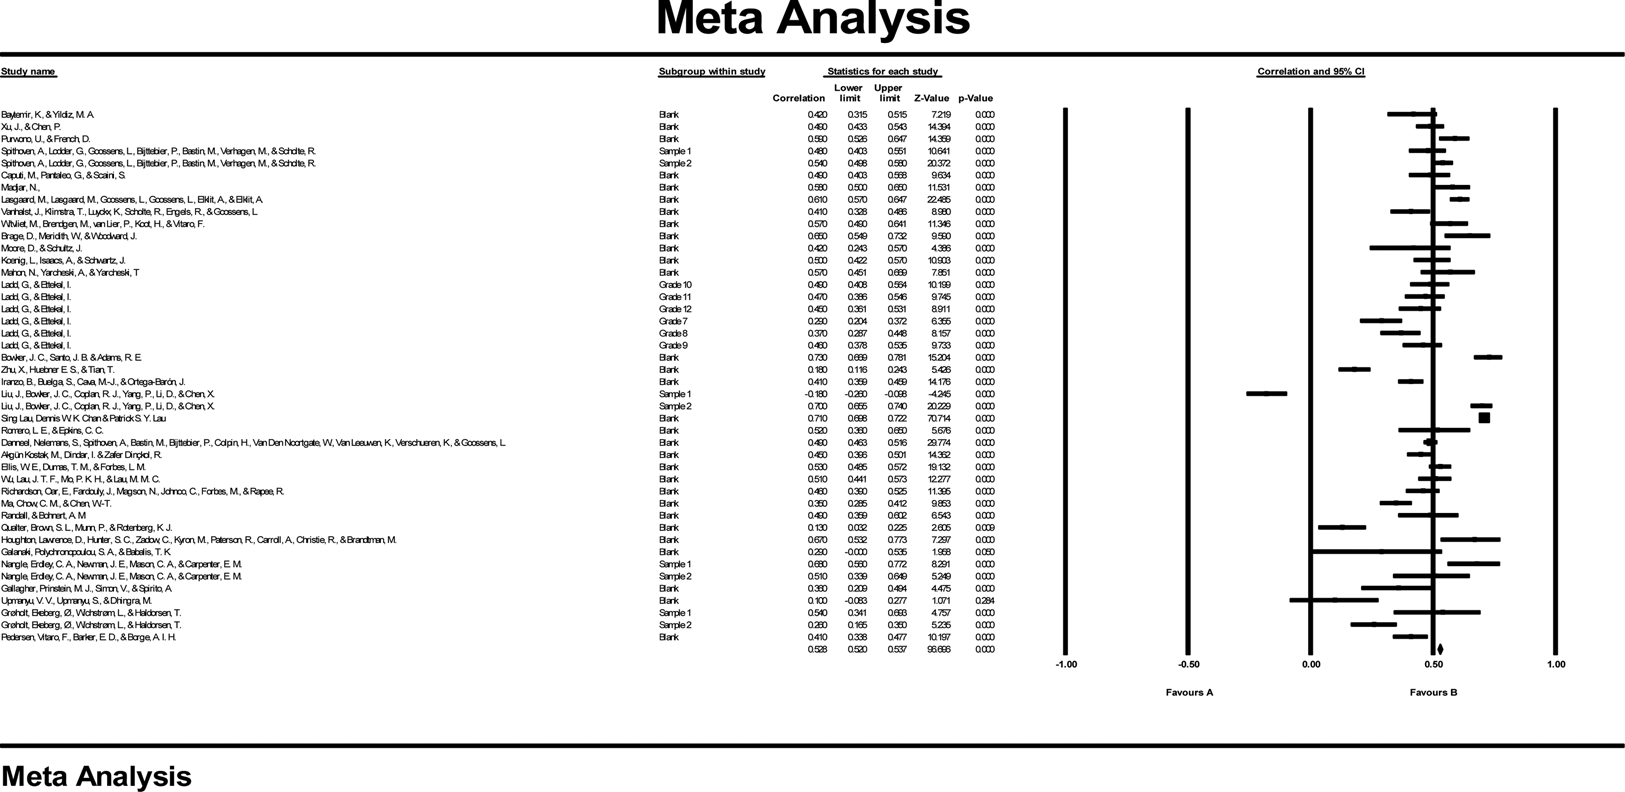
The overall meta-analysis resulted in an estimate of the association between loneliness and depressive symptoms in children and adolescents of r = .47, 95% CI 0.41–0.53, p < .001. There was a large amount of variability within effect sizes, Q = 1491.54, p < .001, I 2 = 97.12%. The effect sizes per study are shown in the forest plot in Figure 2.
Forest plot of studies included in the meta-analysis. Values r represent the effect size within each study.
Risk of Bias Across Studies
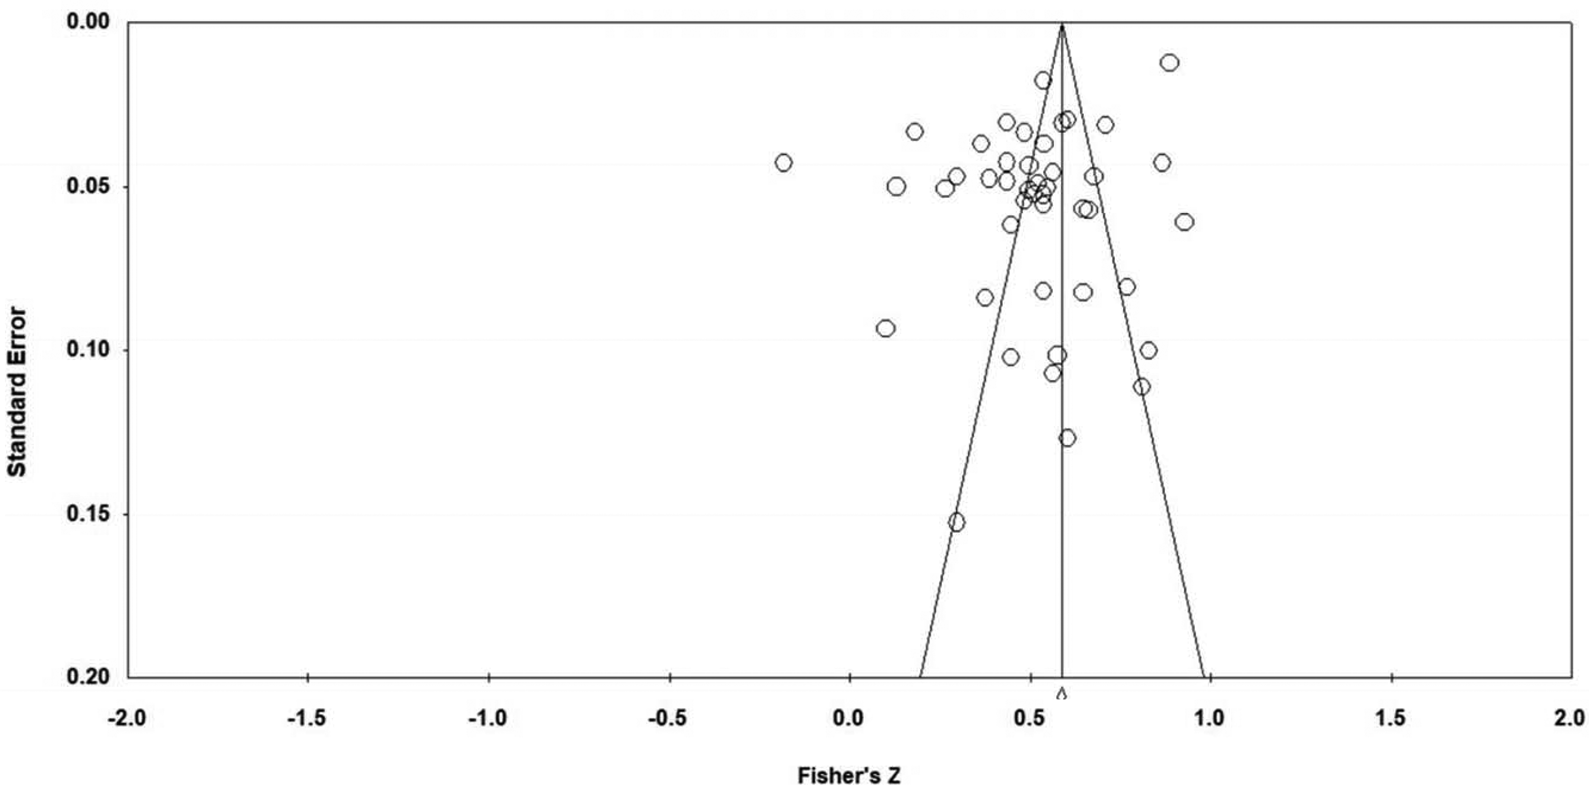
A visual inspection of the funnel plot indicated some evidence of publication bias (Figure 3). Egger's regression intercept was −4.80, p = .002 indicating that there was some evidence of potential publication bias across studies included in the analysis. After adjusting for publication bias using Duval's Trim and Fill procedure, the estimate of the mean effect size was 0.32–0.47. The fail-safe N was 4,628, meaning that the effects are not likely to be reversed by non-significant findings of unpublished studies.
Funnel plot for publication bias: Fisher’s z to standard error.
Moderator Analyses
Child's age was not a significant moderator affecting differences in the relationship between loneliness and depressive symptoms (β = 0.0004; SE = 0.007, 95% CI [−0.01, 0.01], p = 0.957). When age was examined as a categorical moderator in a subgroup analysis, 13 samples were categorised as child studies (≤12 years), and 31 studies or adolescents (≥13 years). The effect size for each subgroup was r = 0.50, [95% CI 0.47, 0.53], p = <.001 for children and r = .48, [95% CI 0.46, 0.49], p = <.001 for adolescents, indicating a medium effect for the relationship between loneliness and depressive symptoms in both age groups. There were no significant differences between the two subgroups (Q = 1.78, p = .18).
Gender was not a significant and positive moderator affecting differences in the relationship between loneliness and depressive symptoms (β = −0.008; SE = 0.118, 95% CI [−0.24, 0.22], p = 0.945).
Sensitivity Analyses
Sensitivity analyses were conducted in relation to outcomes which excluded outliers. Outliers were defined as studies with 95% confidence intervals that did not overlap with the 95% confidence interval for the overall correlation coefficient. This led to 12 studies being excluded (refer to Table 1 for excluded studies). The overall effect size remained largely unchanged (r = .48, 95% CI [0.46, 0.50], p < .001), with a lower level of heterogeneity (I 2 = 67.86%).
Discussion
The aim of the review was to synthesise the relationship between loneliness and depressive symptoms in children and adolescents in a meta-analysis. The results indicated that loneliness and depressive symptoms are positively associated with a medium effect size (r = .48). This means that higher levels of loneliness are linked with higher levels of depressive symptoms. In the context of COVID-19 social isolation and restriction measures, this means more children and adolescents may be at risk of experiencing higher levels of depressive symptoms because they feel lonelier. However, given the cross-sectional nature of this research, the direction of association cannot be inferred.
These findings support meta-analytic findings in adults (Erzen & Çikrikci, Reference Erzen and Çikrikci2018) which have shown a similar effect size (r = 0.50) and are in line with estimates provided in literature reviews in children and adolescents (Heinrich & Gullone, Reference Heinrich and Gullone2006; Loades et al., Reference Loades, Chatburn, Higson-Sweeney, Reynolds, Shafran, Brigden and Crawley2020). Our results extend previous research by quantifying the magnitude of the relationship between loneliness and depressive symptoms in children and adolescents.
The relationship between loneliness and depressive symptoms did not differ according to age or gender. In regard to age, this result is somewhat surprising given that adolescents may be particularly vulnerable to loneliness and depression, given the importance of social connection during this developmental period (Orben et al., Reference Orben, Tomova and Blakemore2020). This result may be due to low power, as there were a smaller number of studies in child samples relative to adolescent samples, or it may reflect that loneliness and depression are equally associated across development in youth. The lack of gender effect also suggests that interventions for loneliness do not need to be tailored for different genders, as previous research has suggested (Liu et al., Reference Liu, Zhang, Yang and Yu2019).
Clinical Implications
Our results, in conjunction with the high levels of reported loneliness in youth during the COVID-19 pandemic (YoungMinds, 2020), suggest that policymakers need to minimise child and adolescent loneliness where possible. This may help to mitigate the impact of school closures and other social distancing measures on child and adolescent mental health, and depression in particular. Interventions that seek to reduce loneliness in children and adolescents — for example, by increasing social support in times of social isolation — may help to reduce children and adolescent's experience of loneliness and in turn, reduce depressive symptoms, such as feelings of hopelessness or low mood (Wang et al., Reference Wang, Mann, Lloyd-Evans, Ma and Johnson2018). Helping young people to feel part of a group, maintaining the quality as well as quantity of relationships and experiencing positive social rewards may also help. In a COVID-19 context, this means that social relationships may need to be enhanced through using digital methods of communication. Research has found that adolescents who used technology for the purposes of social connection had lower levels of loneliness and a greater sense of wellbeing (Li et al., 2021). This indicates that the use of technology to maintain social connection when in-person interactions are not possible, should be encouraged.
Limitations
The findings of this study must be viewed in light of its limitations. We only examined the cross-sectional association between loneliness and depressive symptoms. Thus, although these consistently showed a positive correlation between loneliness and depressive symptoms, no conclusions about causality can be drawn. It is possible that depressive symptoms increase loneliness and that loneliness exacerbates depressive symptoms, thus the relationship is likely to be bidirectional (Nuyen et al., Reference Nuyen, Tuithof, de Graaf, van Dorsselaer, Kleinjan and Have2019). Given the limited number of longitudinal studies available in youth samples, it was not possible to determine the direction of effect between loneliness and depressive symptoms over time. A greater number of studies investigating prospective associations between loneliness and depressive symptoms in children and adolescents are needed to determine the direction of causality of the relationship between loneliness and depressive symptoms.
We included both terms ‘loneliness’ and ‘isolation’ in the search strategy, as they are often used interchangeably. However, we acknowledge that the lack of clear distinction is problematic, particularly as social isolation experienced as a result of peer rejection may be different to social isolation that occurs as a result of a pandemic. Nevertheless, given the lack of research on loneliness in youth in general (Pitman, Mann, & Johnson, Reference Pitman, Mann and Johnson2018), we chose to include all studies which measured loneliness or isolation in this review.
The quality of the studies included in this review were varied. Study design was identified as the biggest shortcoming for majority of the studies included in the quality review and there was a high degree of selection bias, with a number of studies reporting a convenivence sample or a self-referred sample. This limits conclusions that can be drawn to a representative or broader sample. While all the studies used a validated measure of loneliness and depressive symptoms, future studies could include diagnostic and more objective measures of depression (such as the Diagnostic Interview Schedule for Children Fourth Edition – DISC-IV [Shaffer, Fisher, Lucas, Dulcan, & Schwab-Stone, Reference Shaffer, Fisher, Lucas, Dulcan and Schwab-Stone2000]) to reduce reporter bias. Use of measures that assess the duration or intensity of loneliness, such as the Loneliness and Aloneness Scale for Children and Adolescents (LACA) (Marcoen, Goossens, & Caes, Reference Marcoen, Goossens and Caes1987) may provide further insight in to the relationship between loneliness and depressive symptoms. Finally, it is important to note that the data were marked by significant heterogeneity, which did not change much with the removal of outliers. If the heterogeneity were to change significantly with the removal of outliers, the results could have been interpreted with increased confidence.
Conclusion
This is the first study — to our knowledge — to synthesise the relationship between loneliness and depressive symptoms in children and adolescents in a meta-analytic review. Overall, the results of this review suggest a strong association between loneliness and depressive symptoms in children and adolescents. These results are consistent with adult reviews and a systematic review by Loades et al. (Reference Loades, Chatburn, Higson-Sweeney, Reynolds, Shafran, Brigden and Crawley2020), which suggested that there is an association between loneliness and depressive symptoms in children and adolescents. Given the strength of the association between loneliness and depression, strategies to reduce the incidence of loneliness in youth samples is paramount, particularly in light of the current disease containment measures for COVID-19 around the world.
Supplementary material
The supplementary material for this article can be found at https://doi.org/10.1017/bec.2022.13.
Author contributions
All authors contributed to the study's conception and design. Data collection and analysis were performed by CD and study selection was performed by both authors. The first draft of the paper was written by CD and GS revised the manuscript. All authors read and approved the final manuscript.
Declaration of interest
The authors have no conflict of interest to declare.


 Open access