

The gut microbiota is a virtual ‘organ’ referring collectively to all of the micro-organisms residing in the gastrointestinal tract. In recent times, much research has indicated the essentiality of this microbial biomass for human health from birth to old age owing to the role it plays in host immunity and metabolic health( Reference Claesson, Jeffery and Conde 1 , Reference O’Toole 2 ). Furthermore, disruption to the composition and function of the gut microbiota has been associated with a wide range of physiological and even mental health disorders( Reference Seira Oriach, Robertson and Stanton 3 , Reference Cryan and Dinan 4 ). Owing to the ‘flexible’ nature of the gut microbiota, it is highly susceptible to change by a number of environmental stressors to the host including infection, medication use, stress, birth mode and diet( Reference Bäckhed, Roswall and Peng 5 ). Alongside increasing incidence of Caesarian section births, antibiotic use and stress, the Western lifestyle is uniquely characterised by a diet rich in fat and refined sugar and low in fibre. The metabolic outcomes of this modernised diet have been well characterised; however, the rates of obesity, diabetes and chronic metabolic disease have continued to increase( Reference Cordain, Eaton and Sebastian 6 ). Expanding knowledge of the role of the gut microbiota in such disorders indicates the potential for this microbial ‘organ’ as a new mechanism and target by which nutritional interventions may prevent onset of diet-related metabolic disorders. Therefore, it is essential to understand how nutritional deficiencies affect gut microbiota composition and conversely how nutritional interventions can restore normal composition and function.
Despite much evidence pointing to the role of excess sugar and SFA intake in the epidemic of diet-induced metabolic disease, one of the most drastic changes in the Western diet over the past five decades has been the intake of n-3 PUFA relative to n-6 PUFA( Reference Simopoulos 7 ). It is widely acknowledged that humans evolved on an n-6:n-3 PUFA ratio of about 1–2:1; however, the modern diet, which is high in n-6 PUFA-rich vegetable oils, has contributed to a modern n-6:n-3 PUFA ratio of 20–30:1( Reference Simopoulos 7 ). This drastic increase in n-6 PUFA, combined with declining n-3 PUFA intake, which are found in oily fish, nuts and seeds, has contributed to relative n-3 deficiency, which has likely spanned two to three generations since the 1970s( Reference Simopoulos 8 ). n-3 Deficiency has hence been associated with progression of a number of chronic metabolic disorders. Maternal nutritional deficiencies have also been proven to increase offspring disease risk in later life, as shown by the Barker hypothesis( Reference Barker, Gluckman and Godfrey 9 ). Hence, it is possible that trans-generational nutritional inadequacies, such as n-3 PUFA deficiency, across two to three generations may further compound the effects on later life disease risk.
Growing evidence suggests a potential role of a disrupted microbiota in metabolic disorders induced by n-3 PUFA deficiency. For example, high n-6 dietary intake induces gut microbiota dysbiosis resulting in increased intestinal permeability, metabolic dysfunction and adipose tissue inflammation, which is reversed by n-3 feeding( Reference Lam, Ha and Campbell 10 ). Similarly, using a germ-free model, Caesar et al.( Reference Caesar, Tremaroli and Kovatcheva-Datchary 11 ) have shown that a diet containing fish oil, rich in n-3 PUFA, reverses adipose tissue inflammation through toll-like receptor signalling, which is mediated through comprehensive changes in gut microbiota composition. Similarly, it has been suggested that the beneficial effects of n-3 fatty acids on metabolic endotoxaemia are mediated through increased production of the lipopolysaccharide (LPS)-scavenging antimicrobial peptide intestinal alkaline phosphatase (IAP)( Reference Kaliannan, Wang and Li 12 ).
Indeed, the effects of n-3 and n-6 PUFA on the adult microbiota composition have recently been investigated in animals( Reference Patterson, O’ Doherty and Murphy 13 – Reference Andersen, Mølbak and Thymann 16 ). However, less data are available on the role of maternal and early-life n-3 deficiency on the development of microbiota from birth, which may reflect current human dietary trends( Reference Andersen, Mølbak and Michaelsen 17 ). Murine models are particularly suitable for assessing dietary interactions with the microbiota trans-generationally and throughout the lifespan. Gibson et al.( Reference Gibson, Gill and Brown 18 ) reported that maternal fish oil supplementation in pharmacological excess (18 % energy) led to the overgrowth of opportunistic pathogens such as Bilophila wadsworthia and Enterococcus faecium in offspring microbiota and alteration of macrophage homoeostasis. Similarly, it has been shown that parental n-3 PUFA intake altered offspring gut microbiota composition in mice and dampened the immune response( Reference Myles, Fontecilla and Janelsins 19 ). These studies, however, provided n-3 PUFA in pharmacologically excessive doses, which may not reflect normal dietary intake, and in addition did not examine the progression of microbiota development into adulthood.
Furthermore, the subsequent effect of dietary lipids on the metabolic phenotype remains underreported. Recently, Daniel et al.( Reference Daniel, Moghaddas Gholami and Berry 20 ) provided a comprehensive report of the caecal metabolomic alterations induced by a high-fat diet in mice, which provided novel insights into the functional metabolic changes induced by high-fat-diet-induced microbiota. The effect of n-3 PUFA on liver metabolite production has also previously been outlined( Reference Depner, Traber and Bobe 21 ). However, there is a lack of data available of the effects of n-3 PUFA on the caecal metabolic phenotype and the functional effects this may have on host physiology.
We have previously shown that varying n-3 availability differentially alters the composition of the faecal microbiota at both adolescence and adulthood( Reference Robertson, Seira Oriach and Murphy 14 ). However, it has been shown that differences may exist in the microbiota composition of different intestinal regions( Reference Marteau, Pochart and Doré 22 ). The caecum, as the region of the intestine with the densest population of bacteria, acts as the primary site of microbial–nutrient interaction. This interaction may mediate production of bacterial metabolites such as SCFA, which can regulate various aspects of metabolic health. Hence, the effects of varying n-3 availability on the caecal microbiota may differ from those of the faecal microbiota and may additionally influence the caecal metabolome.
Here, we hypothesised that varying n-3 availability throughout life may differentially alter the caecal microbiota and that n-3 deficiency may induce a state of compositional and functional disturbance. This study aimed to address both: (i) the lack of knowledge about biologically relevant intakes of n-3 on the microbiota and (ii) the trans-generational effect of n-3 deficiency on the caecal microbiota, reflective of the long-term deficiency of n-3 in the Western diet. Hence, we investigated the impact of n-3 deficiency and n-3 supplementation in mice on the caecal microbiota composition of mothers and their male offspring. In addition, we sought to examine changes to the caecal metabolic phenotype induced by varying n-3 availability.
Methods
Animals
Male and female C57BL/6J mice, eight-week old, were purchased from Harlan Laboratories, UK. Animals were kept in the University College Cork animal facility on a 12 h light–12 h dark cycle at 20±1°C. After acclimatisation, female and male breeding pairs were combined and assigned to one of three diets: – control (CON), n-3-supplemented (n3+) diet and n-3-deficient (n3−) diet – from gestational day 0. Male offspring (n 10/group) were randomised within treatment groups, group-housed (3–4/cage) and weaned on to the same diets as their mothers.
Food intake and body weight were recorded weekly during 12 weeks of dietary treatment. Fat and lean body mass were measured using a Minispec mq bench-top NMR spectrometer (Bruker Instruments) before euthanasia. The welfare and general health status of the animals were continuously monitored throughout the experimental period. No adverse events were observed. All experiments were conducted in accordance with the Directive 2010/63/EU and were approved by the Animal Experimentation Ethics Committee of University College Cork no. 2012/036.
Diets
Dietary intervention was provided to mothers during gestation and lactation and continued in the offspring through until adulthood. The three dietary treatments were matched for macronutrient content and differed only in fatty acid profile, as follows: (1) control standard chow (CON); (2) n-3 PUFA-supplemented diet (n3+)−1 g EPA+DHA/100 g diet; (3) n-3 PUFA-deficient diet (n3−) (Table 1, online Supplementary Tables S1 and S2). The n3+ diet was prepared with microalgal oil rich in EPA/DHA (life’sOmegaTM45; DSM). Diets were formulated and supplied by Harlan Laboratories, Inc., which were matched for macronutrient content and differed only in fatty acid profile. The detailed compositions and fatty acid profiles of the three diets have previously been reported( Reference Robertson, Seira Oriach and Murphy 14 ). In order to limit the oxidation of long-chain fatty acids, diets were kept at 4°C in the dark and in vaccum packaging. Once placed in animal cages, the diets were changed twice per week.
Macronutrient profiles of intervention diets
CON, control; n3+, n-3 PUFA-supplemented diet; n3−, n-3 PUFA-deficient diet; LA, linoleic acid (C18 : 2n-6); ALA, α-linolenic acid (C18 : 3n-3); EPA, C20 : 5n-3; DHA, C22 : 6n-3; n-6, n-6 PUFA; n-3, n-3 PUFA.
Experimental design
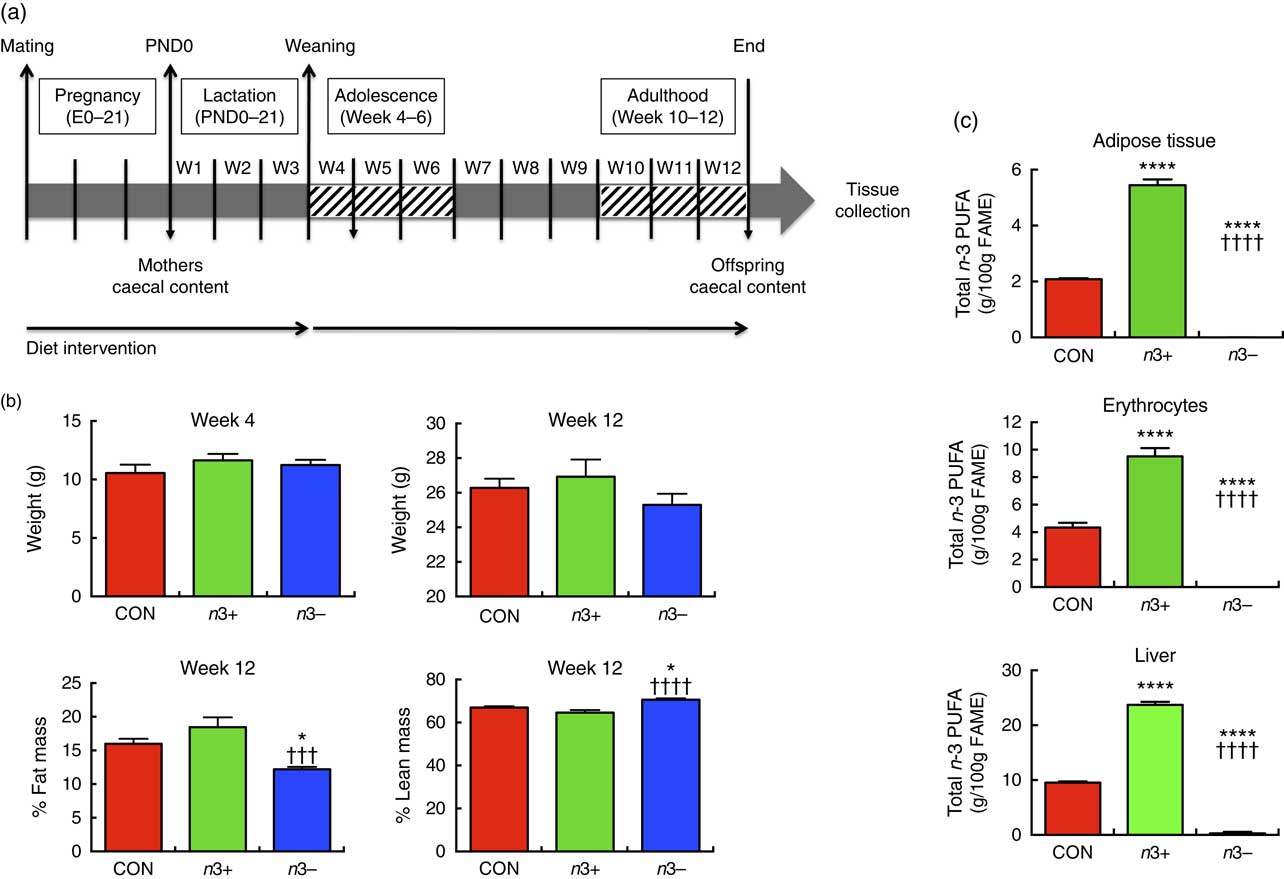
Fig. 1(a) illustrates the experimental design. In brief, C57BL/6J females were assigned one of the three diets at gestational day 0. Upon confirmation of pregnancy, males were removed and the pregnant dams were continued on the dietary treatment for 6 weeks, during pregnancy and lactation. Male offspring were subsequently weaned onto the same diets as their mothers until adulthood (12 weeks). Mothers were euthanised at weaning (week 4). At 12 weeks old, offspring were euthanised by decapitation and samples collected.
n-3 deficiency and supplementation alter body composition and tissue fatty acid status. (a) The study design involved a dietary intervention with a control (CON), n-3-supplemented (n3+) or n-3-deficient (n3−) diet in mothers throughout pregnancy. The interventions were continued in the offspring for 12 weeks. (b) There were no significant differences in offspring body weight at weaning (week 4) or adulthood (week 12). However, at week 12, n3− caused significantly decreased fat mass and increased lean mass compared with CON and n3+. (c) At week 12, n-3 supplementation induced significantly greater total n-3 PUFA in epididymal adipose tissue, erythrocytes and liver, whereas n-3 PUFA were almost entirely absent in these tissues in n3− animals. Values are means (n 9–10/group), with their standard errors represented by vertical bars. FAME, fatty acid methyl esters. CON v. n3+ or n3− group: * P<0·05, ****P<0·0001; n3+ v. n3−: ††† P<0·001, †††† P<0·0001.
Tissue harvesting
Mice were euthanised by decapitation and trunk blood was collected in potassium EDTA tubes. Plasma was prepared by collecting supernatant following centrifugation of blood samples for 15 min at 8000 g . The erythrocyte pellet was washed three times with a 5-fold volume of PBS and centrifuged at 1000 g for 5 min before fatty acid analysis. Dissected tissues were weighed, snap-frozen in liquid N2 and stored at −80°C until further analysis.
Tissue fatty acid analysis
Fatty acid analysis was performed on epididymal fat, erythrocyte and liver tissues. In brief, lipid extraction was performed using chloroform–methanol (2:1, v/v) as previously described( Reference Folch, Lees and Sloane Stanley 23 ). Methylation of lipid extracts was performed using 10 ml of 0·5 N NaOH in methanol and heating at 90°C for 10 min, followed by the addition of 10 ml of 14 % BF3 in methanol for 10 min at 90°C( Reference Park and Goins 24 ). Fatty acid methyl esters (FAME) were resuspended in hexane and analysed by GC.
Separation of FAME was performed via GC (Agilent 7890B; Agilent Technologies) with flame ionisation detection (100 m×0·25 mm internal diameter, 0·25 μm film thickness, Chrompack CP Sil 88 column, Chrompack; JVA Analytical) and He as a carrier gas. The GC column oven cycle was programmed as follows: 80°C for 8 min followed by an increase by 8·5°C/min to a final column temperature of 200°C. Sample injection (0·5 μl) was automated (CTC Autosampler, Model 80) on an Aglient Multimode Inlet on-column temperature programmable injector (Agilent). Peak integration was performed using the Agilent OpenLAB Chemstation software (version A.01.06.111). Identification of individual FAME was done by comparison of retention times with pure FAME standards (Nu-Chek-Prep). Results are expressed as g/100 g total FAME.
DNA extraction and 16S sequencing
Total bacterial metagenomic DNA was extracted from the caecal content of mothers following euthanasia after 6 weeks of dietary treatment. DNA from the caecal content of offspring was also extracted after euthanasia after 12 weeks. DNA was extracted using a commercial DNA extraction kit (QIAmp DNA Stool Mini Kit; Qiagen). An initial repeated bead beating step was performed before DNA extraction in order to increase final DNA yield. DNA quantification was performed using a Nanodrop 1000 (Thermo Scientific) and stored at −20°C until analysis.
16S MiSeq sequencing was performed using the 16S metagenomic sequencing library protocol (Illumina), as previously described( Reference Fouhy, Deane and Rea 25 ). The V3–V4 variable region of the 16S rRNA gene was amplified from the DNA using two PCR reactions and clean-up steps. The initial PCR reaction used primers specific for amplification of the V3–V4 region of the 16S rRNA gene (forward primer 5' TCGTCGGCAGCGTCAGATGTGTATAAGAGACAGCCTACGGGNGGCWGCAG; reverse primer 5' GTCTCGTGGG CTCGGAGATGTGTATAAGAGACAGGACTACHVGGGTATCTAATCC). Confirmation of PCR product size was performed by visualisation on an agarose gel via gel electrophoresis. PCR product clean-up and purification was achieved using AMPure XP magnetic beads (Labplan). The second PCR reaction was subsequently performed to index and barcode individual samples in order for samples to be pooled and sequenced together in one flow cell. Samples were demultiplexed for analysis after sequencing. A unique indexing primer pair was used for each sample (Illumina Nextera XT indexing primers; Illumina). PCR product size was again confirmed via gel electrophoresis, and samples were cleaned and purified a second time using AMPure. Samples were quantified using the Qubit broad-range DNA quantification assay kit (Bio-Sciences). Following quantification, samples were normalised to an equal concentration (4 nm) and pooled together for analysis. The sample pool was denatured and diluted to 4 pm and MiSeq sequencing was performed according to Illumina guidelines by the Eurofins sequencing facility (Eurofins) using a 2×300 cycle V3 kit.
Bioinformatics
A total of 300 bp paired-end reads were assembled using FLASH with minimum and maximum overlap parameters of 20 and 120 bp, respectively( Reference Magoč and Salzberg 26 ). Further processing of paired-end reads, including quality filtering based on a quality score of >25 and removal of mismatched barcodes and sequences below length thresholds, was performed using the QIIME suite of tools, version 1.9.0( Reference Caporaso, Kuczynski and Stombaugh 27 ). Denoising, chimera detection and operational taxonomic unit (OTU) grouping were performed in QIIME using USEARCH version 7( Reference Edgar 28 ). Taxonomic ranks were assigned by alignment of OTU using PyNAST to the SILVA SSURef database release 116( Reference Quast, Pruesse and Yilmaz 29 ). Alpha and beta diversities were generated in QIIME and calculated based on weighted and unweighted Unifrac distance matrices( Reference Lozupone, Lladser and Knights 30 ). Principal coordinate analysis plots were visualised using EMPeror version 0.9.3-dev( Reference Vázquez-Baeza, Pirrung and Gonzalez 31 ).
Metabolomics
Metabolomics analysis of caecal water was performed as follows. Caecal water was prepared by the addition of sterile water to caecal content (approximately 100 mg) followed by vortex mixing. Bacteria and other solids were pelleted by centrifugation at 16 000 g for 30 min. The supernatant was removed, placed in a clean tube and centrifuged again at 16 000 g for 30 min. The supernatant was centrifuged once more before being filtered through a VectaSpin microcentrifuge 0·2-µm filter (Sigma-Aldrich) at 10 000 g. The resulting filtrate was stored at –20°C until analysis.
Derivatisation of caecal water samples for GC-MS was carried out using methylchloroformate, as previously described( Reference Smart, Aggio and Van Houtte 32 ) with slight modifications. Analysis was performed using GC (Agilent 6890N) coupled with a quadropole detector (Agilent 5975B). The system was controlled by ChemStation (Agilent Technologies). Data were converted to netCDF format using ChemStation, before being imported into Matlab R2014b (Mathworks Inc.), and processed using PARAFAC2 to obtain relative concentrations for each peak. PARAFAC2 was applied using the PARADISe software. Samples were analysed in randomised order.
SCFA analysis
SCFA were analysed by GC. A volume of 1 ml of sterile Milli-Q water was added to a known amount of mice caecal content (approximately 100 mg). The sample was vortexed thoroughly and allowed to stand at room temperature for 10 min. Bacteria and other solids were pelleted by centrifugation at 10 000 g for 5 min, and the supernatant was filtered into clean tubes. An internal standard (10 mm 2-ethylbutyric acid (Sigma)) was subsequently added to each sample in duplicate. Samples were vortex-mixed and centrifuged again at 10 000 g for 3 min and then transferred to clean vials. SCFA were analysed by GC (Varian 3800 flame ionization) fitted with a ZB-FFAP column (30 m×0·32 mm×0·25; Phenomenex). He was used as a carrier gas at a flow rate of 1·3 ml/min. The GC oven cycle was programmed at 100°C for 0·5 min and increased by 8°C/min to 180°C, held for 1 min, and then increased by 20°C/min to a final temperature of 200°C and held for 5 min. The detector and injector were programmed at 250 and 240°C, respectively. Peak integration was performed using the Varian Star Chromatography Workstation Software version 6.0. A standard curve of SCFA standard solutions was used for comparison of retention times and for identification and quantification of individual sample peaks.
Statistical analysis
Parametric statistical analyses were performed using GraphPad Prism version 6 (La Jolla). Non-parametric analyses of microbiota and metabolomic data were performed using SPSS version 20. Results are presented as means with their standard errors. Significant differences between treatment groups were assessed by one-way ANOVA followed by Tukey’s multiple comparison post hoc test. Significant differences between non-parametric data were assessed by Kruskal–Wallis tests followed by Mann–Whitney test to determine differences between individual groups. False discovery rate analysis was performed using Benjamani–Hochberg correction testing following which significance was calculated at q<0·05. Owing to the multidimensional nature of omics data, sample size was calculated based on % fat mass. Using one-way ANOVA, two-sided significance level was set at α=0·05. Effect size was estimated based on previous studies of maternal n-3 supplementation and offspring fat mass( Reference Muhlhausler, Miljkovic and Fong 33 ). Using thirty animals, statistical power was calculated at β>0·9.
Results
Body composition and dietary intake
There were no significant differences in body weights or in dietary intakes at weaning or euthanasia between groups (Fig. 1(b)). At week 12, % total fat mass was significantly lower (P=0·0004) and % lean body mass significantly higher (P=0·001) in the n3− group compared with both other groups.
Fatty acid analysis
Fatty acid analysis revealed distinct differences in tissue fatty acid profiles between groups. In epididymal fat, liver and erythrocytes, n-6 ARA content was significantly higher in n3− animals and significantly lower in n3+ animals compared with CON (online Supplementary Table S3). n-3 PUFA were not detected in the epididymal fat or erythrocytes of n3− offspring and contributed a minor proportion of fatty acids in the liver (0·3 %) (Fig. 1(c)). Contrastingly, in epididymal fat, liver and erythrocytes, DHA accounted for 2·2, 17·3 and 6·5 % of fatty acids in n3+ mice, respectively, whereas in CON mice DHA accounted for 0·1, 8 and 3·8 % of total fatty acids in these tissues. Linoleic acid was significantly lower in n3− epididymal tissue compared with both other groups.
Composition of caecal microbiota
16s sequencing of the caecal microbiota resulted in a total of 3·1 million sequenced reads, corresponding to an average of 68 534 reads/sample. To remove any bias from variation in sample read number, samples were rarefied to 25 000 reads.
Whole microbiome significance testing using ADONIS with Bray–Curtis similarity index showed no significant differences in beta diversity between offspring treatment groups (P=0·0925, Fig. 2(a)). Phylogenetic alpha diversities revealed some differences between treatment groups (Fig. 2(b)). Caecal microbiota alpha diversity was significantly lower in both n3+ and n3− mothers compared with the CON group, as assessed by the Shannon index; however, the n3− group also displayed significantly lower diversity compared with the n3+ group. No significant differences in alpha diversity were observed in any of the offspring.
Effects of n-3 PUFA on caecal gut microbiota in mothers and adult offspring (a) Principle coordinate analysis of microbiota composition. (b) n-3-deficient (n3−) alpha diversity of mothers microbiota was significantly lower than n-3-supplemented (n3+) and control (CON) as measured by the Shannon index. (c) Phylum level distribution of caecal microbiota. (d) A number of significant taxonomic differences were observed between groups based on n-3 status. Values are means (n 4–5/group for mothers and 9–10/group for offspring (week 12)), with their standard errors represented by vertical bars. a: ![]() , CON;
, CON; ![]() , n3+;
, n3+; ![]() , n3−; b:
, n3−; b: ![]() , CON;
, CON; ![]() , n3+;
, n3+; ![]() , n3−; c:
, n3−; c: ![]() , Firmicutes;
, Firmicutes; ![]() , Bacteroidetes;
, Bacteroidetes; ![]() , Proteobacteria;
, Proteobacteria; ![]() , Deferribacteres;
, Deferribacteres; ![]() , Tenericutes;
, Tenericutes; ![]() , Verrucomicrobia;
, Verrucomicrobia; ![]() , Actinobacteria;
, Actinobacteria; ![]() , Candidate_division_TM7;
, Candidate_division_TM7; ![]() , other; d:
, other; d: ![]() , CON;
, CON; ![]() , n3+;
, n3+; ![]() , n3−. CON v. n3− or n3+ group: * P<0·05, n3+ v. n3−: † P<0·05. Analysis by non-parametric Kruskal–Wallis test followed by multiple comparisons by Mann–Whitney. False discovery rate corrected using Benjamani–Hochberg testing q<0·05. * Significantly different from CON. † Significantly different from n3+.
, n3−. CON v. n3− or n3+ group: * P<0·05, n3+ v. n3−: † P<0·05. Analysis by non-parametric Kruskal–Wallis test followed by multiple comparisons by Mann–Whitney. False discovery rate corrected using Benjamani–Hochberg testing q<0·05. * Significantly different from CON. † Significantly different from n3+.
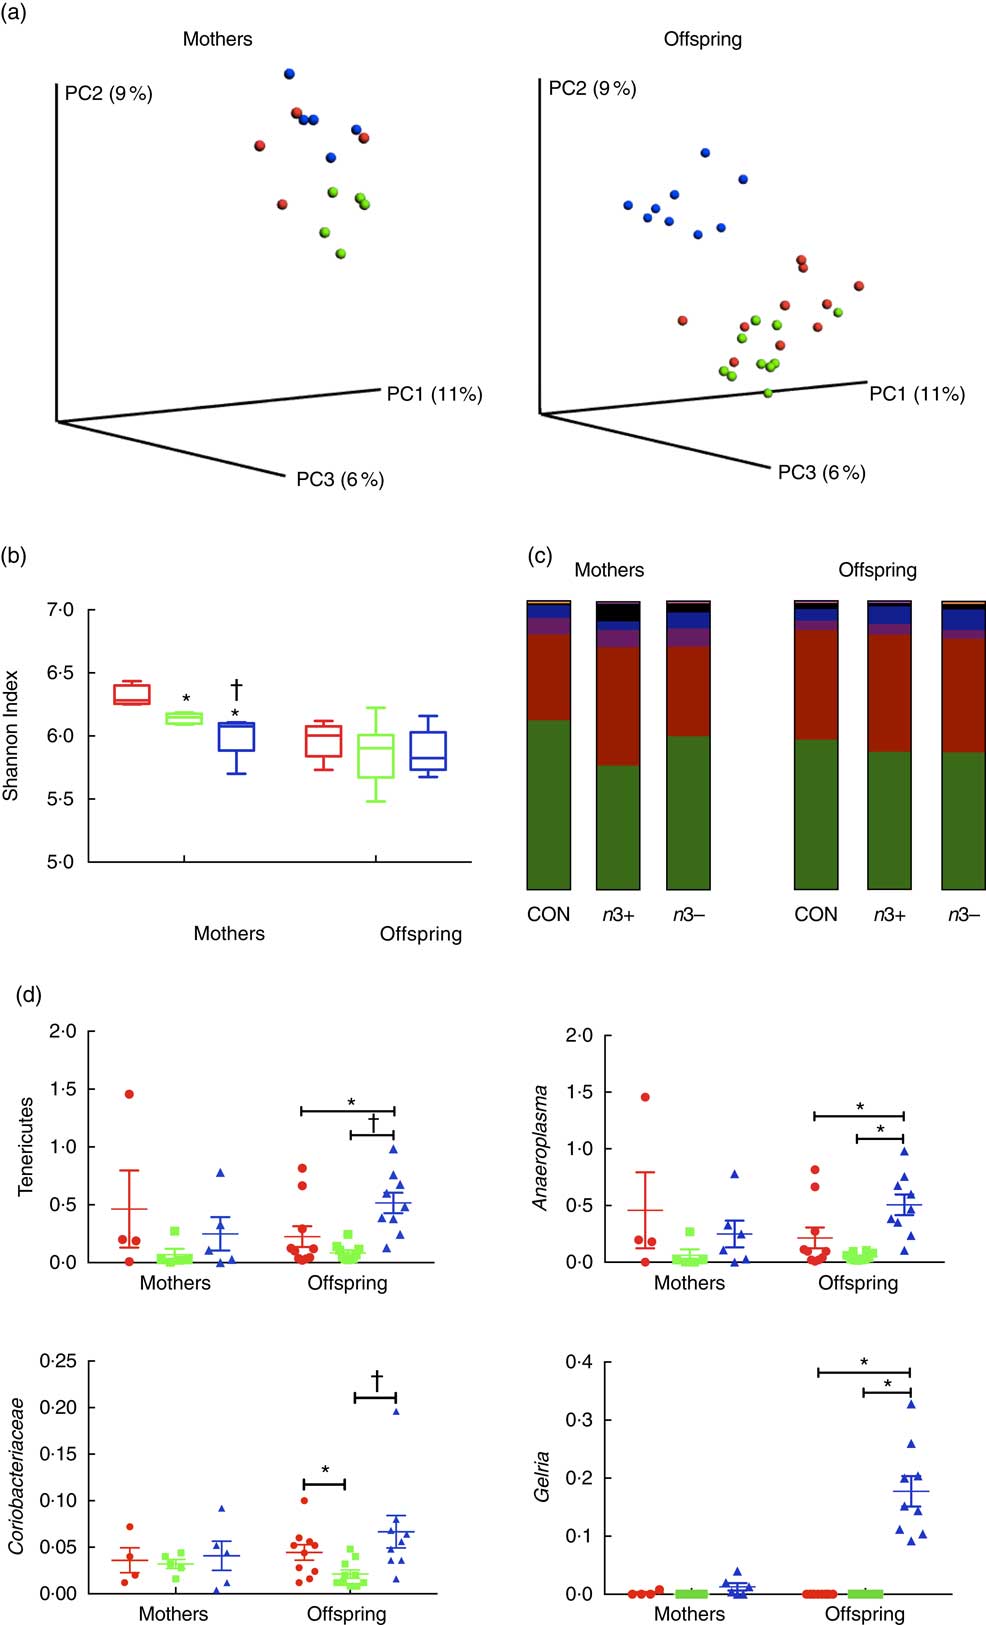
The overall phylum level distribution was similar between mothers and their offspring (Fig. 2(c)); however, relative abundance analysis of different taxa at phylum level revealed some differences between treatment groups. Firmicutes and Bacteroidetes were the most abundant phyla in each group in both mothers and offspring. n3+ Mothers displayed greater proportional abundance of Bacteroidetes (P=0·032) and a lower Firmicutes:Bacteroidetes ratio (P=0·046). These differences were not observed in offspring; however, n3− offspring displayed greater proportional abundance of Tenericutes (P=0·002) and an apparent bloom in Cyanobacteria (P=0·001), which was not present in other groups.
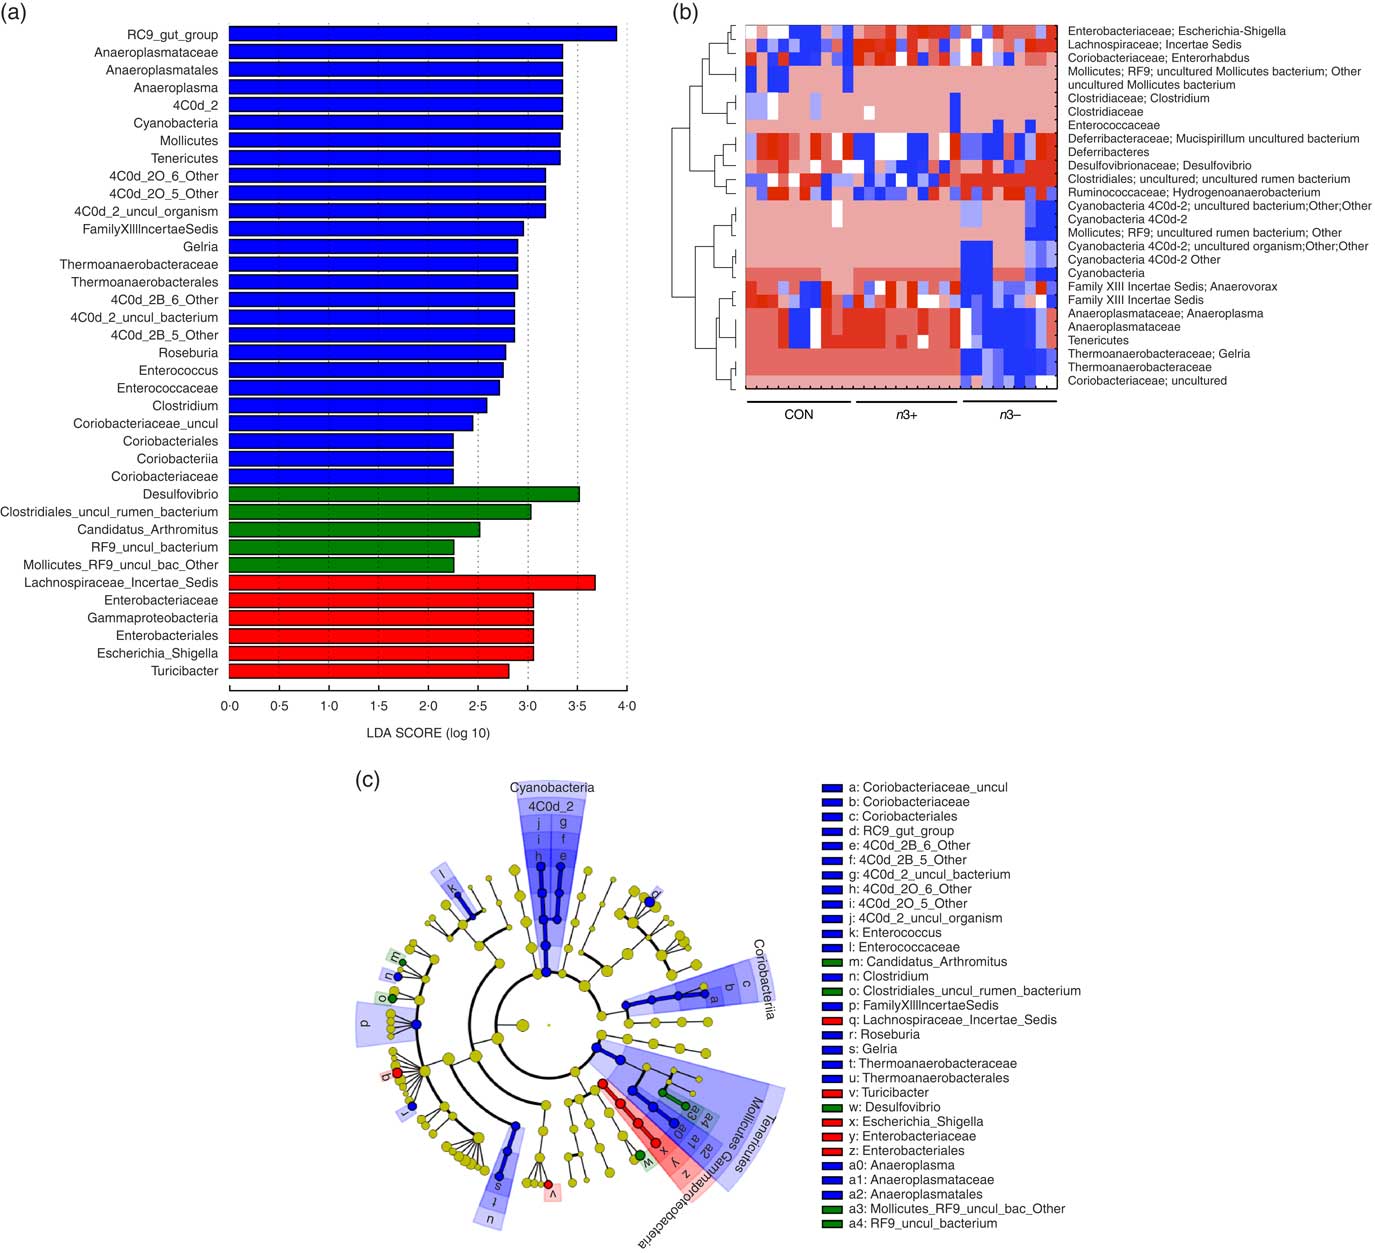
A number of significant differences were observed at family and genus level distributions, many of which showed similar differences between mothers and offspring (Fig. 2(d), Table S4 and S5). Relative abundance of Coriobacteria was significantly greater in n3− offspring (P=0·002). Similarly, Gelria and Anaeroplasma were significantly greater in n3− offspring compared with both other groups (P=0·002, P=0·014 respectively). Linear discriminate analysis (LDA) revealed similar results (Fig. 3(a)), which are also represented in a heatmap in Fig. 3(b). LDA effect size analysis (LEfSe) revealed that n3− animals were defined by greater abundance of taxa within the Cyanobacteria phyla and the Coriobacteriaceae, Thermoanaerobacteracaeae and Anaeroplasmataceae families (Fig. 3(c)).
Differential abundance of gut microbiota taxa following n-3 intervention. Linear discriminate analysis (LDA) scores of taxa significantly altered by n-3 status in offspring are shown in (a) (LDA scores >2 and significance of P<0·05 as determined by Wilcoxon’s signed-rank test). The most differentially abundant taxa in adulthood following dietary intervention are represented as a cladogram in (c) as generated from LDA effect size analysis data in (a). Heatmap distribution of differentially abundant taxa in adulthood offspring (b). n 9–10/group, offspring (week 12). Analysis by non-parametric Kruskal–Wallis test followed by multiple comparisons by Mann–Whitney test. False discovery rate corrected using Benjamani–Hochberg testing q<0·05. a and c: ![]() , CON;
, CON; ![]() , n3+;
, n3+; ![]() , n3−; b:
, n3−; b: ![]() , lower abundance;
, lower abundance; ![]() , higher abundance.
, higher abundance.
Composition of caecal metabolome
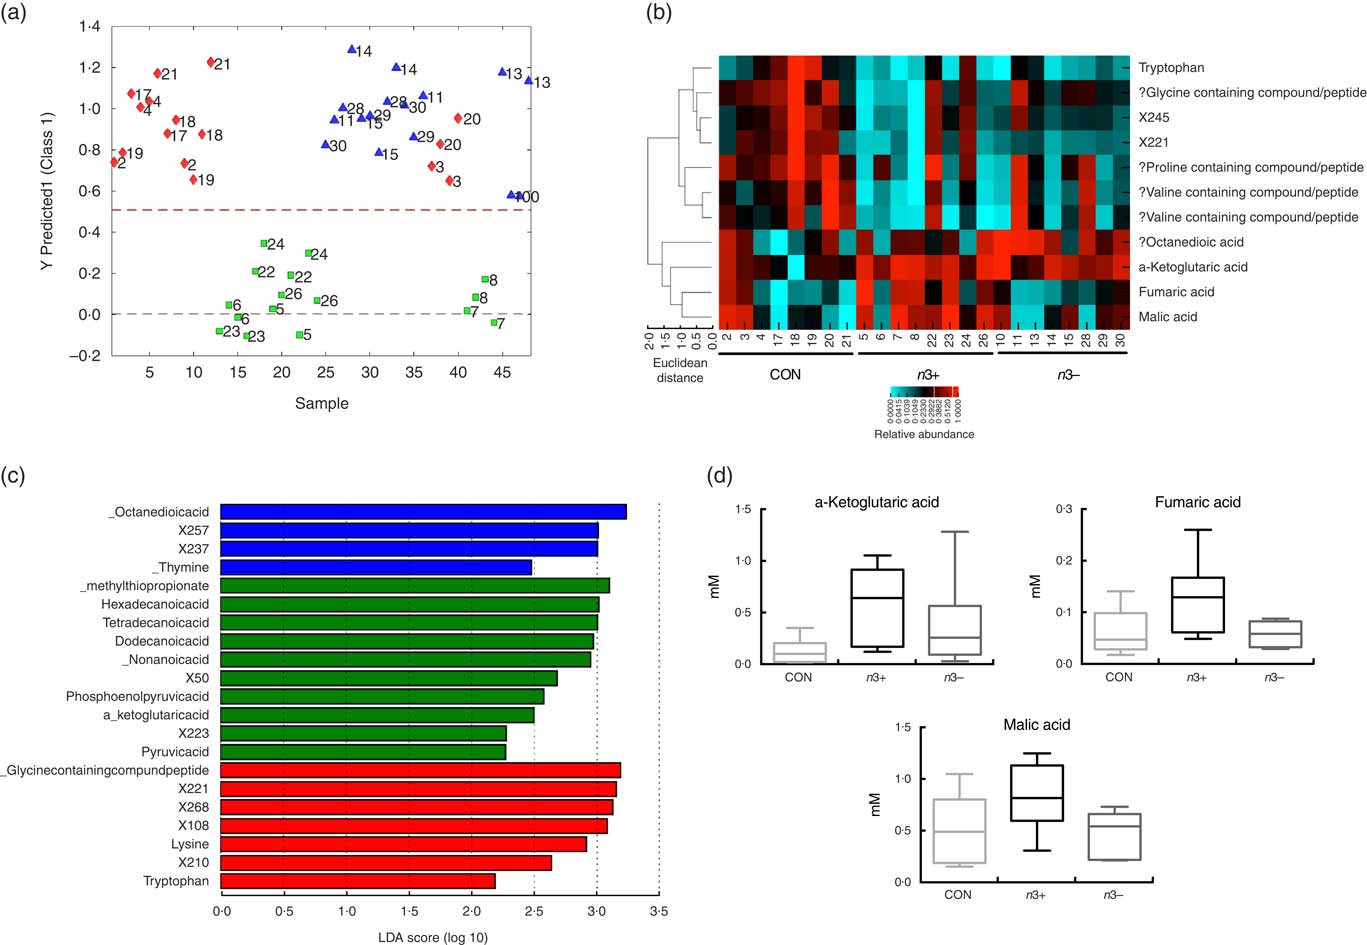
Supervised modelling using principle least squares discriminant analysis (PLS-DA) of the caecal metabolome revealed separation of the n3+ group from both n3− and CON (Fig. 4(a)). The metabolites contributing most strongly to this separation are plotted in a heatmap in Fig. 3(b). LEfSe analysis showed that the observed differences in the n3+ animals were driven by greater abundance of fatty acids and metabolites involved in energy metabolism (Fig. 4(c)). Further analysis of the metabolites that contributed to the differences between groups using non-parametric Kruskal–Wallis testing observed that metabolites involved in energy metabolism, notably α-ketoglutaric acid (P=0·014), fumaric acid (P=0·031) and malic acid (P=0·013), were elevated in caecal water of n3+ animals (Fig. 4(d)). However, following false discovery rate correction testing by Benjamani–Hochberg analysis, these differences were no longer significant. Full metabolomics data are available in the online Supplementary Data Document S2.
n-3 PUFA-induced changes to the caecal metabolome. Partial least squares discrimination analysis revealed differences in the caecal metabolomic profile between groups that were driven by changes in n3+ (a). Heatmap distribution shows the relative abundance of metabolites contributing most strongly to differences between groups (b). Linear discriminate analysis (LDA) scores of taxa significantly altered by n-3 status in offspring are shown in (c) from data generated using LDA effect size analysis analysis (LDA scores >2 and significance of P<0·05 as determined by Wilcoxon’s signed-rank test). The metabolites contributing most strongly to the separation were those involved in energy metabolism (d). n 8/group, offspring (week 12). a: ![]() , CON;
, CON; ![]() , n3+;
, n3+; ![]() , n3−;
, n3−; ![]() , Discrim Y 1; c:
, Discrim Y 1; c: ![]() , CON;
, CON; ![]() , n3+;
, n3+; ![]() , n3−. ‘?’ Signifies compounds that were identified using a database based on retention times rather than standards. Analysis by non-parametric Kruskal–Wallis test followed by multiple comparisons by Mann–Whitney test.
, n3−. ‘?’ Signifies compounds that were identified using a database based on retention times rather than standards. Analysis by non-parametric Kruskal–Wallis test followed by multiple comparisons by Mann–Whitney test.
Caecal SCFA production
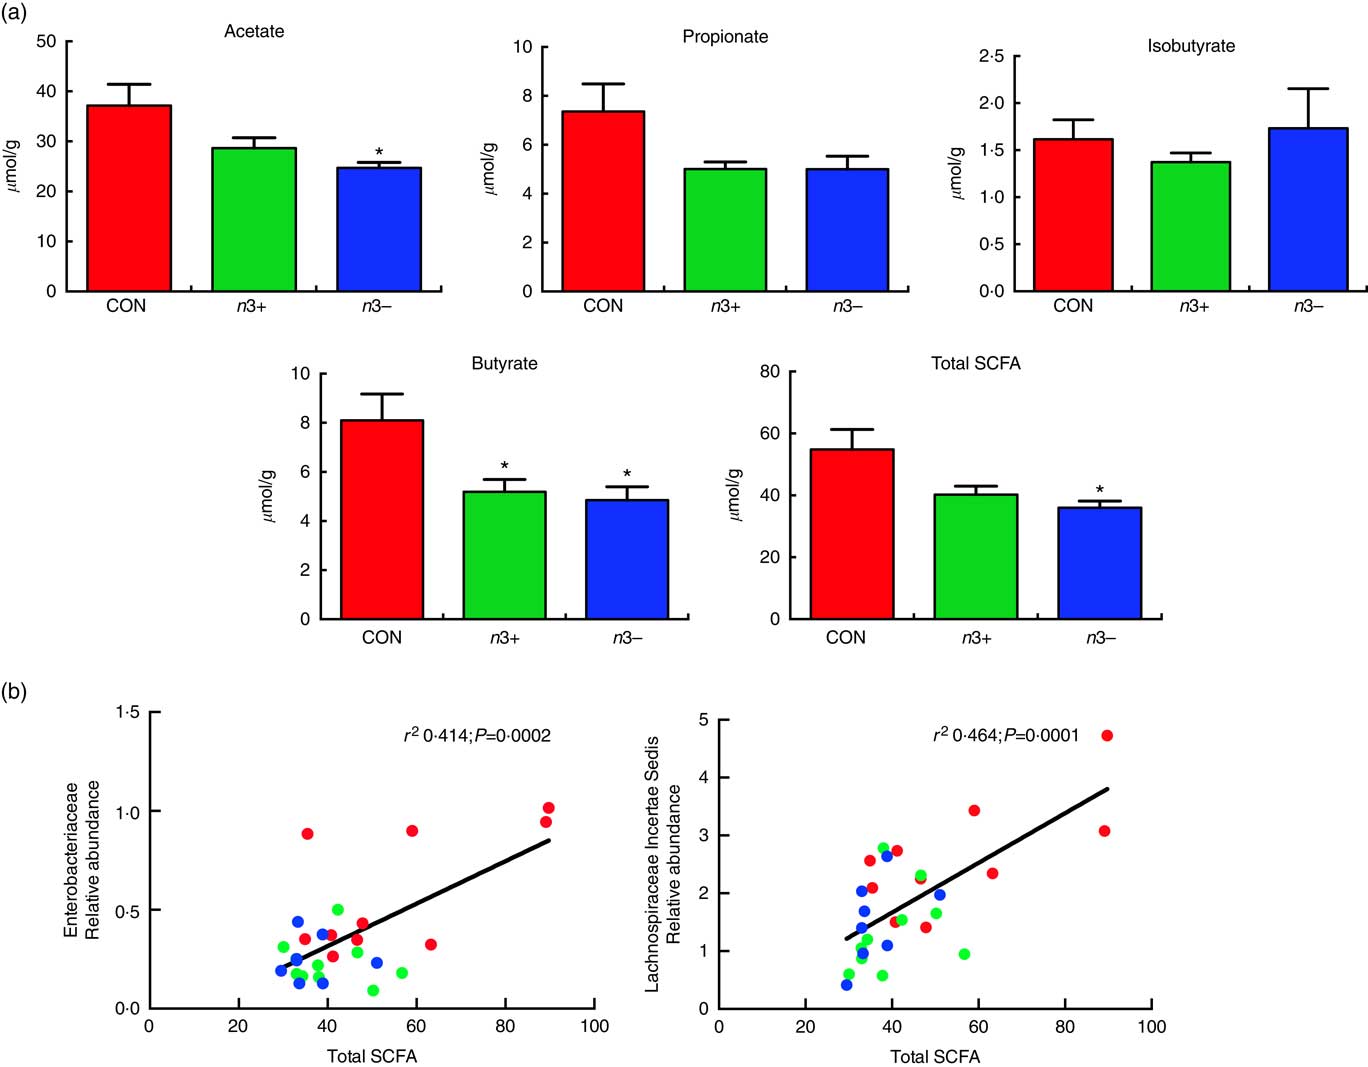
Caecal SCFA production was significantly altered by diet, as displayed in Fig 5. Overall, the n3− group displayed significantly reduced production of total SCFA compared with CON (P=0·013) (Fig. 5(a)), which was driven by significant reductions in acetate (P=0·016) and butyrate (P=0·009) production. However, the n3+ group also demonstrated a significant reduction in butyrate production compared with CON. There were no significant differences observed between groups for propionate or isobutyrate. These differences in SCFA production correlated with microbial taxa, whereby total SCFA positively correlated with both Enterobacteriaceae (r 2 0·414; P=0·0002) and lachnospiraceae incertae sedis (r 2 0·464; P=0·0001) abundance (Fig. 5(b)).
Caecal SCFA production. n3− displayed significantly reduced caecal acetate butyrate and total SCFA production. n3+ also displayed significantly reduced butyrate production (a). Caecal SCFA abundance positively correlated with specific microbial taxa (b). Values are means (n 9–10/group, offspring (week 12)), with their standard errors represented by vertical bars. * P<0·05 v. CON.
Discussion
Nutritional deficiencies as seen in the Western diet may contribute to modern chronic disease epidemics. The mechanisms behind this interaction between undernutrition and metabolic disease are slowly being elucidated, and the relative deficiency of n-3 PUFA in the Western diet may play a role in this pathogenic interaction. With growing evidence of the importance of the gut microbiome in human physiology and emerging knowledge of nutrient–microbiota interactions, it is plausible that a disturbed microbiome mediates the effect of nutrient deficiency on host metabolic dysfunction. We have shown here that n-3 PUFA supplementation alters the caecal metabolic phenotype by up-regulating the production of energy metabolites. However, deficiency of essential dietary n-3 PUFA induces a state of compositional and functional disturbance to the gut microbiome and metabolic phenotype, which may have implications for subsequent metabolic disorders.
The mechanisms by which n-3 PUFA interact with the gut microbiota and host metabolism are slowly being resolved( Reference Kaliannan, Wang and Li 34 ). It has recently been suggested that n-6 PUFA stimulate a pro-inflammatory intestinal environment characterised by increased gram-negative bacteria such as Enterobacteriaceae, increased gut permeability and subsequent translocation of LPS across the epithelial barrier( Reference Kaliannan, Wang and Li 12 ). n-3 PUFA may resolve this cascade of events through the stimulation of Bifidobacterium growth and IAP production, an antimicrobial peptide that scavenges LPS( Reference Kaliannan, Wang and Li 12 ). Interestingly, this was examined in a transgenic model of endogenous n-3 production, suggesting that n-3 PUFA may have an indirect and direct interaction with the commensal microbiota. Here, it was shown that n-3 deficiency altered the composition of the murine gut microbiota compared with control or n-3-supplemented diets. These differences included an increase in taxa within the Tenericutes phylum, as well as elevated Coriobacteriaceae and Anaeroplasma abundance. Tenericutes have previously been shown to be elevated in high-fat-diet-fed mice and are correlated with obesity-associated metabolic parameters( Reference Lecomte, Kaakoush and Maloney 35 ). Similarly, coriobacteria were elevated in obese subjects, an effect that was normalised by gastric bypass surgery, suggesting that this species is present as an effect or may even contribute to metabolic disorders( Reference Zhang, DiBaise and Zuccolo 36 ). The animals in this study, however, were not obese and hence the observed loss in % fat mass in the n3− mice compared with CON is noteworthy. It has previously been shown that maternal n-3 supplementation in healthy rats increases weight and fat mass in offspring( Reference Muhlhausler, Miljkovic and Fong 33 ). Hence, it is likely that the anti-adipogenic properties of n-3 PUFA may only be relevant in cases of overweight or obesity. Furthermore, Anaeroplasma, a species within the Tenericutes phylum, was significantly increased in mice following l-carnitine feeding. This was associated with elevated trimethylamine-N-oxide, a key metabolite involved in CVD progression( Reference Koeth, Wang and Levison 37 ). These data may suggest that the role of n-3 PUFA status in chronic metabolic disease can be mediated through modulation of the gut microbiota.
The overall microbiota composition was similar between mothers and offspring; however, it appeared that compositional differences between groups were more evident in offspring, which may be because of longer dietary exposure. Interestingly, these caecal compositional data appeared to differ from previously published faecal data from the same treatment groups( Reference Robertson, Seira Oriach and Murphy 14 ), suggesting that the caecal microbiota may differ significantly from the faecal microbiota owing to altering composition within different regions of the intestinal tract. Segmental differences have been previously observed in the gut microbiota( Reference Marteau, Pochart and Doré 22 ). This is of particular note in this study as a majority of PUFA are absorbed in the upper intestinal tract( Reference Niot, Poirier and Tran 38 ). Therefore, these data suggest that a certain proportion of dietary PUFA reach the caecum and interact directly with the caecal microbiota differently to the lower colonic microbiota or alternatively exert differing indirect effects on the intestinal environments of these two regions, which modifies microbial composition.
We further analysed the composition of the caecal metabolome to assess whether the observed differences in microbiota composition induced by varying n-3 PUFA status resulted in modifications to the metabolic phenotype. This is the first study to examine the effect of n-3 PUFA supplementation or deficiency on the caecal metabolome. However, previously, the liver metabolome was assessed in the context of n-3 PUFA( Reference Depner, Traber and Bobe 21 ). Indeed, the caecal metabolome has been examined in the context of high-fat diet feeding in which there were distinct effects on markers of fat and carbohydrate metabolism. PLS-DA analysis of the metabolomics data suggested that differences between groups were driven by alterations to the n3+ group, which was primarily driven by metabolites involved in energy metabolism namely fumaric acid, malic acid and α-ketoglutaric acid. The microbiota has previously proven essential for energy metabolism. Malic acid, fumaric acid and other energy metabolites involved in the tricarboxylic acid (TCA) cycle were previously shown to be significantly increased in the serum of conventionally raised animals compared with germ-free animals( Reference Velagapudi, Hezaveh and Reigstad 39 ). Furthermore, using predicted functional metagenomics, it has been shown that the TCA cycle is down-regulated on a high-fat diet, an effect that is reversed with high-intensity exercise( Reference Denou, Marcinko and Surette 40 ). Hence, these results may suggest that n3+ has a beneficial effect on energy metabolism through compositional changes in the gut microbiota and on host metabolic activity particularly regarding the TCA cycle. These results, however, should be interpreted with caution owing to the relative flux of the TCA cycle in different disease states and as significant differences exist between the caecal, serum and urinary metabolomes. For example, TCA metabolites, such as those observed here, are decreased in the urinary metabolome of the obese Zucker rat but increased in ob/ob mice( Reference Williams, Lenz and Evans 41 – Reference Salek, Maguire and Bentley 43 ). Therefore, no strict conclusions can be made about this effect of n3+ on the caecal metabolome, but these novel data may provide useful information for future studies about the role of n-3 PUFA in host and microbial metabolism.
A more targeted analysis of caecal SCFA production revealed that n3− significantly reduced the production of acetate, butyrate and total SCFA. n3+ also significantly reduced butyrate production. SCFA are typically the fermentation products of indigestible dietary fibres and function as the key energy source for colonocytes( Reference Byrne, Chambers and Morrison 44 ). A number of studies have shown their importance in the regulation of cholesterol, glucose and lipid metabolism; therefore, impaired SCFA production has been associated with metabolic disruption and chronic disease progression. The observed impairment of SCFA production in n3− suggests that such a deficiency in n-3 PUFA disrupts the homoeostatic intestinal environment, which may have implications for metabolic disease. Indeed, certain taxa involved in SCFA production, namely members of the Clostridiaceae family, were not detected in n3− microbiota, suggesting that n-3 PUFA deficiency in the diet resulted in the absence of SCFA-producing bacteria among the gut microbiota. However, the observed disruptions to SCFA production in n3− were not due to differences in abundance of other well-known butyrate producers such as Roseburia and Pseudobutyvibrio.
Recent work has demonstrated the profound influence of micronutrient deficiencies on the murine microbiota and metabolic phenotype( Reference Hibberd, Wu and Rodionov 45 ). Here we have similarly demonstrated that n-3 PUFA deficiency can also influence the gastrointestinal environment. This study is strengthened by its multi-omics approach, which allows insight not only into the composition of the gut microbiota but also into the functional output of both microbial and host metabolism under different dietary conditions. Such approaches are warranted in future studies in order to deepen our understanding of host–microbial interactions. The extent to which microbial metabolites could be identified and quantified in this study, however, was limited by the metabolomics techniques used, and hence further in-depth metabolomics analysis may provide greater insight into the microbial metabolic phenotype of n-3 deficiency or supplementation. Furthermore, the translation of these results from mice to humans is limited by the differences in microbiota between the two species( Reference Nguyen, Vieira-Silva and Liston 46 ).
n-3 PUFA have consistently reported beneficial effects for cardiovascular, immune and metabolic health; however, the role they play in modulating the gut microbiota composition has remained unclear and their role in the composition of the caecal metabolome has not been examined previously. These results suggest that dietary n-3 PUFA play a crucial role in structuring gut microbiota composition and metabolic activity. Dietary n-3 deficiency appears to induce gut microbial imbalance, which may contribute to impaired SCFA production. Conversely, greater n-3 intake enhances production of energy metabolites possibly through modulation of gut microbiota composition. Further research is required to elucidate the long-term impact of such altered microbiota and metabolomic profiles on chronic disease progression. However, this novel information may inform future research into microbiota-targeted nutritional therapies for metabolic disorders.
Acknowledgements
The authors are supported in part by Science Foundation Ireland in the form of a centre grant (APC Microbiome Institute grant no. SFI/12/RC/2273); the Health Research Board of Ireland (grant nos HRA_POR/2011/23 and HRA_POR/2012/32); the Sea Change Strategy, NutraMara programme (grant-aid agreement no. MFFRI/07/01); and the SMART FOOD project: ‘Science Based ‘Intelligent’/ Functional and Medical Foods for Optimum Brain Health, Targeting Depression and Cognition’ project (reference no. 13/F/411) with the support of the Marine Institute and the Department of Agriculture, Food and the Marine in Ireland.
R. C. R., C. S. O., J. F. C., T. G. D., R. P. R. and C. S. designed the study. R. C. R., C. S. O. and G. M. M. conducted the experiments. R. C. R., C. S. O. and K. M. analysed the data. R. C. R. and C. S. O. wrote the manuscript. All authors read, edited and approved the final manuscript.
The authors declare that there are no conflicts of interest.
Supplementary material
For supplementary material/s referred to in this article, please visit https://doi.org/10.1017/S0007114517002999


