

Continued growth of the Atlantic salmon (Salmo salar) farming industry depends on the availability of sustainable feed ingredients in the world market. For optimal use of ingredients with limited availability, information regarding nutritional requirements is of utmost importance. Fatty acid (FA) composition of salmon diets has changed considerably over the last several decades. Although 90 % of traditional Norwegian salmon diets were composed of marine ingredients in the 1990s, current diets only contain approximately 30 % marine ingredients( Reference Ytrestøyl, Aas and Åsgård 1 ). This shift from marine ingredients to mostly plant-based ingredients has allowed the aquaculture industry to increase production to meet the increasing global demand for food without compromising wild fisheries. However, it has also led to a significant reduction in the levels of healthy n-3 very-long-chain PUFA (n-3 VLC-PUFA, EPA (20 : 5n-3) and DHA (22 : 6n-3)) in salmon tissues and organs.
The total n-3 PUFA dietary requirement of salmonids, including α-linolenic acid (18 : 3n-3), EPA and DHA, has been reported to range from 1 to 2·5 % of the diet, depending on the species and experimental conditions( Reference Glencross 2 ). Early studies in Atlantic salmon fry determined that n-3 PUFA levels ranging from 0·5 to 1·0 % in the feed were needed to attain acceptable growth( Reference Ruyter, Røsjø and Einen 3 ). However, this requirement was set for relatively small fish reared in fresh water, fed a low lipid diet with only 8 % fat content (w/w) and with low growth rates. Salmon farming conditions have evolved over the years, and today high-lipid diets are commonly used to support fast growth. Some studies have shown that the requirements for EPA and DHA can be met by the lipid content of fishmeal when fish oil is fully replaced by vegetable oils( Reference Menoyo, Lopez-Bote and Diez 4 , Reference Torstensen, Frøyland and Ørnsrud 5 ). However, fishmeal is also a limited resource and as such is being replaced by alternative ingredients( Reference Ytrestøyl, Aas and Åsgård 1 ). Thus, dietary essential fatty acid (EFA) requirements should be re-assessed in light of recent changes in fish genetics, farming conditions and feed formulations to provide practical feed specifications.
Previous studies on EFA requirements were based mainly on fish growth and survival. However, criteria for determination of these requirements should cover other aspects, including fish health. The inclusion of EFA in salmon diets should be sufficient to ensure all basic metabolic functions, such as maintaining physiological homoeostasis and proper immune responses. It is important to define early symptoms of EFA deficiency, as subclinical deficiency can result in increased health risks, even if not manifested by overt symptoms or reduced growth. Diet composition is known to affect the FA composition of Atlantic salmon tissues( Reference Ruyter, Moya-Falcón and Rosenlund 6 ). It is also well-known that some organs have the ability to retain EPA and DHA to a higher extent( Reference Thomassen, Bou and Røsjø 7 ), and this might be an important factor in determining fish health. Nevertheless, lipid composition and incorporation of FA into fish tissues are known to be largely influenced by several other metabolic factors – including digestibility; the preferential incorporation of specific FA; β-oxidation, elongation and desaturation pathways; and lipogenic activity, among others( Reference Torstensen, Frøyland and Ørnsrud 5 , Reference Torstensen, Lie and Frøyland 8 – Reference Thomassen, Rein and Berge 11 ).
The development of new lipid sources rich in n-3 VLC-PUFA can help avoid dependency on marine resources while enhancing the nutritional value of the flesh in future. In this sense, the use of single-cell oils has been recognised as a potential source of oil rich in EFA, particularly EPA and DHA, for aquaculture( Reference Miller, Nichols and Carter 12 , Reference Miller, Nichols and Carter 13 ). It has also been highlighted as a promising approach to use molecular engineering techniques to cultivate oilseed crops able to produce n-3 VLC-PUFA( Reference Betancor, Sprague and Usher 14 – Reference Betancor, Sprague and Sayanova 18 ). However, several of the new sources are rich in either EPA or DHA. This, together with the fact that different biological roles have been suggested for these two FA( Reference Emery, Norambuena and Trushenski 9 , Reference Glencross, Tocher and Matthew 19 ), highlights the need for new knowledge on the requirement of each individual n-3 VLC-PUFA.
The aim of this study was to increase our knowledge of the requirements of EFA – EPA and DHA – by Atlantic salmon farmed in seawater. This study evaluated the effect of different dietary levels of EPA and DHA, either alone or in combination, in fishmeal-free diets on fish performance, tissue FA composition and tissue integrity. In addition, the present study sought to evaluate the influence of dietary EPA and/or DHA on the regulation of the n-3 FA biosynthetic pathway.
Methods
Feeding trial
The feeding trial was conducted at the Nofima Research Station in Sunndalsøra, Norway. Individually tagged (PIT-tags, Passive Integrated Transponder; Biosonic) Atlantic salmon (S. salar) with a mean initial weight of 52·8 g were maintained under continuous light (light:day 24 : 0) in indoor seawater tanks to approximately 400 g. Groups of seventy fish were kept in fibreglass tanks of 1 m2 area with 60-cm water depth, supplied with 15 l/min seawater (33 g/l salinity) at ambient temperature. The O2 saturation level was over 85 %, and the temperature was recorded daily. The temperature varied between 6·3 and 13·8°C (mean temperature 10·0°C). Mortality data were recorded throughout the experiment.
Before the experiment, fish were fed a commercial diet (Skretting), and photo period was manipulated in order to induce smoltification. Two different pellet sizes of experimental feeds (3 and 4 mm) were used in accordance with increasing fish size. For each pellet size, the experimental diets were produced from a common dry extruded feed kernel and differed only in the combination of oils added by vacuum coating (Nofima) (Table 1).
Ingredients of the experimental diets (4 mm)
* GePro.
† 50 % rapeseed oil (Emmelev)+50 % poultry oil (GePro). The amount of basic oil blend was reduced as the levels of EPA and/or DHA (Incromega EPA 500TG SR and Incromega DHA 500TG SR; Croda Chemicals Europe Ltd) increased in the different experimental diets in order to maintain the same lipid level.
‡ Tereos Syral.
§ Socomac Rouen.
|| Agrokorn.
¶ Normin.
** Provided per kg of feed: vitamin D, 3000 mg; vitamin E, 160 mg; thiamin, 20 mg; riboflavin, 30 mg; pyridoxine-HCl, 30 mg; vitamin C, 200 mg; calcium d-pantothenate, 60 mg; biotin, 1 mg; folic acid, 10 mg; niacin, 201 mg; cobalamin, 0·05 mg; vitamin K3, 20 mg (Normin).
†† Agrosom.
‡‡ Provided per kg of feed: potassium, 800 mg; magnesium, 750 mg; zinc, 120 mg; iron, 60 mg; manganese, 30 mg; copper, 6 mg; selenium, 0·3 mg (Normin).
§§ VWR.
|||| DSM.
The experimental diets were isoproteic (46·6–47·0 %), isolipidic (24·6–25·9 %) and isoenergetic (22·1–22·6 MJ/kg) (Tables 1 and 2). The basal test diet was fishmeal free but carefully formulated to meet the nutritional requirements for amino acids (online Supplementary Table S1) and trace elements. The diets were formulated to test five dietary levels (0, 5, 10, 15 and 20 g/kg feed, corresponding to 0, 0·5, 1·0, 1·5 and 2·0 % of the diet) of EPA, DHA or a 1:1 mixture of EPA and DHA. The experimental diets are referred in the text according to their percentage supplementation in the feed from 0 to 2·0 %. A diet resembling a commercial diet was included and is referred to as control diet, containing 2·2 % EPA+DHA (22 g EPA+DHA/kg feed). The EPA:DHA ratio in the control diet was approximately 1:1, and therefore this was the ratio selected in the EPA+DHA experimental group. The main purpose of including a commercial style control diet was to represent a benchmark for growth, because nutrient requirements may depend on fish growth rate.
The main oil source added in the experimental diets was a mixture of rapeseed oil and poultry oil (1:1). Poultry oil was used as an alternative for fish oil because of its content of SFA, which is quite similar to standard fish oil. Poultry oil is also high in 18 : 1n-9, relatively low in 18 : 2n-6 and 18 : 3n-3, and it lacks EPA and DHA( Reference Higgs, Balfry and Oakes 20 ). This special FA composition makes poultry oil very suitable for n-3 FA requirement studies. By using the combination of rapeseed oil and poultry oil, an oil mix with no EPA, no DHA and constant level of 18 : 3n-3 was obtained.
The dietary EPA and DHA were added as EPA and DHA TAG concentrates to the rapeseed oil and poultry oil mix. The amount of oil coated on to the pellet was kept the same for all diets, so when increasing levels of EPA- and/or DHA-enriched oils were added, the level of rapeseed oil and poultry oil (1:1) mix was reduced. The experimental diets were fishmeal free to ensure full control of the levels of EPA and DHA. Fish receiving diets containing 0 and 2·0 % levels of n-3 FA and the control group were represented in triplicate tanks, whereas the rest of the dietary treatments were represented in duplicate. Feed was provided through automatic belt feeders, and waste feed was collected from the effluent water( Reference Helland, Grisdale-Helland and Nerland 21 ) to monitor daily feed intake in each tank. Feeding level was assessed on the basis of feed intake during the pre-feeding days, aiming at 15–20 % overfeeding to obtain maximum voluntary feed intake in all groups of fish. The chemical composition of the diets was determined via proximate composition analysis according to standard methods described previously( Reference Berge, Witten and Baeverfjord 22 ).
Fatty acid composition of diets
FA compositions of the diets, determined using the method described below, are provided in Table 3. The content of 18 : 3n-3, the precursor of VLC-PUFA EPA and DHA, was kept at approximately the same level in all diets (approximately 4·7 % of total FA in the diet) (Table 3). This allowed us to evaluate and compare the capacity of EPA and DHA to influence the n-3 FA biosynthetic pathway. The 0 % diet contained almost no n-3 VLC-PUFA, with only 0·05 % EPA and 0·08 % DHA of total FA. The control diet contained EPA and DHA levels representing 4·36 and 4·02 %, respectively, of the total FA content. The EPA dietary group contained increasing percentages of EPA, ranging from 2·05 to 8·15 % of total FA, and low percentages of DHA, ranging from 0·55 to 2·07 % of total FA. The DHA dietary group contained increasing levels of DHA, ranging from 1·94 to 7·74 % of total FA, and low levels of EPA, ranging from 0·37 to 1·33 % of total FA. The EPA+DHA (1:1) group contained increasing levels of both FA, ranging from 2·76 to 10·15 % of the FA.
Fatty acid composition (% of total) in the 4-mm experimental dietsFootnote *
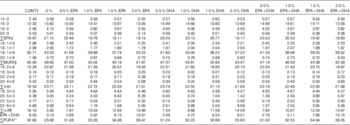
* The dietary groups are named according to their percentage in the feed as 0, 0·5, 1·0, 1·5 and 2·0 % of the diet corresponding to 0, 5, 10, 15 and 20 g/kg feed.
† CONT=control diet resembling a commercial feed.
‡ Includes 15 : 0, 17 : 0, 22 : 0, 24 : 0.
§ Includes 14 : 1n-5, 15 : 1, 16 : 1n-5, 20 : 1n-7, 20 : 1n-11, 22 : 1n-7, 22 : 1n-9, 22 : 1n-11, 24 : 1n-9.
|| Includes 16 :2n-6, 20 : 3n-6, 22 : 2n-6, 22 : 4n-6, 22 : 5n-6.
¶ Includes 16 : 2n-3.
** Includes 16 : 2n-3, 20 : 3n-6, 22 : 2n-6, 22 : 4n-6, 22 : 5n-6.
Sampling and sample preparation
Initial whole-body samples of fish were frozen at the start of the experiment. The next sampling took place after 19 weeks of feeding the experimental diets when the fish had reached an average weight of 182·9 (sem 69·3) g. After 7 more weeks, the last sampling was performed when the average weight of the fish was 379·7 (sem 96·5) g. The same procedure was followed at both samplings; five salmon were randomly sampled from each tank and killed by an overdose of the anaesthetic metacain (MS-222; 0·05–0·08 g/l). Subsequently, samples from the right fillet, brain, heart, liver, skin and intestines were frozen at −80°C and stored for later analysis of lipid composition. The liver and heart were excised and individually weighed. Samples from the mid-intestine, liver, heart and white muscle from the Norwegian Quality Cut (NQC)( 23 ) were cut into sizes suitable for histological analysis and fixed in 10 % buffered formalin. Furthermore, liver samples were frozen in liquid N2 and stored at −80°C for RNA analysis. During the last sampling, three extra fish from each tank, with a body weight corresponding to the mean weight of all fish in the tank, were sampled for analysis of whole-body chemical composition (six to nine fish in total per experimental group). The experiment was conducted according to the National Guidelines for Animal Care and Welfare published by the Norwegian Ministry of Education and Research.
Fatty acid composition analyses
Total FA composition was analysed in the diets, fillet, heart, liver, brain, intestine, skin and whole body of salmon at 400 g. Total lipids were extracted from homogenised tissues (a pool of five samples per tank except for the whole-body analysis, where a pool of three fish per tank was used) and diets, following the method described by Folch et al. ( Reference Folch, Lees and Sloane Stanley 24 ). A sample of 1–2 ml (depending on the tissue) from the chloroform–methanol phase was used for analysis of FA composition of total lipids using the method described by Mason & Waller( Reference Mason and Waller 25 ). In brief, the extract was dried under N2 gas, and the residual lipid extract was trans-methylated overnight with 2',2'-dimethoxypropane, methanolic HCl and benzene at room temperature. The methyl esters were separated and analysed in a GC (Hewlett Packard 6890; HP) with a split injector, using an SGE BPX70 capillary column (length 60 m, internal diameter 0·25 mm and film thickness 0·25 μm; SGE Analytical Science), flame ionisation detector and HP Chem Station software. The carrier gas was He, and the injector and detector temperatures were both 280°C. The oven temperature was raised from 50 to 180°C at the rate of 10°C/min, and then raised to 240°C at a rate of 0·7°C/min. Individual FA methyl esters were identified by reference to well-characterised standards. The relative amount of each FA was expressed as a percentage of the total amount of FA in the analysed sample, and the absolute amount of FA per gram of tissue was calculated using C23 : 0 methyl ester as the internal standard.
To determine the lipid class composition of the muscle, liver and heart, 2 ml of the lipid extract was evaporated under N2 gas, and the residual lipid extract was re-dissolved in hexane (Merck). Phospholipids (PL) and neutral lipids (NL) were separated by TLC using a mixture of petroleum ether, diethyl ether and acetic acid (113:20:2, v/v/v) as the mobile phase. The lipids were visualised by spraying the TLC-plates with 0·2 % (w/v) 2',7'-dichlorofourescein in methanol, and the lipids were identified by comparison with known standards under UV light. The spots corresponding to PL and NL fractions were scraped off into glass tubes and trans-methylated following the aforementioned procedure.
Growth and nutrient retention
Individual weights of the fish were recorded at the start of the experiment and after 19 and 26 weeks, and individual growth rates were calculated as specific growth rate (SGR, %/d) as follows:
 $$\eqalignno{{\rm Specific}\,{\rm growth}\,{\rm rate}\,\,\left( {\,\%\,\,{\rm BW/d}} \right)\!:\,{\rm SGR} {\,\equals\,}\left( {\ln W_{2} {\minus}\ln W_{1} } \right) \cr \left( {t_{2} {\minus}t_{1} } \right)^{{{\minus}1}}{\times}100,$$
where W 1 and W 2 are body weights (g) at time (d) t 1 and t 2, respectively, over the test period.
Feed conversion ratio (FCR) was based on actual recorded feed intake and biomass increase in each tank, where FCR=kg feed ingested/kg biomass weight increase.
Apparent retention of FA was calculated for each tank according to the following formula
 $${\rm Ret}{\,\equals\,}100{\times}\left[ {\left( {{\rm FB}{\times}N_{f} } \right){\minus}\left( {{\rm IB}{\times}N_{i} } \right)} \right]\,/\,\left( {{\rm feed}\,{\rm intake}{\times}N_{\rm diet}} \right)^{{{\minus}1}} ,$$
where IB and FB are initial and final biomass and N is the concentration of FA in fish or diet. The values i and f represent initial and final sampling days, respectively. The final biomass was corrected for mortality during the experimental period. The initial values were the average of three samples, each sample consisting of a pool of five fish, whereas the final (end) values were tank means from three pooled fish per tank. In addition, the net production of FA was calculated according to the following formula
 $${\rm Net}\,{\rm production}{\,\equals\,}{\rm FA}\,{\rm deposition}\,\left( {\rm g} \right)-{\rm FA}\,{\rm intake}\,\left( {\rm g} \right),$$
The condition factor (K), hepatosomatic index (HSI) and cardiosomatic index (CSI) were calculated as follows:
 $$\eqalignno{ & K{\,\equals\,}\left( {{\rm fish}\,{\rm weight}\,/\,\left( {{\rm total}\,{\rm length}} \right)^{3} } \right){\times}100. \cr & {\rm HSI}{\,\equals\,}\left( {{\rm liver}\,{\rm weight}\,/\,{\rm fish}\,{\rm weight}} \right){\times}100. \cr & {\rm CSI}{\,\equals\,}\left( {{\rm heart}\,{\rm weight}\,/\,{\rm fish}\,{\rm weight}} \right){\times}100. $$
Gene expression study
Total RNA was isolated from liver homogenates at both sampling times (200 and 400 g) using a PureLink Pro 96 RNA Purification Kit (Invitrogen), according to the manufacturer’s instructions. RNA was treated with PureLink DNase (Invitrogen) to remove any contaminating DNA. RNA concentration was measured using a NanoDrop® ND-1000 Spectrophotometer (NanoDrop Technologies). All RNA samples used in our experiments were confirmed to have A260/280 ratios between 2·09 and 2·15, and RNA quality was assessed using a Bionalyzer (Agilent). Reverse transcription of 500-μg total RNA into complementary DNA (cDNA) was carried out using a TaqMan® Reverse Transcription Reagents kit (Applied Biosystems) according to the manufacturer’s protocol in a 20-μl reaction volume.
PCR primers (Table 4) were designed using Vector NTI (Invitrogen) and synthesised by Invitrogen. The efficiency was checked from 10-fold serial dilutions of cDNA for each primer pair. Real-time PCR was performed in a LightCycler 480 Instrument (Roche Applied Science). The PCR master mix consisted of 0·5-μl forward and 0·5-μl reverse primer (0·5 μm final concentrations), 4 μl of a 1:10 dilution of cDNA and 5 μl LightCycler 480 SYBR® Green I Master (Roche Applied Science). All samples were analysed in duplicate with a non-template control for each gene. The reaction was performed by incubating the samples at 95°C for 5 min, forty-five cycles of 95°C for 15 s and 60°C for 15 s, and 72°C for 15 s for denaturation, annealing and extension, respectively. The specificity of PCR amplification was confirmed by melting curve analysis (95°C for 5 s and 65 °C for 1 min, and a continuous temperature ramp (0·11°C/s) from 65 to 97°C). Both RNA polymerase II polypeptide (rpol2) and eukaryotic translation initiation factor 3 (etif3) were evaluated as reference genes, and it was found that the latter was the most stable. Relative expression levels of mRNA transcripts were calculated using the
 $${\minus}\Delta \Delta ^{{C_{t} }} $$
method using etif3 as the reference gene(
Reference Livak and Schmittgen
26
).
$${\minus}\Delta \Delta ^{{C_{t} }} $$
method using etif3 as the reference gene(
Reference Livak and Schmittgen
26
).
Atlantic salmon primer sequences used for real-time PCR
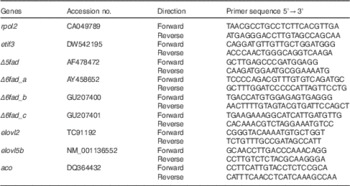
rpol2, RNA polymerase II polypeptide; etif3, eukaryotic translation initiation factor 3; Δ5fad, Δ5 desaturase; Δ6fad_a, Δ6 desaturase isoform a; Δ6fad_b, Δ6 desaturase isoform b; Δ6fad_c, Δ6 desaturase isoform c; elovl2, elongase 2; elovl5b, elongase 5b; aco, acyl-CoA oxidase.
Histology
Histopathological evaluation was performed on mid-intestine, liver, cardiac and skeletal muscle samples of selected treatment groups (control, 2·0 % EPA+DHA, 2·0 % EPA, 2·0 % DHA, 1·0 % EPA+DHA, 1·0 % EPA, 1·0 % DHA and 0 %). Samples for histology (nine to ten per diet group, approximately 400 g) were collected at the end of the experiment. Paraplast-embedded samples were cut with a Leitz 1208 microtome (Ernst Leitz Wetzlar GmbH) (5 μm), and stained with standard haematoxylin–eosin (Merck KGaA). Stained slides were examined using a standard light microscope (Nikon Optiphot; Nikon). Images were captured by a Micropublisher 3.3 RTV camera and QCapture 2.9.13 software (QImaging).
Samples were subjected to a blind histopathological evaluation followed by a second evaluation after decoding the samples to provide a description per dietary group. Muscle samples were quantitatively analysed (number of fibres/mm2) using Image J (NIH). Liver sections were evaluated on the basis of degree of lipid steatosis, and the integrity of the whole organ was assessed using a 0–5-lesion category semi-quantitative scoring scale, where 0 represents no significant finding and 5 represents severe fatty change. For intestinal samples, a simple scoring system was developed to describe vacuolisation of enterocytes based on the observations made during evaluation. Tissue samples were examined for pathology and other systematic variation in tissue morphological features.
Statistics
Tank values were used as experimental units. Linear and polynomial regression models were used to evaluate the relationship between FA tissue content and FA levels in the feed. The proportion of total variance explained by the model was expressed by R 2, and the chosen level of significance was P<0·05. Changes in FA composition of PL and NL of muscle, liver and heart and the apparent retention values were analysed by a two-way ANOVA using the n-3 dietary level and the source of n-3 included in the diet as effects. The mRNA transcript abundance of metabolic relevant genes in the liver was analysed by one-way ANOVA followed by Tukey’s honest significant difference post hoc test to detect differences within dietary groups. Differences were considered statistically significant at P<0·05. In addition, P values between 0·05 and 0·10 were included and interpreted as trends. These statistical analyses were conducted using JMP® software version 11.2.1 (SAS Institute Inc., 1989–2007).
The relative FA composition data of salmon tissues were analysed using the software Unscrambler® X, version 10.3 (CAMO). A multivariate principal component analysis (MPCA) was performed for each data matrix of the relative FA compositions. Score plots from the PCA were used to explore the main trends and groupings in the data, and their respective correlation loadings reveal variables contributing to sample groupings.
Results
Fish performance, biometric data, and tissue and whole-body lipid content
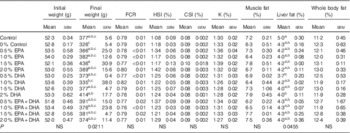
During the experiment, the average mortality of fish in all the experimental groups was 5·7 % and not significantly influenced by diet. Mortalities occurred only among the smallest smolts (about 50 g) at the start of the experiment just after seawater transfer. Fish in the groups supplied with 0·5–2·0 % EPA and/or DHA had higher growth rates (online Supplementary Fig. S1) and final body weights 3–34 % larger than the 0 % group (Table 5). An FCR about 0·8 was observed for all experimental dietary groups (Table 5). No significant differences in biometric data, muscle fat content and whole-body fat content were recorded. The total lipid content in the liver was significantly affected by the experimental diets (P=0·045), with the control group presenting noticeably higher fat content than that from fish fed the 0·5 % DHA and 2·0 % DHA diets.
Growth, feed utilisation, biometry data and total lipid content in muscle, liver and whole body of Atlantic salmon fed the experimental diets for 26 weeksFootnote * (Data are shown as mean values using tank as a statistical unit (n 2–3) with their standard errors)
a,b,c Mean values within each column with unlike superscript letters were significantly different.
* The dietary groups are named according to their percentage in the feed as 0, 0·5, 1·0, 1·5 and 2·0 % of the diet corresponding to 0, 5, 10, 15 and 20 g/kg feed. For the muscle and liver, each replicate value originates from a pooled organ sample from five fish. For the whole body, each replicate value originates from a pooled sample from three fish. Each sample was measured in duplicates.
Apparent fatty acid retention
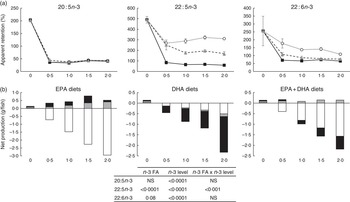
To analyse how much of the EPA and DHA consumed was actually deposited in the whole body for all groups, apparent FA retentions and net production of FA were calculated (Fig. 1). Values above 100 % (Fig. 1(a)) or above 0·0 (Fig. 1(b)) represent a net production, whereas values below 100 % or below 0·0 (Fig. 1(a) and (b), respectively) indicate utilisation of these FA for energy production or for various metabolic needs through conversion to other intermediates. Retention of 20 : 5n-3 FA was significantly affected (P<0·0001) by the dietary level of both EPA and DHA, with the 0 % dietary group exhibiting a net production of EPA with an apparent retention value of 202 %. The low apparent retention of 18 : 3n-3 in the 0 % dietary group (33·3 %; data not shown) suggests that the EPA content in the fish receiving this diet might have been produced from 18 : 3n-3 to a large extent. At dietary n-3 levels of 0·5 % or above, there was a significant reduction of the 20 : 5n-3 retention to levels about 40 %. The retention of 22 : 5n-3 (docosapentaenoic acid, DPA) was affected by both the dietary n-3 level and the n-3 source. The 0 % dietary group exhibited the highest apparent retention (490 %). Dietary inclusion of 20 : 5n-3, either alone or in combination, resulted in apparent retention values of 22 : 5n-3 in the range of 322–170 %, indicating that dietary EPA was converted to DPA to a large extent. The retention of 22 : 6n-3 was significantly affected by the dietary level of both EPA and DHA, with the 0 % dietary group exhibiting a significant net production of DHA with an apparent retention value of 256 %. Dietary inclusion of 20 : 5n-3 as the main source of n-3 led to retention values of 22 : 6n-3 above 100 %, indicating net synthesis of this FA in the body. Dietary 22 : 6n-3 as the main source of dietary n-3, regardless of the level, led to a constant retention of 22 : 6n-3 at about 70 %. Only the lowest dietary level tested with inclusion of both 20 : 5n-3 and 22 : 6n-3 led to the retention of 22 : 6n-3 above 100 %, whereas higher dietary levels of the combination of these FA exhibited retentions about 82 %. Results from the net production (Fig. 1(b)) showed the same trend. However, the net production of EFA, specifically DPA and DHA, in the deficient group was shown to be lower than that in the EPA dietary group. The FA composition of the whole body also supports the high conversion of 20 : 5n-3 to 22 : 6n-3, as 22 : 6n-3 increased to a large extent in the EPA dietary group (Table 6).
Apparent retention (a) and net production (b) of 20 : 5n-3, 22 : 5n-3 and 22 : 6n-3 fatty acids (FA) in Atlantic salmon fed experimental diets for 26 weeks. The results are expressed as the average with their standard errors where each value originates from a pooled sample from three fish. For the apparent retention, data were analysed by a two-way ANOVA (n-3 dietary level and source of n-3 as factors; P<0·05). ![]() , EPA;
, EPA; ![]() , DHA;
, DHA; ![]() , EPA+DHA;
, EPA+DHA; ![]() , 20 : 5n-3;
, 20 : 5n-3; ![]() , 22 : 5n-3;
, 22 : 5n-3; ![]() , 22 : 6n-3.
, 22 : 6n-3.
Fatty acid composition (% of total) in the whole body of Atlantic salmon fed the experimental diets for 26 weeksFootnote * (Mean values with their standard errors (n 3 for the 0 and 2·0 % diets and n 2 for the 0·5, 1·0 and 1·5 %, being each sample represented by a pool of three fish))
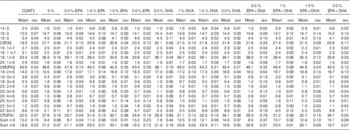
* The dietary groups are named according to their percentage in the feed as 0, 0·5, 1·0, 1·5 and 2·0 % of the diet corresponding to 0, 5, 10, 15 and 20 g/kg feed.
† CONT=control diet resembling a commercial feed.
‡ Includes 15 : 0, 17 : 0, 22 : 0, 24 : 0.
§ Includes 14 : 1n-5, 15 : 1, 16 : 1n-5, 20 : 1n-7, 20 : 1n-11, 22 : 1n-7, 22 : 1n-9, 22 : 1n-11, 24 : 1n-9.
|| Includes 16 : 2n-3, 20 : 3n-6, 20 : 4n-3.
A multivariate comparison of the effects of dietary n-3 fatty acids on total fatty acid composition of different organs
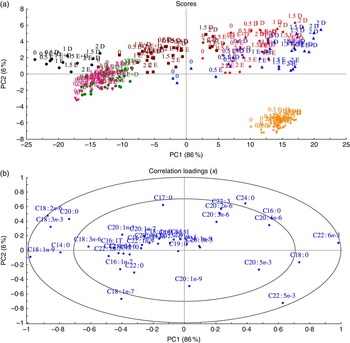
To understand how different organs respond to dietary FA, MPCA analyses were used to determine tissues that are more influenced by changes in FA composition in fish feed (Fig. 2). Samples (tissues and feed) with similar relative total FA compositions are located in the same area in the score plot (Fig. 2); 86 % of the variation was explained by the first principal component, which separated the samples into two major groups – feed, muscle, skin and intestine in the left quadrant and heart, liver and brain in the right quadrant. The heart, liver and brain were characterised by high percentages of 18 : 0 and 22 : 6n-3 FA, whereas muscle, skin and intestine were particularly rich in the typical feed FA – the MUFA 18 : 1n-9 and the PUFA 18 : 2n-6 and 18 : 3n-3 in addition to the SFA 14 : 0 and 20 : 0 (Fig. 3(b)). The second principal component separated brain tissue from the liver and heart, showing a correlation between brain and 22 : 5n-3 FA and between liver and heart and the SFA 16 : 0 and 24 : 0.
Scores (a) and correlation loadings (b) showing the relationships between the samples (feed and tissues) and the total fatty acid composition, respectively. These plots show first principal component (PC1) v. second principal component (PC2), summarising 92 % of the variation between feed and tissues. The colours in the score plot represent different samples analysed. For the analysed tissues, each sample originates from a pooled sample of five fish. ![]() , Intestine;
, Intestine; ![]() , muscle;
, muscle; ![]() , liver;
, liver; ![]() , heart;
, heart; ![]() , skin;
, skin; ![]() , brain;
, brain; ![]() , feed.
, feed.
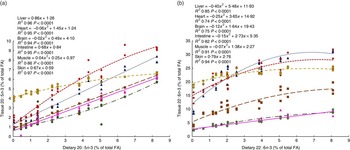
Regressions of dietary 20 : 5n-3 (a) and 22 : 6n-3 (b) fatty acids (FA) and their respective content in muscle, skin, intestine, liver, heart and brain from Atlantic salmon fed experimental diets for 26 weeks. Each value originates from a pooled sample of five fish. ![]() , Brain;
, Brain; ![]() , liver;
, liver; ![]() , heart;
, heart; ![]() , intestine;
, intestine; ![]() , muscle;
, muscle; ![]() , skin.
, skin.
Although different tissues with similar relative total FA compositions were located in the same area in the score plot, they were still individually influenced by the dietary group (EPA, DHA and EPA+DHA), and by the level of EPA and/or DHA in the diets, with percentages of EPA and DHA increasing along the horizontal axis and presenting a separation according to dietary group along the vertical axis (Fig. 2(a)). It is noteworthy that brain samples formed a compact cluster, indicating that this tissue was less affected by FA composition of the diets.
Organs and tissues respond differentially to reduced dietary levels of EPA and DHA
To compare how a gradual reduction in dietary levels of EPA and DHA from approximately 8–0 % of total FA influence their content in different tissues, regressions analysis were conducted, showing linear or quadratic relationships between dietary level and tissue FA content (Fig. 3(a) and (b)). The percentage of EPA in the intestine, muscle, skin, liver and heart gradually decreased with decreasing dietary levels of this FA (Fig. 3(a)). Thus, EPA in the intestine, muscle, skin, liver and heart was lower by 86·4, 84·5, 83·8, 80·0 and 78·7 %, respectively, in the 0 % group than in fish fed 2·0 % EPA in the diet (8 % of total FA). However, EPA was only moderately decreased in the brain compared with the other tissues.
The percentage of DHA in all tissues analysed also gradually decreased with decreasing dietary level of this FA (Fig. 3(b)). All tissues followed a quadratic regression except the skin, which showed a linear regression. The response of tissues to reduce dietary DHA was more moderate than to reduced dietary EPA. The percentage of DHA in the intestine, skin, liver and muscle was lower by 77·2, 74·6, 72·1 and 71·4 % in the deficient group relative to the group fed the 2·0 % DHA diet. DHA only decreased by 50·1 and 25·7 % in the heart and brain, respectively.
The maximum level of DHA in the brain, heart and liver was reached approximately when fish were fed 1·5 % DHA (5·5 % of total FA) in the feed, and the percentage of DHA in these tissues did not increase further with increase in dietary DHA up to 2·0 % in the diet. A maximum percentage of DHA in the intestine, muscle and skin was not reached in this trial.
The interconversion between EPA and DHA in different tissues
To determine the capacity for metabolic interconversion of EPA to DHA and DHA to EPA in farmed salmon, regressions analysis (increasing feed level of EPA relative to the organ level of DHA and increasing feed level of DHA relative to the organ level of EPA) were conducted (Fig. 4(a) and (b)).
Regressions of dietary 20 : 5n-3 and 22 : 6n-3 fatty acid (FA) content in muscle, skin, intestine, liver, heart and brain from Atlantic salmon fed EPA diets for 26 weeks (a). Regressions of dietary 22 : 6n-3 and 20 : 5n-3 FA content in muscle, skin, intestine, liver, heart and brain tissue from Atlantic salmon fed DHA diets for 26 weeks (b). Each value originates from a pooled sample of five fish. ![]() , Brain;
, Brain; ![]() , liver;
, liver; ![]() , heart;
, heart; ![]() , intestine;
, intestine; ![]() , muscle;
, muscle; ![]() , skin.
, skin.
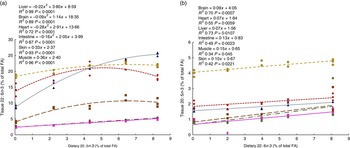
The results suggest that dietary EPA was largely converted to DHA in all EPA dietary groups lacking DHA in the diet (Fig. 4(a)). The most marked increase in DHA was found in the liver, where DHA was more than doubled in the 2·0 % EPA dietary group compared with the deficient group, even though the groups contained the same dietary level of DHA and almost constant levels of the other possible precursor, 18 : 3n-3. The heart, intestine and brain reached a maximum DHA tissue content at dietary levels of EPA between those provided by the 1·0 % EPA diet and the 1·5 % EPA diet. The liver did not reach its maximum capacity to deposit DHA, whereas the muscle and skin increased linearly with increasing dietary EPA levels. Likewise, in the DHA group lacking EPA, a linear increase in 20 : 5n-3 was found in all tissues studied (Fig. 4(b)). Although very limited, these results indicate some degree of retroconversion of DHA to EPA.
Decreased tissue content of n-3 leads to exchange of fatty acids for pro-inflammatory n-6 fatty acid
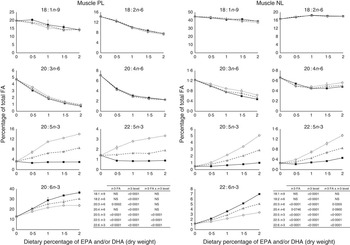
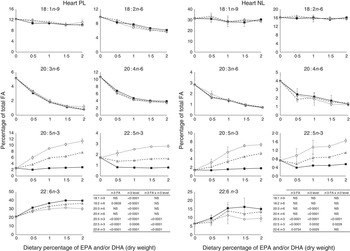
In addition to the effects on total FA composition of tissues, we also wanted to test whether membrane PL were affected differently than the storage lipids (NL) in the three selected tissues: liver, muscle and heart. Liver and heart represent organs with high levels of EPA and DHA, whereas the muscle represents an organ that is to a high degree influenced by the dietary FA 18 : 1n-9 and 18 : 2n-6 with relatively low levels of EPA and DHA. The relative lipid class distribution between total PL and NL in the muscle, liver and heart was not altered by the dietary treatment. Muscle contained approximately 11·5 and 88·5 % of PL and NL, respectively. PL content was higher in the liver and heart, at approximately 39·0 and 53·3 %, respectively. Contrary to the situation in the NL fractions, liver, heart and muscle PL fractions responded relatively similarly to the changes in diet composition, indicating the importance of maintaining membrane PL FA composition regardless of tissue type (online Supplementary Fig. S2).
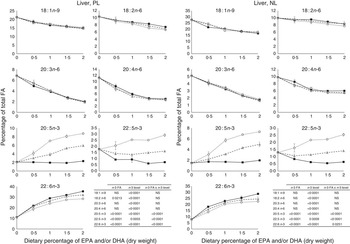
The most important changes in FA composition of the different organs are presented in Figs 5–7. Decreasing dietary levels of 20 : 5n-3 and/or 22 : 6n-3 consistently led to a significant increase in 18 : 1n-9, 18 : 2n-6, 20 : 3n-6 and 20 : 4n-6 in the PL and NL fractions of the muscle, liver and heart. This increase in 18 : 1n-9 and 18 : 2n-6 was primarily due to increasing dietary content of these FA. An exception to this increase was the constant levels of 18 : 1n-9 and 18 : 2n-6 present in the NL fraction of the muscle, regardless of n-3 dietary level or the n-3 FA incorporated in the diet. The type of n-3 VLC-PUFA included in the diet (EPA and/or DHA) only had a significant effect in the amount of 18 : 2n-6 (P=0·02) and 20 : 3n-6 (P=0·0002) in the PL fraction of liver and muscle, respectively. In the muscle NL, 20 : 3n-6 was significantly affected by both the type (P<0·0001) and amount (level) of n-3 VLC-PUFA included in the diet (P<0·0001), and the interaction of these two factors had a significant effect (P=0·04) on the content of this FA.
Fatty acids (FA) (measured as the percentage of total FA) in the liver phospholipid (PL) and neutral lipid (NL) fractions of fish fed dietary inclusions of 20 : 5n-3 and/or 22 : 6n-3 for 26 weeks. Values are means, with their standard errors, where each value originates from a pooled sample of five fish. Data were analysed by a two-way ANOVA (n-3 dietary level and source of n-3 as factors; P<0·05). ![]() , EPA;
, EPA; ![]() , DHA;
, DHA; ![]() , EPA+DHA.
, EPA+DHA.
Fatty acids (FA) (measured as the percentage of total FA) in the muscle phospholipid (PL) and neutral lipid (NL) fractions of fish fed dietary inclusions of 20 : 5n-3 and/or 22 : 6n-3 fatty acids for 26 weeks. Values are means, with their standard errors, where each value originates from a pooled sample of five fish. Data were analysed by a two-way ANOVA (n-3 dietary level and source of n-3 as factors; P<0·05). ![]() , EPA;
, EPA; ![]() , DHA;
, DHA; ![]() , EPA+DHA.
, EPA+DHA.
Fatty acids (FA) (measured as the percentage of total FA) in the heart phospholipid (PL) and neutral lipid (NL) fraction of fish fed dietary inclusions of 20 : 5n-3 and/or 22 : 6n-3 for 26 weeks. Values are means, with their standard errors, where each value originates from a pooled sample from five fish. Data were analysed by a two-way ANOVA (n-3 dietary level and source of n-3 as factors; P<0·05). ![]() , EPA;
, EPA; ![]() , DHA;
, DHA; ![]() , EPA+DHA.
, EPA+DHA.
In general terms, relative absence of DHA in the diet increased the content of 22 : 5n-3 in the different fractions and tissues analysed, indicating a stimulation of the conversion from 18 : 3n-3 and/or 20 : 5n-3. The FA 20 : 3n-9 was not detected in the tissues observed, indicating no conversion of 18 : 1n-9 to 20 : 3n-9.
Effects of dietary n-3 fatty acids on transcriptional regulation
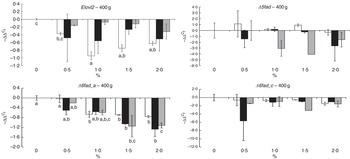
The transcript abundance of elongase 2 (elovl2), elongase 5b (elovl5b), Δ5 desaturase (Δ5fad), Δ6 desaturase isoform a (Δ6fad_a), Δ6 desaturase isoform b (Δ6fad_b), Δ6 desaturase isoform c (Δ6fad_c) and acyl-CoA oxidase (aco) was assessed in the liver of fish at both sampling times (Fig. 8 and online Supplementary Fig. S3). These genes were selected on the basis of their relevance and implication in the n-3 FA biosynthetic pathway. The mRNA transcript abundance of elovl5b, Δ6fad_b and aco showed no significant differences between the dietary treatments at any time point (data not shown), probably because of large intrapopulation variance. After 19 weeks of feeding fish the experimental diets, the rest of the analysed desaturases (Δ5fad, Δ6fad_a and Δ6fad_c) exhibited a decrease in mRNA transcript levels as the level of n-3 was increased in the diet, reaching significance (P=0·02, 0·03 and 0·03, respectively, for the aforementioned genes) when EPA and DHA were added together in the diet (online Supplementary Fig. S3). After 26 weeks, despite a lack of significance, the same pattern was observed in the mRNA transcript abundance of Δ5fad and Δ6fad_c. However, the abundance of Δ6fad_a mRNA transcripts was significantly decreased by increasing doses of EPA (P=0·0005), DHA (P=0·01) and their combination (P=0·006). Levels of mRNA transcripts encoding elovl2 expression were reduced with increasing dietary levels of n-3, reaching significance (P=0·0003) in the final sampling when EPA was added alone at dietary levels of 1·0 % or above.
Relative changes in mRNA transcript abundance of relevant genes involved in the n-3 fatty acid (FA) biosynthetic pathway in the liver of Atlantic salmon fed experimental diets for 26 weeks. Samples (n 2–3; where each value originates from a pooled sample of five fish) were analysed with real-time quantitative PCR. Values are
 $${\minus}\Delta \Delta ^{{C_{t} }} $$
, with their standard errors, and the 0 % diet was set to zero. Results are compared by two-way ANOVA (n-3 dietary level and source of n-3 as factors; P<0·05). A Tukey’s honest significant difference test was used to analyse the specific effects of the three dietary groups on mRNA transcript abundance. a,b,c Mean values with unlike letters were significantly different between dietary levels in each group (P<0·05). Elovl2, Δ6 desaturase isoform c; Δ5fad, Δ5 desaturase; Δ6fad_a, Δ6 desaturase isoform a; Δ6fad_c, Δ6 desaturase isoform c;
$${\minus}\Delta \Delta ^{{C_{t} }} $$
, with their standard errors, and the 0 % diet was set to zero. Results are compared by two-way ANOVA (n-3 dietary level and source of n-3 as factors; P<0·05). A Tukey’s honest significant difference test was used to analyse the specific effects of the three dietary groups on mRNA transcript abundance. a,b,c Mean values with unlike letters were significantly different between dietary levels in each group (P<0·05). Elovl2, Δ6 desaturase isoform c; Δ5fad, Δ5 desaturase; Δ6fad_a, Δ6 desaturase isoform a; Δ6fad_c, Δ6 desaturase isoform c; ![]() , EPA;
, EPA; ![]() , DHA;
, DHA; ![]() , EPA+DHA.
, EPA+DHA.
Morphology of the muscle, liver, heart and intestine
The overall observation for liver, skeletal muscle and heart under light microscope was that of normal tissues with expected variation in tissue characteristics (data not shown). The exception was the intestine, in which some diet-related morphological changes were observed.
In mid-intestine, the overall tissue structure and the shape of intestinal villi were normal (online Supplementary Fig. S4). There was, however, significant variation in vacuolisation of enterocytes. In affected individuals, the supranuclear cytoplasm was packed with clear vacuoles, either with a foamy appearance or as larger vacuoles, indicating intracellular lipid accumulation. In the most prominent cases, the enterocytes appeared swollen, affecting the outline of the villi. In fish classified as unaffected, vacuolisation of the supranuclear cytoplasm of the enterocytes was non-identifiable, or present as a narrow band just superior to the nuclei. An ad hoc classification was performed, in which severity of the vacuolisation was graded. Numbers of affected individuals with the different scores per diet are shown in Fig 9(e).
Detail of mid-intestinal mucosa in fish fed diets differing in EPA and DHA contents (a–d) and hypervacuolisation of mid-intestinal enterocytes in response to dietary contents of EPA and DHA (E). Score 0 (![]() ): normal vacuolisation of enterocyte; score 1 (
): normal vacuolisation of enterocyte; score 1 (![]() ): low-grade hypervacuolisation, focal or limited areas of vacuolisation, mainly foamy cytoplasm with normal mucosal outline; score 2 (
): low-grade hypervacuolisation, focal or limited areas of vacuolisation, mainly foamy cytoplasm with normal mucosal outline; score 2 (![]() ): high-grade hypervacuolisation, present in larger areas of mucosa, with lager vacuoles and swollen appearance of mucosa (n 10–9). (a) Control diet, with normal enterocytes (score 0), (b) 0 % diet, with extensive supranuclear vacuolisation of enterocytes, indicated by (
): high-grade hypervacuolisation, present in larger areas of mucosa, with lager vacuoles and swollen appearance of mucosa (n 10–9). (a) Control diet, with normal enterocytes (score 0), (b) 0 % diet, with extensive supranuclear vacuolisation of enterocytes, indicated by (![]() ) (score 2), (c) 2·0 % EPA diet, with foamy cytoplasm, indicated by (
) (score 2), (c) 2·0 % EPA diet, with foamy cytoplasm, indicated by (![]() ) (score 1), (d) 2·0 % EPA+DHA, similar to control in (a) (score 0). All micrographs: scale bar 0·01 mm; Nu, enterocyte nucleus layer; Su, supranuclear cytoplasm; Lu, intestinal lumen; Go, goblet cells (mucus production).
) (score 1), (d) 2·0 % EPA+DHA, similar to control in (a) (score 0). All micrographs: scale bar 0·01 mm; Nu, enterocyte nucleus layer; Su, supranuclear cytoplasm; Lu, intestinal lumen; Go, goblet cells (mucus production).
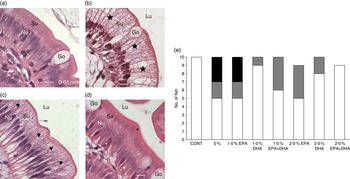
In fish fed the control and 2·0 % EPA+DHA diets, all intestinal samples were classified as normal. In the 0 % and the 1·0 % EPA diets, increased vacuolisation was observed in five of the ten fish examined per diet, and of these three were scored ‘2’, which indicated severe and extensive changes. In the remaining dietary groups, one to four fish were given score ‘1’. Among these, the highest numbers of fish with score ‘0’ were found in diet groups 1·0 % DHA and 2·0 % DHA, with nine and eight fish classified as normal, respectively. Fig. 9(a–d) shows the details of mid-intestinal enterocytes from different dietary groups.
Discussion
Fish growth and survival
Relatively limited knowledge exists about the EPA and DHA requirement in Atlantic salmon in the seawater phase. A requirement study was therefore performed, where the basal diet was fishmeal and fish oil free, thereby containing practically no EPA and DHA, and this basal diet was gradually supplemented with increasing dietary levels of the EFA EPA and DHA either alone or in a 1:1 mixture. We also included a control group fed with feed approximating commercial feed composition in order to monitor whether the experimental groups had a satisfactory growth rate compared with a commercial diet. In our study, all dietary groups showed acceptable growth rates relative to the control diet. Nevertheless, all experimental groups supplemented with EPA and/or DHA had higher growth rates than the deficient group (0 % diet). This suggests that EFA requirements for normal growth are met by approximately 0·5 % of these EFA in the diet. This is in agreement with other studies showing similar requirements in Atlantic salmon( Reference Ruyter, Røsjø and Einen 3 , Reference Emery, Norambuena and Trushenski 9 , Reference Ruyter, Røsjø and Einen 27 ). No significant differences in survival of the dietary groups were found in our study. This is in agreement with the study by Emery et al.( Reference Emery, Norambuena and Trushenski 9 ), but in contrast to an early study from the freshwater phase, showing reduced survival by EFA deficiency( Reference Ruyter, Røsjø and Einen 3 , Reference Ruyter, Røsjø and Einen 27 ). It is probably not optimal to estimate requirements based primarily on the growth performance and survival rate alone( Reference Torstensen, Ruyter and Sissener 28 ). Several additional aspects must be considered when evaluating nutritional requirements to foresee possible long-term health impacts related to EFA deficiencies.
EPA and DHA influence net production and apparent retention of fatty acids differently
Apparent retention values above 100 % for EPA, DPA and DHA in the 0 % dietary group pointed to a net production of these FA in the deficient group. The stimulation of the n-3 FA biosynthetic pathway in Atlantic salmon has been previously reported and, in agreement with these results, the capacity is markedly enhanced by EFA deficiency( Reference Ruyter and Thomassen 29 ). This assumption is further supported by the general higher abundance of mRNA transcripts encoding desaturases and elongases found in the deficient group in this study.
However, the apparent retention of EPA was approximately 40 % in all diets with n-3 VLC-PUFA dietary inclusion above 0·5 % regardless of the FA included in the diet (EPA and/or DHA). The low deposition efficiency of EPA has been reported previously, and is probably due to the fact that EPA is directed to serve different metabolic needs, such as conversion to DHA, synthesis of eicosanoids and production of energy through β-oxidation( Reference Thomassen, Rein and Berge 11 , Reference Glencross, Tocher and Matthew 19 , Reference Rosenlund, Torstensen and Stubhaug 30 , Reference Sanden, Stubhaug and Berntssen 31 ). On the contrary, apparent retention values over 100 % for both DPA and DHA were observed in the EPA dietary group, regardless of the dietary dose of EPA. This indicates that dietary EPA is to a large extent converted to DPA and DHA when the latter FA is not available in the diet. The retention efficiency of DHA was decreased by its dietary presence, which is consistent with other feeding studies( Reference Glencross, Tocher and Matthew 19 , Reference Glencross and Rutherford 32 ). In accordance with previous studies, a reduction in the apparent retention of n-3 VLC-PUFA by the availability of these FA has been ascribed to be a negative-feedback loop, wherein DHA might be the central player in the regulation of the n-3 FA biosynthetic pathway( Reference Thomassen, Rein and Berge 11 ).
Among nutritional, hormonal and physiological factors, the level of dietary FA has been recognised as one of the factors regulating the PUFA biosynthetic pathway through regulation of mRNA transcript abundance of genes encoding relevant enzymes. In this study, reduced dietary n-3 VLC-PUFA content consistently resulted in an increase in mRNA transcript abundance of desaturases in the liver. The same response has been reported previously in salmon fed diets in which high levels of fish oil were replaced by vegetable oils( Reference Rosenlund, Torstensen and Stubhaug 30 , Reference Zheng, Torstensen and Tocher 33 ). In general terms, DHA, especially when combined with EPA, seems to have a greater influence in down-regulating desaturases, whereas EPA has a higher capacity to down-regulate elongases. In contrast, it has been reported that inhibition of desaturase and elongase transcription is an effect elicited by DHA that dietary EPA alone cannot produce( Reference Thomassen, Rein and Berge 11 , Reference Betancor, Sprague and Usher 14 ). It should be noted, however, that other factors might explain the discrepancy in the results between the present study and the aforementioned studies, including a too short feeding trial( Reference Betancor, Sprague and Usher 14 ) or maintenance of salmon in freshwater( Reference Thomassen, Rein and Berge 11 ).
Response of different tissues to lack of EPA and DHA in the diet
Our study showed that different organs and tissues responded differently when subjected to diets with reduced content of EPA or DHA. Overall, EPA tissue levels were less conserved with decreasing dietary EPA than DHA tissue levels when dietary DHA was reduced. This is in agreement with the previously reported selective deposition of DHA over EPA( Reference Tocher 34 ) and suggests different biological roles, and consequently needs for these FA.
Tissues that normally have relatively low levels of EPA and DHA, such as the skin and the intestine, also faced a major reduction in their levels when fish were fed diets lacking these EFA, indicating the need to elucidate possible health impacts. In this study, a morphological evaluation of the intestine indeed indicated a systematic response to dietary EPA and DHA content in the enterocytes of mid-intestinal mucosa. This part of the intestine is recognised as an important location for lipid absorption. The histopathology indicated accumulation of lipids in the supra-nuclear cytoplasm of enterocytes, although any further identification of the content of the vacuoles would require use of methods beyond basic light microscopy. However, the observations showed some similarities to the histology of certain mammalian disorders associated with impaired lipid absorptions and EFA deficiency( Reference Peretti, Sassolas and Roy 35 ). The similar histopathological observations between species indicate the involvement of related mechanisms leading to lipid malabsorption and accumulation, even though the pathways of the conditions may be different. In our experimental fish, DHA deficiency is probably the primary causal factor as the most severe symptoms were observed in the 0 % dietary group and the 1·0 % EPA group. At the same time, less severe symptoms (low grade, a few affected fish) were observed with 1·0 and 2·0 % DHA supplementation. Thus, it can be suspected that DHA supplementation has a stronger ability to support normal intestinal structure and function than EPA supplementation at corresponding levels. A combined dietary EPA+DHA level of 2·0 % (1 % of each), comparable with that of the commercial-like control diet, was sufficient to alleviate the deficiency symptoms, whereas 1·0 % EPA+DHA was not. These results establish mid-intestinal mucosa as a sensitive indicator tissue for evaluation of dietary requirements for EPA and DHA. Histological evaluation of muscle, heart and liver did not show any specific pathology or any other systematic variation in tissue morphology.
PL are the major components of cellular membranes and their integrity is critical for cell viability. Alterations in their FA composition can affect the physico-chemical properties of the membranes and have profound effects in cell function( Reference Tocher 36 ). The PL fraction from the heart of the fish fed the 0 % diet in our trial seemed to be able to selectively retain higher levels of DHA, than the liver and the muscle. The ability to maintain the integrity of the PL composition has been reported to be a valuable criterion to determine feasibility of nutritional replacements in fish( Reference Benedito-Palos, Navarro and Sitja-Bobadilla 37 ). In general terms, in our study, a decrease in the n-3 VLC-PUFA levels was paralleled by an increase in the n-6 FA 20 : 4n-6 and 20 : 3n-6 in both NL and PL in all tissues studied. The absence of dietary n-3 VLC-PUFA competing for desaturases and elongases is known to favour the conversion of 18 : 2n-6 to 20 : 4n-6 and, to a lesser extent, 20 : 3n-6. These FA are known to be potent precursors of pro-inflammatory eicosanoids( Reference Bell, Ashton and Secombes 38 ) and have been reported to interact with fish immune response( Reference Montero, Mathlouthi and Tort 39 ). The membrane PL of the liver and heart seemed to be more affected than the muscle when fish were fed the 0 % diet, presenting the highest relative increase in the pro-inflammatory FA 20 : 4n-6.
In this study, and as has been extensively reported before( Reference Ruyter, Moya-Falcón and Rosenlund 6 , Reference Turchini, Torstensen and Ng 40 ), the NL fraction reflected the composition of the diet regardless of the tissue to a larger extent than the PL fraction did. However, some differences were observed and related to the specific characteristics of the tissue. After 26 weeks of feeding salmon with the 0 % diet, the amount of n-3 VLC-PUFA in the NL fraction of muscle was nearly exhausted. The NL fractions of the liver and heart from fish under the deficient diet were able to maintain higher percentages of DHA, even though the liver from fish fed the deficient diet showed major changes in its NL FA composition, characterised by an increase in 20 : 3n-6 and 20 : 4n-6. In a previous study( Reference Benedito-Palos, Navarro and Kaushik 41 ), the difference in the FA composition of the NL fraction of the liver compared with that from muscle, adipose tissue and brain was related to higher levels of 20 : 3n-6 and SFA (16 : 0, 18 : 0 and 22 : 0), which was linked to the high hepatic lipogenic activity in fish. Accordingly, in this study, clear differences in NL composition between liver and heart and muscle were detected, with the NL fraction of the liver correlating to the aforementioned FA 20 : 3n-6 and the SFA 18 : 0. Is noteworthy that the NL fraction of the muscle seemed to be more alike regardless of the dietary treatment and enriched in 18-C FA, such as 18 : 1n-9, 18 : 2n-6 and 18 : 3n-3, probably indicating their lower metabolic activity compared with those from the liver and heart.
The interconversion between EPA and DHA in different tissues
The capacity for metabolic interconversion from EPA to DHA and DHA to EPA in fish is an interesting aspect in light of the fact that some new alternative n-3 sources are rich in either EPA or DHA. Our study demonstrated that dietary EPA was to a large extent converted to DHA in all the EPA dietary groups lacking DHA. In accordance with the well-known metabolic and physiological properties of the different organs, the relevance of this conversion appears especially high in the liver followed by the intestine. Both liver and intestine have been recognised as metabolically relevant organs involved in VLC-PUFA synthesis( Reference Betancor, Sprague and Sayanova 16 , Reference Tocher 34 , Reference Betancor, Howarth and Glencross 42 , Reference Monroig, Zheng and Morais 43 ). Indeed, in the present study, these tissues had almost tripled their DHA content when fish were fed the 1·5 % EPA diet in the case of the intestine and the 2·0 % EPA diet in the case of the liver, even though the groups contained the same dietary level of DHA and very similar level of 18 : 3n-3. In agreement with our results, an active conversion from EPA to DHA in salmon liver has been previously reported( Reference Thomassen, Rein and Berge 11 , Reference Betancor, Sprague and Usher 14 ). The increment in the relative DHA content of the heart and brain was more modest than that from the other tissues, probably representing the already-mentioned tight control in the FA composition of these organs. Muscle and skin showed a linear increase in DHA content as EPA became available in the diet. Despite being organs with less amount of DHA in relative terms, both tissues doubled their DHA content, going from levels of approximately 2·4 % DHA to 5·3 % when fish was fed the 0 % diet and the 2·0 % EPA diet, respectively. A previous study testing feeds supplemented with an EPA-enriched oil from a transgenic oilseed crop did not find an increase in DHA content in fish flesh( Reference Betancor, Sprague and Usher 14 ). However, that experiment only lasted for 7 weeks, which has been reported to be too short for tissue EPA and DHA levels to stabilise relative to diet at such low dietary levels( Reference Rosenlund, Torstensen and Stubhaug 30 ).
In the DHA groups lacking dietary EPA, a moderate increase in EPA was observed in all the tissues studied, which may indicate retro-conversion of DHA to EPA. Retro-conversion from DHA to EPA has been shown earlier in salmon hepatocytes( Reference Stubhaug, Tocher and Bell 44 ), being enhanced by EFA deficiency( Reference Ruyter and Thomassen 29 ). In the present study, all the diets contained a constant level of 18 : 3n-3, and therefore it would be expected that increasing dietary levels of DHA would reduce the capacity to convert 18 : 3n-3 to longer FA. However, the EPA content in all the tissues analysed was increased with increasing dietary content of DHA and relative absence of EPA, indicating some degree of retro-conversion or transport from other tissues not included in this study. Further studies to clarify the retro-conversion capacity of Atlantic salmon should be performed to determine whether EFA requirements could be met only by the addition of dietary DHA. Nevertheless, the modest retro-conversion from DHA to EPA when EPA is not available in the diet compared with the high capacity that the fish seem to have to elongate EPA to DHA when DHA is almost depleted in the diet might reflect differences in the nutritional requirements of these two FA. Indeed, distinct requirements as well as roles for these two FA have been recently suggested( Reference Emery, Norambuena and Trushenski 9 , Reference Glencross, Tocher and Matthew 19 ). DHA is critical as a structural component to PL, whereas EPA has been recognised as an essential bioactive FA rather than simply structural in nature( Reference Rosenlund, Torstensen and Stubhaug 30 , Reference Sissener, Torstensen and Stubhaug 45 ).
Conclusions
Dietary VLC n-3 FA deficiency did not influence fish mortality, but the 0 % dietary group experienced a reduction in growth compared with fish fed diets supplemented with EPA and DHA. All tissues studied showed that the different diets resulted in considerable changes in their FA composition. Overall, tissue FA composition was the result of the combination of diet composition and endogenous metabolism. This study demonstrated that the metabolic conversion from EPA to DHA is governed by a combination of substrate availability (EPA) and feedback inhibition by the product (DHA), being especially relevant in the liver and intestine. In line with this, the stimulation of the hepatic n-3 FA biosynthetic pathway at a transcriptional level was observed at low dietary levels of EFA. The morphological evaluation of skeletal muscle, liver and heart did not reveal any alterations related to diet. However, the mid-intestine of fish receiving the 0 % diet and fish receiving diets supplemented only with EPA consistently presented vacuolisation of enterocytes. These findings suggest that that this tissue could be an early indicator of EFA deficiency. Our study demonstrated that the evaluation of growth and survival solely can underestimate the nutritional requirement of EPA and DHA. EFA deficiencies during early life stages may influence fish performance and their ability to deal with challenging conditions, an issue outside the scope of this project but currently under investigation.
Acknowledgements
Thanks to Magny Sissel S. Thomassen and Målfrid Tofteberg Bjerke for their skilful technical assistance.
This work was carried out with support from the Norwegian Research Council (grant no. NFR 224913). The Norwegian Research Council had no role in the design, analysis or writing of this article.
B. R. designed and planned the trials; B. H. and T. S. formulated diets; O. H. R. produced the diets; B. R., M. B., T-K. Ø., G. B. and R. L. participated in the samplings; G. M. B. and C. V. carried out the histology part of the study; M. B. and R. L. performed the fatty acid analysis; and M. B. was responsible for gene expression analysis, data process and writing of the manuscript. All the authors participated in the writing of the manuscript and approved the final version.
The authors declare that there are no conflicts of interest.
Supplementary material
For supplementary material/s referred to in this article, please visit https://doi.org/10.1017/S0007114516004396


