


1 Introduction
The flow law of ice is of primary importance in modelling the movement of ice sheets and glaciers. Although the flow law adopted at present is that derived from the creep experiments of laboratory grown polycrystalline ice, it is desirable to derive the law from experiments using real ice taken from ice sheets or glaciers. Extensive experiments for this purpose were carried out by Reference Higashi and ShojiShoji and Higashi (1979) with Antarctic deep ice-core samples obtained at Byrd station. Experiments were carried out in a pressure tank as well as at atmospheric pressure, and the results showed that the generally accepted power law held for the ice cores as it did in the case of laboratory-grown polycrystalline ice. However, it was shown also that, under hydrostatic pressure, the ice cores seemed to be harder (by several tenths of MPa) than when tested at atmospheric pressure.
The present authors continued studies of the same type, varying the temperatures used in the experiments. They found that the apparent hardening of deep core ice with single maximum fabric under high hydrostatic pressure at comparatively high temperatures can be attributed to the change of the fabric caused by recrystallization occurring during the test (N Azuma and A Higashi unpublished).
Success in drilling through the whole depth of the Greenland ice sheet at Oye 3 in 1980 and 1981 provided a good opportunity to extend our work with fresh cores of different origin. We carried out experiments on the stress-strain relationship using several specimens from different depths. Pressures during the experiments were the same as the in situ hydrostatic pressures at the depths from where individual ice samples were obtained. The present work supplements the mechanical tests carried out immediately after the retrieval of cores at the drilling site by Reference Shoji and LangwayShoji and Langway (1982). We intend to carry out laboratory experiments, changing various conditions such as ambient pressure, temperature and strain-rate. Although the work is still in progress, preliminary results are presented and discussed in this paper.
2 Experimental Procedures
2(a) Specimen preparation
Ice cores from depths of 797, 1801, 900 and 1000 m were used in the present experiments. Although the grain size and the ice fabric had already been studied thoroughly over the entire 2037 m depth (Reference Herron, Langway and BruggerHerron and others 1982), we examined these particular samples by taking thin section photographs and making fabric diagrams (Fig.1). All fabric diagrams exhibit the single maximum although only weakly at the 797 m depth. The average grain area is approximately 0.08 cm2 for the samples from depths of both 1800 and 2000 m, but was larger (0.26 cm2) for the 797 m sample and much smaller for the 1900 m sample. Characteristics of the core samples are tabulated in Table I. The c-axis verticality designated by Φ (1/4) in the table is defined as the angle from the vertical axis in which a quarter of the total number of c-axes are included (Reference Russell-Head and BuddRussell-Head and Budd 1979). The large angle for the 2000 m sample is derived from the deviation of approximately 15° of the average direction of c-axes from the core axis caused by the inclination of the core at this depth.
(a) Photographs of horizontal thin sections of the samples of ice core used in experiments, taken under crossed polaroids. Core number and depth are indicated under each photograph. (b) Fabric diagrams of the same samples as in (a). Centre of the diagram coincides with the core axis. Number of examined crystals and the divisions of contour lines are indicated under individual diagrams.
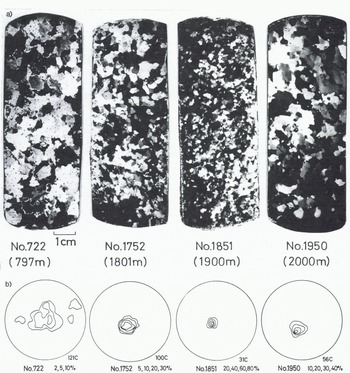
Textural Characteristics of Dye 3 Deep Cores

Specimens of size 20 × 20 × 80 mm were cut from the core so that their long axes made a 45° angle with the axis of the individual core. Since the direction of the single maximum of the c-axes in ice crystals is approximately parallel to the individual core axis, the plane of the maximum shear stress in the specimen coincided with the horizontal plane in the ice sheet within an error of 15° when the uniaxial compression tests were carried out with the specimens cut as above.
2(b) Uniaxial compression tests
Uniaxial compression tests were carried out using the same testing machine with a constant crosshead speed as previously reported (Reference Higashi and ShojiHigashi and Shoji 1979), with some improvements in the method of measuring the stress. The machine was installed in a pressure tank in which the inner hydrostatic pressure could be kept as high as 100 MPa using silicone oil as a transmitting medium through a hydraulic pump. Stress-strain curves were obtained on a chart recording of the stress measured by a wire strain-gauge load cell attached to the machine inside the pressure tank. The temperatures of the experiments were varied by changing the air temperature in the box in which the tank was placed. In the present work, it was kept at −16.0 ± 0.2°C except for test no.11. The crosshead speed was selected between 10−9 and 10−8 m s−1, which corresponded to a strain-rate for the specimen of the above-stated length of approximately 10−8 to 10−7 s−1.
The lower end of an individual specimen was frozen to the stationary lower plate of the testing machine while the upper end was set free under the movable upper plate. The specimen thus installed in the machine was subjected to a hydrostatic pressure of 40 MPa at a temperature of −16°C for at least 40 h before the test started in order to allow the segregated air bubbles to re-enter the ice lattice. Then the ambient pressure in the tank was gradually brought to the same value as that of the original depth of the individual specimen and was kept constant throughout each experiment.
Experiments at various strain-rates were conducted using the same specimen, by changing the crosshead speed, after the stress-strain curve at a certain strain-rate exhibited a saturated stress value. The experimental procedures for various samples can be identified in Table II in which the experimental results are also shown. When a series of experiments was completed, the hydrostatic pressure in the tank was decreased slowly to the atmospheric pressure at the rate of 1 MPa h−1 to avoid cracking the specimen. Then the specimen was removed from the testing machine and a thin section prepared for analysis.
Conditions and Results of Uniaxial Compression Tests

2(c) Thin-section analysis
The crystal c-axis orientations were determined using a Rigsby-type universal stage and results were plotted on a lower hemisphere Schmidt net projection. The fabric diagrams shown in Figure 1 were obtained from thin-section specimens cut horizontally from the samples before the mechanical tests were performed. The diagram in Figure 5(b) was obtained from a vertical thin section of the specimen after test no.11 was finished.
(a) Stress-strain curve for test no.11 during which the temperature was raised from −15.8 to −2.8° C The original sample for the test is from 2000 m depth which had the single maximum fabric.
(b) Diamond pattern of the ice fabric produced after test no.11. P is the average direction of the single maximum c-axes before the test. C is the compression axis. Contours are of 2, 4, 6, 10, 15 and 20% from the outside of the loops.

The average grain size was measured by two methods in this study. One was the usual way, by dividing the average grain area (obtained from the cross-sectional area of a photograph of a thin section) by the number of grains included in it. Results of this method for each sample (before the mechanical tests) are shown in Table I. The other method was the mean linear intercept method (LIM). This method involves counting the number of grain boundaries intercepted on several random traverse lines made on a thin-section photograph. The result is given by the total length of traverse lines divided by the counted numbers of intercepted grain boundaries, and identified as the mean grain diameter L.
The distance D between two opposite sides of the hexagon of which the area is equal to the average grain area A, or D =1.075
![]() , can be another measure of the linear dimension of grains. If the two dimensional polycrystalline aggregate consists of regular hexagons of equal area, then L is equal to D. The ratio L/D for polycrystals consisting of irregularly-shaped grains of different size should be less than unity, and could be an indicator of the irregularity of grain boundaries.
, can be another measure of the linear dimension of grains. If the two dimensional polycrystalline aggregate consists of regular hexagons of equal area, then L is equal to D. The ratio L/D for polycrystals consisting of irregularly-shaped grains of different size should be less than unity, and could be an indicator of the irregularity of grain boundaries.
3 Results of Experiments
3(a) Stress-strain-rate relations
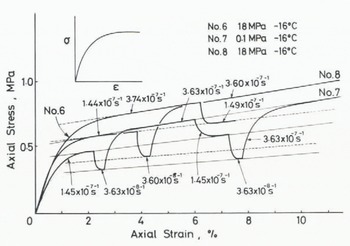
Results of the uniaxial compression tests carried out under various hydrostatic pressures (corresponding to the original depths of individual cores) are presented in Table II. Except for tests (nos.6, 7 and 8) with the 1900 m depth sample, the stress-strain curves exhibited the usual type of saturation as shown in an inset of Figure 3. The stress increased with increasing strain but it gradually levelled off and kept an almost constant value after the strain reached 2 to 3%. Values of the maximum stress in Table II are obtained as those saturated values in the stress-strain curves.
Stress-strain curves for the 1900 m depth sample. Unlike the ordinary saturation-type curve (inset), the work-hardening effect appeared in the stress-strain curves. Changes of the strain-rate during the test of one specimen are shown in the figure. Details in text.
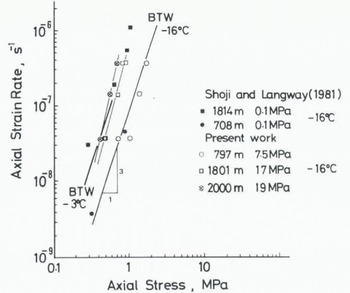
The double logarithmic plots of the relationships between the maximum stress σ and the strain-rate
![]() for each experiment are shown in Figure 2. Straight lines drawn through the plotted points for samples of different depths give slightly different values of the power n for the flow law of ice
for each experiment are shown in Figure 2. Straight lines drawn through the plotted points for samples of different depths give slightly different values of the power n for the flow law of ice
![]() = Αση, approximately 4.3 for the sample taken from a depth of 2000 m, and 3.7 for the 1800 m sample. Data for the 797 m sample yield a straight-line relationship which is almost identical to that obtained by Reference Barnes, Tabor and WalkerBarnes and others (1971) for the artificially-grown polycrystalline ice at −16°C (indicated by BTW with n = 3 in Fig.2). Reference Shoji and LangwayShoji and Langway’s results (in press) for the 708 m sample are also on the same line. The straight lines for the 1800 and 2000 m samples deviate to the smaller side of the stress from the BTW line by several tenths of MPa. This implies that the ice samples with strong single maximum fabric are much softer than those with random fabric or weakly concentrated fabric. This tendency was also shown by recent results of experiments carried out under atmospheric pressure at the drilling site immediately after the cores were recovered (Reference Shoji and LangwayShoji and Langway in press).
= Αση, approximately 4.3 for the sample taken from a depth of 2000 m, and 3.7 for the 1800 m sample. Data for the 797 m sample yield a straight-line relationship which is almost identical to that obtained by Reference Barnes, Tabor and WalkerBarnes and others (1971) for the artificially-grown polycrystalline ice at −16°C (indicated by BTW with n = 3 in Fig.2). Reference Shoji and LangwayShoji and Langway’s results (in press) for the 708 m sample are also on the same line. The straight lines for the 1800 and 2000 m samples deviate to the smaller side of the stress from the BTW line by several tenths of MPa. This implies that the ice samples with strong single maximum fabric are much softer than those with random fabric or weakly concentrated fabric. This tendency was also shown by recent results of experiments carried out under atmospheric pressure at the drilling site immediately after the cores were recovered (Reference Shoji and LangwayShoji and Langway in press).
Double logarithmic plots of the relationship between the strain-rate and the maximum stress in the stress-strain curve. BTW is the relationship obtained for randomly oriented artificially-grown polycrystalline ice by Reference Barnes, Tabor and WalkerBarnes and others (1971).
3(b) Work-hardening effect of the sample taken from a depth of 1900 m
In the case of experiments with the 1900 in sample, the stress-strain curve did not reach saturation: the stress continued to increase at constant rate with increasing strain as in the case of the work-hardening of metals and other materials. When the strain-rate was changed during the test, after the work-hardening rate became constant, a new stress-strain curve was built up after a short pause of the stress relaxation as shown in Figure 3. The work-hardening rate obtained as the inclination of the linear part of the curve in Figure 3 was approximately the same for the same strain-rate Irrespective of specimens, ambient pressures and orders of the strain-rate change.
From the stress-strain curve shown by bold solid lines in Figure 3 for test no.7 under atmospheric pressure, we can derive three different imaginary stress-strain curves corresponding to three different strain-rates: 3.63 × 10⁻⁸ s−1, 1.45 × 10⁻⁷ s−1 and 3.63 × 10⁻⁷ s−1, shown by thin solid lines in the figure. Similarly, combining the results of tests 6 and 8 both under a hydrostatic pressure of 18 MPa, three other imaginary stress-strain curves are indicated by broken Unes, corresponding to the same three strain-rates as above.
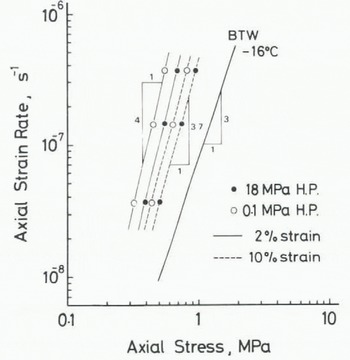
Intersections of these imaginary stress-strain curves with the vertical axis at a certain value of the strain in Figure 3 provide the stress value to be related to the strain-rate, as is the maximum stress in other cases. Taking the values at 2 and 10% strains, relationships between the strain-rate and the stress are obtained as shown in Figure 4. Linear relation-ships in the log-log plots indicate the power law again with a value of the exponent of approximately 4. The strain-rate at the same stress is twice as high at atmospheric pressure than under a hydrostatic pressure of 18 MPa, that is to say, the 1ce becomes softer when it is tested at atmospheric pressure. Figure 4 also shows that the ice appears to be harder at the 10% strain, as would be expected from the work-hardening effect.
Double logarithmic plots of the relationship between the strain-rate and the stress at 2 and 10% strain for imaginary stress-strain curves derived in Figure 3.
3(c) Effect of temperature rise
The temperature of the experiments was maintained at −16 ± 0.2°C in tests 1 to 10, but was raised to −2.8°C after the stress-strain curve reached saturation in test no.11. Due to the thermal expansion of the silicone oil in the tank, the pressure also rose to 30.9 MPa. This inevitable pressure change might have affected the stress-strain curve, but major effects were caused by temperature change, as will be discussed later. Change of the stress-strain curve in this test as well as those of temperature and pressure are shown in Figure 5(a). With a strain-rate of 3.62 × 10⁻⁸ s−1, the axial strain in the abscissa is converted to time, as indicated along the top of the figure, in order to observe the time variation of temperature and pressure. The stress dropped for a while when the temperature was raised to −2.8 from −15.8°C, then rose up again to the same level after approximately 150 h, and gradually dropped to three-quarters of the maximum value. Some vibrations were recorded during this drop, and even at the almost stable state after a long period of straining.
Vertical thin sections of the specimen were examined under a Rigsby stage after test no.11. The fabric diagram of the specimen shown in Figure 5(b) clearly indicates that it changed from the single maximum to the diamond pattern. This change must be caused by recrystallization occurring during the deformation at high temperature. Photographs of vertical thin sections taken under crossed polaroids of the 1900 and 2000 m samples before and after tests nos. 6, 9 and 11 are shown in Figure 6. Elongation of grains after nos 6 and 9 as well as growth of interlocked grains after no.11 are clearly shown.
Vertical thin-section photographs of specimens taken before and after experiments: (a) 1900 m depth sample before test, (b) after test no.6, (c) 2000 m depth core before test, (d) after test no.9, (e) after test no.11 (note recrystallized grains).

Circular diagrams in Figures 7(a) and (b) show the orientation dependence of the grain size measured by the linear intercept method. The plane of the diagram coincides to the planes of the photographs in Figure 6 and contains the compression axis (vertical direction) and the slip direction. The direction indicated by MBP is the section of the mean basal plane, defined as the plane perpendicular to the mean direction of c-axes of the type of single maximum. Planes of maximum shear determined in a specimen at 45° inclination from the compression axis are expressed by the symbol MSP. In the case of test no.6 on sample no.1851 from 1900 m depth, MBS exactly coincided with one of the MSP. On the other hand, in the case of nos.9 and 11, or with sample no.1950 from 2000 m depth, MBP deviated 15° from one of the MSP because the core axis deviated approximately 15° from the vertical axis.
Circular diagrams to show preferred direction of elongation of crystal grains occurring during the mechanical tests: (a) before and after test no.6 of the 1900 m depth sample, (b) before and after test nos.9 and 11 of the 2000 m depth sample. MBP is the section of the plane perpendicular to the mean direction of c-axes and MSP is the section of the plane of maximum shear in the specimen.

The grain diameter L was determined by the linear Intercept method along different directions with 10° intervals on those photographs in Figure 6. Each value of L for different directions was normalized by dividing it by the average value of whole L. If the shape of the grain has no tendency to elongate in certain directions, plots of the normalized grain diameter on the diagram should make a loop approximately a circle of unit radius. The solid line in Figure 7(a) which connects the normalized grain diameters in 18 different directions for a specimen before test no.6 shows an almost circular loop. After the deformation of 5.8% total strain, this shape became elongated in the direction near to that of MBP. In the case of sample no.1950 from 2000 m depth, the sample before the tests already had a tendency to elongate 1n the direction of MBP and this was emphasized after the deformation of test no.9 (total strain 4.3%). In the case of test no.11, associated with the temperature rise as described in the preceding subsection, the grains became appreciably elongated 1n the direction of one of the MSP near to the MBP.
Textural changes observed in tests nos. 6, 9 and 11are tabulated in Table III. Irregularity of the shape of grains can be given by L/D as described in sub-section 2(c). In accordance with the interlocked structure of recrystallized grains as shown in Figure 6, appreciable change of L/D after test no.11 can be seen in this table. The single maximum of the ice fabric did not change in tests at −16°C, even when such elongation of grains occurred as in test no.9.
Textural Changes of Deformed Specimens of Dye 3 Cores

Changes of the number of included air bubbles and air hydrates observed by a microscope before and after compression in tests nos.8 and 9 are tabulated in Table IV in which they are both classified by the diameter. It can be seen in Table IV(b) that the total number as well as the volume of air hydrates increased after the tests, particularly in the case of test no.8 in which the total annealing time or total strain was large. The total volume of air bubbles decreased considerably after the tests because the air re-entered the crystal lattice by an applied hydrostatic pressure. However, many small-sized bubbles appeared in compensation for the disappearance of large-sized ones, as can be seen in Table IV(a).
Change in the Number of Bubbles in 1 cm3 of Deformed Specimens of Dye 3 Cores (B: before each test, A: after each test)

Change in the Number of Air Hydrates in 1 cm−3 of Deformed Specimens of Dye 3 Cores (B: before each test, A: after each test)

4 Discussion
As was stated in section 3, ice samples from the 1800, 1900 and 2000 m depth, all with strong single maximum fabrics, were much softer than those with random or weakly concentrated fabrics. The enhancement factor for the strain-rate is almost 10 as can be seen in Figures 2 and 4. The power n for the flow law
![]() = A σn was obtained from the Inclination of straight lines in Figure 2 and was 4.3 for the 2000 m sample and 3.7 for the 1800 m one. Despite the work-hardening effect, the 1900 m sample exhibited the power-law type relationship between the strain-rate and the stress at a certain value of strain. As shown in Figure 4, the power n changed with increase of strain, becoming n = 4 for 2% strain and n = 3.7 for 10% strain.
= A σn was obtained from the Inclination of straight lines in Figure 2 and was 4.3 for the 2000 m sample and 3.7 for the 1800 m one. Despite the work-hardening effect, the 1900 m sample exhibited the power-law type relationship between the strain-rate and the stress at a certain value of strain. As shown in Figure 4, the power n changed with increase of strain, becoming n = 4 for 2% strain and n = 3.7 for 10% strain.
Although it is difficult to say whether this difference of the value of n between 4.3 and 3.7 has any significant meaning, the power n is certainly larger for ice samples from the depths between 1800 and 2000 m than the usually accepted value of 3 for the flow law. In view of the fact that n = 3 was derived from experiments using randomly-oriented artificially-grown polycrystalline ice, these larger values of n could be attributed to the single maximum fabric which is common for the three samples from 1800, 1900 and 2000 m depths.
With the use of n = 4, the flow-law parameter A is calculated as 1.23 × 10−s s_1 MPa−4 from the relationship shown in Figure 8 between the octahedral strain-rate and the octahedral shear stress converted from that shown in Figure 2. If the present data are forced to fit a line of n = 3, it is approximately 1x 10⁻⁶ s−1 MPa−3, ten times larger than (2.4 – 4.8) × 10−7 s−1 MPa−3 obtained for randomly-oriented polycrystalline ice (Reference Paterson and BuddPaterson and Budd 1982). This agrees with the enhancement factor stated at the beginning of this section. Due to the large value of n, the straight lines extrapolated from our experimental results approach asymptotically the extrapolated line of BTW or the line of Reference Russell-Head and BuddRussell-Head and Budd (1979) at the lower strain-rate, as shown in Figure 8. In the range of strain-rates of the order of 10−10 s−1, the enhancement factor is reduced to approximately 4 which agrees with the maximum value obtained for a single maximum fabric ice from Law Dome, Antarctica (Reference Russell-Head and BuddRussell-Head and Budd 1979).
Relationship between the octahedral strainrate and the octahedral stress converted from present experimental results. Reduced results for −16°C of Reference Barnes, Tabor and WalkerBarnes and others (1971) and of Reference Russell-Head and BuddRussell-Head and Budd (1979) are included.

Fabric studies of deep ice cores drilled in Greenland and Antarctica have revealed that ice with a strong single maximum fabric exists in layers of more than several hundred metres thickness in ice sheets.In view of the relative importance of these layers for the flow of ice sheets, those features of the mechanical properties described above should be considered thoroughly in the development of precise modelling of ice sheet flow. The origin of the enhancement factor is primarily explained by the anisotropy of mechanical properties of ice, i.e. easy glide on the basal plane of single-crystal ice. However, considering that the ice with single maximum fabric used in the present experiments is from the depth of Wisconsin age ice, the contents of dust and chemical impurities which are now known to be much larger than those of Holocene ice (Reference Hammer, Dansgaard, Neftel, Kristinsdottir and JohnsenHammer and others 1982) should be examined as possible sources of the above characteristics.
The work-hardening effect appearing in samples at the 1900 m depth could be explained by the smaller grain size than at other depths. Polycrystalline ice which has a single maximum fabric deforms easily when a specimen is prepared as was the case in this study, because the basal glide takes place preferentially owing to the maximum shear stress exerted on the basal plane in every grain of ice. The basal glide which dominates glides on other crystallographic planes in ice is caused by the preferential movement of dislocations on the basal plane. However, unlike the case of a single-crystal specimen, moved dislocations pile up at grain boundaries in the polycrystalline ice. Piled-up dislocations impede further movement of dislocations and give rise to work-hardening. It can be inferred, therefore, that polycrystalline ice with smaller grain size has more obstacles to the movement of dislocations per unit volume of a sample than that with larger grain size. As can be seen 1n Table I, the 1900 m depth sample has a much smaller grain size than two other samples from 1800 and 2000 m depth. Also for this effect, the chemical characteristics of Wisconsin ice might be considered.
Formation of the diamond pattern from the single maximum in ice fabric during test no.11 was clearly observed, as shown in Figure 5(b). It can be inferred from Figure 5(a) that the diamond pattern was formed in recrystallized grains produced by the rise of temperature from the sample of 2000 m depth. Since the recrystallized polycrystalline ice should have less concentration of c-axes orientations, the maximum stress to be reached under a certain strain-rate should be larger than that for the ice of the single maximum. Actually the value of the stress at 0.42 MPa coincides with that corresponding to the strain-rate 3.62 × 10⁻⁸ s−1 on the line of Reference Barnes, Tabor and WalkerBarnes and others (1971) at −3°C in Figure 2. Rise of stress from the temporary drop due to the temperature rise can be understood as a consequence of the recrystallization.
The subsequent process of dynamic recrystallization according to increasing strain caused the drop in stress, because of the selective nucleation and growth of crystals oriented to favour the formation of the diamond pattern. Vibrations appearing on the stress-strain curve can be explained as resulting from complex accommodations of the dynamic recrystallization and work-hardening due to further straining. Interlocked structures of grains after test no.11, as shown in Figure 6(e) could have been formed in such complex processes.
Change of the ice fabric from the single maximum to the diamond pattern was observed in the deep core drilled at Byrd station, Antarctica. It occurred at approximately 1800 m depth where the temperature was about −12°C. In the present Dye 3 core, the single maximum continued down to the bottom where temperature was estimated to be about −12°C. Probably the temperature of −2.8°C in the present experiment was much higher than the critical temperature above which the recrystallization occurs at a certain strain accumulation. It will be interesting and useful to determine the critical temperature as a function of the strain in the same way as was used in the present study.
As was stated in section 3(b) the ice from 1900 m depth was slightly softer when tested at atmospheric pressure than when tested under a hydrostatic pressure of 18MPa. This character which seems contradictory to the generally accepted concept of the effect of hydrostatic pressure on the creep rate of ice (Reference RigsbyRigsby 1958) could be attributed to the presence of air bubbles and air hydrates in the ice. As can be seen in Table IV, numbers and volumes of air bubbles and air hydrates changed appreciably after specimens were subjected to hydrostatic pressure.
This work supplements studies being carried out by Dr H Shoji and Dr C C Langway Jr at the Ice Core Laboratory, State University of New York at Buffalo. They are supported by the US National Science Foundation, Division of Polar Programs. Financial support by the Ministry of Education, Culture and Science of the Japanese government is acknowledged.


