


Non-technical Summary
Punctuated equilibria is a widely known and intensely studied hypothesis about the evolution of species in the fossil record. The hypothesis states that throughout their histories, most species are stable and display stasis; when they do change, it happens rapidly relative to the total duration of the species. Punctuated equilibria has generated a large amount of interest and support among paleontologists and evolutionary biologists since its initial publication in 1972. Over the interval 2008–2023 many studies have tested various aspects of punctuated equilibria, including the prevalence of stasis and the extent to which most evolutionary change is concentrated at speciation. In the vast majority of these studies, punctuated equilibria is strongly validated, as widespread evidence for stasis continues to accumulate, with some rare incidences of gradual change found; support for the fact that most evolutionary change happens at speciation is also adding up. Over this time period, there have also been a number of studies supporting punctuated equilibria that focused entirely on modern species. From 2008 to 2023 there has also been some change in how stasis is defined, such that at times the definition used diverges from the original 1972 definition in important respects. Notably, it is the few studies that have most changed the definition of stasis that have most challenged the validity of punctuated equilibria. This indicates it is changing definitions rather than the discovery of new data that is primarily responsible for most challenges to punctuated equilibria today.
“We propose that the terminologies ‘stasis’ and ‘punctuated equilibrium’ should be avoided when possible.”
Rolland et al. (Reference Rolland, Henao-Diaz, Doebeli, Germain, Harmon, Knowles and Liow2023: p. 1186)“If thought corrupts language, language can also corrupt thought.”
Orwell ([Reference Orwell1946] 1968: p. 137)Introduction
After more than 50 years, punctuated equilibria (PE) continues to be a highly supported and increasingly relevant concept (Futuyma Reference Futuyma, Serrelli and Gontier2015; Turner Reference Turner and Delisle2017; Cerca et al. Reference Cerca, Meyer, Stateczny, Siemon, Wegbrod, Purschke, Dimitrov and Struck2019), which makes the above opening quote from Rolland et al. (Reference Rolland, Henao-Diaz, Doebeli, Germain, Harmon, Knowles and Liow2023) appear somewhat tendentious. Indeed, a wealth of studies conducted over the interval 2008–2023 have added to the already substantial support for PE, including numerous studies that uphold the associated phenomenon of stasis (Nehm and Budd Reference Nehm and Budd2008; Kaplan Reference Kaplan2009; Hopkins and Lidgard Reference Hopkins and Lidgard2012; Hunt et al. Reference Hunt, Hopkins and Lidgard2015; Voje Reference Voje2016). Of course, this recent work extends the existing track record on the subject, synthesized in various venues including Gould and Eldredge (Reference Gould and Eldredge1977), Eldredge (Reference Eldredge1985), Gould and Eldredge (Reference Gould and Eldredge1993), Bennett (Reference Bennett1997), Gould (Reference Gould2002), and Eldredge et al. (Reference Eldredge, Thompson, Brakefield, Gavrilets, Jablonski, Jackson, Lenski, Lieberman, McPeek and Miller2005). In addition, PE has now been applied to multiple new areas of research, including studies of artificial life (Woodberry et al. Reference Woodberry, Korb, Nicholson, Korb, Randall and Hendtlass2009), programming languages (Valverde and Solé Reference Valverde and Solé2015), thermodynamic systems (Wosniack et al. Reference Wosniack, da Luz and Schulman2016), and archeology/anthropology (Prentiss and Laue Reference Prentiss, Laue and Prentiss2019; O’Brien et al. Reference O’Brien, Valverde, Duran-Nebreda, Vidiella and Bentley2024).
The focus of the present contribution is to discuss and evaluate studies of PE from 2008 to 2023, including compelling examples that have validated one or more aspects of PE, as well as studies that have offered critiques or suggested refinements of PE. Notably, during this 15 year interval, rigorous methods for analysis of morphological change through time have been made widely available (e.g., Hunt et al. Reference Hunt, Hopkins and Lidgard2015) and comprehensive discussions of the literature and the history of PE have been published (e.g., Eldredge Reference Eldredge2008; Sepkoski Reference Sepkoski2012; Hunt and Rabosky Reference Hunt and Rabosky2014; Lidgard and Hopkins Reference Lidgard and Hopkins2015) that combined have served to expand the conceptual boundaries of PE and helped to further broaden its relevance.
When regarded collectively, analyses conducted during the interval 2008–2023 suggest it is high time to move beyond simple tests of the hypothesis to instead explore the broader macroevolutionary implications of PE, as well as advance opportunities for integration between paleontological and neontological approaches. However, by the same token, there still remains some debate about the precise meaning and significance of PE, for example, Pennell et al. (Reference Pennell, Harmon and Uyeda2014) (see also discussions in Venditti and Pagel [Reference Venditti and Pagel2014] and Lieberman and Eldredge [Reference Lieberman and Eldredge2014]) and some, although quite limited, advocacy for primarily gradualist evolutionary models (e.g., Voje et al. Reference Voje, Starrfelt and Liow2018). Notably, when it comes to phyletic gradualism, there continues to be a lack of empirical support (Prothero et al. Reference Prothero, Syverson, Raymond, Madan, Molin, Fragomeni, DeSantis, Sutyagina and Gage2012; Strotz and Allen Reference Strotz and Allen2013).
There has also been discussion about potential theoretical problems with the concept of phyletic gradualism. One of these is that it has been suggested that natural selection is too powerful for a transition between an ancestral and a descendant species to take millions (or even hundreds of thousands) of years to occur (Gould and Eldredge Reference Gould and Eldredge1977; Gould Reference Gould2002; Geary et al. Reference Geary, Hunt, Magyar and Schreiber2010; Hunt and Rabosky Reference Hunt and Rabosky2014). Particularly relevant information worth considering in this context is the nature of speciation itself and how long it takes to occur. Several authors have argued that speciation is a continuum, ranging from newly formed, partially reproductively isolated groups to more distantly related species (Lowry Reference Lowry2012; Myers et al. Reference Myers, Doellman, Ragland, Hood, Egan, Powell, Nosil and Feder2020; Stankowski and Ravinet Reference Stankowski and Ravinet2021). In support of the notion that speciation occurs over extensive intervals, Kulumni et al. (Reference Kulumni, Butlin, Lucek, Savolainen and Westram2020) argued that barriers to gene flow evolve over tens of thousands to millions of generations. Depending on the generation length of the organism in question, this may mean that speciation does proceed over very long timescales indeed. These could obviate the aforementioned theoretical challenge to phyletic gradualism. However, Kulumni et al. (Reference Kulumni, Butlin, Lucek, Savolainen and Westram2020) recognized that there also might be tipping points and times when reproductive isolation can emerge rapidly, such that this is a challenging topic to understand empirically. Indeed, Gavrilets (Reference Gavrilets2000) argued that speciation should take on average roughly 10,000 generations, and there usually will not be long periods of time where partial reproductive isolation persists. In addition to this, well-established, distinct species can come back together again and interbreed after long periods of isolation (e.g., Yamasaki et al. Reference Yamasaki, Kakioka, Takahashi, Toyoda, Nagano, Machida, Moller and Kitano2020). It is clear that enhanced understanding of the nature and duration of speciation will only come from continued, detailed population genetic, phylogenetic, and other types of studies of the sort described in Shapiro et al. (Reference Shapiro, Leducq and Mallet2016), Muschick et al. (Reference Muschick, Soria-Carrasco, Feder, Gompert and Nosil2020), and Stankowski and Ravinet (Reference Stankowski and Ravinet2021).
Notwithstanding the contention of Rolland et al. (Reference Rolland, Henao-Diaz, Doebeli, Germain, Harmon, Knowles and Liow2023) that the term “stasis” should be abandoned, it is clear that “stasis is common in fossil sequences” (Hunt et al. Reference Hunt, Hopkins and Lidgard2015: p. 4886; see also Hopkins and Lidgard Reference Hopkins and Lidgard2012; Hunt and Rabosky Reference Hunt and Rabosky2014). Ultimately, “one need not be a partisan of PE in order to appreciate that stasis is an important pattern” (Turner Reference Turner and Delisle2017: p. 345; see also Nehm and Budd Reference Nehm and Budd2008; Kaplan Reference Kaplan2009; Weiss Reference Weiss2011; Futuyma Reference Futuyma, Serrelli and Gontier2015; Cerca et al. Reference Cerca, Meyer, Stateczny, Siemon, Wegbrod, Purschke, Dimitrov and Struck2019), nor need one be a paleontologist to recognize that the fossil record provides important insights into the patterns and processes of evolution—the development of PE codified several of these important insights. Thanks in part to PE, paleontology is seen as more vital than ever to evolutionary biology.
Studies Reiterating Support for PE
Studies Documenting the Prevalence of Stasis
Many compelling examples of stasis have been assembled between 2008 and 2023, demonstrating that stasis is a common phenomenon, even in clades undergoing rapid evolutionary radiation and diversification (Van Bocxlaer and Hunt Reference Van Bocxlaer and Hunt2013). Estimates of the prevalence of phyletic gradualism, often defined over the last 15 years as directional change, also continue to demonstrate it is either uncommon, occurring in as few as ~13% of cases analyzed (Hunt et al. Reference Hunt, Hopkins and Lidgard2015), or even relatively rare, identified maybe less than 5% of the time (Hopkins and Lidgard Reference Hopkins and Lidgard2012; Hunt and Rabosky Reference Hunt and Rabosky2014).
One proviso when considering recent analyses testing for the prevalence of stasis is that some studies have defined stasis as “uncorrelated, normally distributed variation around a steady mean” (Hunt et al. Reference Hunt, Hopkins and Lidgard2015: supplementary material, p. 2; see also Hunt and Rabosky Reference Hunt and Rabosky2014), following the definition of Sheets and Mitchell (Reference Sheets and Mitchell2001). While a perfectly valid approach, this definition of stasis may be viewed as somewhat restrictive, at least according to its principals, Eldredge and Gould, who in various publications (e.g., Eldredge and Gould Reference Eldredge, Gould and Schopf1972; Gould and Eldredge Reference Gould and Eldredge1977) never posited that variation be normally distributed or that mean morphology be steady, only that the morphology of the oldest and youngest exponents of the species be statistically indistinguishable (e.g., Lieberman et al. Reference Lieberman, Brett and Eldredge1995; Gould Reference Gould2002; Eldredge et al. Reference Eldredge, Thompson, Brakefield, Gavrilets, Jablonski, Jackson, Lenski, Lieberman, McPeek and Miller2005). This is also a rigorous, quantitative criterion for supporting or rejecting a hypothesis of stasis, neither requiring consideration of entire time series nor being reliant on numerical modeling.
The example provided is representative of a broader phenomenon to reinvent aspects of PE, most commonly a predilection to redefine stasis more strictly than it was defined either by Eldredge or Gould, singly or in joint publications (see Lieberman Reference Lieberman, Allmon, Kelley and Ross2009). Notwithstanding the fact that the results of studies using such a revised definition of stasis (Hunt et al. Reference Hunt, Hopkins and Lidgard2015) are quite favorable to PE, it is possible that some of the lineages that were interpreted as matching a random walk pattern—which was found to be nearly as common as stasis, and much more common than directional change (Hunt et al. Reference Hunt, Hopkins and Lidgard2015)—might in fact conform to the original definition of stasis and entail that the prevalence of stasis in the relevant lineages is actually much higher. (Hunt et al. [Reference Hunt, Hopkins and Lidgard2015: supplementary material, p. 2] also had a model of strict stasis wherein “the variance around the long-term mean is zero.”) Hunt and Rabosky (Reference Hunt and Rabosky2014: p. 424) nicely raised this exact point by recognizing that “it was the amount of change, rather than the structure of that change, that defined stasis. As a result, stasis construed in this way (i.e., the original framework of Eldredge and Gould [Reference Eldredge, Gould and Schopf1972], Gould and Eldredge [Reference Gould and Eldredge1977], and other subsequent works) is broader than any specific model; it encompasses any temporal pattern that produces modest evolutionary changes within species.” This is an important point to keep in mind regarding any of the numerical modeling–based tests of stasis and PE and matches Voje’s acknowledgment (2016: p. 2681) that “it can be argued that time series traveling only very small or zero distances in morphospace fit the concept of morphological stasis, even though these time series did not fit the stasis model better than the random walk model.” What this means is that lineages treated as fitting or conforming to a random walk by certain studies (e.g., Hopkins and Lidgard Reference Hopkins and Lidgard2012; Hunt and Rabosky Reference Hunt and Rabosky2014; Hunt et al. Reference Hunt, Hopkins and Lidgard2015; Voje Reference Voje2016) comfortably conform to stasis according to its original definition (e.g., Eldredge and Gould Reference Eldredge, Gould and Schopf1972; Gould and Eldredge Reference Gould and Eldredge1977; Gould Reference Gould2002; Eldredge et al. Reference Eldredge, Thompson, Brakefield, Gavrilets, Jablonski, Jackson, Lenski, Lieberman, McPeek and Miller2005).
Intriguingly, examples of stasis (Nagel-Myers et al. Reference Nagel-Myers, McRoberts and LaPointe2018) continue to emerge even from where the type example of PE was discovered (Eldredge Reference Eldredge1971), the Middle Devonian Hamilton Group. Recent examples also have especially emphasized mollusks, including freshwater gastropods (Van Bocxlaer and Hunt Reference Van Bocxlaer and Hunt2013), bivalves (Nagel-Myers et al. Reference Nagel-Myers, McRoberts and LaPointe2018), and Cretaceous ammonoids (Witts et al. Reference Witts, Landman, Hopkins and Myers2020, Reference Witts, Myers, Garb, Irizarry, Larina, Rashkova and Landman2022). Studies have also incorporated large numbers of fossil specimens distributed across a relatively broad landscape and from regions with excellent stratigraphic control (Nagel-Myers et al. Reference Nagel-Myers, McRoberts and LaPointe2018; Witts et al. Reference Witts, Landman, Hopkins and Myers2020, Reference Witts, Myers, Garb, Irizarry, Larina, Rashkova and Landman2022). Some studies (e.g., Nagel-Myers et al. Reference Nagel-Myers, McRoberts and LaPointe2018) have also usefully tried to disentangle the role of ecophenotypic effects from actual evolutionary changes. In addition to all of these studies that provided abundant support for morphological stasis through time, Saupe et al. (Reference Saupe, Hendricks, Portell, Dowsett, Haywood, Hunter and Lieberman2014) found, using ecological niche modeling, statistically significant niche stability over the last ~3 Myr years in a phylogenetically and ecologically diverse set of 10 species of marine gastropods and bivalves from the West Atlantic. Such niche stability indicates that, for these species, niches also display stasis, with no evidence for change in niches over the interval and in the region considered, over many millions of years, just as with species morphology as well (Saupe et al. Reference Saupe, Hendricks, Portell, Dowsett, Haywood, Hunter and Lieberman2014).
A plethora of examples have also emerged from fossil vertebrates, as overwhelming evidence for stasis has been assembled via analyses of the fauna of the Rancho La Brea tar pits (e.g., Prothero et al. Reference Prothero, Syverson, Raymond, Madan, Molin, Fragomeni, DeSantis, Sutyagina and Gage2012). This fauna preserves a prodigious number of specimens belonging to many species and spans several episodes of major climatic change. This work is distinguished by the exceptional number of samples considered, the range of approaches applied, and the meticulous nature of the comparisons. Rancho La Brea truly comprises a model system for how to comprehensively study stasis and change in a fossil fauna. For instance, predominate stasis, with a few instances where changes in morphology could not be distinguished from a random walk (Prothero et al. Reference Prothero, Syverson, Raymond, Madan, Molin, Fragomeni, DeSantis, Sutyagina and Gage2012), have been recovered in all of the members of the Rancho La Brea bird fauna analyzed, including California condors (Syverson and Prothero Reference Syverson and Prothero2010), bald eagles (Fragomeni and Prothero Reference Fragomeni and Prothero2011), great horned (Madan et al. Reference Madan, Prothero and Syverson2015) and barn owls (Madan et al. Reference Madan, Prothero and Syverson2016), black (Long et al. Reference Long, Prothero and Syverson2016) and Egyptian (Olson et al. Reference Olson, Prothero, Balassa and Syverson2022) vultures, passerines (Long et al. Reference Long, Prothero and Syverson2020), and northern harriers (Marriott et al. Reference Marriott, Prothero and Watmore2022). Studies of fossil mammals from Rancho La Brea, including bison and ground sloths (Prothero and Raymond Reference Prothero and Raymond2011; Raymond and Prothero Reference Raymond and Prothero2011), camels and horses (DeSantis et al. Reference DeSantis, Prothero and Gage2011), dire wolves (Linden Reference Linden2011), and giant lions and sabertoothed cats (Madan et al. Reference Madan, Prothero and Sutyagina2011), reiterate the same pattern recovered for birds—overwhelming stasis, with occasional random walk (Prothero et al. Reference Prothero, Syverson, Raymond, Madan, Molin, Fragomeni, DeSantis, Sutyagina and Gage2012). Studies of birds and mammals failed to yield any evidence for phyletic gradualism (Prothero et al. Reference Prothero, Syverson, Raymond, Madan, Molin, Fragomeni, DeSantis, Sutyagina and Gage2012).
In addition to the continued proliferation of paleontologically focused studies documenting stasis, a new and exciting development between 2008 and 2023 is an increasing emphasis on using examples involving entirely extant taxa to test for stasis (e.g., Wada et al. Reference Wada, Kameda and Chiba2013; Swift et al. Reference Swift, Daglio and Dawson2016; Cerca et al. Reference Cerca, Meyer, Stateczny, Siemon, Wegbrod, Purschke, Dimitrov and Struck2019). These innovative approaches have opened up entirely new avenues for analysis by focusing on cryptic species complexes and employing molecular and morphological data and phylogenetic and morphometric approaches, while considering phyla running the gamut from annelids (Cerca et al. Reference Cerca, Meyer, Stateczny, Siemon, Wegbrod, Purschke, Dimitrov and Struck2019) to jellyfish (Swift et al. Reference Swift, Daglio and Dawson2016) to mollusks (Wada et al. Reference Wada, Kameda and Chiba2013) and documenting morphological stasis in cases lasting more than 10 Myr.
Studies Documenting the Prevalence of Cladogenesis Relative to Anagenesis
Since 2008, a series of studies have focused on analyzing molecular phylogenies to test PE (Bokma Reference Bokma2008; Mattila and Bokma Reference Mattila and Bokma2008; Monroe and Bokma Reference Monroe and Bokma2009). This is important, as it builds on work conducted before 2008 (Pagel et al. Reference Pagel, Venditti and Meade2006), extending the range of study systems available to test for different aspects of PE (e.g., Stroud et al. Reference Stroud, Moore, Langerhans and Losos2023), and also continues to bridge the neo/paleo divide in evolutionary biology. These studies have included the development of new Bayesian approaches (Bokma Reference Bokma2008; Monroe and Bokma Reference Monroe and Bokma2010) that have ultimately buttressed support for PE by showing that significant amounts of molecular change are concentrated at speciation and cladogenesis and, further, that a substantial amount of body-size evolution in mammals is concentrated during rapid cladogenesis (Mattila and Bokma Reference Mattila and Bokma2008; Monroe and Bokma Reference Monroe and Bokma2009). The consequence of such a finding is that the amount of anagenetic change must be much less than would be predicted under phyletic gradualism. These studies have ultimately shown that “punctuational evolution is common and widespread in gene sequence data” (Venditti and Pagel Reference Venditti and Pagel2008: p. 274).
Studies documenting the overwhelming prevalence of cladogenetic change are not restricted to extant clades, as phylogenetic analyses from Cretaceous ammonoids (Witts et al. Reference Witts, Landman, Hopkins and Myers2020, Reference Witts, Myers, Garb, Irizarry, Larina, Rashkova and Landman2022) and detailed examination of Cenozoic planktic foraminifera (Strotz and Allen Reference Strotz and Allen2013) have also reiterated and further scaffolded this key contention of PE. Focusing on the extent to which population subdivision is necessary for phenotypic change, Strotz and Allen (Reference Strotz and Allen2013) demonstrated that the overwhelming majority of long-term phenotypic evolution within Cenozoic planktic foraminifera consists of cladogenesis, with the ancestral species persisting after the descendant species diverged, rather than anagenesis and within-species evolution, whereby the ancestral form entirely transforms into the descendant. Strotz and Allen’s (Reference Strotz and Allen2013) study utilized one of the most extraordinarily detailed fossil records currently available and evaluated a group in which the isolating mechanisms typical of allopatric speciation are more likely to be weakly expressed (Sexton and Norris Reference Sexton and Norris2008). Crucially, Strotz and Allen (Reference Strotz and Allen2013) emphasized that any ancestor–descendant transition identified as anagenesis in their study should be considered putative, given that where detailed analyses of putative events existed, it has been subsequently shown that such speciation events represent cladogenesis (Kucera and Malmgren Reference Kucera and Malmgren1998; Hull and Norris Reference Hull and Norris2009). In one such putative example of anagenesis, previously upheld as an example of phyletic gradualism (Malmgren et al. Reference Malmgren, Berggren and Lohmann1983), Hull and Norris (Reference Hull and Norris2009) established not only the presence of cladogenesis, but also that the pace of divergence seems to be in line with the timescale predicted by PE, that is, rapid on geological timescales, but gradual on ecological timescales, instead of comprising much slower gradual divergence across geological timescales.
Studies Challenging Aspects of PE
Notwithstanding this overwhelming body of evidence in support of PE since 2008, a small number of recent studies have found some evidence for gradualism (e.g., Geary et al. Reference Geary, Hunt, Magyar and Schreiber2010). These rare cases do nothing to violate the primary thesis of PE, which acknowledges gradualism can and does occur, albeit at relatively low frequencies (Hopkins and Lidgard Reference Hopkins and Lidgard2012; Hunt and Rabosky Reference Hunt and Rabosky2014; Hunt et al. Reference Hunt, Hopkins and Lidgard2015). A collection of recent work (Voje Reference Voje2016; Voje et al. Reference Voje, Starrfelt and Liow2018, Reference Voje, Di Martino and Porto2020; Rolland et al. Reference Rolland, Henao-Diaz, Doebeli, Germain, Harmon, Knowles and Liow2023) has also found that “evolution does not accumulate to produce large net evolutionary changes over time” (Voje Reference Voje2016: p. 2678) and that species morphology oscillates back and forth within narrow limits over long stretches of time (Rolland et al. Reference Rolland, Henao-Diaz, Doebeli, Germain, Harmon, Knowles and Liow2023), yet has still questioned the central tenets of PE, despite the fact that these results very much align with the view of stasis typically presented in the studies that first proposed or later endorsed PE (e.g., Eldredge and Gould Reference Eldredge, Gould and Schopf1972; Gould and Eldredge Reference Gould and Eldredge1977; Gould Reference Gould2002; Eldredge et al. Reference Eldredge, Thompson, Brakefield, Gavrilets, Jablonski, Jackson, Lenski, Lieberman, McPeek and Miller2005; Lieberman Reference Lieberman, Allmon, Kelley and Ross2009; Hopkins and Lidgard Reference Hopkins and Lidgard2012; Hunt et al. Reference Hunt, Hopkins and Lidgard2015).
One potential reason for this incongruity is that a different conceptual definition of stasis was used in these studies. In particular, as quoted previously, Voje (Reference Voje2016: p. 2681) recognized that morphological time series that oscillate back and forth and travel small net distances in morphospace fit the original concept of morphological stasis, even though they might better match the random walk model than the stasis model using the model selection framework. Voje (Reference Voje2016: p. 2685) referred to these as traits within lineages that “show little net evolution but still undergo substantial change” and focused on the fact that the net sum of these minor oscillations might not truly exemplify minimal evolution and stasis, because of the total morphological distance traveled as lineages frequently oscillate back and forth. Voje (Reference Voje2016) argued that this disproved aspects of PE by contending that multiple small jumps back and forth within narrow limits add up in total to a large amount of change: sometimes even a greater amount of change than occurred in a lineage evolving directionally. Thus, it was concluded that there is “substantial evolution independent of speciation” (Voje Reference Voje2016: p. 2685). This is a view that Voje et al. (Reference Voje, Starrfelt and Liow2018, Reference Voje, Di Martino and Porto2020) and Rolland et al. (Reference Rolland, Henao-Diaz, Doebeli, Germain, Harmon, Knowles and Liow2023) amplified and endorsed.
Under the original definition of stasis (e.g., Eldredge and Gould Reference Eldredge, Gould and Schopf1972; Gould and Eldredge Reference Gould and Eldredge1977; Lieberman et al. Reference Lieberman, Brett and Eldredge1995; Strotz and Allen Reference Strotz and Allen2013), and also in the mathematical modeling–based tests of stasis employed by Hopkins and Lidgard (Reference Hopkins and Lidgard2012), Van Bocxlaer and Hunt (Reference Van Bocxlaer and Hunt2013), Hunt and Rabosky (Reference Hunt and Rabosky2014), and Hunt et al. (Reference Hunt, Hopkins and Lidgard2015), by contrast, oscillations in morphology in opposing directions that led nowhere were not treated as instances of substantial change, but rather instances where changes canceled out: all of these studies focused on net morphological change. Therefore, a distinctive perspective or definition in the work of Voje (Reference Voje2016), Voje et al. (Reference Voje, Starrfelt and Liow2018, Reference Voje, Di Martino and Porto2020), and Rolland et al. (Reference Rolland, Henao-Diaz, Doebeli, Germain, Harmon, Knowles and Liow2023) on what constitutes stasis seems to be playing an important role in causing different results.
To conclude that lineages that experience oscillations back and forth yet display no net morphological change are undergoing substantial change entails a focus on the absolute value of morphological change from one step to the next in a time series. Such a perspective is akin to removing directionality from the vector of change in a time series and differs from how these sorts of time series are often examined in the bio- and geosciences. It also assumes that all types of evolutionary change are equivalent. Note, Voje (Reference Voje2016), Voje et al. (Reference Voje, Starrfelt and Liow2018, Reference Voje, Di Martino and Porto2020), and Rolland et al. (Reference Rolland, Henao-Diaz, Doebeli, Germain, Harmon, Knowles and Liow2023) did not implement this assumption analytically; their mathematical modeling approach very much follows that used by Hopkins and Lidgard (Reference Hopkins and Lidgard2012), Van Bocxlaer and Hunt (Reference Van Bocxlaer and Hunt2013), Hunt and Rabosky (Reference Hunt and Rabosky2014), and Hunt et al. (Reference Hunt, Hopkins and Lidgard2015). Rather, it is their interpretation of the meaning of their results that has led to this disjuncture.
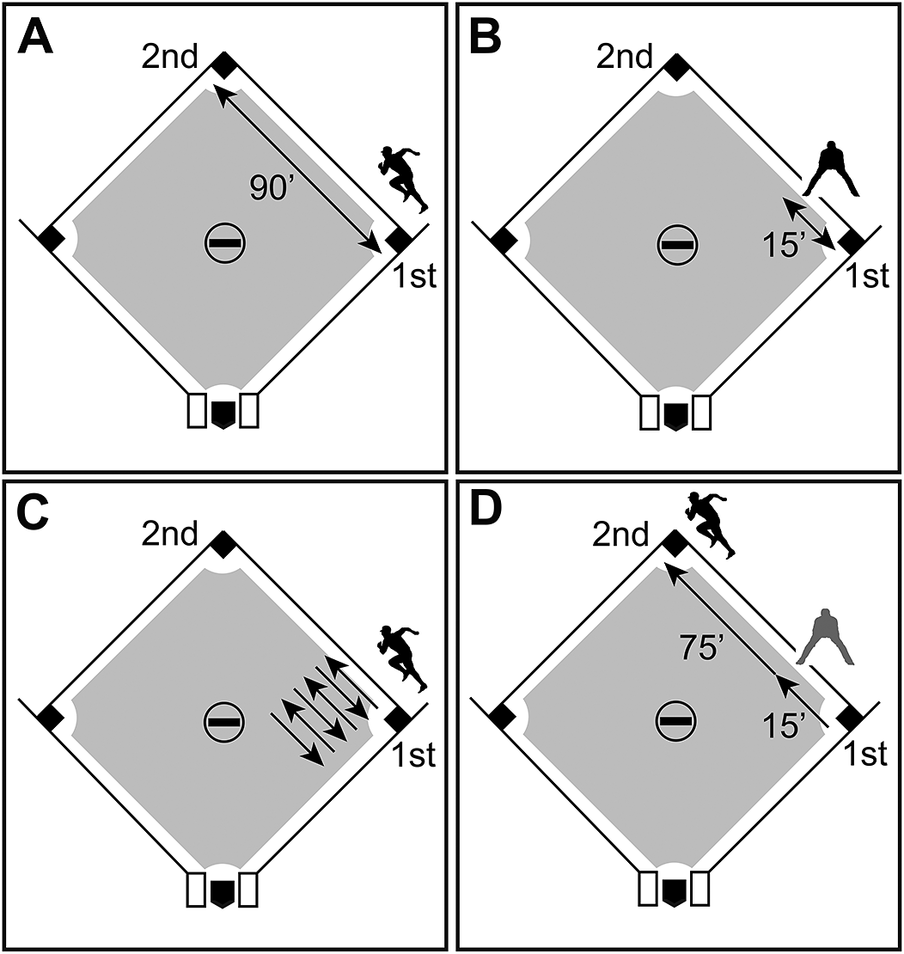
To demonstrate the implications of removing directionality from a vector of change, we consider an example from baseball, as one of the architects of PE, Stephen Jay Gould, frequently used examples from baseball as a metaphor to better explain evolutionary processes (e.g., Gould Reference Gould1996). Imagine a batter reaches first base via a single, becoming a base runner (Fig. 1A). In baseball, the canonical distance between first and second base is 90 feet. During the next at bat, the base runner takes a lead of 15 feet from the first base line: a good but not preposterous lead (Fig. 1B). Then, that runner retreats to first when the pitcher throws over to first base in an attempted but unsuccessful pickoff play. Imagine the “taking a lead and retreating scenario” happens three more times during the course of the inning. Then imagine the runner’s side is retired after three outs before they are able to advance any further (Fig. 1C). By the end of that frame of the inning, the runner has traveled the 90 feet total needed to reach second base from first base, if distances were measured irrespective of direction. However, the base runner never made it to second base and thus is not credited with stealing a base, because direction of movement is considered in baseball, and the net relevant distance that base runner traveled after reaching first base is rightly considered to be nil.
A hypothetical example showing that not all distances traveled in baseball yield the same result, because direction of movement matters. A, A runner reaches first base and from there attempts to steal second base, which is 90 feet away. B, The runner takes a lead of 15 feet from the first base line. C, The pitcher attempts to pick off the runner, who successfully retreats to first base; twice more the runner takes a lead of 15 feet, the pitcher throws over to first base, and the runner retreats back to the bag; movement between the lead the runner takes and the return to the bag occurs six times, with the distance traveled and direction of movement illustrated by an arrow; in total the runner travels 90 feet after reaching first, but the runner never successfully steals second base. D, Baseball Hall of Famer and all-time stolen base leader Rickey Henderson makes it to first base, takes a lead of 15 feet, and then runs on the first pitch, making it to second base without being thrown out; like the first runner, Rickey Henderson travels 90 feet after reaching first, however, this time the steal of second base is successful.

By contrast, now imagine another base runner, the all-time stolen base record holder and Baseball Hall of Famer Rickey Henderson, takes a lead of 15 feet, breaks on the first pitch, and reaches second base without being thrown out (Fig. 1D). Henderson has successfully stolen second base, unlike the first runner, although they have traveled exactly the same total distance. The point is—distances traveled by a base runner in baseball need to take into account the distance traveled and the direction traveled (i.e., they are vectors). Distance traveled can be cancelled out by in effect passing over the same ground in the opposite direction. Further, not all distances traveled by a base runner in baseball are equivalent. In the first case, it did not yield a stolen base; in the second case, it did. Note, this baseball example does not illustrate how a model selection framework eliminates directionality, but why direction and net movement could be important information to consider when it comes to how stasis is defined and results are interpreted.
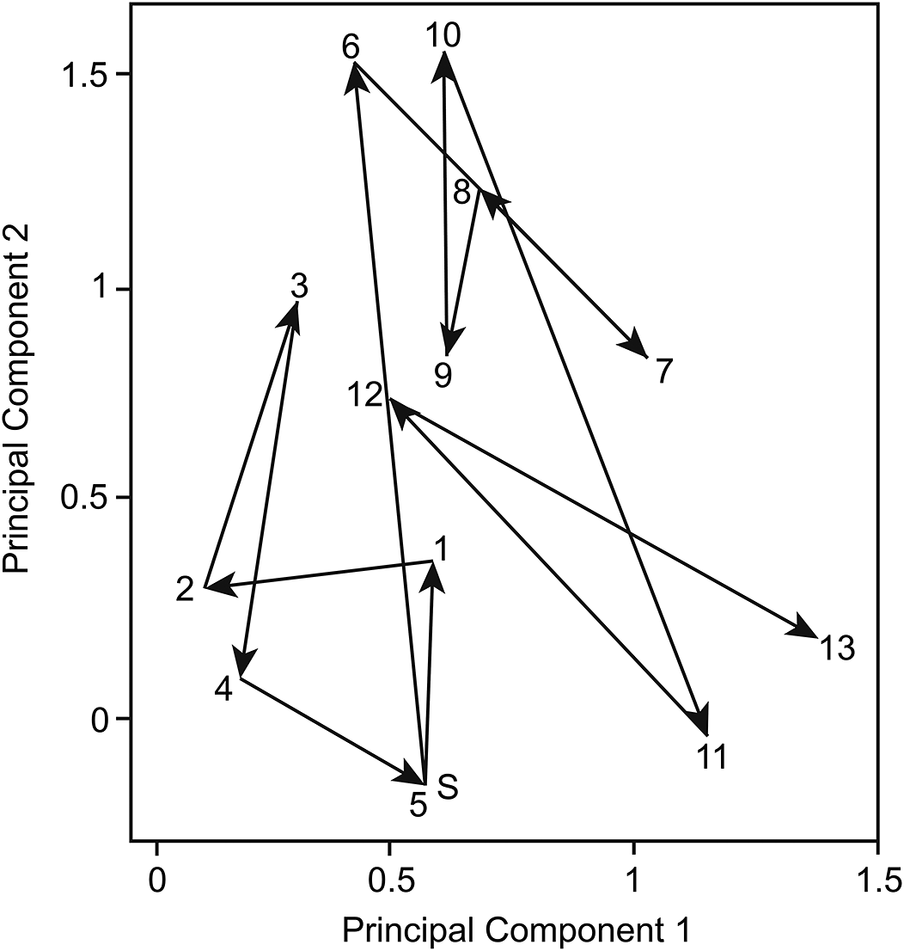
Returning to evolution and PE, evolutionary change is not directionless, and viewing total change as a net value, and not as the sum of the absolute values of the total amount of directionless change, best reflects the evolutionary trajectory of a species. Indeed, a key lesson from PE is that phenotypic change often ultimately leads nowhere (Eldredge et al. Reference Eldredge, Thompson, Brakefield, Gavrilets, Jablonski, Jackson, Lenski, Lieberman, McPeek and Miller2005; Fig. 2). In addition, not all evolutionary changes are equivalent—there is in fact significant debate about whether or not microevolution can always be directly extrapolated to macroevolution (Erwin Reference Erwin, Ayala and Arp2010; Lieberman and Eldredge Reference Lieberman and Eldredge2014). One reason proposed for why microevolutionary change does not always yield macroevolutionary change is that speciation serves as a ratchet, locking in change (Futuyma Reference Futuyma1987), and in the absence of speciation, any changes in phenotype are ephemeral. In the context of PE, stasis, and change, the nature and amount of change occurring during speciation (cladogenesis) and within lineage evolution (anagenesis) should thus not be considered equivalent.
Reproduction of mid-Pliocene to modern evolutionary trajectory for Globorotalia crassaformis from DSDP Leg 90, Hole 591, modified from Lazarus et al. (Reference Lazarus, Hilbrecht, Spencer-Cervato and Thierstein1995: fig. 9). See Supplementary Fig. 1 (https://doi.org/10.5281/zenodo.13127780 ) for a full reproduction of the original figure. Greater than 50% of the variance in the dataset is retained by PC 1 and PC 2, and the region of morphospace depicted represents only a small subset of the total morphospace of the Globorotalia lineage studied by Lazarus et al. (Reference Lazarus, Hilbrecht, Spencer-Cervato and Thierstein1995). Numerical values indicate oldest to youngest population consecutively, with S = start. Results represent population centroid scores for each of the relevant populations on the first two principal components (generated using principal components analysis). Note that Lazarus et al. (Reference Lazarus, Hilbrecht, Spencer-Cervato and Thierstein1995) concluded there is no specific evolutionary trend for G. crassaformis over an approximately 3 Myr interval, despite ongoing changes in morphology, with the observed changes representing random shifts in phenotype space around a mean morphology, a pattern they concluded to be evidence of little phyletic change. Figure from Lazarus et al. (Reference Lazarus, Hilbrecht, Spencer-Cervato and Thierstein1995) used with permission, Cambridge University Press and the Paleontological Society.

There may be another reason why Voje et al. (Reference Voje, Starrfelt and Liow2018, Reference Voje, Di Martino and Porto2020) and Rolland et al. (Reference Rolland, Henao-Diaz, Doebeli, Germain, Harmon, Knowles and Liow2023) argued that their results challenged aspects of PE. Voje et al. (Reference Voje, Starrfelt and Liow2018) looked for the prevalence of a particular model of stasis by developing four tests, and in order to identify stasis as the best-fitting model, all four criteria had to be met. Note, this model of stasis, as mentioned earlier, does not coincide with stasis as defined by Eldredge and Gould. Another key issue pertaining to their study is that, as Voje et al. (Reference Voje, Starrfelt and Liow2018: p. 514) rightly recognized, “inflated type I error rates can be easily introduced when applying several tests to the same data. This is problematic if the goal of applying these test statistics is to evaluate whether a specific model should be accepted or rejected. However, our goal is not acceptance versus rejection but to evaluate the suitability of individual datasets in order to reliably estimate model parameters.”
Upon conducting several analyses, Voje et al. (Reference Voje, Starrfelt and Liow2018) concluded that 41% of the data from the bryozoan genus Metrarabdotos, which had previously been offered as a key example of stasis (see Jackson and Cheetham Reference Jackson and Cheetham1999), was actually not well described by their stasis model. But then Voje et al. (Reference Voje, Starrfelt and Liow2018) used this to reject the prevalence of stasis, and PE in general. However, rejection is precisely what Voje et al. (Reference Voje, Starrfelt and Liow2018) said they would not use their tests to do earlier in their paper (in the section quoted earlier), due to the high probability of type I error. This could call Voje et al.’s (Reference Voje, Starrfelt and Liow2018) conclusion about the shortcomings of PE, subsequently amplified by Voje et al. (Reference Voje, Di Martino and Porto2020) and Rolland et al. (Reference Rolland, Henao-Diaz, Doebeli, Germain, Harmon, Knowles and Liow2023), into question.
Conclusions
The overwhelming majority of studies conducted between 2008 and 2023 provide extensive support for PE, the prevalence of stasis, and the dominance of cladogenetic change relative to anagenesis, continuing a long track record of high predictive power for the theory. Over this 15 year interval, there have also been useful new analytical approaches and perspectives that have been developed to further examine the concepts that underlie PE. By the same token, there has been some drift in certain quarters as to what the definition of stasis is and also how to test for it. Those studies that deviated from an original premise of PE by viewing oscillations back and forth in morphology as not necessarily stasis are often the ones that have produced the most tendentious results vis-à-vis PE. It therefore seems that morphing definitions rather than the discovery of data compatible with phyletic gradualism are most responsible for those studies that diverge from PE. Thus, it is important to be cognizant of which definitions and tests are used when considering the implications or appositeness of studies focused on evolutionary change. Perhaps the most assuring outcome of these 15 years is that the relevance of PE to evolutionary biology continues to be enduring, with both paleontological and an increasing number of neontological studies testing and upholding different aspects of PE. Punctuated equilibria increasingly serves as a vital and necessary bridge between neontological and paleontological approaches to the study of evolution, and work during the interval 2008–2023 indicates it will continue to do so into the foreseeable future.
Acknowledgments
We thank L. Ivany, P. Kelley, D. Prothero, and M. Yacobucci for their help organizing the session on punctuated equilibria at the Geological Society of America Annual Meeting in Denver in 2022 on which this paper is based. We also thank J. Crampton and the other editors of Paleobiology for their support of this special issue. We further thank P. Kelley, N. Campione, and two anonymous reviewers for their comments on an earlier version of this paper. Financial support was provided by NSF BOCP 2225011.
Competing Interests
The authors declare no competing interests.
Data Availability Statement
Data available from the Zenodo Digital Repository: https://doi.org/10.5281/zenodo.13127780.

 Open access