





1. Introduction
Phonaesthetics, the study of the aesthetic qualities of language sounds independent of meaning, is a fascinating yet relatively underexplored field within aesthetic research. The majority of aesthetic studies has traditionally focused on impressions of visual stimuli in the fine arts (Leder et al., Reference Leder, Belke, Oeberst and Augustin2004; Leder & Nadal, Reference Leder and Nadal2014; Zeki, Reference Zeki1999) or music (Brattico et al., Reference Brattico, Bogert and Jacobsen2013; Reuter & Oehler, Reference Reuter and Oehler2011; Vuust & Kringelbach, Reference Vuust and Kringelbach2010). However, language also possesses an aesthetic function, as exemplified by poetry (Jakobson, Reference Jakobson1960), making it a compelling subject for aesthetic inquiry.
Recent phonaesthetic research has investigated the inherent aesthetic properties of speech sounds in both natural languages (Anikin et al., Reference Anikin, Aseyev and Erben Johansson2023; Kogan & Reiterer, Reference Kogan and Reiterer2021; Matzinger & Košić, Reference Matzinger and Košić2025; Reiterer et al., Reference Reiterer, Kogan, Seither-Preisler and Pesek2020; Winkler et al., Reference Winkler, Kogan and Reiterer2023) and constructed languages (conlangs) (Mooshammer et al., Reference Mooshammer, Bobeck, Hornecker, Meinhardt, Olina, Walch and Xia2023; Podhorodecka, Reference Podhorodecka, Fischer, Ljungberg and Tabakowska2007). These studies have revealed a complex interplay of factors influencing phonaesthetic perception (for a thorough review of the field see Nemestothy et al., Reference Nemestothy, Kogan and Reiterer2025). Building on this growing body of research, the present study aims to further our understanding of the aesthetic appeal of language sounds, focusing specifically on the phonetic and phonological features that contribute to perceived linguistic beauty. Speech plays a fundamental role in human societies, and gaining a deeper understanding of its aesthetic qualities is essential to complement ongoing research on the perceptual foundations of aesthetics in visual art and music. Since aesthetic experiences can vary greatly in their intensity and valence, it is beneficial to study aesthetic pleasure in an integrated manner, within the broader range of disciplines including phonaesthetics. From the evolutionary perspective, the aesthetic evaluation of phonological features may influence their frequency across languages, suggesting that phonaesthetics could be a meaningful factor in the evolution of language (Anikin et al., Reference Anikin, Aseyev and Erben Johansson2023). From a sociolinguistic perspective, research on phonaesthetics may help explain existing stereotypes and attitudes toward different languages and dialects (Carrie, Reference Carrie2017; Chand, Reference Chand2009; Levon et al., Reference Levon, Cardoso, Sharma, Watt, Ilbury and Ye2022). Moreover, it may have important implications for second language acquisition, as learning is often enhanced by emotionally charged experiences. Aesthetic responses to linguistic stimuli may engage additional memory pathways, thereby supporting retention and learning (Dolcos et al., Reference Dolcos, LaBar and Cabeza2004; Matzinger & Košić, Reference Matzinger and Košić2025; Wrembel, Reference Wrembel2010).
1.1. Inherent value hypothesis versus imposed norm hypothesis
The notion that some languages are evaluated more positively than others because of their linguistic features stems from the Inherent Value Hypothesis (Giles et al., Reference Giles, Bourhis, Davies, McCormack and Wurm1979). In essence, the Inherent Value Hypothesis suggests that the linguistic features of a language contribute to its perceived aesthetic appeal. By contrast, the Imposed Norm Hypothesis contends that language attitudes are solely shaped by sociocultural influences, that is, pre-existing cultural stereotypes associated with the speakers of these languages or linguistic varieties (Giles & Niedzielski, Reference Giles, Niedzielski, Bauer and Trudgill1998). The Imposed Norm Hypothesis challenges the notion that the aesthetic appeal of a language is an inherent quality and suggests that our perceptions are moulded by societal and cultural influences. Until recently, linguistic aesthetics was widely assumed to be socially constructed, with only limited room for inherent sound-based preferences.
The number of studies evaluating the theoretical validity of the Inherent Value Hypothesis is rather limited. Rabanus (Reference Rabanus2003) investigated the influence of intonation and syllable structure on the aesthetic perception of German and Italian. He suggests that a higher vocalic share and a greater percentage of CV syllables in Italian in comparison to German makes Italian sounding more appealing to the human ear. Hilton et al. (Reference Hilton, Gooskens, Schüppert and Tang2022) found that Mandarin-speaking participants with no prior exposure to Swedish or Danish rated Swedish as more pleasant-sounding than Danish, potentially reflecting cross-linguistic differences in prosody. Matzinger et al. (Reference Matzinger, Specker, Ritt and Fitch2021) also demonstrated that certain prosodic patterns, specifically word-final lexical stress, might carry an aesthetic appeal that in their study also facilitated speech segmentation. Reiterer et al. (Reference Reiterer, Kogan, Seither-Preisler and Pesek2020) found that while familiarity increased positive evaluations (listeners tended to like familiar languages more), phonological features such as simpler syllable structure and higher sonority also independently predicted more favourable judgments. In the follow-up study, Kogan and Reiterer (Reference Kogan and Reiterer2021) further reported the importance of music-like phonetic features – pitch and rhythm: flat compressed pitch and faster rhythm, a profile shared by many Romance languages with the best example being Spanish, were perceived as sounding erotic (the so-called Latin lover effect). In contrast, Anikin et al. (Reference Anikin, Aseyev and Erben Johansson2023) could not identify any phonetic features as a reliable predictor of aesthetic pleasure in their large-scale study. They concluded that languages were rather uniform in terms of their emotional perception. That being said, the authors acknowledged the lack of standardized speech samples as one of the limitations of their study and recommended to use more control stimuli in future research.
Research on conlangs and pseudowords offers another valuable avenue for examining the aesthetic qualities of linguistic sound independently of sociocultural associations. One particularly illustrative example is the study by Mooshammer et al. (Reference Mooshammer, Bobeck, Hornecker, Meinhardt, Olina, Walch and Xia2023), which investigated phonaesthetics in conlangs and asked whether listeners’ impressions aligned with the emotional intentions of the language creators. The authors also examined whether these impressions were systematically linked to the phonetic and phonological properties of the conlangs. Their findings showed that listeners indeed formed strikingly consistent aesthetic judgments even when hearing the languages without any contextual cues such as emotional prosody or additional sound effects. For example, Klingon (from Star Trek) and Dothraki (from Game of Thrones) languages were reliably judged as unpleasant, harsh and aggressive – matching the creators’ goals – whereas Sindarin and Quenya from The Lord of the Rings were perceived as pleasant and peaceful, in line with Tolkien’s aesthetic vision. Interestingly, Orkish and Khuzdul (The Lord of the Rings), which were expected to sound rough and negative, were rated more positively than anticipated. The authors suggested that listeners’ native-language (in this case German) phonological expectations could influence evaluations. Mooshammer et al. further identified concrete linguistic features that shaped these impressions. Conlangs containing more voiced segments and lower pitch tended to be rated more positively, whereas conlangs with a higher proportion of non-German phonemes were perceived as less pleasant, highlighting the role of perceived otherness. Overall, the study strongly supports the Inherent Value Hypothesis precisely because conlangs minimize cultural biases and allow sound structure to stand on its own.
A second line of relevant work uses pseudowords, allowing researchers to isolate sound-based impressions even further. Lev-Ari and McKay (Reference Lev-Ari and McKay2023) investigated the sound of swearing and found that certain phonemes appear intrinsically better suited for expressing offensiveness. Across unrelated languages, approximants were strongly underrepresented in swear words, seemingly because they convey softness or calmness. Experimental evidence supported this: participants were far less likely to label pseudowords containing approximants as potential swear words (e.g., sola was perceived as less offensive than sotsa). This principle also manifests in English and German ‘minced oaths’, where swear words are softened by inserting approximants: e.g., fucking → frigging, or Scheiße → Scheibe(nkleister). Complementary findings from Aryani et al. (Reference Aryani, Conrad, Schmidtke and Jacobs2018) show that short vowels, voiceless obstruents and sibilants increase perceived arousal and negativity (e.g., piss sounds ruder than pee). Together, pseudoword studies reveal consistent cross-linguistic biases in how sounds convey emotion and social function, extending sound symbolism to the domain of phonaesthetics.
1.2. Present study
Despite the ongoing popular interest in the aesthetic properties of languages, a notable research gap persists. Although most existing studies have concentrated on aesthetic responses to visual art and music, research exploring aesthetic judgments of linguistic stimuli remains relatively scarce. Employing studio-quality recordings of native speakers, the present study aims to explore the aesthetic judgments of 24 European languages based on their representative samples. In order to minimize the familiarity of the participants to the languages, lesser-known (and minority) languages were chosen to represent their language families and participants from various cultural backgrounds were recruited. The primary objective of the present study is to explore the inherent aesthetic value of languages, by focusing on the analysis of the qualities of sound. Our analysis explores the distribution and frequency of place and manner of articulation (MoA) of the consonants of each language sample, while also investigating vowel qualities, sonority, syllable structure, stress, rhythm and speech rate. Given the limited body of prior research directly addressing this topic, we only tentatively formulate a number of hypotheses summarized in Table 1. Due to its highly exploratory nature, this study is intended as an initial investigation into emerging patterns rather than as a definitive test of hypotheses. As such, the design prioritizes breadth over control, and certain variables may not have been isolated or fully accounted for. While this approach enables the identification of novel directions and underexplored connections, it also limits the generalizability of the findings. Interpretations should therefore be viewed as preliminary, warranting further validation through more tightly controlled, follow-up research.
Phonaesthetic predictions that can be formulated in application to specific phonological features with ‘+’ indicating generally pleasant impressions and ‘−’ indicating negative impressions

Table 1. Long description
The table consists of three columns: Feature, Prediction plus or minus, and Previous research. It is divided into three main sections.
General Feature:
* High sonority: plus. Research by Elsen 2019, Johannesson 2007, Podhorodecka 2007, and Reiterer et al. 2020.
Vowels Section:
* High vocalic share (percent of vowels): plus. Research by Rabanus 2003 and Reiterer et al. 2020.
* Front vowels: plus. Research by Annear 2020, Crystal 1995, Lockwood and Dingemanse 2015, Podhorodecka 2007, and Winter and Perlman 2021.
* Back vowels: minus. Research by Lockwood and Dingemanse 2015, Peterson 2015, Podhorodecka 2007, and Winter and Perlman 2021.
Consonants Section:
* High consonantal share (percent of consonants): minus. Research by Podhorodecka 2007 and Rabanus 2003.
* Voiced consonants: plus. Research by Mooshammer et al. 2023.
* Voiceless consonants: minus. Research by Aryani et al. 2018 and Stanley 2003.
* Approximants: listed with both plus (Crystal 1995, Johannesson 2007, Lev-Ari and McKay 2023, Podhorodecka 2007) and minus (Auracher et al. 2010, Köhler 1947) predictions.
* Plosives: listed with both plus (Auracher et al. 2010, Köhler 1947) and minus (Aryani et al. 2018, Lev-Ari and McKay 2023, Stanley 2003) predictions.
* Rhotics: minus. Research by Costa and Serra 2022 and Winter et al. 2022.
* Fricatives: minus. Research by Stanley 2003.
* Velar and glottal-uvulars: minus. Research by Elsen 2019, Flieger 2017, Peterson 2015, Pistor and Leemann 2024, Stanley 2003, and Stockwell 2006.
Suprasegmental features Section:
* Fast speech rate: plus. Research by Kogan and Reiterer 2021.
* Compressed pitch range: plus. Research by Kogan and Reiterer 2021.
* C V syllabic structure: plus. Research by Johannesson 2007, Podhorodecka 2007, Rabanus 2003, and Reiterer et al. 2020.
* Stress-timed rhythm type: minus. Research by Matzinger et al. 2021.
Phonaesthetic predictions that can be formulated in application to specific phonological features with ‘+’ indicating generally pleasant impressions and ‘−’ indicating negative impressions.
2. Methods
2.1. Stimuli
The stimuli consisted of 48 audio recordings, two for each language, with each recording voiced by a different person in order to control for the effect of voices (voice set 1 and voice set 2). Every participant listened to one recording (either from voice set 1 or voice set 2) for each language in a randomized fashion. All participants listened to the following language samples: Albanian, Basque, Breton, Catalan, Corsican, Czech, Danish, Estonian, Finnish, Greek, Hungarian, Icelandic, Irish, Latvian, Maltese, Norwegian, Polish, Portuguese, Romanian, Slovene, Swedish, Turkish, Ukrainian and Welsh. After each recording, participants evaluated each language alongside four aesthetic dimensions detailed below. All but four recordings were produced at the University of Vienna’s Media Lab located within the Faculty of Philological and Cultural Studies. Native speakers of each language were recorded in person by the Phonaesthetics Research Group Vienna, except for Breton and Corsican. Native speakers of Breton and Corsican are too rare in Vienna; therefore, these language samples were recorded by native speakers in their home countries. The Breton recordings were performed by Radio Kreiz Breizh (http://www.rkb.bzh/); the Corsican recordings were produced by individual contacts. Due to a poor quality of Corsican recording, it was eventually excluded from the analysis.
Aesop’s fable ‘The North Wind and the Sun’ was used as the text for the voice recordings, translated into the respective languages by experts. Only female voices were used in the present study for consistency. The speakers were instructed to speak slowly, in a friendly way and in a variety that is close to standard, while remaining as natural as possible. Each of the recordings was normalized with respect to volume but not for amplitude envelope and fundamental frequency (f0) to preserve naturalness. On average, each stimulus had a duration of 36 s with the shortest stimulus lasting 32 s and the longest stimulus lasting 45 s. Previous research on foreign accent research has demonstrated that this duration is sufficient to detect and evaluate a range of phonological features representative of a particular language (Flege, Reference Flege1984).
With the exception of Icelandic, Turkish and Ukrainian, the IPA transcriptions of the recordings were produced by experts in the respective languages (e.g., the Institute of Linguistics and Language Technology at the University of Malta assisted with the transcription of Maltese). When available, transcriptions from the Illustrations of the IPA served as a reference point and were subsequently adjusted to reflect the speakers’ pronunciation and idiolect. In cases where expert assistance was not obtainable – due to the rarity of the language or lack of response from identified specialists – the authors transcribed the language samples to their best knowledge, ensuring alignment with the recordings. These IPA transcriptions were used to define how various phonological features manifested themselves in a particular language (e.g., the percentage of voiced consonants in the sample).
2.2. Procedure
The experimental design was modelled after the pilot study conducted by Reiterer et al. (Reference Reiterer, Kogan, Seither-Preisler and Pesek2020). The language perception experiment was conducted in English and accessible online at https://phonaesthetics.de/. Only participants who reported being proficient in English were allowed to take part. This inevitably limited the pool of participants and implied a rather high proficiency in English, which is one of the limitations of the present study. Participation in the experiment required a computer, internet access and headphones. Upon starting the experiment on the website, participants were prompted to check the volume of the speakers and then provide socio-demographic information, including their year of birth, place of birth, gender and information about countries where they had stayed for over 3 months (mobility). Additionally, participants provided information about their language background, listing up to 10 languages they spoke along with corresponding estimated proficiency levels according to the Common European Framework of Reference for Languages (A1-C2), as well as numerical proficiency ratings on a scale from 0 (knowing only a few words) to 100 (being fluent). They also reported their musicality and singing proficiency using a scale from 1 (low proficiency) to 10 (high proficiency).
Following the socio-demographic questionnaire, the language-rating experiment commenced with a sound test to ensure headphone functionality. Once participants confirmed the correct functioning of the technical equipment, languages were presented in random order. After listening to each language as many times as desired, participants rated them based on eros (How sexy does this language sound to you?), beauty (How beautiful does it sound?), status (How prestigious does it sound?) and order (How well-structured does it sound?), using a scale from 0 to 100. These four scales were the result of collapsing 22 semantic differential scales (pairs of opposite descriptors) adapted from Giles and Niedzielski (Reference Giles, Niedzielski, Bauer and Trudgill1998) and used in a pilot study (Reiterer et al., Reference Reiterer, Kogan, Seither-Preisler and Pesek2020). The experimental design with 22 scales proved to be overwhelming for participants who had to evaluate 16 languages across 22 dimensions in Reiterer et al. (Reference Reiterer, Kogan, Seither-Preisler and Pesek2020). Principal component analysis (PCA) was used as the extraction method to reduce the number of semantic dimensions to a smaller set that captures most of the variance in the data. PCA was performed using the Kaiser criterion (eigenvalues greater than 1) and varimax rotation. The analysis met standard suitability requirements: the KMO value was 0.8, indicating adequate sampling, and Bartlett’s test of sphericity was significant (p = .000), showing that the variables were sufficiently intercorrelated for structure detection. The resulting components – eros, beauty, status and order – have been consistently used in subsequent studies since Reiterer et al. (Reference Reiterer, Kogan, Seither-Preisler and Pesek2020), including the present one.
In the experiment, participants also had to indicate if the languages sounded familiar to them. Even if they responded negatively, they had to guess the language or its close relative (similar-sounding language or language family). This option was given to participants as a free-text response.
2.3. Participants
Participants were recruited through a combination of social media, research platforms (such as Prolific and Prime Research Solutions), email mailing lists and institutional websites. The complete dataset included 227 participants (150 female, 77 male) with various native-language backgrounds. Twenty-three participants were excluded as they exhibit no variability in their answers, which was identified by calculating standard deviations (SDs) of the individual rating behaviour on each scale. If participants had SD = 0 on at least two scales of the experiment, they were excluded from the experiment. Participants with a SD = 0 in only one scale remained in the sample, since this rating behaviour showed signs of reluctance to rate experiment languages on one specific scale (common for eros).
After these analyses of the participant sample, the experiment had 204 valid participants (136 female, 68 male) with the mean age of 32.3 years (SD = 2.7). The participants showed a diverse sample in terms of the number of languages spoken, ranging from one to 10 languages with a mean of 4.16 (SD = 2.03). Fifty percent of the participants spoke between three and five languages indicating that the sample consisted of (self-proclaimed) multilinguals. The native languages (L1s) of the participants comprised 30 different languages, with the most common L1 being Chinese (N = 66), followed by German (N = 59), English (N = 23) and Slovene (N = 11) (Figure 1).
Participants’ native language (L1), sorted and colour-coded by language family.

Figure 1. Long description
The chart features an X-axis ranging from 0 to 60 in increments of 10. The bars are color-coded by language family and listed from highest to lowest frequency.
* Sino-Tibetan (Red): Chinese at approximately 65.
* Germanic (Yellow): German at 59 and English at 23.
* Slavic (Green): Slovene at 11, Russian at 5, Slovak at 2, Czech at 2, B C S at 2, Bulgarian at 1, and Belarussian at 1.
* Romance (Pink): Italian at 7, Spanish at 5, French at 4, Romanian at 2, Catalan at 2, and Portuguese at 1.
* Uralic (Blue): Hungarian at 1, Estonian at 1, and Finnish at 1.
* Other (Grey): Turkish at 2, Basque at 2, Greek at 2, Korean at 1, Kazakh at 1, and Persian at 1.
All participants provided informed consent before participating in the experiment. The experiment was performed in accordance with the following guidelines and regulations: Austrian Data Protection Act (Datenschutzgesetz), Austrian Act on Research Integrity (Forschungsintegritätsgesetz), Austrian Ethical Guidelines for Research (Ethikrichtlinien für die Forschung) and Austrian Science Fund (FWF) Guidelines.
2.4. Data analysis
All analyses were conducted in R (R Core Team, 2021) using Bayesian multilevel regression models implemented in brms. Because previous work and our own preliminary analyses showed that familiarity with a language reliably increases phonaesthetic ratings, the main analyses were restricted to trials in which the stimulus language was not recognized by the participant (recognition score = 0). This allowed us to focus as closely as possible on aesthetic judgments based on the sound of the language rather than on explicit recognition or associated cultural knowledge.
The four dependent variables were beauty, eros, status and order ratings, all measured on scales from 0 to 100. For each outcome, we fitted separate Gaussian multilevel models for each predictor family rather than one single model containing all predictors simultaneously. This resulted in seven model families: (1) individual-difference variables, (2) consonant place of articulation (PoA), (3) consonant MoA, (4) broader segmental-profile variables (vocalic share, voiced consonants and sonority), (5) vowel height, (6) vowel backness and (7) suprasegmental variables. In total, the main analysis comprised 28 models (7 predictor families × 4 outcomes).
This block-wise modelling strategy was chosen for both conceptual and statistical reasons. Conceptually, the predictor sets addressed different levels of explanation, ranging from listener characteristics to segmental and suprasegmental properties of the language samples. Statistically, many phonological predictors represented relative proportions within the same sound system and were therefore more interpretable when analysed within theoretically coherent sets rather than combined into one maximally specified model.
All models included random intercepts for listener and language in order to account for repeated ratings by the same participants and for baseline differences between languages. Voice set was included as a fixed effect in all models to account for the two stimulus sets. Continuous predictors were z-standardized prior to analysis to facilitate interpretation and improve comparability of regression coefficients across models. Only continuous predictors were z-standardized; the outcome variables (beauty, eros, status and order) were analysed on their original 0–100 scales. Accordingly, regression coefficients can be interpreted as expected changes in rating points associated with a one-SD increase in the predictor. Categorical predictors were treatment-coded using the default coding scheme in R.
The models were estimated with weakly informative priors. Fixed effects were assigned Normal (0, 2) priors, intercepts Student-t (3, 50, 20) priors and group-level as well as residual SDs Exponential (1) priors. All models were fitted with four Markov chains, 4,000 iterations per chain, including 2,000 warm-up iterations and an adapt_delta value of .95. Model summaries are reported as posterior estimates and 95% credible intervals (CrIs). Effects were interpreted as robust only when the 95% CrIs excluded zero; otherwise, they were treated as uncertain and not interpreted further unless directly relevant to a theoretical comparison.
Because some predictors were conceptually related – for example, musicality, number of instruments, instrumental skill and singing skill in the individual-differences models, as well as vowel share and sonority in the broader segmental-profile models – we assessed collinearity among fixed effects using variance inflation factors (VIFs) computed with performance::check_collinearity() for each model. VIFs indicated generally low multicollinearity across model families. Most VIF values were below 2. Moderate collinearity emerged only in some PoA models, particularly for dental and alveolar predictors, which is unsurprising given that these variables represent correlated proportions within the same segmental system. In addition, to quantify model-level explanatory power, we computed Bayesian R2 for the fixed-effects component alone and for the full multilevel model including random effects. We also summarized variance components for listener, language and residual variance in order to compare the relative contribution of fixed and random effects across model families.
3. Results
The results section reports first the effect of familiarity with the stimulus languages and then the main Bayesian multilevel analyses restricted to trials in which the language was not recognized (recognition score = 0). For each of the four outcome variables – beauty, eros, status and order – we fitted separate models for different predictor families. Details of the modelling framework, priors and collinearity checks are provided in Section 2.4. The average ratings for each language from 204 participants are shown in Figure 2.
Mean ratings for beauty, eros, status and order with whiskers representing the upper and lower bounds based on standard deviations.

Figure 2. Long description
The figure consists of two vertically stacked bar charts. Each chart has a y-axis labeled Mean ratings ranging from 0 to 100 and an x-axis labeled Language. A color-coded legend on the right identifies linguistic families: Celtic (purple), Finno-Ugric (blue), Germanic (yellow), Other (grey), Romance (red), and Slavic (green).
Top Panel: Beauty.
Bars are arranged in descending order of mean ratings. Greek (Other) has the highest rating at approximately 58, followed by Irish (Celtic), Icelandic (Germanic), and Swedish (Germanic) all around 55. The ratings gradually decrease across 24 languages, ending with Norwegian (Germanic) at approximately 44. Each bar includes a vertical black whisker representing standard deviation.
Bottom Panel: Eros.
Bars are arranged in descending order. Greek (Other) again holds the highest rating at approximately 52, followed by Basque (Other) and Breton (Celtic) around 50. The ratings follow a similar downward trend as the first chart, concluding with Welsh (Celtic) at approximately 38. The distribution of linguistic families is more mixed across the ranking compared to the Beauty panel.
3.1. Familiarity with the languages
Previous research has consistently demonstrated a robust impact of language familiarity on phonaesthetic ratings (Anikin et al., Reference Anikin, Aseyev and Erben Johansson2023; Kogan & Reiterer, Reference Kogan and Reiterer2021; Mooshammer et al., Reference Mooshammer, Bobeck, Hornecker, Meinhardt, Olina, Walch and Xia2023; Reiterer et al., Reference Reiterer, Kogan, Seither-Preisler and Pesek2020). In other words, recognizing a language of the stimulus influences participants’ judgments, typically resulting in higher ratings. For that reason, after listening to each language, participants were asked whether they recognized it and offered an opportunity to guess it. The collected data were subsequently categorized as a factor variable with four levels: 0 (language identified incorrectly or not recognized at all); 1 (correct guess of the language family); 2 (naming a very close typological relative); and 3 (accurately guessing the language). Controlling for participant and language, greater familiarity predicted higher ratings on all scales: compared with unfamiliar trials (score = 0), correctly identified languages (score = 3) were rated higher on beauty (+6.35 points), eros (+5.17), status (+4.19) and order (+4.15); partial recognition (score = 1) only increased order (+2.28).
Our final analysis utilized a subset of the data where the recognition score equated 0. So, only the cases where participants did not recognize the languages of the stimuli were used in this study. Across all trials, 57% had a recognition score of 0. Per language, the proportion of zero-recognition trials ranged from 92% (Breton – barely recognized) to 23% (Ukrainian – the family was recognized widely) with mean = 58% and SD = 16%. After filtering the dataset to include only trials where recognition score equated to 0, we calculated the number of remaining datapoints per language. All 24 languages retained substantial representation. The number of datapoints per language ranged from 52 to 184 (mean = 113.25, SD = 42.16). This confirms that each language maintained a sufficiently large sample for reliable statistical modelling.
3.2 Individual differences
To examine whether listeners’ biographical background, language experience and musical abilities predicted phonaesthetic ratings, we analysed the individual-differences model family for each of the four outcomes: beauty, eros, status and order. The predictors in this model set were gender, age, mobility, self-assessed musicality, number of instruments played, instrumental skill, singing skill, number of languages spoken, lexical distance between participants’ L1 and the stimulus language and voice set. Lexical distance was based on the normalized Levenshtein measure proposed by Petroni and Serva (Petroni & Serva, Reference Petroni and Serva2010; Serva & Petroni, Reference Serva and Petroni2008), ranging from 0 (minimal distance) to 1 (maximal distance), and was included as an approximate measure of cross-linguistic similarity relevant to the auditory nature of the task.
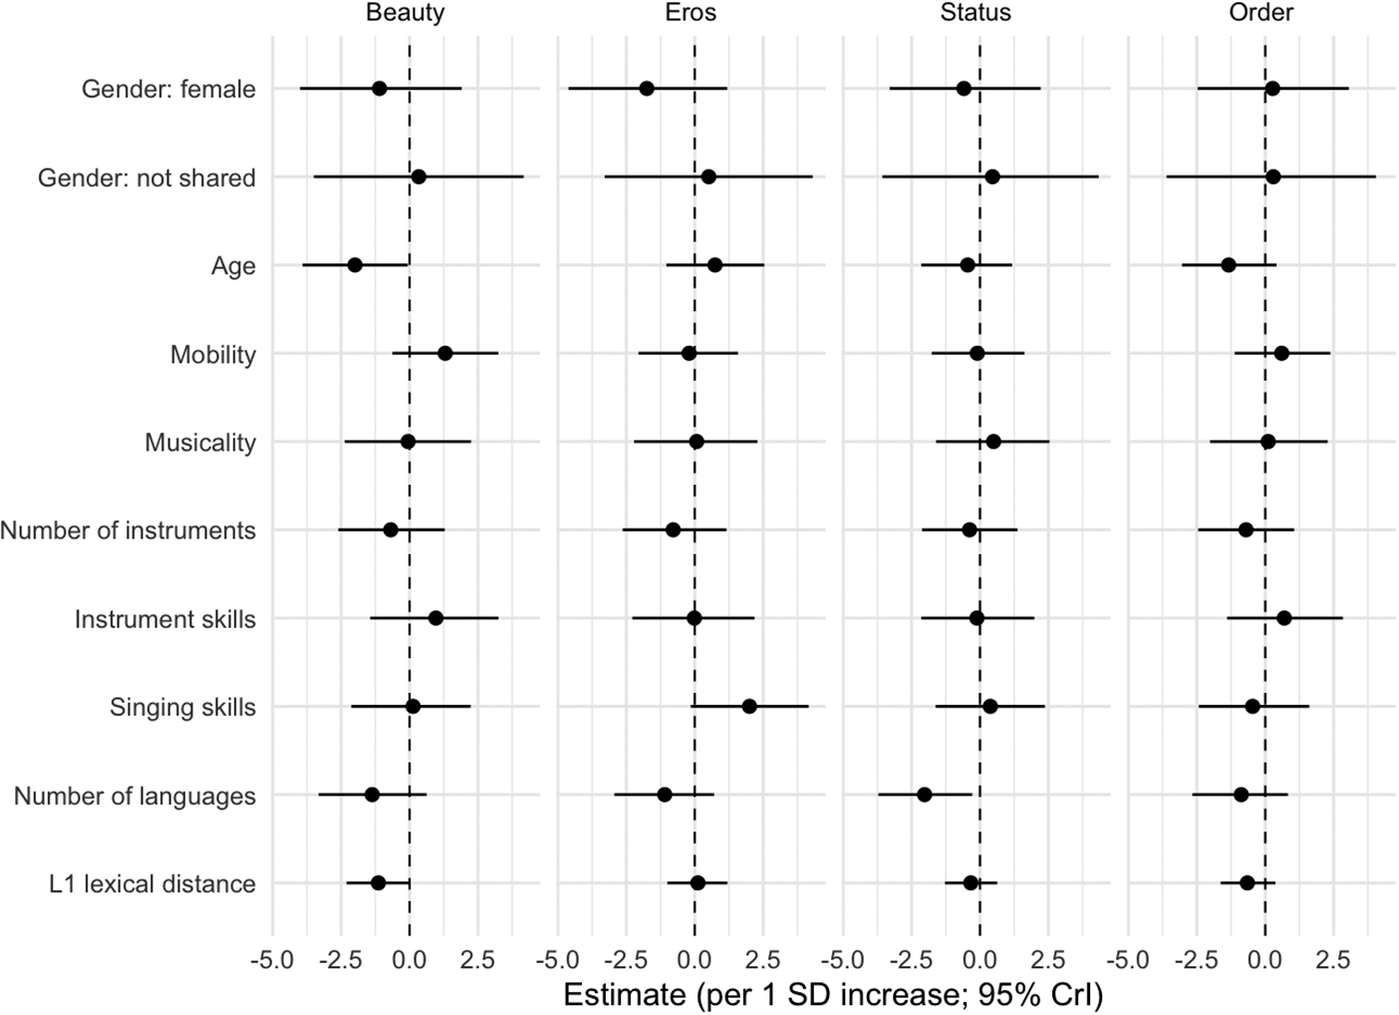
Across the four individual-differences models, most predictors showed no robust effects, with 95% CrIs overlapping zero (Figure 3). Two exceptions emerged: for beauty, older participants gave slightly lower ratings (β ≈ −1.99, 95% CrI [−3.91, −0.06]); for status, participants who reported speaking more languages gave slightly lower ratings (β ≈ −2.02, 95% CrI [−3.71, −0.28]). All other individual-difference predictors remained small and uncertain.
Individual-difference predictors across phonaesthetic outcomes.

Figure 3. Long description
The multi-panel forest plot consists of four vertical columns labeled Beauty, Eros, Status, and Order. The x-axis for all panels is labeled Estimate per 1 S D increase 95 percent C r I, ranging from negative 5.0 to 2.5 with a dashed vertical line at zero. The y-axis lists ten predictors from top to bottom.
* Gender female. Beauty is negative. Eros is negative. Status is negative. Order is positive.
* Gender not shared. Beauty is near zero. Eros is positive. Status is positive. Order is positive.
* Age. Beauty is negative. Eros is positive. Status is negative. Order is negative.
* Mobility. Beauty is positive. Eros is negative. Status is near zero. Order is positive.
* Musicality. Beauty is zero. Eros is zero. Status is positive. Order is zero.
* Number of instruments. Beauty is negative. Eros is negative. Status is negative. Order is negative.
* Instrument skills. Beauty is positive. Eros is zero. Status is zero. Order is positive.
* Singing skills. Beauty is zero. Eros is positive. Status is positive. Order is negative.
* Number of languages. Beauty is negative. Eros is negative. Status is negative. Order is negative.
* L 1 lexical distance. Beauty is negative. Eros is zero. Status is negative. Order is negative.
Most estimates hover near the zero line, with the strongest negative effects seen in Number of languages across all outcomes and the strongest positive effect for Singing skills in the Eros panel.
Importantly, we found no robust evidence that lexical distance between participants’ L1 and the language they listened to systematically predicted ratings. In all four models, posterior estimates for lexical distance were small, with wide CrIs that included zero. Given that our sample, while including 30 different L1s, was dominated by Chinese (N = 66) and German (N = 59) speakers, these exploratory patterns should not be interpreted as firm evidence for an effect of lexical distance.
Finally, despite a substantial number of native Chinese speakers, L1 Chinese did not show a reliable association with beauty, eros, status or order ratings. In other words, Chinese-speaking participants rated the languages similarly to speakers of European languages.
3.3. Relationship between aesthetic judgments and linguistic features
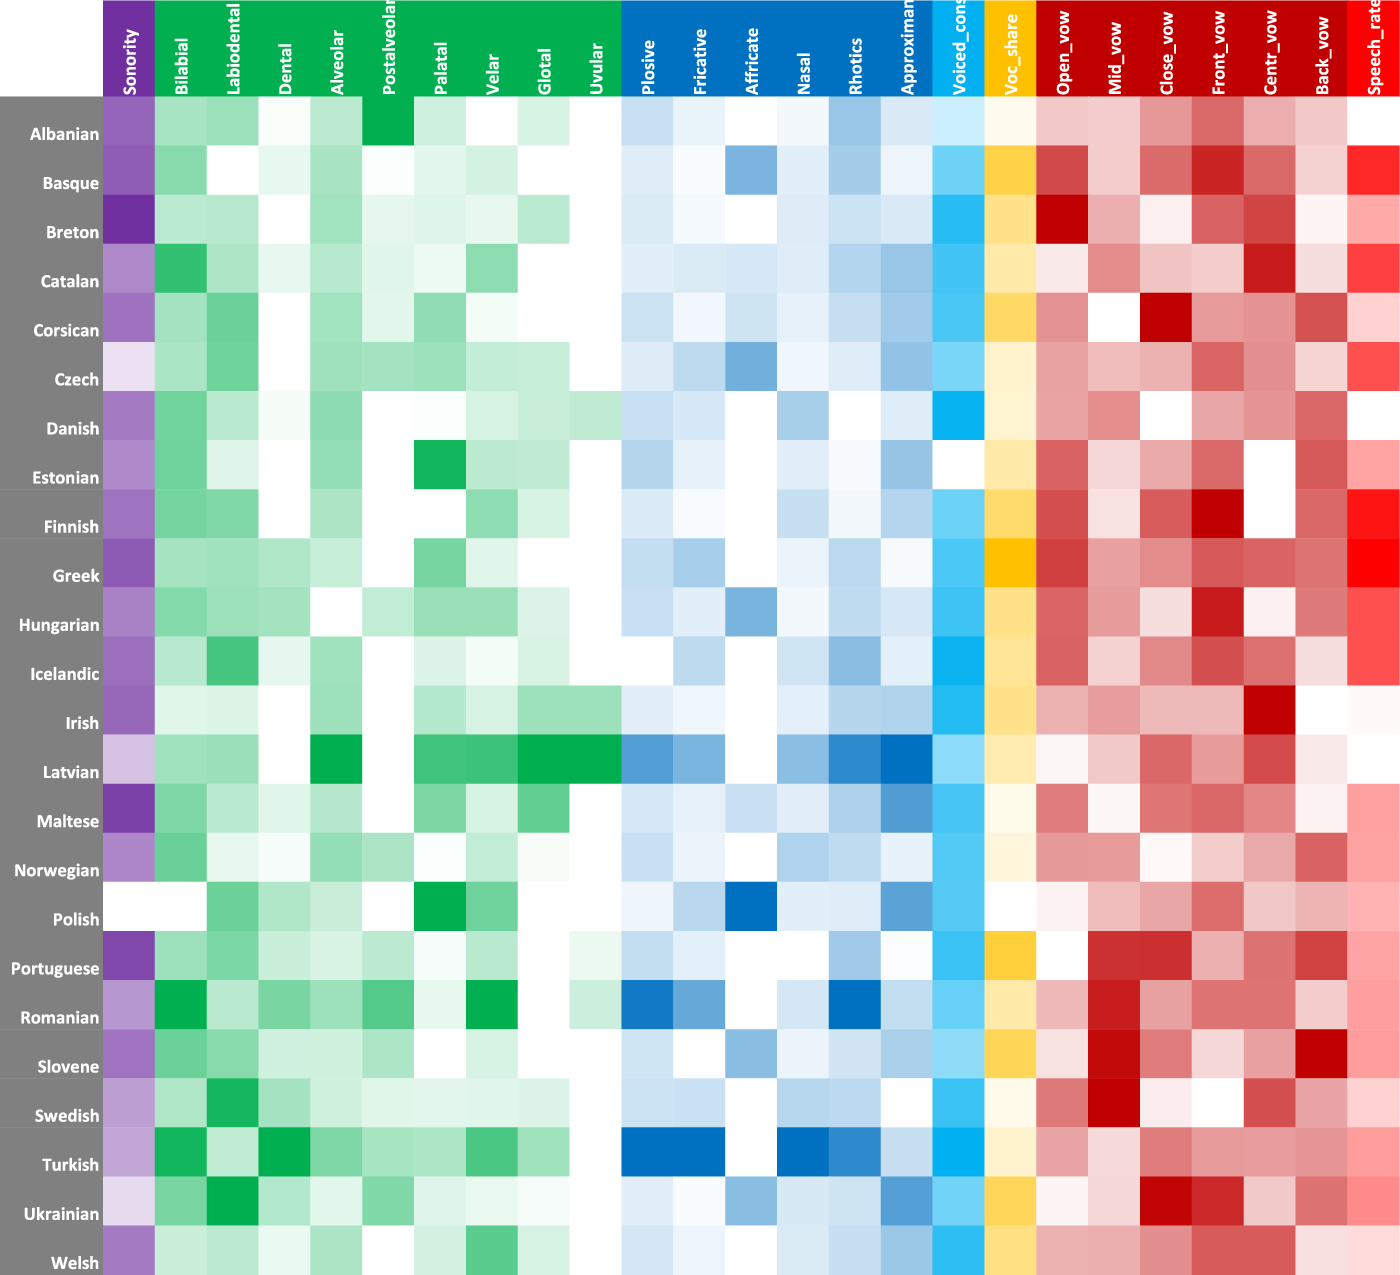
To examine whether phonological and typological properties predicted perceived beauty, eros, status and order, we analysed separate model families for PoA, MoA, broader segmental-profile, vowel structure and suprasegmental features. Figure 4 summarizes the cross-linguistic distribution of the linguistic features entered into these analyses. Because many predictors are relative proportions derived from the same segmental inventory, their effects should be interpreted as shifts in relative composition rather than as isolated contributions of individual categories.
Overview of the languages sorted by order ratings (descending). The columns represent the phonological features, grouped by colour. The shade of the colour indicates the relative intensity of each feature compared between languages; the highest percentage share is the darkest shade. The column in violet represents the sonority, light blue shows the voiced consonants and yellow the vocalic share. The green columns represent the PoA, the blue group the MoA and the red column shows the speech rate.

Figure 4. Long description
A heatmap grid with 24 languages listed vertically on the left Y-axis and 23 phonological features listed horizontally across the top X-axis. The languages, from top to bottom, are Albanian, Basque, Breton, Catalan, Corsican, Czech, Danish, Estonian, Finnish, Greek, Hungarian, Icelandic, Irish, Latvian, Maltese, Norwegian, Polish, Portuguese, Romanian, Slovene, Swedish, Turkish, Ukrainian, and Welsh.
The columns are grouped into seven color-coded categories:
- Sonority: A single violet column.
- Place of Articulation (P o A): Nine green columns including Bilabial, Labiodental, Dental, Alveolar, Postalveolar, Palatal, Velar, Glotal, and Uvular.
- Manner of Articulation (M o A): Six light blue columns including Plosive, Fricative, Affricate, Nasal, Rhotics, and Approximant.
- Voiced Consonants: A single bright blue column.
- Vocalic Share: A single yellow column.
- Vowel Types: Six red columns including Open vow, Mid vow, Close vow, Front vow, Centr vow, and Back vow.
- Speech Rate: A final red column on the far right.
Data trends show high intensity (darker shades) for Sonority in Breton and Maltese. Latvian shows high intensity across several green P o A columns. The red vowel columns show high intensity for Breton in Open vow and Finnish in Front vow. Turkish and Ukrainian show high intensity in the Plosive and Nasal M o A categories.
3.3.1. Place of articulation (PoA)
For each language, we computed the percentage of bilabial, labiodental, dental, alveolar, postalveolar-palatal, velar and glottal-uvular consonants (Figure 4) by tallying occurrences relative to the total number of segments in each stimulus. These values were based on IPA transcriptions, which were verified by experts in most cases. Where expert verification was not possible (Icelandic, Turkish, Ukrainian), the authors conducted verification to the best of their knowledge. PoA classes were defined using the Illustrations of the IPA article collection, PHOIBLE (Moran et al., Reference Moran, McCloy and Wright2014) and consultations with specialists.
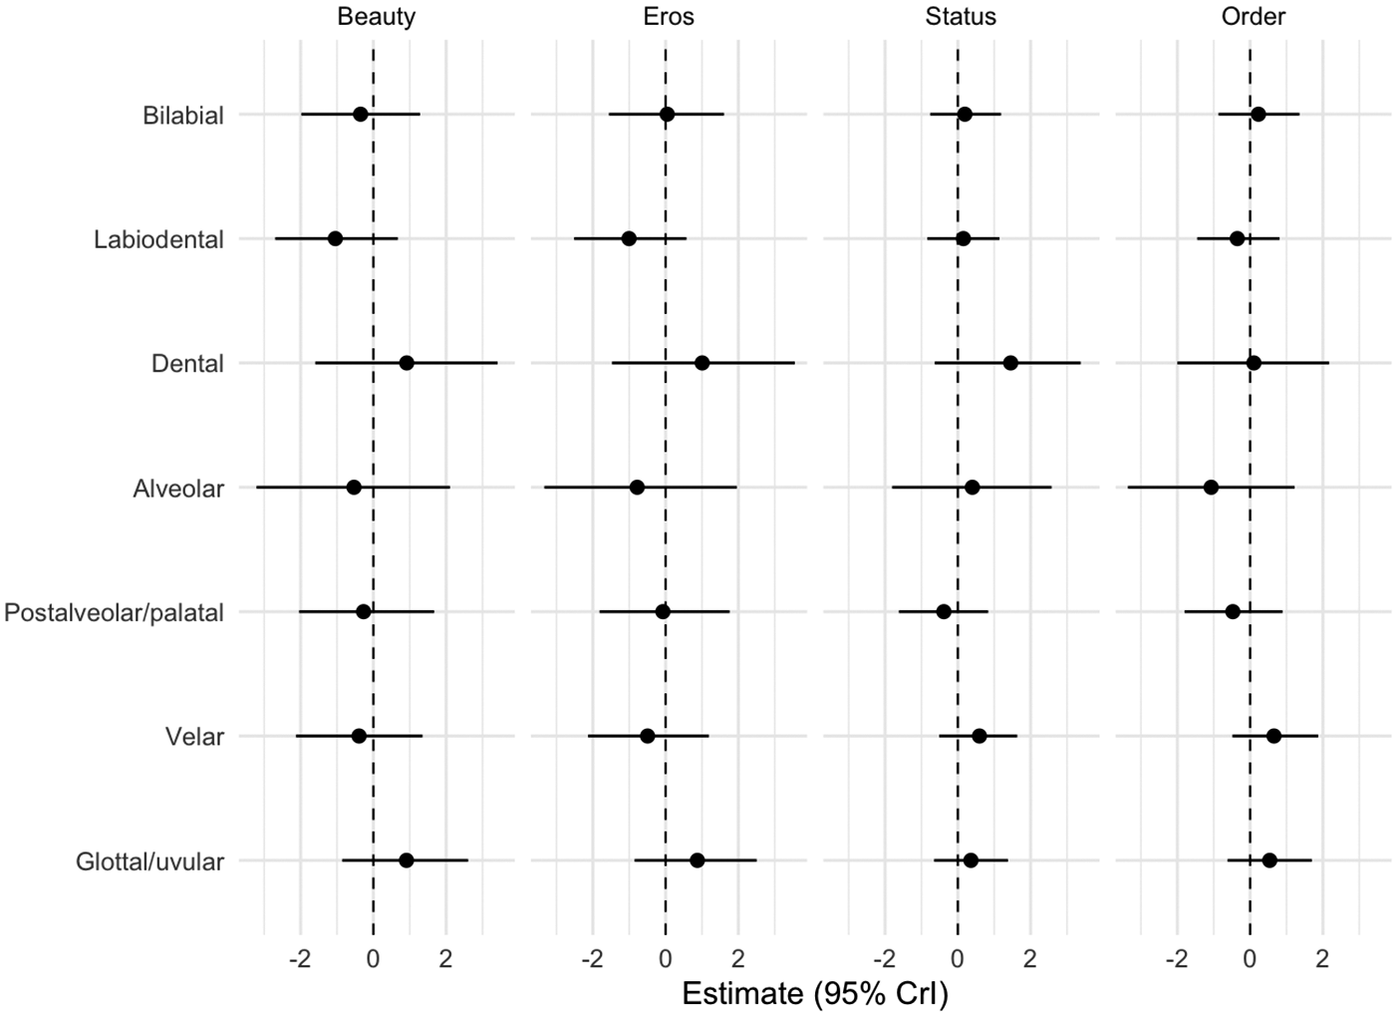
Across all four models, none of the PoA predictors showed robust effects: all 95% CrIs overlapped zero (Figure 5).
Place of articulation predictors across phonaesthetic outcomes.

Figure 5. Long description
The x-axis represents the Estimate 95 percent C r I, ranging from negative 2 to 2. The y-axis lists seven places of articulation: Bilabial, Labiodental, Dental, Alveolar, Postalveolar forward slash palatal, Velar, and Glottal forward slash uvular. Each panel contains dot plots with horizontal error bars representing credible intervals.
* Beauty panel: Labiodental and Alveolar show negative estimates. Dental and Glottal forward slash uvular show positive estimates. Bilabial, Postalveolar forward slash palatal, and Velar are centered near zero.
* Eros panel: Labiodental and Alveolar show negative estimates. Dental and Glottal forward slash uvular show positive estimates. Bilabial, Postalveolar forward slash palatal, and Velar are centered near zero.
* Status panel: Dental shows a distinct positive estimate. Postalveolar forward slash palatal shows a slight negative estimate. Other categories are near zero.
* Order panel: Alveolar shows a negative estimate. Velar and Glottal forward slash uvular show positive estimates. Bilabial, Labiodental, Dental, and Postalveolar forward slash palatal are near zero.
3.3.2. Manner of articulation (MoA)
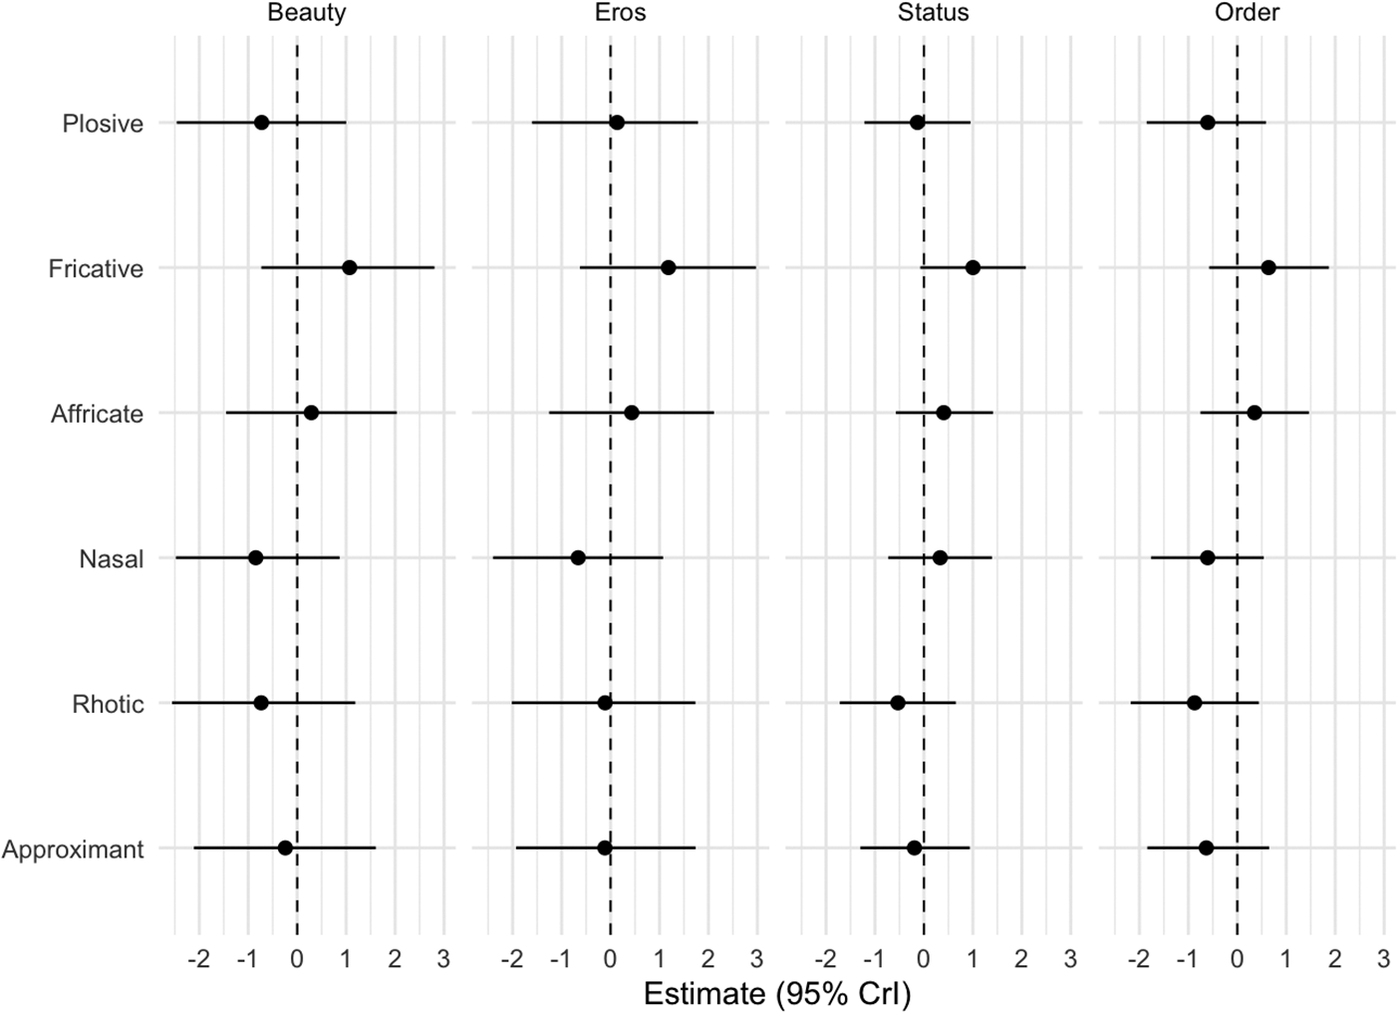
Using the same sources as for PoA, we calculated the percentages of plosive, fricative, affricate, nasal, rhotic and approximant consonants out of all consonants in each stimulus (Figure 4). Following common practice but acknowledging ongoing debate about the unity of the rhotics class (e.g., Howson & Monahan, Reference Howson and Monahan2019), we treated as rhotics phonemes associated with /r/ and its primary cross-linguistic realizations. Across the four MoA models, posterior estimates were small and 95% CrIs overlapped zero (Figure 6).
Manner of articulation predictors across phonaesthetic outcomes.

Figure 6. Long description
Fallback
3.3.3. Vocalic share, voiced consonants and sonority
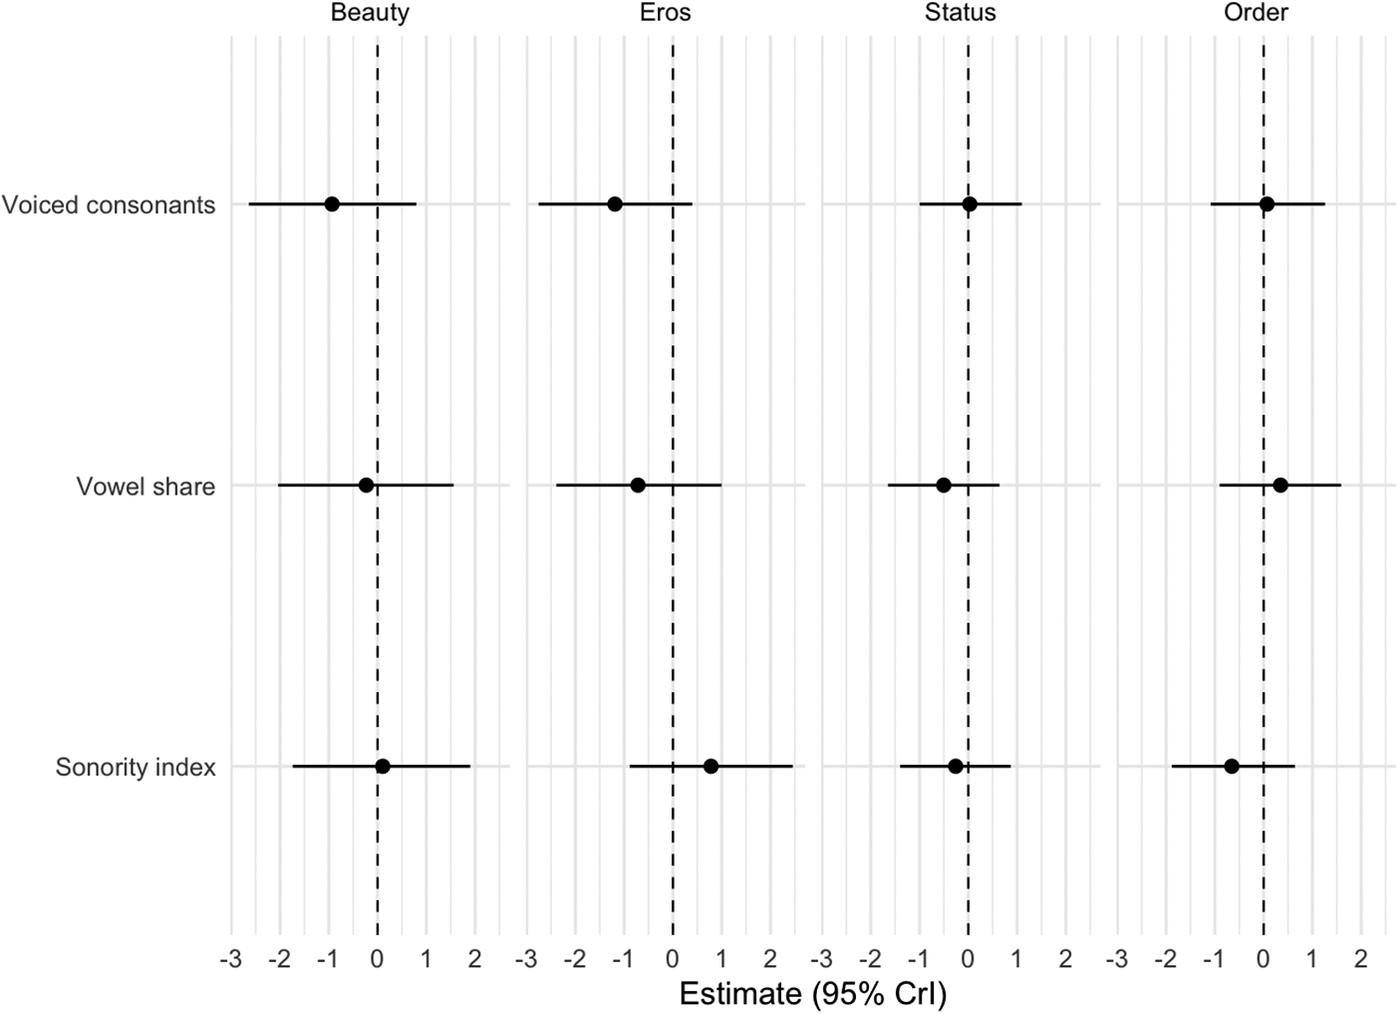
We next examined broader segmental-profile measures: vocalic share (percentage of vowels out of all segments), voiced consonants (percentage of voiced consonants out of all consonants) and an overall sonority index calculated using Nemestothy’s (Reference Nemestothy2022) adaptation of Fought et al.’s (Reference Fought, Munroe, Fought and Good2004) scale. Across the four models, no robust fixed effects were observed (Figure 7).
Global segmental-profile predictors across phonaesthetic outcomes.

Figure 7. Long description
The multi-panel chart consists of twelve individual forest plots arranged in a grid. The horizontal x-axis for every plot represents the Estimate 95 percent C r I, ranging from negative 3 to positive 2. A vertical dashed line at 0 indicates the null effect.
Top row, Voiced consonants:
- Beauty: The point estimate is at negative 1 with an error bar from negative 3 to 1.
- Eros: The point estimate is at negative 1.2 with an error bar from negative 2.5 to 0.5.
- Status: The point estimate is at 0 with an error bar from negative 1 to 1.
- Order: The point estimate is at 0 with an error bar from negative 1 to 1.5.
Middle row, Vowel share:
- Beauty: The point estimate is at negative 0.2 with an error bar from negative 2 to 1.5.
- Eros: The point estimate is at negative 0.8 with an error bar from negative 2.2 to 1.
- Status: The point estimate is at negative 0.5 with an error bar from negative 1.5 to 0.8.
- Order: The point estimate is at 0.4 with an error bar from negative 1 to 1.8.
Bottom row, Sonority index:
- Beauty: The point estimate is at 0.1 with an error bar from negative 1.8 to 2.
- Eros: The point estimate is at 0.8 with an error bar from negative 0.8 to 2.5.
- Status: The point estimate is at negative 0.2 with an error bar from negative 1.5 to 1.
- Order: The point estimate is at negative 0.7 with an error bar from negative 1.8 to 0.5.
3.3.4. Vowels
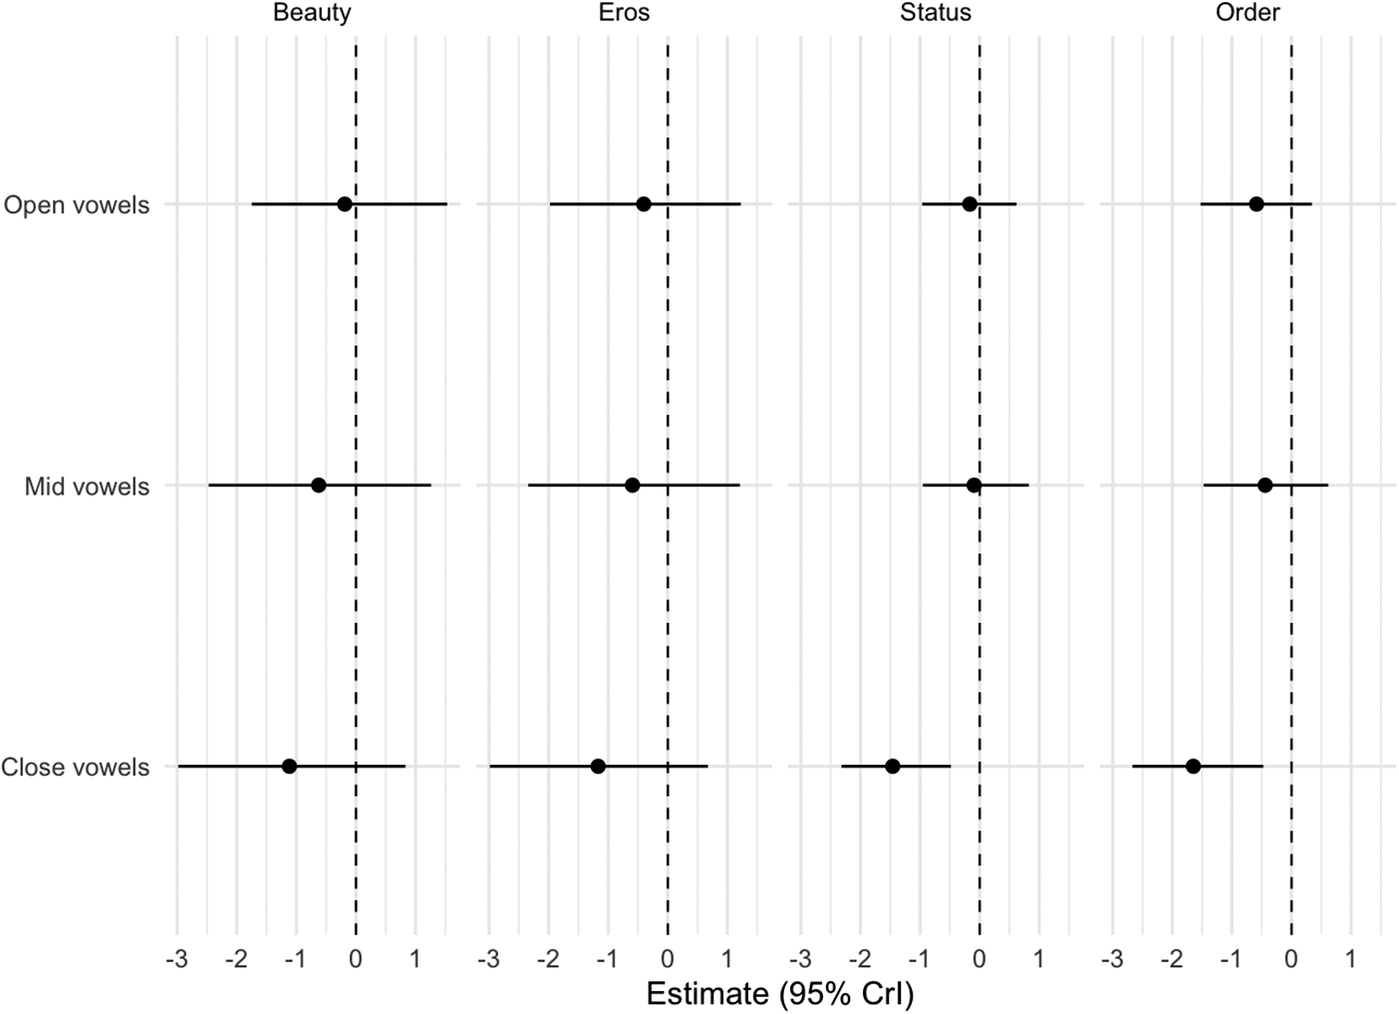
We computed the percentages of close, mid and open vowels out of all vowels in each stimulus. For vowel height, beauty and eros models showed no robust effects: all 95% CrIs overlapped zero (Figure 8). In contrast, close vowels emerged as the only consistent segmental predictor in this set: a higher proportion of close vowels was associated with lower status ratings, by about 1.45 points on the 0–100 scale for a one-SD increase in the predictor (β ≈ −1.45, 95% CrI [−2.32, −0.48]) and lower order ratings (β ≈ −1.63, 95% CrI [−2.67, −0.47]). Open and mid vowels showed no reliable associations.
Vowel-height predictors across phonaesthetic outcomes.

Figure 8. Long description
The grid consists of twelve panels. The x-axis for all panels is labeled Estimate 95 percent C r I, ranging from negative 3 to 1. A vertical dashed line marks the zero baseline. The columns are Beauty, Eros, Status, and Order. The rows are Open vowels, Mid vowels, and Close vowels.
* In the Beauty column, the point estimates for Open, Mid, and Close vowels are all negative, with Close vowels showing the strongest negative effect near negative 1.1.
* In the Eros column, Open and Mid vowels have estimates near negative 0.5, while Close vowels show a stronger negative effect near negative 1.2.
* In the Status column, Open and Mid vowels are centered near zero, while Close vowels show a distinct negative effect near negative 1.5.
* In the Order column, Open and Mid vowels are centered near negative 0.5, while Close vowels show a stronger negative effect near negative 1.7.
Across all outcomes, Close vowels consistently show the most negative estimates compared to Open and Mid vowels. All data points include horizontal error bars representing the 95 percent credible interval.
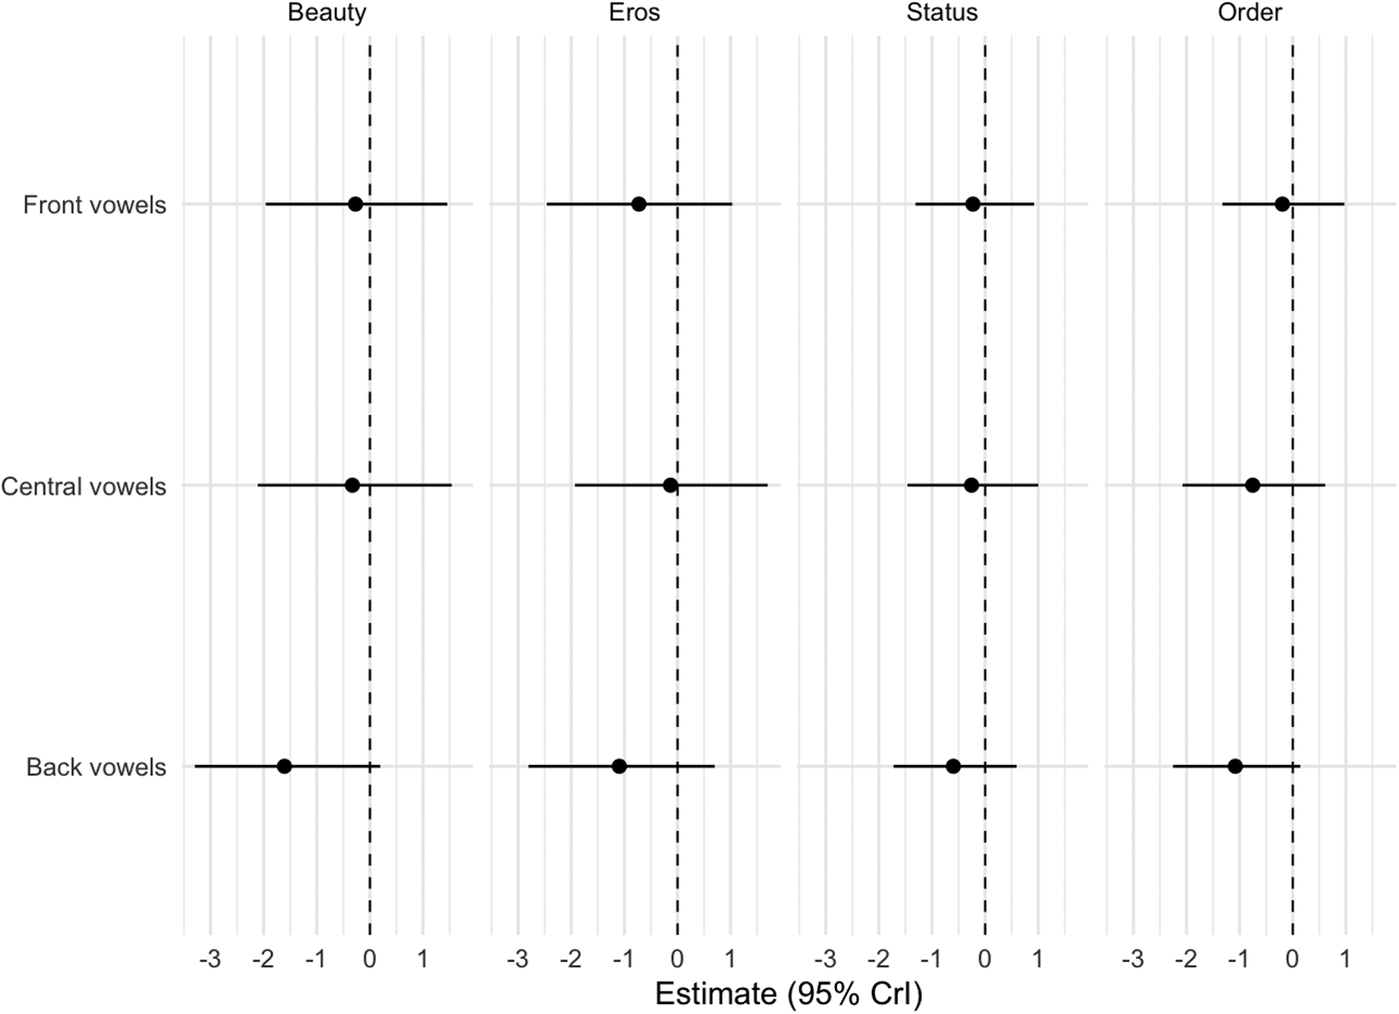
We also computed the percentages of front, central and back vowels out of all vowels in each stimulus. We found no robust evidence that vowel backness (front/central/back) predicted any of the four phonaesthetic ratings; all 95% CrIs for these effects included zero (Figure 9).
Vowel backness predictors across phonaesthetic outcomes.

Figure 9. Long description
The multi-panel plot consists of four columns labeled Beauty, Eros, Status, and Order. The vertical axis lists three vowel categories from top to bottom: Front vowels, Central vowels, and Back vowels. The horizontal axis for all panels is labeled Estimate 95 percent C r I, ranging from negative 3 to 1, with a dashed vertical line at 0 representing the null effect.
In the Beauty column, Front and Central vowels have estimates near negative 0.5, while Back vowels show a stronger negative effect near negative 1.5.
In the Eros column, Front vowels are near negative 0.5, Central vowels are at 0, and Back vowels are near negative 1.
In the Status column, Front and Central vowels are near negative 0.2, while Back vowels are near negative 0.5.
In the Order column, Front vowels are near 0, Central vowels are near negative 0.8, and Back vowels are near negative 1.
Across all panels, horizontal error bars indicate the 95 percent credible interval, with most intervals for Back vowels being entirely to the left of the zero line, indicating a consistent negative correlation.
3.3.5. Suprasegmental features
Finally, we explored the influence of speech rate, syllable structure (complex, moderate, simple), lexical stress type (fixed versus free) and rhythm type (syllable-timed, stress-timed, mora-timed). Speech rate (syllables per second; Coupé et al., Reference Coupé, Oh, Dediu and Pellegrino2019) was calculated auditorily by a trained researcher using a digital audio workstation with script-based visual checks. Speech rate values showed strong agreement across voice sets and correlated with values reported by Coupé et al. (Reference Coupé, Oh, Dediu and Pellegrino2019). Information on syllable structure was extracted from WALS (Dryer & Haspelmath, Reference Dryer and Haspelmath2013), while stress type and rhythm type were based on the Illustrations of the IPA and consultation with language experts.
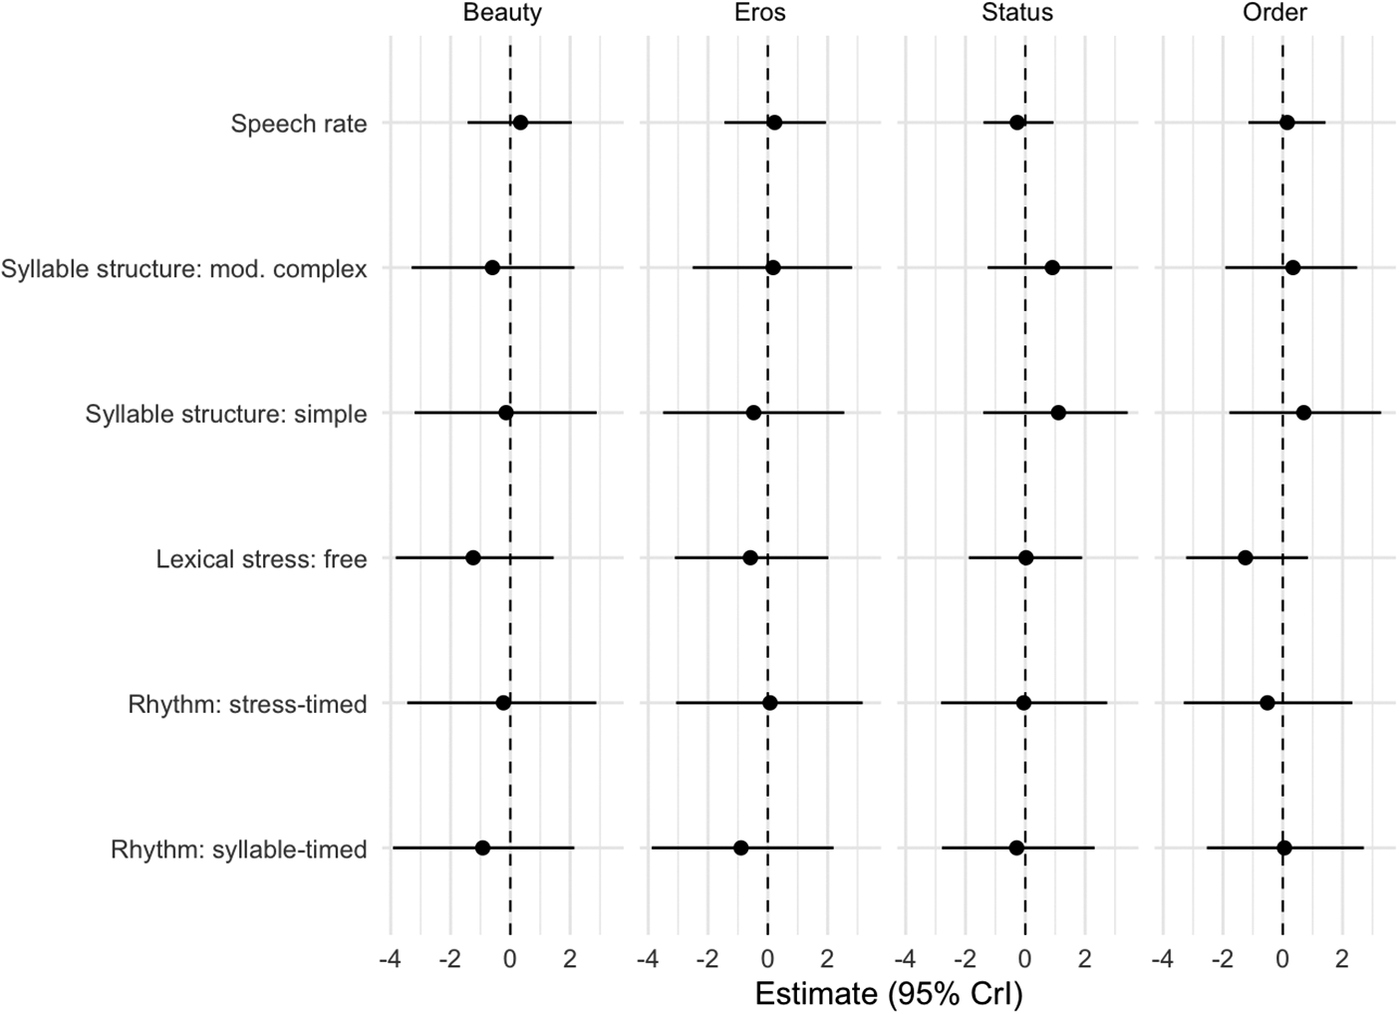
Across the four suprasegmental models, no robust fixed effects emerged: 95% CrIs for speech rate, syllable structure, stress and rhythm type overlapped zero (Figure 10).
Suprasegmental predictors across phonaesthetic outcomes.

Figure 10. Long description
The multi-panel plot consists of four vertical columns labeled Beauty, Eros, Status, and Order. The x-axis for all panels represents the Estimate 95 percent C r I, ranging from negative 4 to positive 2, with a dashed vertical line at zero indicating no effect. The y-axis lists six predictors from top to bottom: Speech rate, Syllable structure: mod. complex, Syllable structure: simple, Lexical stress: free, Rhythm: stress-timed, and Rhythm: syllable-timed.
* In the Beauty panel, most estimates are slightly negative or centered on zero. Lexical stress: free and Rhythm: syllable-timed show the strongest negative trends.
* In the Eros panel, Speech rate and Syllable structure: mod. complex are centered on zero, while Rhythm: syllable-timed and Syllable structure: simple show negative estimates.
* In the Status panel, Syllable structure: mod. complex and Syllable structure: simple show positive estimates, while other predictors are centered near zero.
* In the Order panel, Syllable structure: simple shows a positive estimate, while Lexical stress: free and Rhythm: stress-timed show negative estimates.
Each data point is represented by a black dot for the mean estimate and a horizontal line representing the 95 percent credible interval. Most intervals are wide, crossing the zero-line, indicating high uncertainty.
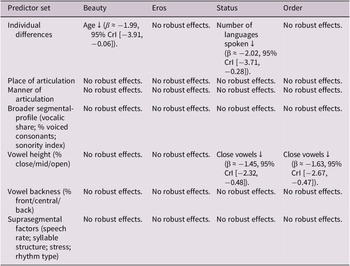
The summary of the results can be found in Table 2 below.
Summary table of fixed-effect results

Table 2. Long description
The table consists of five columns: Predictor set, Beauty, Eros, Status, and Order.
* Individual differences: Beauty shows a decrease with Age beta is approximately minus 1.99, 95 percent C r I open bracket minus 3.91, minus 0.06 close bracket. Eros and Order show no robust effects. Status shows a decrease with Number of languages spoken beta is approximately minus 2.02, 95 percent C r I open bracket minus 3.71, minus 0.28 close bracket.
* Place of articulation: No robust effects across all columns.
* Manner of articulation: No robust effects across all columns.
* Broader segmental-profile including vocalic share, percentage voiced consonants, and sonority index: No robust effects across all columns.
* Vowel height including percentage close, mid, or open: Beauty and Eros show no robust effects. Status shows a decrease for Close vowels beta is approximately minus 1.45, 95 percent C r I open bracket minus 2.32, minus 0.48 close bracket. Order shows a decrease for Close vowels beta is approximately minus 1.63, 95 percent C r I open bracket minus 2.67, minus 0.47 close bracket.
* Vowel backness including percentage front, central, or back: No robust effects across all columns.
* Suprasegmental factors including speech rate, syllable structure, stress, and rhythm type: No robust effects across all columns.
3.4. Model explanatory power and variance decomposition
To assess model explanatory power, we computed Bayesian R2 for the fixed-effects component alone and for the full multilevel model including random intercepts for participant and language. Across all model families and outcomes, the fixed effects explained only a small proportion of variance in ratings (R2fixed = .004–.032), whereas the full models explained substantially more variance (R2full = .410–.446). This suggests that a large share of explainable variance was associated with the multilevel structure rather than with the fixed predictors alone.
Variance-component estimates further showed that between-listener variability was consistently large across all models, accounting for approximately 36–39% of total variance, whereas between-language variability was much smaller, typically accounting for about 1–3% of total variance and, in some status and order models, less than 1%. The remaining variance was residual (approximately 59–61%). Overall, this pattern indicates that aesthetic judgments varied much more strongly across listeners than across languages.
Among the fixed-effects-only models, the biographical models explained the most variance across outcomes (R2fixed = .022–.032), followed by place and MoA models (R2fixed ≈ .010–.015), whereas broader segmental-profile, vowel and suprasegmental models explained less variance overall (R2fixed ≈ .004–.010).
4. Discussion
4.1. Overall pattern of results
The aim of this study was to examine how the sound structure of 24 recordings of European languages relates to listeners’ phonaesthetic evaluations. In earlier work using a similar design but with languages familiar to participants, Kogan and Reiterer (Reference Kogan and Reiterer2021) and Reiterer et al. (Reference Reiterer, Kogan, Seither-Preisler and Pesek2020) observed a ‘Latin Lover Effect’, whereby Romance languages received higher beauty and eros ratings. In the present study, this pattern was much weaker: specifically, sonority – a characteristic more common in Romance languages – showed at most a small, uncertain association with beauty and eros.
Overall, aesthetic judgments demonstrated relatively little variation across languages, especially when compared to the range typically observed for visual art or music. Across most model families, fixed effects were small and their 95% CrIs included zero. This indicates limited evidence that broad phonological typologies or listener biographical variables systematically shape phonaesthetic judgments once baseline differences between listeners and languages are taken into account.
The most consistent signal observed was a negative association between the proportion of close vowels and ratings of status and order. In contrast, predictors related to place and MoA, global segmental indices (vowel share, voiced consonants, sonority) and suprasegmental typology (syllable structure, stress type, rhythm type) showed no robust relationships with any of the four evaluative scales.
This overall pattern is theoretically unsurprising. The aesthetic (or poetic) function of language is only one of the six functions identified by Jakobson (Reference Jakobson1960), and spoken language is typically assigned a predominantly propositional role aimed at conveying semantic content rather than aesthetic value (Haiduk & Fitch, Reference Haiduk and Fitch2022). Nonetheless, language can engage the human reward system in ways comparable to music, as in poetry, infant-directed speech or ritual chanting (Falk et al., Reference Falk, Rathcke and Dalla Bella2014; Haiduk & Fitch, Reference Haiduk and Fitch2022). Compared to music, speech is usually atonal and lacks rich melodic structure (Chow & Brown, Reference Chow and Brown2018), but language-specific melodic patterns can still be perceived as more or less pleasant (Košić & Matzinger, Reference Košić and Matzinger2023; Matzinger et al., Reference Matzinger, Specker, Ritt and Fitch2021). Anikin et al. (Reference Anikin, Aseyev and Erben Johansson2023) show that any population-level preferences for linguistic features tend to be small. Yet research on language evolution suggests that even weak biases can accumulate over time – a process known as bias amplification (Dediu, Reference Dediu2011; Kirby et al., Reference Kirby, Dowman and Griffiths2007; Thompson et al., Reference Thompson, Kirby and Smith2016). Small aesthetic preferences may thus shape the typological distribution of phonemes and suprasegmental features across the world’s languages (Anikin et al., Reference Anikin, Aseyev and Erben Johansson2023; Matzinger et al., Reference Matzinger, Specker, Ritt and Fitch2021), and they may also influence which features individual learners favour or retain (Košić & Matzinger, Reference Košić and Matzinger2023; Matzinger & Košić, Reference Matzinger and Košić2025).
4.2. Close vowels as a small but consistent cue
Against this generally weak pattern of fixed effects, the close-vowel effect for status and order stands out as a coherent and interpretable exception. A higher proportion of close vowels was associated with lower perceived status and lower perceived order, with CrIs excluding zero for both outcomes. Importantly, this effect did not extend to beauty or eros, suggesting that vowel height relates more specifically to evaluative dimensions tied to perceived structure, precision or social valuation, rather than to general pleasantness or sensuality. The size of the effect is modest, but its recurrence across two conceptually aligned scales strengthens the case that vowel-height distributions may function as a subtle cue that listeners use, consciously or not, when judging the prestige or orderliness of unfamiliar languages. Earlier work, particularly on conlangs, has tended to highlight the aesthetic relevance of vowel backness rather than height (Mooshammer et al., Reference Mooshammer, Bobeck, Hornecker, Meinhardt, Olina, Walch and Xia2023; Peterson, Reference Peterson2015; Podhorodecka, Reference Podhorodecka, Fischer, Ljungberg and Tabakowska2007). In that literature as well as in our previous research, back vowels have been associated with lower pleasantness ratings (Nemestothy et al., Reference Nemestothy, Kogan and Reiterer2024). Our findings fit more naturally with vowel–size sound symbolism: across many studies, close/high vowels (especially /i/) are reliably associated with smallness (Blasi et al., Reference Blasi, Wichmann, Hammarström, Stadler and Christiansen2016: Winter, Reference Winter2021). If close vowels evoke ‘small/less imposing’, this could help explain why stimuli with a higher proportion of close vowels were judged as lower in status and less orderly in our data.
4.3. Limited impact of consonantal and suprasegmental structures
The absence of robust effects for place and MoA suggests that the relative frequency of broad consonant classes is not a primary driver of phonaesthetic impressions in this paradigm. Although some posterior means differed in direction across consonant classes, none of these effects was estimated with sufficient precision to support a robust interpretation. These patterns may indicate that consonantal contributions are either too small to detect with the current materials and sample, or too dependent on finer-grained acoustic and contextual factors (e.g., allophonic realizations, coarticulation, voice quality) that are not captured by simple class percentages.
Similarly, global segmental indices such as vowel proportion, voiced-consonant share and sonority yielded small and uncertain estimates. This is noteworthy given earlier claims that higher vowel ratios and simpler CV structures are associated with greater regularity, rhythmicity and aesthetic appeal (Matzinger et al., Reference Matzinger, Specker, Ritt and Fitch2021; Rabanus, Reference Rabanus2003), and that higher sonority correlates with lower perceived order (Kogan & Reiterer, Reference Kogan and Reiterer2021; Reiterer et al., Reference Reiterer, Kogan, Seither-Preisler and Pesek2020). Our point estimates were broadly consistent with these expectations and earlier works, but the uncertainty around them was substantial. Sonority, like consonant class distributions, may simply be too coarse a summary: high sonority can arise from many different configurations (e.g., vowel-dense systems versus languages with many sonorous consonants such as Maltese), and these configurations may have distinct perceptual consequences.
The suprasegmental models likewise provided no strong evidence that speech rate, syllable-structure type, stress system or rhythm type systematically influence phonaesthetic ratings. Point estimates were small with CrIs overlapping zero for all scales, including contrasts that might have been expected to matter, such as fixed versus variable stress or more versus less complex syllable structure. Theoretically, prosodic regularities such as fixed stress and simple CV syllables are often argued to promote a sense of order by enhancing rhythmic predictability and facilitating segmentation (Matzinger et al., Reference Matzinger, Specker, Ritt and Fitch2021; Rabanus, Reference Rabanus2003). Our results do not offer strong empirical support for this hypothesis at the level of broad typological labels. One likely explanation is that categorical typological codes (e.g., ‘stress-timed’ versus ‘syllable-timed’, ‘simple’ versus ‘complex’ syllable structure) do not capture the prosodic dynamics of short speech samples. Listeners may attend instead to more immediate acoustic patterns: local timing regularities, pitch movements or the interaction of prosody with segmental content, which only loosely map onto standard typological categories. In this sense, the null patterns for suprasegmentals echo those for segmental structure. However, this could also show that our classical categories of phonetic and phonological phenomena do not capture subtle aesthetic opinions and perhaps other acoustic or sound-related phenomena have yet to be discovered.
4.4. Individual differences and lexical distance
A central finding across all analyses is the magnitude of between-listener variability relative to fixed effects. Random intercept variance for listeners was substantial in every model, while language-level variance, though non-trivial, was clearly smaller. Once listener- and language-level baselines were taken into account, most individual-difference predictors remained small and uncertain. However, two exceptions emerged: older participants gave slightly lower beauty ratings, and participants reporting more languages spoken gave slightly lower status ratings. These effects were modest in size and should be interpreted cautiously, but they indicate that listener characteristics may contribute to specific evaluative dimensions. Research on aesthetic perception would likely benefit from a more systematic examination of individual differences: that is, how listeners with different cognitive and perceptual profiles respond to aesthetically rich stimuli (an attempt was made to capture some of this variability in Winkler et al., Reference Winkler, Kogan and Reiterer2023). In terms of auditory stimuli and speech, it is important to take into consideration the fact that listeners do not attend to the same acoustic cues to the same extent (e.g., formant structure, pitch, temporal/timing information), and this variability can meaningfully shape both aesthetic perception and speech perception (Saito et al., Reference Saito, Sun and Tierney2020).
A particularly informative null result concerns lexical distance between participants’ L1 and the target languages. Across models, lexical-distance estimates were small and uncertain, providing no robust evidence that greater L1-target distance systematically lowers or raises phonaesthetic evaluations. This speaks against a strong role for perceived similarity as a driver of aesthetic judgments of unfamiliar languages. At the same time, the L1 distribution in our sample was uneven (with many Chinese and German speakers and a long tail of rarer L1s), so subtle distance effects might require more balanced L1 sampling or explicit measures of perceived similarity and familiarity.
Taken together, these patterns portray phonaesthetic evaluation as driven by a combination of small, dimension-specific cues (such as the close-vowel effect for status and order) and large, stable idiosyncratic baselines. This picture aligns only partially with the classic contrast between the Inherent Value Hypothesis (languages carry aesthetic appeal due to their inherent properties; Giles et al., Reference Giles, Bourhis, Davies, McCormack and Wurm1979) and the Imposed Norm Hypothesis (aesthetics are shaped by social prestige and learned attitudes). In the current paradigm, inherent phonological structure contributes only modest, selective effects; imposed norms and sociocultural expectations are likely folded into the large listener-specific variance components; and a substantial portion of variability may simply reflect subjective taste or ‘beauty in the ear of the beholder’ as stated in Winkler et al. (Reference Winkler, Kogan and Reiterer2023), as well as sources of variance not captured by the present models.
4.5. Methodological considerations and future directions
Several methodological factors may have contributed to the dominance of listener-level variance and the limited detectability of fixed phonological effects. First, most predictors were distributional summaries of segment classes and macro-typological categories. Listeners may instead respond primarily to more immediate acoustic properties such as spectral balance, consonant-to-vowel energy ratios, voice quality or intonational contour. Second, in the present design, each language was represented by only two speakers, and each participant heard only one recording per language. Although we included voice set as a fixed effect and found no reliable voice set differences, this does not fully separate evaluations of the language from evaluations of the individual speaker. With only two voices per language, speaker-specific attractiveness, pleasantness or other idiosyncratic vocal qualities may still be partially confounded with language-level judgments. Moreover, because the two voice sets fixed the combinations in which voices occurred across languages, the design did not permit estimation of speaker identity as an independent random effect. Future work would benefit from sampling a larger number of speakers per language and randomizing speakers across listeners, so that voice can be modelled directly as another grouping factor alongside listener and language. Accordingly, the present findings should be interpreted as reflecting evaluations of these language samples as recorded here, rather than as pure language-level effects independent of speaker voice. Third, the four evaluative dimensions may differ in the extent to which they are grounded in acoustic cues versus sociolinguistic ideologies, with status and order perhaps more amenable to systematic cue-based inference – consistent with the close-vowel effect observed here. Lastly, it is important to acknowledge that European languages are very homogenous in their phonological profiles and more pronounced and robust differences in aesthetic judgment might appear if a wider range of typologically diverse languages is investigated.
In sum, the present findings position phonaesthetic evaluation as a domain in which systematic cross-linguistic effects, if they exist, are modest and dimension-specific, embedded within substantial individual differences. Our results support a multilayered view of language aesthetics in which listener-specific baselines and interpretive frameworks play a major role, while certain segmental properties provide small but reliable cues for judgments such as perceived status and order.
Data availability statement
Acknowledgements
Special thanks, in alphabetical order, to Dr. Martin Ball, Dr. Stefan Rabanus, Dr. Steven Moran and Dr. Alexandra Vella for promptly and comprehensively addressing our inquiries. Their expertise and guidance were instrumental in the success of this study. We also want to thank Anna Winkler and Maria Silva for contributing data collected during their respective master theses to this project. Further thanks go to Ziga Bogataj and Jörg Mühlhans for generous help with voice recordings in the media lab of the Faculty of Philological and Cultural Studies, University of Vienna. Last but not least, we are deeply grateful to our outstanding reviewers, whose thoughtful and extensive feedback contributed so substantially to this work that they almost deserve co-authorship.
Funding statement
This research received no external funding.
Competing interests
The authors declared no potential conflicts of interest with respect to the research, authorship and/or publication of this article.
Ethical considerations
In line with the statute of the Ethics Committee of the University of Vienna (§ 2; see re-release of the statute section ‘Ethikkommission’, as per university gazette 2012-03-16, 18th piece, no. 106), the Ethics Committee evaluates research projects on or with humans. These are investigations which may affect the physical or psychological integrity, the sphere of privacy, other subjective rights or predominant interests of research participants. As per national laws (Vienna Universities Act 2002), the present study is exempt from mandatory formal ethical approval.
Consent to participate
Written informed consent was obtained from all subjects involved in the study.
Declaration on the use of AI
We used AI-assisted tools to proofread the manuscript, polish formatting and to consult on specific statistical questions, including coding examples in R/RStudio. No AI system was listed as an author, and all authors take full responsibility for the content and analyses. All AI-generated suggestions were independently verified and edited by the authors and independent experts, and no confidential or proprietary data were provided to AI tools.



 Open access

