


Agricultural terraces are enduring landscape modifications that allowed ancient societies to cultivate steep slopes, reduce erosion, and retain water in arid and semiarid environments (Krahtopoulou and Frederick Reference Krahtopoulou and Frederick2008). Composed of treads and risers, they represent a key form of ancient agro-ecological adaptation. Found across the Andes, East Asia, and the Mediterranean, terraces have served not only agricultural but also environmental, cultural, and social purposes (Guttmann-Bond Reference Guttmann-Bond2019).
The Bozburun Peninsula in southwestern Anatolia illustrates the strategic use of terracing in rugged terrain. During the Hellenistic period, it became part of the Rhodian Peraia—a network of mainland territories administered by Rhodes from the third century BCE onward. This administrative and economic integration encouraged intensified agriculture, particularly through terrace construction and the production of wine and olive oil (Demirciler et al. Reference Demirciler, Oğuz-Kırca, Toprak, Karahan and Kılıç2022). Despite its peripheral and erosion-prone topography, Bozburun developed into a productive agricultural landscape connected to regional and Mediterranean trade routes. Archaeological evidence from settlements such as ancient Tymnos reflects this integration: amphora stamps and inscriptions point to continuous economic activity within Rhodian administrative structures (Demirciler Reference Demirciler2017).
From a landscape-archaeological perspective, Bozburun’s terraces provide essential evidence for understanding the agricultural economy and spatial organization of Hellenistic Caria. Settlement clusters, pressing installations, water management features, and fortified acropoleis illustrate a well-organized territorial model adapted to local environmental constraints. The combination of fortresses, sacred land leasing, and diversified crop production—including cereals, grapes, olives, figs, and almonds—indicates a resilient agro-economic system that persisted into Late Antiquity (Demirciler et al. Reference Demirciler, Oğuz-Kırca, Sarı and Bakan2023; Kuban Reference Kuban, Aydınoğlu and Şenol2008). This context makes Bozburun an important case for examining rural transformation under Rhodian rule and the long-term sustainability of terraced landscapes.
Despite their archaeological importance and broad distribution, the systematic documentation of ancient agricultural terraces faces significant methodological challenges. Traditional archaeological surveys, although providing valuable insights into construction techniques and historical settings, are time-consuming and labor-intensive when applied to extensive terrace systems.
To overcome these limitations, various remote sensing approaches have been developed. Sofia and colleagues (Reference Sofia, Marinello and Tarolli2014) introduced the Slope Local Length of Auto-Correlation (SLLAC) method to distinguish terraced landscapes from natural formations, showing that terraces exhibit more regular patterns than natural slopes. Capolupo and colleagues (Reference Capolupo, Kooistra and Boccia2018) advanced terrace mapping through Object-Based Image Analysis (OBIA), producing binary maps of terraced and nonterraced areas from aerial imagery. Cucchiaro and colleagues (Reference Cucchiaro, Fallu, Zhang, Walsh, Van Oost, Brown and Tarolli2020) combined Terrestrial Laser Scanning (TLS) and Structure from Motion (SfM) to monitor terrace morphology under complex topographic conditions.
Agapiou and colleagues (Reference Agapiou, Alexakis and Hadjimitsis2019) introduced the concept of virtual constellations, emphasizing how the coordinated use of optical and radar satellite sensors can enhance archaeological landscape analysis by integrating complementary spectral and structural information. These semi-automated techniques improved efficiency and demonstrated the potential of computational tools in archaeological mapping, yet they continued to rely on extensive human interpretation, limiting their scalability for landscape-scale analysis. Preservation also varies widely across terrace systems. Many have been altered by erosion, abandonment, or modern land use, posing additional detection challenges that conventional and semi-automated methods address inconsistently. Before the introduction of deep learning, Santos and colleagues (Reference Santos, Santos, Filipe, Shinde, Oliveira, Novais and Paulo Reis2019) used a Support Vector Machine (SVM) with Local Binary Pattern (LBP) descriptors to classify steep-slope vineyards in Portugal’s Douro region, demonstrating that texture-based features can effectively delineate vineyard structures even without large training datasets. Tubog and colleagues (Reference Tubog, Emsellem and Bouissou2025) applied an SVM-based model combining lidar-derived terrain data and high-resolution orthophotos for terrace detection in the Roya Valley, France, using an early fusion strategy that achieved high mapping accuracy. Gravel-Miguel and colleagues (Reference Gravel-Miguel, Snitker, Hirniak, Peck and Fetterhoff2025) later implemented an early-fusion U-Net framework integrating multiple lidar-derived visualizations (Simple Local Relief Model, slope, Terrain Ruggedness Index, and Positive Openness) for terrace segmentation in Georgia, USA, achieving high recall even with limited training data. Together, these studies illustrate the gradual transition from classical to machine learning approaches, culminating in recent applications of deep learning and data fusion for large-scale archaeological landscape analysis.
Recent developments in deep learning have improved the automated detection of agricultural terraces from remote sensing data, addressing many of the scalability and objectivity limitations of earlier methods. Do and colleagues (Reference Do, Raghavan and Yonezawa2019) provided one of the first neural network applications for terrace extraction using 5 m RapidEye imagery in Vietnam. Their comparison of pixel-based and object-based approaches with an eight-layer feed-forward network showed that pixel-based classification performed better owing to reduced information loss from averaging.
Expanding to multisensor approaches, Zhao and colleagues (Reference Zhao, Xiong, Wang, Wang, Wei and Tang2021) implemented a U-Net architecture combining remote sensing imagery with digital elevation models (DEMs) from China’s Loess Plateau. Postprocessing constraints derived from slope and terrain features (5°–25° positive slopes) reduced noise and separated terraces from surrounding farmlands. Figueiredo and colleagues (Reference Figueiredo, Neto, Cunha, Sousa and Sousa2022) applied a U-Net with an Inception ResNet V2 encoder to detect curved terrace vineyards in Portugal’s Alto Douro wine region, demonstrating the effectiveness of transfer learning for terrace mapping in complex topographies. Building on this, Figueiredo and colleagues (Reference Figueiredo, Pádua, Cunha, Sousa and Sousa2023) extended the method to identify vine rows within terraces using UAV RGB imagery and DEM data, addressing the added challenge of steep and curved terrain.
Wang and colleagues (Reference Wang, Liu, Karnieli and Zhu2022) introduced a semantic model fusion framework that combined aerial imagery and lidar-based terrain data. Their late fusion approach merged the probability outputs of separately trained U-Net and DeepLabv3+ models (α = 0.5), balancing precision and recall to achieve the highest ranking in the International AI Archaeology Challenge. Lu and colleagues (Reference Lu, Xue, Xin, Song and Wang2023) proposed an early fusion strategy through their Deep Learning–based Terrace Extraction Model (DLTEM), using a U-Net++ architecture that integrated RGB imagery with eight DEM-derived features as multichannel input. The model demonstrated high accuracy at 1.89 m resolution in the Loess Plateau, substantially improving on coarser-resolution products.
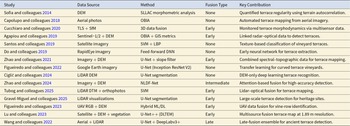
Ciglič and colleagues (Reference Ciglič, Glušič, Štaut and Črt Zajc2024) demonstrated terrace recognition based solely on lidar-derived DEMs using a U-Net architecture, showing effective performance in densely forested areas of Slovenia, where optical data are often unreliable. Zhao and colleagues (Reference Zhao, Zou, Liu and Xie2024) developed NLDF-Net, a feature-level fusion model that incorporates attention mechanisms through Asymmetric Nonlocal and Dual Fusion Blocks. The framework achieved strong results and represents a refined stage in deep learning–based terrace mapping. Table 1 summarizes the principal studies from 2019 to 2024, outlining their datasets, model architectures, and fusion strategies.
Summary of Previous Terrace Detection Studies Highlighting Their Data Sources, Analytical Methods, Fusion Strategies, and Key Contributions.

Table 1 Long description
The table summarizes 15 terrace-detection studies by year, listing each study’s data sources, analytical method, fusion type (none, early, intermediate, late), and main contribution. Data sources range from single inputs such as DEM, aerial photos, satellite imagery, Google Earth imagery, and LiDAR DEM/DTM to multisensor combinations like TLS+SfM, Sentinel-1/2+DEM, imagery+DEM, UAV RGB+DEM, and aerial+LiDAR. Methods progress from morphometric analysis (SLLAC), OBIA, and classical machine learning (SVM with LBP texture features) to neural networks including feed-forward DNNs and multiple U-Net variants (U-Net, U-Net++, Inception ResNet V2, DeepLabv3+, and NLDF-Net). Fusion is absent in several single-source studies, while early fusion is common in multisource work (e.g., TLS+SfM; radar–optical with DEM; imagery+DEM with slope filtering; LiDAR DTM with orthophotos; UAV RGB with DEM; satellite+DEM+vegetation). More advanced fusion appears less frequently, with one intermediate attention-based approach (NLDF-Net, 2024) and one late-fusion ensemble (U-Net + DeepLabv3+, 2022). Key contributions include quantifying terrace regularity, automated mapping from imagery, monitoring morphodynamics, transfer learning for curved vineyard terraces, DEM-only deep learning recognition, and large-scale heritage-site detection. Interpretation note: the table reports study-reported approaches and contributions but does not provide comparable accuracy metrics or consistent evaluation settings across studies.
Although recent advances have improved automated terrace detection, an important question remains: how do different data fusion strategies perform in archaeological settings, particularly in Mediterranean landscapes? Data fusion involves combining information from multiple sources to enhance detection accuracy. In remote sensing, this integration can occur at different stages—by merging inputs at the start (early fusion), combining features during processing (intermediate fusion), or integrating model outputs at the end (late fusion; Qiu et al. Reference Qiu, Budde, Bulatov and Iwaszczuk2022). Early fusion combines all input data (e.g., RGB and topography) into a single multichannel image before learning begins. Intermediate fusion processes different data types through separate encoders and merges them during feature extraction. Late fusion keeps data streams separate and combines their predictions only at the final decision stage.
This study investigates that question by developing and evaluating U-Net–based deep learning models for identifying ancient agricultural terraces in the Bozburun Peninsula using high-resolution remote sensing data. It compares early, intermediate, and late fusion strategies that integrate spectral (RGB) and topographic (DEM, slope, aspect) variables, along with an RGB-only baseline to assess the added value of topographic information. Model performance is evaluated using multiple metrics to ensure a balanced assessment.
The availability of a detailed, expert-digitized terrace dataset for the region (Demirciler Reference Demirciler2014) provides a valuable opportunity for thorough validation—something rarely possible in archaeological machine learning research. The results contribute to improving automated terrace mapping and demonstrate how deep learning can support large-scale cultural landscape documentation.
Materials and Methods
Data and Preprocessing
This study used high-resolution aerial imagery (30 cm, RGB, acquired in 2022) and DEMs (30 cm, acquired in 2022) covering the 193 km2 Bozburun Peninsula in southwestern Turkey. The peninsula contains extensive terrace systems dating mainly to the Hellenistic period. Slope and aspect derivatives were generated from the DEM using QGIS 3.34 to characterize topographic conditions relevant to terrace identification. This approach focused on terrain morphology rather than vegetation patterns, ensuring that terrace detection relied primarily on geomorphological characteristics.
Sixteen representative sample areas (37.8 ha in total) were selected across the study area to ensure balanced representation of terraced and nonterraced landscapes (Figure 1). These areas were digitized to create ground-truth labels, taking into account terrace morphology and preservation state. The resulting vector data were converted to raster format to produce binary classification labels (terrace vs. nonterrace) for model training.
Spatial distribution of 16 working units (37.8 ha total) selected for training data across the Bozburun Peninsula.

Figure 1 Long description
The map displays the Bozburun Peninsula with boundaries outlined in blue and working areas marked with red squares. An inset map shows the peninsula's location in the eastern Mediterranean region. A scale bar indicates distances up to 10 km. The map legend identifies 'Boundary' in blue and 'Working Areas' in red. The working areas are distributed across the peninsula, with a concentration in the central and southern parts. The map includes a directional arrow pointing north.
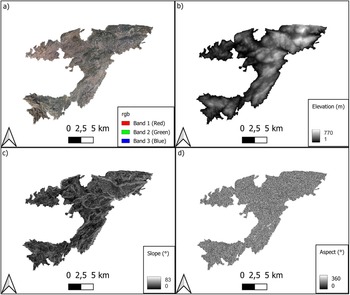
To visualize the datasets used in terrace detection, Figure 2 presents the RGB orthomosaic together with the DEM, slope, and aspect layers. These layers provide the key spectral and topographic inputs used in subsequent fusion experiments.
Core input datasets of the Bozburun Peninsula: (a) RGB orthomosaic; (b) DEM (m); (c) slope (°); (d) aspect (°). All layers share identical spatial extent with standardized scale and north orientation.

Figure 2 Long description
A) The map shows an RGB orthomosaic of the Bozburun Peninsula with bands labeled as Band 1 (Red), Band 2 (Green) and Band 3 (Blue). B) The map displays a DEM (Digital Elevation Model) with elevation ranging from 1 to 770 meters. C) The map illustrates the slope in degrees, ranging from 0 to 83°. D) The map presents the aspect in degrees, ranging from 0 to 360°. All maps share the same spatial extent and scale, with a north orientation indicated by an arrow.
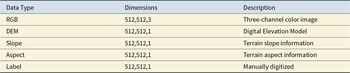
All datasets (RGB, DEM, slope, aspect, and labels) were divided into 512 × 512 px tiles, generating 256 image patches for deep learning experiments (Table 2). Each raster layer was exported as NumPy array files (.npy) for efficient processing and model compatibility.
Specifications of 512 × 512 Image Patches used for Model Training.

Table 2 Long description
The table lists the data layers used to build 512×512 image patches for model training, including each layer’s tensor dimensions and purpose. RGB imagery is 512×512×3, indicating three color channels. DEM, slope, and aspect are each 512×512×1, representing single-band terrain-related inputs. The label layer is also 512×512×1 and is described as manually digitized, indicating it serves as the ground-truth target. All layers share the same spatial size (512 by 512), differing only in channel count and meaning. The table provides specifications only and does not indicate data ranges, units, or class definitions for the label.
To ensure consistent scaling across input channels and to address the circular nature of aspect values (0° = 360°), all inputs were normalized as follows. RGB values were scaled to the (0, 1) range. Elevation and slope were normalized by dividing each pixel value by the maximum elevation (781 m) and maximum slope (84°) within the study area (Equation 1). Aspect values were transformed into circular coordinates to avoid angular discontinuity, using sine and cosine components (Equation 2), since aspect represents directional orientation on a 0°–360° circle, where 0° and 360° correspond to the same direction. This circular encoding preserves directional continuity and prevents artificial breaks that would occur if values were linearly normalized between 0 and 1.
 \begin{equation}s{\text{'}} = s/{s_m}_{ax}\end{equation}
 \begin{equation}a{'_s}_{in} = (sin\theta + 1)/2,a{'_c}_{os} = (cos\theta + 1)/2\end{equation}
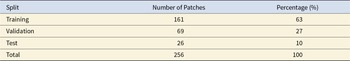
Dataset splitting followed a Monte Carlo cross-validation approach (Xu and Liang Reference Xu and Liang2001) with 10 random initializations to ensure robust evaluation. Monte Carlo validation assesses model generalization by repeatedly training on randomly sampled subsets of data and averaging performance across runs. In practical terms, this approach reduces overfitting by testing the model on different subsets of data and averaging the results. For each split, 63% of the data (161 patches) was used for training, 27% (69 patches) for validation, and 10% (26 patches) for independent testing. The same random seeds were applied across all fusion strategies to ensure comparability between models (Table 3). These repeated random splits provided a statistically reliable measure of model stability and performance variation across different fusion configurations.
Dataset Split Distribution for Model Training and Evaluation.

Table 3 Long description
The table reports how 256 image patches are allocated across training, validation, and test splits, with counts and percentages. Training contains 161 patches, representing 63% of the total. Validation includes 69 patches (27%). The test split has 26 patches (10%), making it the smallest portion. Training has more than twice as many patches as validation and over six times as many as test. Percentages sum to 100%, indicating a complete partition of the dataset.
Deep Learning Architecture
To evaluate the contribution of topographic data to terrace detection and to compare different data integration strategies, four U-Net–based architectures were implemented. An RGB-only baseline was first established to assess detection performance using spectral information alone. Three additional fusion approaches were then designed to integrate spectral (RGB) and topographic (DEM, slope, aspect) data: early fusion (input-level integration), intermediate fusion (feature-level integration), and late fusion (decision-level integration).
Different imaging modalities provide complementary information: RGB imagery captures color and texture characteristics, while elevation data contribute topographic context that enhances detection accuracy through multimodal integration (Boulahia et al. Reference Boulahia, Amamra, Madi and Daikh2021; Qiu et al. Reference Qiu, Budde, Bulatov and Iwaszczuk2022). This comparative framework allows quantitative evaluation of both the added value of topographic data and the relative performance of different fusion strategies for archaeological terrace detection. Similar systematic fusion analyses have also been effective in medical imaging and remote sensing contexts (Raju et al. Reference Raju, Neelapu, Laskar and Muhammad2025).
U-Net–Based Architecture
The U-Net architecture (Ronneberger et al. Reference Ronneberger, Fischer, Brox, Navab, Hornegger, Wells and Frangi2015) served as the foundation for all experiments owing to its proven efficiency in image segmentation tasks and suitability for limited archaeological datasets. The characteristic U-shaped design consists of a contracting encoder path that captures contextual information at multiple scales and an expanding decoder path that reconstructs detailed spatial predictions. Skip connections between encoder and decoder layers preserve fine spatial details while maintaining semantic consistency, which is particularly useful for identifying subtle terrace boundaries in heterogeneous landscapes.
RGB-Only Baseline
The RGB-only model functions as a reference to evaluate the effectiveness of spectral data alone. Each 512 × 512 input image (three-channel RGB) was processed through a standard U-Net with normalized values in the (0–1) range. The encoder comprises four convolutional blocks (64, 128, 256, and 512 filters), each containing two convolutional layers followed by batch normalization, ReLU (Rectified Linear Unit) activation, and dropout (rate = 0.4). A bridge layer with 1,024 filters connects the encoder and decoder. The decoder mirrors the encoder with four upsampling stages and skip connections to recover spatial details. The final layer produces binary segmentation maps using softmax activation for terrace vs. background classification.
Early Fusion
The early fusion model integrates spectral and topographic data at the input stage through a unified seven-channel tensor combining RGB (three channels) with four normalized topographic derivatives (elevation, slope, aspect_sin, aspect_cos). All modalities are processed simultaneously from the first convolutional layer, allowing interaction between spectral and terrain features during early feature extraction. The encoder follows the same configuration as the baseline (64–512 channels). This approach is designed to enhance learning of complementary patterns between RGB textures and topographic gradients, aiding the detection of terrace structures that may not be clearly visible in a single data source.
Intermediate Fusion
Two parallel encoders process RGB (three channels) and topographic data (four channels: elevation, slope, aspect_sin, aspect_cos) separately through four convolutional blocks (64–512 filters). At the bridge, encoder outputs are concatenated (1,024 channels) and processed by a 1,024-filter block. The decoder uses four upsampling stages where, at each level, skip connections from both encoders are fused together before integration with upsampled features, enabling hierarchical multimodal fusion.
Late Fusion
The late fusion approach maintains fully independent U-Net architectures for spectral and topographic data, combining their outputs only at the decision level. One network processes the RGB imagery, while the other processes the topographic channels. Each produces binary segmentation maps through softmax activation. The two prediction maps are concatenated and passed through a 1 × 1 convolutional layer with softmax activation to produce the final terrace map. This design maintains independence between modalities while allowing adaptive weighting of their outputs based on local image context.
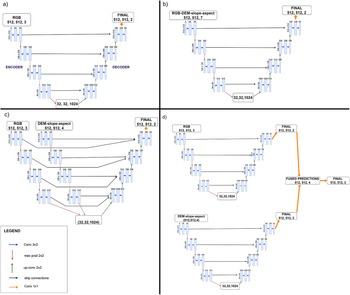
The four fusion architectures are illustrated in Figure 3, which demonstrates the distinct data integration strategies employed in this study. Figure 3a shows the RGB-only baseline processing spectral information through a standard U-Net, while Figure 3b depicts the early fusion approach combining all input channels at the network input. Figure 3c illustrates the intermediate fusion strategy with parallel encoders and feature-level integration, and Figure 3d presents the late fusion architecture with independent networks and decision-level combination. These architectural variations enable systematic evaluation of how different fusion strategies affect terrace detection performance in archaeological contexts.
U-Net–based fusion architectures for terrace detection: (a) RGB-only baseline; (b) early fusion (input-level integration); (c) intermediate fusion (feature-level integration); (d) late fusion (decision-level integration).

Figure 3 Long description
The image consists of four sub-images labeled a, b, c and d, each depicting a different U-Net–based fusion architecture for terrace detection. In sub-image a, labeled RGB-only baseline, the architecture processes spectral information through a standard U-Net with an encoder and decoder, ending with a final output labeled 'FINAL' with dimensions 512, 512, 3. Sub-image b, labeled early fusion, shows input-level integration where RGB and slope aspect inputs are combined at the network input, leading to a final output labeled 'FINAL' with dimensions 512, 512, 2. Sub-image c, labeled intermediate fusion, illustrates feature-level integration with parallel encoders for RGB and slope aspect inputs, merging at a later stage and resulting in a final output labeled 'FINAL' with dimensions 512, 512, 2. Sub-image d, labeled late fusion, presents decision-level integration with independent networks for RGB and slope aspect inputs, combining at the final decision stage and producing a final output labeled 'FINAL' with dimensions 512, 512, 2. The legend at the bottom left indicates the color coding for core U-Net, slope aspect, RGB and final predictions.
Network Components
All fusion architectures used the same U-Net building blocks so that any differences in results reflect only how the data are combined. We used the ReLU activation function after each convolution and batch-normalization step. ReLU sets negative values to zero and keeps positive values unchanged, which makes training faster and helps the network learn sharp terrace boundaries (Equation 3).
 \begin{equation}f\left( x \right) = \max \left( {0,x} \right)\end{equation}
To reduce overfitting, we combined dropout and batch normalization. Dropout was applied in the encoder (rate 0.4 in the first convolution of each block and 0.2 in the second), and batch normalization was used before every ReLU to stabilize training. All models were trained with Jaccard (Intersection over Union [IoU]) loss, which directly optimizes the overlap between predicted and reference terrace masks (Rezatofighi et al. Reference Rezatofighi, Tsoi, Gwak, Sadeghian, Reid and Savarese2019). We used the Adam optimizer (initial learning rate 1 × 10⁻³), a batch size of eight, and trained for up to 150 epochs with early stopping based on validation IoU. Each configuration was run 10 times with different random initializations to check that the results were stable. All experiments were carried out in Google Colab Pro+ on an NVIDIA A100 GPU (40 GB VRAM).
Model evaluation followed a two-stage design to ensure transparent methodology and independent validation. The author manually digitized terraces within 16 predefined areas, producing 256 high-resolution image patches (512 × 512 px, 30 cm). Of these, 10% (26 patches) were reserved as unseen test data. Model predictions in these test areas were compared against the author’s manual digitization, which served as the ground-truth reference.
For additional archaeological context, model outputs were also compared with Demirciler (Reference Demirciler2014), who produced an independent terrace inventory through conventional field survey and visual interpretation. This dataset was not used for model training or internal metric calculation; rather, the same evaluation measures (accuracy, precision, recall, IoU, F1) were applied post hoc to quantify the degree of spatial agreement between automated detection and established expert mapping.
The purpose of this comparison was not to assess “performance” against another human mapper but to examine how closely automated detections align with existing archaeological knowledge. This step provides a measure of interpretive consistency and highlights areas of divergence that warrant further field investigation.
All analyses involving Demirciler’s dataset were conducted only within the unseen test zones, ensuring complete independence between training and comparison data. Demirciler’s work was used solely as a published archaeological reference, with no overlap in data production or authorship.
Segmentation performance was evaluated using IoU (Equation 4), accuracy (Equation 5), precision (Equation 6), recall (Equation 7), and F1-score (Equation 8). IoU (Jaccard Index) quantifies the spatial overlap between predicted terrace pixels and ground-truth labels, representing the primary segmentation metric. Accuracy reflects overall correctness, while precision, recall, and F1-score provide complementary measures of false-positive and false-negative tendencies.
 \begin{equation}{\text{IoU = TP/}}\left( {{\text{TP + FP + FN}}} \right)\end{equation}
 \begin{equation}{\text{Accuracy}} = (TP + {\text{TN}})/(TP + TN + FP + {\text{FE}})\end{equation}
 \begin{equation}{\text{Precision = TP/}}\left( {{\text{TP + FP}}} \right)\end{equation}
 \begin{equation}{\text{Recall = TP/(TP + FN)}}\end{equation}
 \begin{equation}{\text{F1 - score = 2 \times TP/}}\left( {{\text{2 \times TP + FP + FN}}} \right)\end{equation}
where TP, FP, FN, and TN represent true positive, false positive, false negative, and true negative predictions, respectively.
Results
Fusion Strategy Comparison
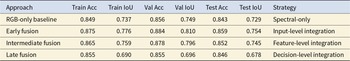
Comparative evaluation of four U-Net–based architectures using standard segmentation metrics (Table 4) shows that early fusion achieved optimal performance (test IoU: 0.754), followed by intermediate fusion (0.745), RGB-only baseline (0.729), and late fusion (0.678). The RGB-only baseline’s strong performance indicates that spectral information alone provides substantial terrace detection capability. However, topographic data integration at input level (early fusion) or feature level (intermediate fusion) yielded measurable improvements over spectral-only detection.
Comparative Performance Summary of All Approaches.

Table 4 Long description
The table compares four approaches using accuracy (Acc) and intersection-over-union (IoU) on training, validation, and test splits. Early fusion is the strongest method, with Train Acc/IoU 0.875/0.776, Val Acc/IoU 0.884/0.810, and Test Acc/IoU 0.859/0.754. Intermediate fusion ranks second, reaching Val Acc/IoU 0.878/0.796 and Test Acc/IoU 0.852/0.745. The RGB-only baseline is lower, with Val Acc/IoU 0.856/0.749 and Test Acc/IoU 0.843/0.729. Late fusion is weakest on IoU across all splits (Train/Val/Test IoU 0.690/0.696/0.678) despite similar validation accuracy to the baseline (both 0.855). Overall, input-level integration (early fusion) yields the best segmentation overlap and accuracy, while decision-level integration (late fusion) reduces IoU; results should be interpreted as split-specific and may vary with dataset and training setup.
Early fusion delivered the highest performance (IoU = 0.754, Accuracy = 0.859), showing that combining spectral and topographic information at the input stage produced the most reliable terrace segmentation (Table 4). The seven-channel input, merging normalized RGB and terrain derivatives, improved detection stability and accuracy. Intermediate fusion yielded similar but slightly lower scores, suggesting that processing both data types together from the start was more effective than merging them in deeper layers. The RGB-only model also performed well (IoU = 0.729), confirming that imagery alone carries strong discriminative power for terrace mapping. Yet, the inclusion of elevation and slope data still provided measurable gains, particularly in complex terrain. Late fusion performed worst (IoU = 0.678) and showed greater variability, likely because integrating information only at the decision stage limited the model’s ability to learn complementary patterns.
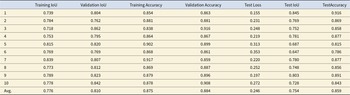
Given its balanced and consistent results across all metrics, the early fusion model was selected for detailed analysis as the most effective configuration (Table 5). The early fusion model achieved the highest test performance across 10 runs (IoU = 0.754, Accuracy = 0.859; Table 5). Adding topographic inputs improved results over the RGB-only baseline (IoU = 0.729, Accuracy = 0.843), showing that elevation and slope contribute meaningfully to terrace detection.
Early Fusion Performance Metrics (10 Runs).

Table 5 Long description
The table reports training, validation, and test segmentation metrics (IoU, accuracy, and test loss) for 10 runs plus an average row. On average, training IoU is 0.776 and validation IoU is 0.810, while average test IoU drops to 0.754, suggesting weaker generalization on the test set. Training accuracy averages 0.875 and validation accuracy 0.884; mean test accuracy is 0.859. Best test IoU occurs in run 1 (0.845) with the lowest test loss (0.155) and highest test accuracy (0.916). Worst test IoU is run 6 (0.647) and it also has the highest test loss (0.353) and lowest test accuracy (0.786). Validation IoU ranges from 0.762 (run 2) to 0.862 (run 3), while test IoU ranges from 0.647 to 0.845, indicating notable run-to-run variability. Because only summary metrics are provided, differences between runs cannot be attributed to specific causes (e.g., data splits or randomness) without additional experimental details.
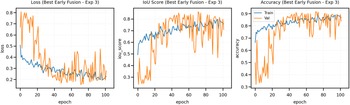
Among the Monte Carlo runs, Experiment 3 yielded the best validation score (IoU = 0.862) and was used for detailed curve analysis (Figure 4). Training stabilized after the first 10 epochs, and validation IoU occasionally surpassed training values, indicating good generalization and effective learning of spectral–topographic relations.
Training and validation curves for early fusion (best run).

Figure 4 Long description
The graph titled Loss (Best Early Fusion - Exp 3). The horizontal axis label is epoch. The horizontal axis range is 0 to 100. The vertical axis range is 0.0 to 0.8. Legend: Train, Val. Train series coordinate pairs: (0, 0.55), (10, 0.40), (20, 0.33), (30, 0.30), (40, 0.28), (50, 0.26), (60, 0.25), (70, 0.24), (80, 0.23), (90, 0.22), (100, 0.21) Val series coordinate pairs: (0, 0.80), (10, 0.60), (20, 0.35), (30, 0.30), (40, 0.28), (50, 0.26), (60, 0.25), (70, 0.24), (80, 0.23), (90, 0.22), (100, 0.21) The graph titled IoU Score (Best Early Fusion - Exp 3). The horizontal axis label is epoch. The horizontal axis range is 0 to 100. The vertical axis range is 0.4 to 0.9. Legend: Train, Val. Train series coordinate pairs: (0, 0.55), (10, 0.65), (20, 0.70), (30, 0.74), (40, 0.77), (50, 0.79), (60, 0.80), (70, 0.81), (80, 0.82), (90, 0.83), (100, 0.84) Val series coordinate pairs: (0, 0.40), (10, 0.60), (20, 0.70), (30, 0.75), (40, 0.78), (50, 0.80), (60, 0.82), (70, 0.83), (80, 0.84), (90, 0.85), (100, 0.86) The graph titled Accuracy (Best Early Fusion - Exp 3). The horizontal axis label is epoch. The horizontal axis range is 0 to 100. The vertical axis range is 0.4 to 0.9. Legend: Train, Val. Train series coordinate pairs: (0, 0.70), (10, 0.78), (20, 0.82), (30, 0.84), (40, 0.86), (50, 0.87), (60, 0.88), (70, 0.88), (80, 0.89), (90, 0.89), (100, 0.90) Val series coordinate pairs: (0, 0.40), (10, 0.65), (20, 0.78), (30, 0.83), (40, 0.85), (50, 0.86), (60, 0.87), (70, 0.88), (80, 0.88), (90, 0.89), (100, 0.89).
Across different initializations, test IoU values ranged from 0.647 to 0.845, confirming consistent behavior. For archaeological terrace detection, the early fusion approach offered a strong balance between accuracy, stability, and computational efficiency—surpassing spectral-only models while remaining lightweight.
Test Predictions
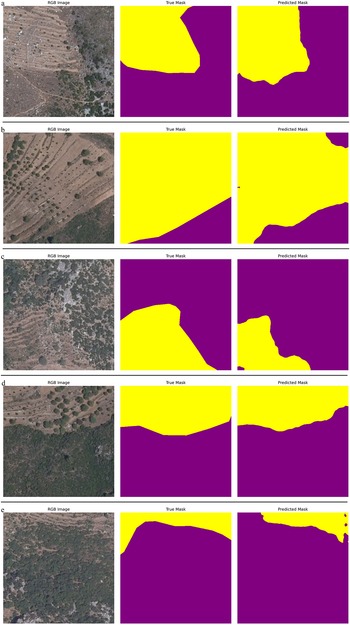
Qualitative evaluation further supported these results. Figure 5 presents representative examples from the 26 test patches (10% of the dataset), showing accurate delineation of terrace boundaries under various terrain and preservation conditions. Predicted masks closely matched ground-truth edges in well-preserved areas (Figure 5a–b) and successfully captured terrace traces in more complex, vegetated zones (Figure 5c–e). Combining spectral and topographic information improved reliability across diverse landscapes, demonstrating the potential of deep learning for large-scale terrace mapping.
Test predictions from early fusion model. Representative examples (a–e) showing (left to right): RGB input; ground-truth mask; predicted mask. Yellow indicates terraced areas; purple represents background.

Figure 5 Long description
The image consists of five panels labeled a to e. Each panel contains three columns: RGB Image, True Mask and Predicted Mask. In panel a, the RGB image shows terraced terrain. The true mask highlights terraced areas in yellow and background in purple. The predicted mask closely matches the true mask. In panel b, the RGB image displays a similar terraced landscape. The true mask and predicted mask show terraced areas in yellow and background in purple, with a close match. Panel c features an RGB image of a more complex terrain. The true and predicted masks again show terraced areas in yellow and background in purple, with the predicted mask accurately capturing the terrace boundaries. In panel d, the RGB image shows a vegetated area with terraces. The true and predicted masks highlight terraces in yellow and background in purple, with the predicted mask aligning well with the true mask. Panel e presents an RGB image of a different terrain. The true and predicted masks maintain the same color scheme, with the predicted mask accurately reflecting the true mask's delineation of terraces.
Automated Terrace Mapping at Peninsula Scale
Following test validation, the early fusion model was applied to the full 193 km2 Bozburun Peninsula to evaluate scalability for landscape-wide mapping. The area was divided into 40,304 overlapping tiles (512 × 512 px, 25% overlap) to prevent edge artifacts and ensure seamless predictions. The same preprocessing pipeline used in training was adopted, combining normalized RGB imagery with DEM-derived topographic layers (elevation, slope, aspect_sin, aspect_cos).
The large-scale mapping identified 2,517 ha of ancient agricultural terraces—about 13% of the peninsula. Figure 6 shows their spatial distribution, revealing broad coverage across diverse topographic zones. This represents the first comprehensive documentation of Hellenistic period terrace systems across the peninsula, providing landscape-scale completeness that would be impossible through traditional survey methods.
Full-extent terrace mapping results: (a) terraces predicted by the early fusion AI model and (b) terraces digitized by Demirciler (Reference Demirciler2014). Both panels share identical symbology and scale to enable visual comparison of terrace coverage and distribution patterns. Although both datasets cover largely overlapping regions, their mapping boundaries are not identical; the extent of their intersection used for quantitative comparison is shown in Figure 8.

Figure 6 Long description
Panel (a) shows terraces predicted by the AI model in red, covering various regions of the peninsula. Panel (b) displays terraces digitized by Demirciler in blue, with different boundaries. Both maps use satellite imagery as a basemap and include a legend indicating terrace sources. A scale bar shows 0 to 5 km and a north arrow indicates orientation. The maps allow comparison of terrace coverage and distribution patterns, highlighting differences in mapping boundaries. The peninsula's name and any labeled features are not visible in the image.
Demirciler (Reference Demirciler2014) mapped terrace zones using manual photointerpretation and GIS delineation, resulting in generalized terrace areas based on visual interpretation. In contrast, the present model applies pixel-level semantic segmentation to detect discrete terrace remnants. Therefore, differences between the two datasets reflect methodological resolution rather than disagreement in classification.
To examine detection differences locally, a qualitative visual comparison was carried out using representative subsets across the peninsula. Three main outcomes were observed: (a–b) terraces detected only by the AI mo (c–d) terraces recorded only in archaeological mapping and (e–f) terraces identified by both methods (Figure 7). These examples were drawn from areas outside the test dataset to maintain methodological independence and to illustrate how the two mapping approaches align or diverge across different landscapes and preservation contexts.
Representative examples showing local detection outcomes across the Bozburun Peninsula: (a–b) terraces detected only by the AI model (red); (c–d) terraces identified only by archaeological mapping (blue); (e–f) terraces detected by both methods (red and blue overlapping). All examples are located outside the test areas to maintain independence from the quantitative evaluation.

Figure 7 Long description
A) Terraces detected only by the AI model are outlined in red. B) Another area with terraces identified solely by the AI model, also marked in red. C) Terraces identified only through archaeological mapping are outlined in blue. D) Another example of terraces recorded by archaeological mapping, shown in blue. E) Terraces detected by both methods, with overlapping red and blue outlines. F) Another area where both methods detected terraces, indicated by overlapping red and blue outlines. Each image includes a scale bar and directional arrow for reference.
Spatial Analysis of Detected Terraces
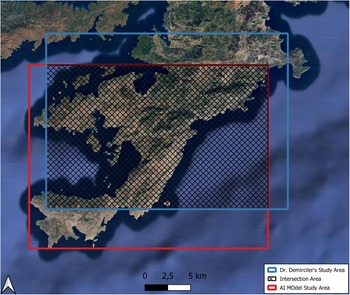
To examine how detected terraces align with archaeological expectations, results were compared within the geographic overlap between the AI model’s coverage and Demirciler’s (Reference Demirciler2014) mapping extent. This shared area enabled direct comparison between automated and expert mapping. Within this zone, elevation, slope, and aspect distributions were analyzed to identify spatial agreement and divergence, treating Demirciler’s dataset as an independent reference rather than a performance benchmark (Figure 8; Tables 6–8).
Geographic overlap between the model’s full-extent prediction and Demirciler’s (Reference Demirciler2014) terrace mapping; the hatched intersection indicates the area used for spatial statistics (elevation, slope, aspect).

Figure 8 Long description
The map displays three distinct areas: Dr. Demirciler's Study Area outlined in blue, the AI Model Study Area outlined in red and the Intersection Area marked with hatching. The map includes a scale bar indicating distances in kilometers, ranging from 0 to 5 km. The intersection area is where spatial statistics such as elevation, slope and aspect are analyzed. The background shows a satellite view of the terrain, with land and water features visible. An arrow in the bottom left indicates north.
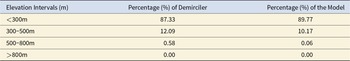
Comparison of Elevation Distributions.

Table 6 Long description
The table reports the percentage distribution of elevations across four elevation intervals for Demirciler and for a model. In both datasets, the vast majority of area lies below 300 m: 87.33% for Demirciler and 89.77% for the model. The next interval, 300–500 m, accounts for 12.09% in Demirciler and 10.17% in the model. Elevations from 500–800 m are rare in both, but Demirciler has a higher share (0.58%) than the model (0.06%). No area is reported above 800 m in either dataset (0.00% each). Overall, the model closely matches Demirciler’s distribution, with a slight shift toward lower elevations and an underrepresentation of the 500–800 m band.
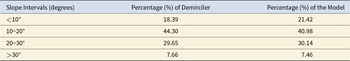
Comparison of Slope Distributions.

Table 7 Long description
The table reports the percentage distribution of terrain slopes across four degree intervals for Demirciler and for a model. In both, the largest share falls in the 10–20° range: 44.30% for Demirciler versus 40.98% for the model. Slopes under 10° are less common, with Demirciler at 18.39% and the model higher at 21.42%. The 20–30° interval is nearly the same between them (29.65% Demirciler, 30.14% model). Very steep slopes above 30° are the smallest category and closely matched (7.66% vs 7.46%). Overall, the model slightly shifts area from the 10–20° band toward <10° while matching the mid-to-steep categories closely; differences are small and should be interpreted as percentage-point comparisons only.
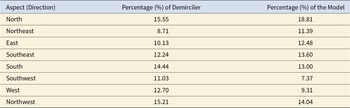
Comparison of Aspects.

Table 8 Long description
The table compares the percentage distribution of aspect (compass direction) between Demirciler and a model across eight directions. In the model, the highest share is North at 18.81%, followed by Northwest at 14.04% and Southeast at 13.60%. In Demirciler, the highest shares are North at 15.55% and Northwest at 15.21%, with South next at 14.44%. Demirciler is lower than the model in North (15.55 vs 18.81), Northeast (8.71 vs 11.39), East (10.13 vs 12.48), and Southeast (12.24 vs 13.60). Demirciler is higher in South (14.44 vs 13.00), Southwest (11.03 vs 7.37), West (12.70 vs 9.31), and Northwest (15.21 vs 14.04). The largest gaps favor Demirciler in Southwest (+3.66 points) and West (+3.39), while the model exceeds Demirciler most in North (+3.26). Percentages are presented as shares by direction; the table does not indicate sample size or uncertainty, so differences should be interpreted cautiously.
The comparison focused on spatial relationships rather than accuracy testing. Elevation distributions showed strong consistency: 87.33% of terraces in Demirciler’s mapping and 89.77% in the model’s prediction occur below 300 m. Both datasets identified few terraces above 500 m (0.58% vs. 0.06%), confirming the upper limits of ancient terrace agriculture in the region (Table 6).
Slope distributions revealed complementary detection strengths between the two approaches. Both identified moderate slopes (10°–30°) as the dominant terrace zones, confirming expected construction preferences of ancient systems (Table 7). The model showed slightly higher sensitivity on gentler gradients (<10°: 21.42% vs. 18.39%), likely detecting faint or eroded terraces that are less visible in traditional mapping. Archaeological mapping recorded slightly more terraces on steep slopes (>30°: 7.66% vs. 7.46%), possibly reflecting differences in visual interpretation at higher relief. The small share of terraces detected above 500 m likely results from modern terrace construction, natural benches, or limited field verification rather than model error.
Aspect distributions showed similar general patterns with minor directional differences (Table 8). The model detected more terraces on north-facing slopes (18.81% vs. 15.55%) and fewer on southwest- and west-facing slopes, patterns that likely reflect differences in illumination, preservation, and vegetation cover.
These variations carry archaeological significance. Terraces detected only by the AI model—mainly at lower elevations and gentler slopes—may correspond to eroded or vegetation-covered structures that are difficult to see in aerial imagery. In contrast, terraces mapped only by Demirciler often occur on steeper or irregular benches where automated detection struggled to maintain boundary continuity. Slopes over 30° were retained in the analysis, as they may still represent degraded terrace remnants and offer an insight into past landscape stability. Although some terraces may coincide with modern agricultural reuse, distinguishing ancient from contemporary structures lies beyond this study’s scope and requires field verification. The strong correspondence in aspect distributions supports interpretations that ancient terraces were aligned to optimize sunlight and wind protection. Overall, the comparison shows that automated terrace detection reproduces meaningful archaeological patterns while highlighting areas that merit future ground validation.
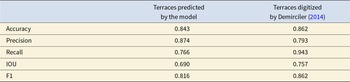
Model Performance Assessment
For comparison with archaeological documentation (Demirciler Reference Demirciler2014), performance metrics were calculated using the 23 test patches located within the spatial overlap zone, excluding three southern patches outside this area (Figure 8).
The comparison highlights complementary strengths rather than a performance hierarchy between approaches. The early fusion model achieved higher precision, meaning it produced fewer false positives, while archaeological mapping showed higher recall, reflecting expert recognition of subtle or eroded terraces (Table 9). Together, these results suggest that automated and expert mapping capture different but equally valuable aspects of terrace distribution.
Performance Comparison between AI Model and Expert Documentation.

Table 9 Long description
The table compares performance metrics for terrace mapping from two sources: terraces predicted by an AI model and terraces digitized by Demirciler (2014). Metrics reported are Accuracy, Precision, Recall, Intersection over Union (IOU), and F1 score. Demirciler (2014) scores higher on Accuracy (0.862 vs 0.843), Recall (0.943 vs 0.766), IOU (0.757 vs 0.690), and F1 (0.862 vs 0.816). The AI model scores higher on Precision (0.874 vs 0.793), indicating fewer false positives relative to its detections. Overall, the expert-digitized results show stronger coverage and overlap with reference data, while the model is more selective. Interpretation depends on how the reference labels and evaluation procedure were defined, which are not provided in the table.
Differences in the metrics reflect the complementary value of each approach. The model’s higher precision indicates reliable terrace detection where features are clearly visible in the imagery, while higher recall in archaeological documentation underscores the continuing importance of expert interpretation for recognizing degraded or vegetation-obscured remains. Rather than suggesting a hierarchy of performance, these findings demonstrate that automated mapping can enhance—but not replace—expert knowledge, especially in complex or eroded terrain.
Conclusions
This study presents a deep learning–based approach for automated detection of ancient agricultural terraces in Mediterranean archaeological landscapes. Among four U-Net–based architectures tested, early fusion—integrating spectral and topographic data at the input level—achieved the best results, with an IoU of 75.4% and an accuracy of 85.9% across the 193 km2 Bozburun Peninsula. Early fusion outperformed intermediate fusion (74.5% IoU), late fusion (67.8%), and the RGB-only baseline (72.9%), confirming that input-level integration supports more effective interaction between spectral and topographic information. The preprocessing steps, including circular encoding of aspect values and normalization by global maxima, contributed to stable model behavior. Monte Carlo evaluation with 10 random initializations provided consistent results and established replicable benchmarks for archaeological feature detection in Mediterranean environments.
The identification of 2,517 ha of terraces represents extensive documentation of agricultural systems spanning multiple historical phases. Spatial analysis revealed distribution patterns consistent with ancient site-selection strategies: 89.77% of terraces occur below 300 m elevation, mostly on 10°–30° slopes (71.14%), with a preference for north-facing orientations (18.81%). These findings indicate deliberate adaptation to terrain conditions that optimized soil stability, accessibility, and agricultural productivity. Comparison with archaeological mapping showed strong spatial agreement, with both approaches identifying similar distribution trends. The AI model achieved higher precision (87.4% vs. 79.3%), while expert mapping achieved higher recall (94.3% vs. 76.6%), confirming their complementary nature.
Deep learning thus serves as an effective complement to traditional survey methods, offering scalable tools for regional documentation. Processing the full 193 km2 study area demonstrates its potential for heritage management, particularly where fieldwork is limited by time or resources. Nonetheless, limitations remain, including reliance on high-quality training data and sensitivity to vegetation and erosion. Future work should explore lighter network architectures, transfer learning for cross-regional generalization, and multitemporal analysis to monitor terrace degradation. Integrating terrace detection with other archaeological features may further improve interpretations of land use and settlement dynamics, while hybrid workflows combining automated detection with expert validation appear most effective for balancing efficiency and accuracy.
The mapped terrace distributions provide a quantitative basis for conservation planning and long-term monitoring. Combining computational and archaeological perspectives offers a more systematic understanding of ancient agricultural practices and supports sustainable management of Mediterranean cultural landscapes. Terrace concentrations correspond closely with known Hellenistic rural production zones, such as those near Tymnos, suggesting continuity between agricultural infrastructure and socioeconomic organization. These patterns align with areas historically associated with wine and olive oil production under Rhodian administration, offering quantifiable evidence of agricultural intensification in southwestern Anatolia.
When both accuracy and recall are considered, early fusion provides only modest improvement relative to RGB-only models—a practical outcome for large-area mapping where additional data sources may not always justify their cost.
Key Takeaways for Archaeological Practice
• RGB-only models achieve near-optimal terrace detection performance in this Mediterranean context, reducing reliance on additional topographic data sources.
• When available, DEM-derived features are most beneficial when integrated via early fusion; intermediate and late fusion provide limited advantage.
• Full-coverage implementation across 193 km2 demonstrates the feasibility of deep learning for large-area cultural heritage documentation.
Acknowledgments
This article is based on research originally conducted as part of the author’s doctoral dissertation at the Graduate School of Social Sciences Settlement Archaeology program at Middle East Technical University. The author thanks Prof. Dr. Burcu Erciyas for supervision, Assist. Prof. Dr. Volkan Demirciler, and Assoc. Prof. Dr. E. Deniz Oğuz-Kırca for valuable input. Data access was provided by the General Directorate of Mapping, Turkey (2024). The author acknowledges the use of OpenAI’s ChatGPT (GPT-5) for language editing and phrasing assistance during manuscript preparation. The tool was not used for data analysis, figure generation, or interpretation.
Funding Statement
This research received no specific grant from any funding agency or organization.
Data Availability Statement
RGB orthophotos and DEMs were obtained from the General Directorate of Mapping, Turkey, under research authorization. The complete source code is available at https://doi.org/10.5281/zenodo.16905405. Trained model weights are available on request. Demirciler’s (Reference Demirciler2014) dataset was accessed with the author’s permission for academic comparison only and used solely as an independent archaeological reference for spatial agreement analysis.
Competing Interests
The author declares none.


 Open access