


The metabolic syndrome (MetS) is a cluster of risk factors for development of atherosclerotic CVD and type 2 diabetes (T2D) that encompass abdominal obesity, insulin resistance, hypertension and dyslipidaemia( Reference Alberti, Eckel and Grundy 1 ). Thus, hypertriacylglycerolaemia is a characteristic feature of the MetS. Recent studies have demonstrated that CVD is more strongly associated with increased levels of TAG in the non-fasting state, that is, postprandial lipaemia (PPL), compared with the fasting state( Reference Nordestgaard, Benn and Schnohr 2 , Reference Bansal, Buring and Rifai 3 ).
Diet is one of the most important modifiers of PPL. A century ago, Staub( Reference Staub 4 ) and Traugott( Reference Traugott 5 ) noted that glucose tolerance improved after the second of two consecutive glucose challenges, the so-called Staub–Traugott effect. In continuation of this finding, it turned out that consumption of whey proteins (WP) from milk before ingestion of carbohydrate diets was associated with enhanced insulin responses to these diets. Thus, WP pre-meals significantly reduce glycaemic responses( Reference Akhavan, Luhovyy and Brown 6 – Reference Clifton, Galbraith and Coles 9 ), delay gastric emptying( Reference Akhavan, Luhovyy and Panahi 8 , Reference Ma, Stevens and Cukier 10 ) and stimulate glucagon-like peptide 1 (GLP-1) secretion( Reference Ma, Stevens and Cukier 10 ); and WP is more effective in this respect compared with other proteins( Reference Nilsson, Stenberg and Frid 11 – Reference Pal and Ellis 13 ). WP pre-meals give rise to a pronounced increase in the plasma concentrations of lysine, threonine and branched-chain amino acids (BCAA) (leucine, isoleucine and valine)( Reference Nilsson, Stenberg and Frid 11 ). These amino acids (AA) and BCAA in particular mimic the insulinotropic properties of WP( Reference Nilsson, Holst and Bjorck 14 ). In subjects with and without T2D, WP as part of a fat-rich meal also reduces PPL compared with casein, cod and gluten proteins( Reference Mortensen, Hartvigsen and Brader 15 , Reference Holmer-Jensen, Mortensen and Astrup 16 ). In addition, we recently demonstrated the difference between 0 and 20 g WP consumed as a pre-meal before a fat-rich main meal( Reference Bjornshave, Holst and Hermansen 17 ). Even though a pre-meal of 20 g of WP did not influence PPL in this study( Reference Bjornshave, Holst and Hermansen 17 ), we cannot exclude that pre-meals with other protein sources may influence PPL. We therefore hypothesised that different protein pre-meals differentially affect PPL after ingestion of a fat-rich meal in subjects with the MetS. We aimed to compare the impact of a small dose (17·6 g pure protein) of WP with that of casein and gluten protein. We also wanted to investigate whether the time span between the pre-meal and the main meal influences PPL responses. We hypothesised that a WP pre-meal would elicit a lower PPL response if consumed 15 min before a fat-rich meal than if consumed 30 min before a meal.
Methods
Participants
A total of twenty-eight subjects were recruited from August 2014 to January 2015 through local newspapers. All interested subjects were screened for the MetS as defined by the International Diabetes Federation( Reference Alberti, Eckel and Grundy 1 ). We included women and men above 18 years with the MetS and having had a stable weight for at least 3 months. Exclusion criteria are abnormal TAG (>5 mmol/l) or blood pressure (160/100 mmHg); clinically significant CVD; renal, liver or endocrine disease; diabetes; alcohol or drug abuse; current treatment with steroids; pregnancy and lactation; or a significant psychiatric medical history. Regular medication was accepted if the dose had been stable for a minimum of 4 weeks and could be continued throughout the study period. A total of eleven subjects were taking antihypertensive therapy and nine were being treated with cholesterol-lowering medication. A total of six women and ten men completed the study. All subjects provided their written informed consent. The protocol was approved by the Central Denmark Region Committees on Health Research Ethics (ID: 1-10-72-189-14), and the trial was performed in accordance with the Declaration of Helsinki. The study was registered with ClinicalTrials.gov (ID: NCT02228252).
Design
The present study was an acute, randomised, crossover study with four arms. The four test days were separated by washout periods of approximately 1 week where subjects consumed their habitual diets. The subjects were randomly allocated to the four test meals according to a randomisation list made on www.randomization.com. On a full day before each test day, the subjects consumed a ready-prepared standard diet (20% energy (E%) as protein, 54 E% as carbohydrates and 26 E% as fat). Women had a diet containing of 7000 kJ and men 9000 kJ. Before the test day, subjects were asked to avoid alcohol, demanding physical activity and painkillers containing paracetamol.
After a 12 h overnight fast, the participants arrived to our clinic (Aarhus University Hospital, Aarhus, Denmark). A catheter was inserted in a cubital vein for collecting fasting blood samples, and urine sample and anthropometric measurements were obtained. Subsequently, the participants consumed a pre-meal, waited 15 or 30 min and ingested a fat-rich meal within 15 min. During the entire test period, the participants were allowed to drink 200 ml tap water.
Test meals
Participants consumed pre-meals with three different protein types (WP, casein and gluten proteins) 15 min before the fat-rich meal. The pre-meals contained equivalent amounts of pure protein (17·6 g), which corresponds to 20 g WP isolate. As the fourth intervention, a WP pre-meal was given 30 min before the fat meal. The pre-meals were not blinded. Blood samples were drawn at the following time points: –15 (only when pre-meal was consumed 30 min before the main meal), –10 and 0 min. The nutrient composition and the relative AA compositions of the protein powders are listed in Table 1. We used a WP isolate (Lacprodan DI-9224 Instant; Arla Foods Ingredients Group P/S). The casein powder was a sodium caseinate spray dried from pure milk protein (Miprodan® 30; Arla Foods amba). A total amount of 17·6 g pure protein (20 g WP and 19 g casein) was blended with 200 ml tap water and 30 g frozen strawberry. WP and casein were served drinkable. The gluten protein powder (wheat gluten; Reppe Lantmännen) was insoluble in cold water. Therefore, 21 g of total gluten protein was blended with 50 ml water and 30 g strawberry. The mixture was eatable with a teaspoon and served with 150 ml water.
Nutrient composition and the relative amino acid composition of the three protein powders
WP, whey protein.
* Data on WP and casein are provided from Arla Foods Ingredients Group P/S, and data on gluten are provided from Reppe Lantmännen.
† We were not able to measure lysine and cystine in the protein samples due to irregular shapes of GC and MS peaks.
A standardised, fat-rich breakfast meal was served at time point 0 min. The meal consisted of white bread, rye bread, butter, cheese, salami, bacon, egg, milk and decaffeinated coffee. The energy composition was 17 E% as protein, 15 E% as carbohydrates and 68 E% as fat. The fat composition was 47·8 % from SFA, 27·8 % from MUFA and 6·5 % from PUFA. The total energy content was 3 900 kJ. The participants received 1·5 g paracetamol (3 × 500 mg tablets of Pinex®; Actavis) and 100 ml water together with the meal. Blood samples were subsequently drawn postprandially after the main meal at 15, 30, 60, 90, 120, 180, 240 and 360 min.
Blood analysis
All samples were obtained using EDTA except for glucagon (tubes contained EDTA and aprotonin) and samples for serum preparation. The samples were placed on ice immediately after sampling and separated by centrifugation at 2000 g for 15 min at 4°C. Serum samples were separated from full blood after centrifugation at 2000 g for 15 min at room temperature. All samples were frozen at –20°C and stored at –80°C. Plasma insulin was analysed using an ELISA kit (code: K6219; Dako Denmark A/S). Glucagon was measured using a radioimmunoassay kit specific for pancreatic glucagon with glucagon antibody and 125I-glucagon (catalogue no. GL-32K; Millipore). The COBAS c111 system (Roche Diagnostics GmbH) was used for measurement of TAG, NEFA, glucose and paracetamol in serum. The system used an enzymatic colorimetric method; commercial kits were used for analysis of TAG (ref. no. 04657594190; Roche Diagnostics GmbH) and NEFA (ref. no. 434-91795 and 436-91995; Wako Chemicals GmbH). Plasma glucose was analysed using an enzymatic reference method with hexokinase (ref. no. 04657527190; Roche Diagnostics GmbH). S-paracetamol was quantified using a colorimetric method (ref. no. 03255379 190; Roche Diagnostics GmbH). One subject did not receive paracetamol due to hypersensitivity to paracetamol. GLP-1 and glucose-dependent insulinotropic peptide (GIP) concentrations were measured with a radioimmunoassay. Total GLP-1 (i.e. the sum of intact GLP-1 and its metabolite GLP-1 9–36 amide) was measured using an antiserum specific for C-terminal in GLP-1 (no. 89390)( Reference Kuhre, Wewer Albrechtsen and Hartmann 18 ). Likewise, an antiserum specific for C-terminal in GIP (code no. 867) was used for total GIP. Free AA from plasma were analysed using an in-solution-chloroformate derivatisation after pH adjustment to 5–6 using 100 μl of 7 m NaOH, followed by chloroform extraction as performed by Qiu et al.( Reference Qiu, Su and Liu 19 ) with minor changes. The obtained ethyl esters were separated on a HP-5ms capillary column coated with polyimide (60 m × 0·25 mm internal diameter, 0·25 μm film thickness (Agilent Technologies)) and quantified on a 7890A GC system coupled with a 5975c inert mass selective detector (MSD) quadrupole mass spectrometer (Agilent Technologies). Protein powders were hydrolysed and subsequently analysed in the same way as plasma samples.
Statistical analysis and calculations
The statistical power calculation was based on our primary effect parameter, viz. TAG incremental AUC (iAUC). The number of participants needed to obtain a statistical power of 80 % at a level of P <0·05 (α = 0·05, 1–β = 0·8) was 16. The anticipated dropout level was set at 20 %. Descriptive statistics are presented as means with 95 % CI, unless otherwise stated. Statistical analyses were performed in STATA/IC 14.2 (StataCorp), and graphics were made in GraphPad Prism 7.0 (GraphPad Software Inc.). We calculated iAUC (TAG, insulin, glucagon, glucose, GLP-1, GIP, S-paracetamol and AA) using the trapezoid model. Total AUC (tAUC) was used for NEFA. Student’s t test was applied to compare the difference in iAUC and tAUC for biochemical parameters regarding timing. One-way ANOVA was used for comparison of differences in iAUC and tAUC for biochemical parameters and AA regarding protein types. We applied ANOVA for repeated measurements to examine the effect of the intervention (pre-meal) and time on postprandial responses. Subject and day were used as random variables, order as covariates, and lipid-lowering drugs as systematic variables. Statistically significant differences at individual time points were analysed by estimates for linear combinations and indicated in figures by letters. P <0·05 was considered statistically significant. Validation was performed by inspecting quantile–quantile plots, histograms and Bland–Altman plots.
Results
Table 2 presents the participants’ baseline characteristics. A total of twenty-eight subjects were screened, twenty were randomised and sixteen completed the study. Screening was unsuccessful in eight subjects. In all, four withdrew after randomisation for personal reasons. Table 3 shows the effect of timing and protein type during the postprandial period, and Table 4 shows the means of iAUC and tAUC for the biochemical parameters.
Baseline characteristics of the sixteen subjects with the metabolic syndrome (Mean values and 95 % confidence intervals)
Effect of timing and protein type: postprandial concentration of biochemical parameters after consumption of a whey protein (WP) pre-meal 15 or 30 min before a fat-rich main meal, or a pre-meal of casein or gluten protein in subjects with the metabolic syndrome (n 16) (Medians, mean values and 95 % confidence intervals)
GLP-1, glucagon-like polypeptide 1; GIP, gastric inhibitory polypeptide.
a,b Values within a row with unlike superscript letters were significantly different (P <0·05).
* ANOVA for repeated measurements. The hypothesis was to test whether the response curves for the two interventions (WP (–15 min) and WP (–30 min)) during the postprandial period were parallel.
† ANOVA for repeated measurements. The hypothesis was to test whether the response curves for the three interventions (WP (–15 min), casein or gluten) during the postprandial period were parallel.
Incremental AUC (iAUC) and total AUC (tAUC) of biochemical parameters and amino acid after consumption of a whey protein (WP) pre-meal 15 or 30 min before a fat-rich main meal, or a pre-meal of casein or gluten protein in subjects with the metabolic syndrome (n 16) (Mean values, medians and 95 % confidence intervals)
GLP-1, glucagon-like polypeptide 1; GIP, gastric inhibitory polypeptide.
a,b,c Values within a row with unlike superscript letters were significantly different (P <0·05).
* Student’s t test was applied for analysing differences on the postprandial responses.
† One-way ANOVA was applied for analysing differences on the postprandial responses. The hypothesis was to test whether iAUC or tAUC was significantly different between the three interventions WP (–15 min), casein and gluten. The hypothesis was to test whether iAUC or tAUC was significantly different between WP (–15 min) and WP (–30 min).
‡ For paracetamol, n 15.
TAG and NEFA
The concentration of TAG in the four groups peaked after 240 min. None of the participants in the four groups had returned to fasting TAG values 360 min after ingestion of the fat-rich main meal. Fig. 1(a) shows that the postprandial TAG response was independent of the type of protein pre-meal (P = 0·95) and its timing (P = 0·87). TAG iAUC were also similar.
Postprandial plasma responses of TAG (a) and NEFA (b) after ingestion of pre-meal of whey protein (WP), casein or gluten 15 min prior, or WP 30 min before a fat-rich meal. Values are means (n 16), with their standard errors represented by vertical bars. Data were analysed using ANOVA for repeated measurement to examine the effect of protein type on the postprandial responses. ![]() , WP (–15 min);
, WP (–15 min); ![]() , WP (–30 min);
, WP (–30 min); ![]() , casein;
, casein; ![]() , gluten.
, gluten.
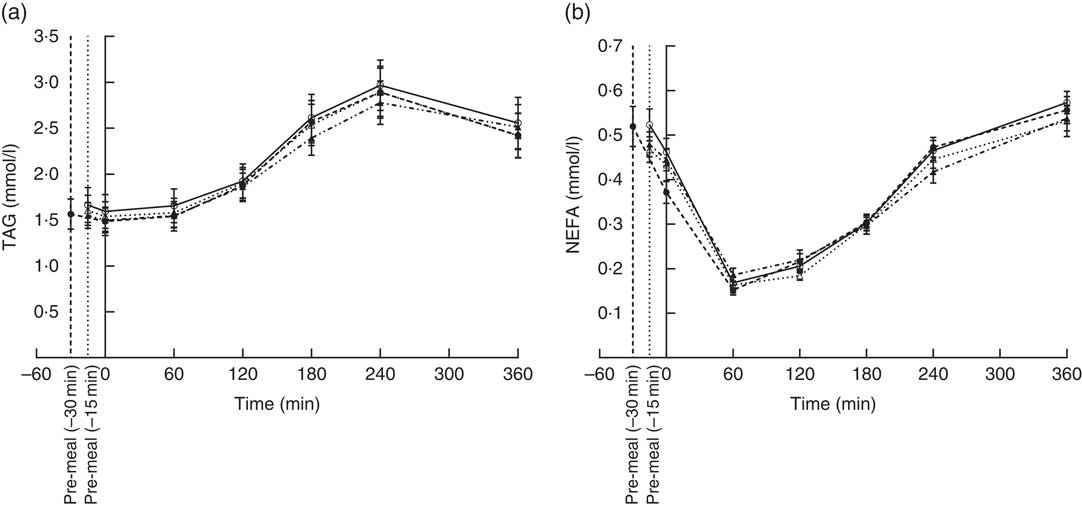
We observed similar postprandial NEFA suppressions in all four groups; suppression reached a minimum at 60 min and returned to fasting levels at 360 min (Fig. 1(b)). Timing (P = 0·22) or pre-meal type (P = 0·79) had no effect.
Insulin, glucagon and glucose
The insulin concentration increased after consumption of all four pre-meals (Fig. 2(a)). WP (–15 min), WP (–30 min) and casein induced maximum insulin concentrations after 15 min, whereas gluten reached maximum insulin concentration at time point 30 min. Insulin concentrations returned to normal fasting ranges in all four groups after 360 min. We observed a significant effect of timing (P = 0·0001) and protein quality (P = 0·0062) during the response period. The time course for gluten was different from that of WP (P = 0·0008) and casein (P = 0·008) due to the lower insulin concentrations at time points 0 and 15 min. The groups did not differ with regard to iAUC.
Postprandial plasma responses of insulin (a), glucagon (b) and glucose (c) after ingestion of pre-meal of whey protein (WP), casein or gluten 15 min prior, or WP 30 min before a fat-rich meal. Values are means (n 16), with their standard errors represented by vertical bars. Data were analysed using ANOVA for repeated measurement to examine the effect of protein type on the postprandial responses. Significant differences (P <0·05): * WP (–15 min) v. WP (–30 min), † WP v. gluten, ‡ casein v. gluten, § WP v. casein. ![]() , WP (–15 min);
, WP (–15 min); ![]() , WP (–30 min);
, WP (–30 min); ![]() , casein;
, casein; ![]() , gluten.
, gluten.
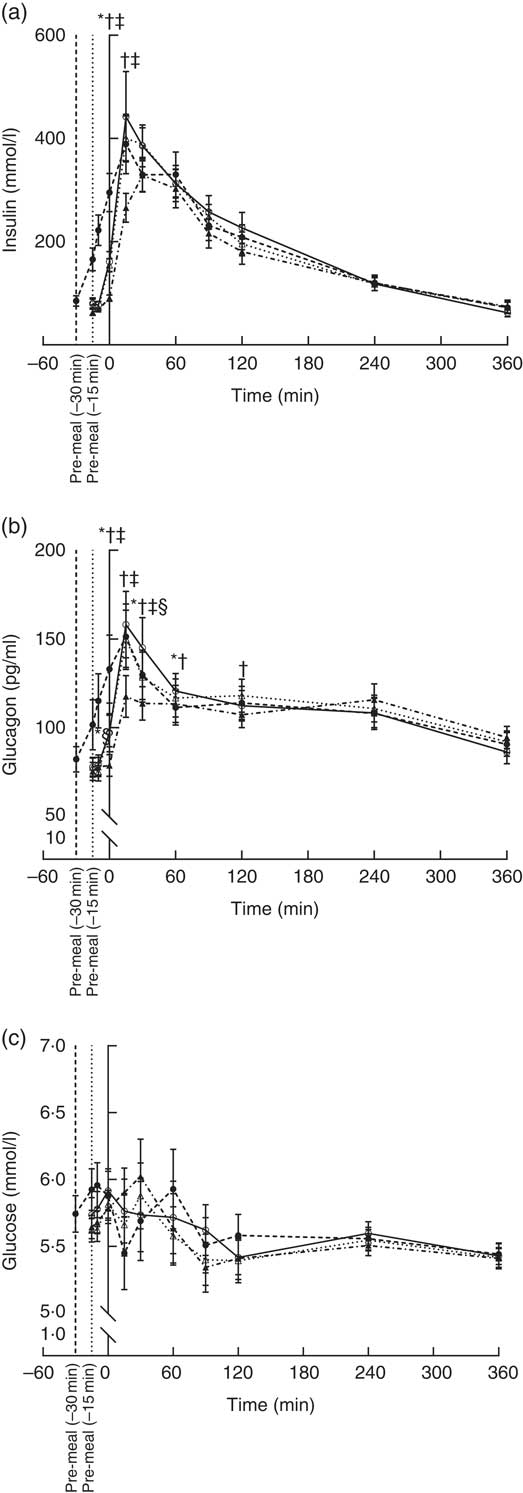
Plasma glucagon increased in all four groups and reached a maximum 15 min after the main meal and returned to near fasting values after 360 min (Fig. 2(b)). Both timing (P <0·0001) and protein type (P <0·0001) affected the glucagon secretion pattern, but the iAUC were similar in the groups. The early response to gluten was smaller than the early response to WP (P <0·0001) and casein (<0·0001). The glucose responses for the four groups fluctuated between 5·1 and 6·3 mmol/l during the postprandial period at 0–120 min (Fig. 2(c)). After 120 min, blood glucose was stable around 5·5 mmol/l in all four groups. We observed no effect of timing (P = 0·40) or protein quality (P = 0·93), and AUC were similar.
Incretins (glucose-dependent insulinotropic peptide and glucagon-like peptide 1)
GIP concentrations increased immediately after consumption of the pre-meals and peaked after 120 min (Fig. 3(a)) and had returned to fasting levels in any of the groups even at 360 min. The protein type affected the progression curve for GIP (P = 0·0103). Gluten was significantly different from WP (P = 0·0298) and casein (P = 0·0036), due to a steeper rise in GIP after milk-protein pre-meals. However, timing had no effect (P = 0·08), and the iAUC did not differ significantly among the interventions.
Postprandial plasma responses of glucose-dependent insulinotropic peptide (GIP) (a) and glucagon-like peptide 1 (GLP-1) (b) after ingestion of pre-meal of whey protein (WP), casein or gluten 15 min prior, or WP 30 min before a fat-rich meal. Values are means (n 16), with their standard errors represented by vertical bars. Data were analysed using ANOVA for repeated measurement to examine the effect of protein type on the postprandial responses. Significant differences (P <0·05): * WP (–15 min) v. WP (–30 min), † WP v. gluten. ![]() , WP (–15 min);
, WP (–15 min); ![]() , WP (–30 min);
, WP (–30 min); ![]() , casein;
, casein; ![]() , gluten.
, gluten.
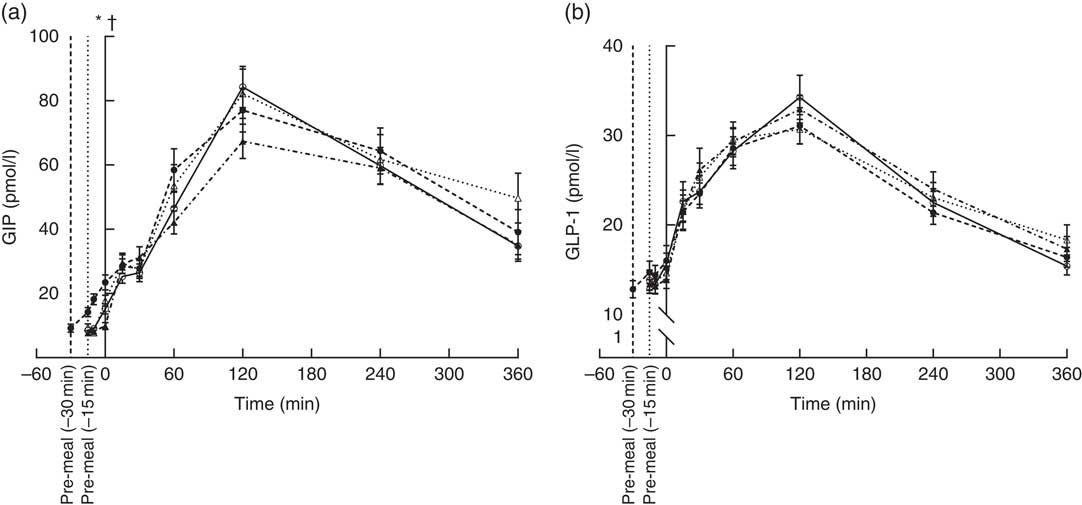
For GLP-1, the response profiles were similar in the four groups (Fig. 3(b)). Maximum concentrations reached after 120 min. Thus, neither timing nor protein type had an effect on GLP-1.
S-paracetamol
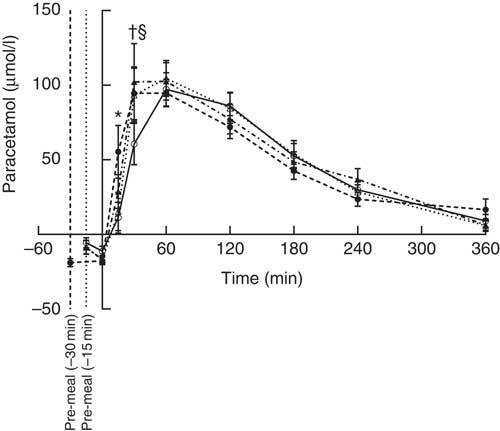
The S-paracetamol concentration rose shortly after the main meal in all four groups and reached maximum at 60 min (Fig. 4). Paracetamol was lower after WP (–15 min) than after WP (–30 min) at 15 min after the main meal (P = 0·028). At time point 30 min, the concentration of S-paracetamol was significantly higher in the casein (P = 0·031) and gluten (P = 0·007) group than in the WP group. Neither timing nor protein quality had any effect on iAUC paracetamol.
Postprandial plasma responses of paracetamol after ingestion of pre-meal of whey protein (WP), casein or gluten 15 min prior, or WP 30 min before a fat-rich meal. Values are means (n 15), with their standard errors represented by vertical bars. Data were analysed using ANOVA for repeated measurement to examine the effect of protein type on the postprandial responses. Significant differences (P <0·05): * WP (–15 min) v. WP (–30 min), † WP v. gluten, § WP v. casein. ![]() , WP (–15 min);
, WP (–15 min); ![]() , WP (–30 min);
, WP (–30 min); ![]() , casein;
, casein; ![]() , gluten.
, gluten.
Free amino acids
A total of twenty free AA were detectable in plasma after ingestion of the four pre-meals, both at fasting (–15 min) and at time points 60 and 360 min (Table 4 and online Supplementary Table S1). WP was rich in BCAA, threonine and lysine (Table 1). iAUC differed significantly between the three different protein types regarding valine (P = 0·0002), leucine (P = 0·0006), isoleucine (P <0·0001), lysine (P = 0·0411) and threonine (P <0·0001) and was higher after WP than after gluten. Also, iAUC for isoleucine and threonine were higher for WP than for casein.
Discussion
In this study, we examined how PPL was affected by the time between a pre-meal and a fat-rich test meal as well as by the protein type of the pre-meal before a fat-rich meal. Interestingly, we found that the timing and the protein quality of the pre-meal had no effect on our primary outcome, that is, TAG responses. In contrast, both the timing and the protein type of the pre-meal (17·6 g pure protein) modified pancreatic hormone secretion (insulin and glucagon) in subjects with the MetS. Furthermore, we found that gastric emptying was more delayed after a pre-meal with WP (–15 min) than after a pre-meal with casein, gluten or WP (–30 min).
We expected to find a difference in TAG responses, since the potent insulinotropic effect of a WP pre-meal could induce larger reductions in TAG responses due to the stimulated lipolytic activity of lipoprotein lipase( Reference Mortensen, Hartvigsen and Brader 15 ). Previous studies show that 45 g WP consumed as a part of a fat-rich meal reduces postprandial TAG responses compared with other protein types (casein, gluten and cod protein) in subjects with and without T2D( Reference Mortensen, Hartvigsen and Brader 15 , Reference Holmer-Jensen, Mortensen and Astrup 16 , Reference Pal, Ellis and Ho 20 ). In contrast, Mariotti et al.( Reference Mariotti, Valette and Lopez 21 ) showed that due to physiochemical properties, 45 g casein induced a significantly larger reduction in TAG than WP in overweight men. Interestingly, we found no difference in either lipid responses or NEFA suppression between the intervention groups. It is likely that these discrepancies are caused by the difference in total protein content. This might indicate that the effective WP threshold for TAG suppression is somewhere between 20 and 45 g WP. We here chose to use 17·6 g pure protein, because this is a realistic maximum dose to consume as a pre-meal since 17·6 g pure protein corresponds to 20 g WP, which we also used in a previous study( Reference Bjornshave, Holst and Hermansen 17 ). In the present study, we compared a 20 g WP pre-meal to a pre-meal with no protein and therefore did not include 0 g in the present study.
Acute human studies show that WP has a more potent insulinotropic effect than other protein types( Reference Nilsson, Stenberg and Frid 11 – Reference Pal and Ellis 13 ). We confirmed these findings by showing that WP preferentially stimulated insulin secretion. Insulin stimulation was also affected by the timing, with consumption of WP 30 min before the fat-rich meal generating earlier insulin stimulation than consumption of WP (–15 min) before the meal. This was reflected in the significantly higher insulin concentration at time point 0 min (just before consumption of the main meal) and may explain the time-to-intervention interaction observed. We chose to serve the pre-meal at time point –30 and –15 min, because these are the time points at which diabetics treated with meal-time insulin usually administered before a meal. A further advantage of these time points is that they reflect preferred routines since medicine adherence improves if the medicine is taken close to meals. WP and casein amplified insulin secretion more than gluten within the first 30 min after consumption of a pre-meal. We expected to observe a difference between WP and casein due to their different solubility and hence faster absorption( Reference Boirie, Dangin and Gachon 22 ), but this was not found. An explanation could be that larger protein doses are needed to reveal differences in insulin responses. However, a recent study showed that co-ingestion of 50 g WP or casein with maltodextrin caused no difference in insulin response( Reference Hoefle, Bangert and Stamfort 23 ). It is well known that insulin and glucagon are co-secreted in response to consumption of proteins and single AA( Reference Unger 24 , Reference Gannon and Nuttall 25 ). In agreement with this, we observed that all three protein types stimulated glucagon secretion and more so for WP and casein than for gluten. The AA composition demonstrated in plasma may explain this co-secretion and the higher insulin and glucagon concentrations after the milk protein pre-meal. The iAUC for BCAA, lysine and threonine after the meal were significantly higher for WP and casein than for gluten (Table 4 and online Supplementary Table S1). These five AA play a key role in the insulinotropic response( Reference Nilsson, Holst and Bjorck 14 ). In the present study, the protein quality affected GIP; however, the mechanism of action is currently unknown.
We did expect a suppression of blood glucose levels secondary to the insulin stimulation observed; however, glucose responses were influenced neither by timing nor by protein quality. This is in accordance with the previous studies reporting similar effects on blood glucose of WP and casein at doses between 16·2 and 55 g when proteins are consumed before a carbohydrate-rich meal or as part of the meal( Reference Gunnerud, Heinzle and Holst 7 , Reference Pal, Ellis and Ho 20 , Reference Hoefle, Bangert and Stamfort 23 , Reference Bowen, Noakes and Trenerry 26 ). However, we previously demonstrated that 45 g WP consumed as a part of fat-rich meal lowered glucose iAUC more than casein, gluten and cod protein( Reference Holmer-Jensen, Mortensen and Astrup 16 ). The discrepancy between the results in the present study and our previous study( Reference Holmer-Jensen, Mortensen and Astrup 16 ) may at least partially be related to the differences in the amounts of protein, as the amount of protein affects the insulin response, or to the differences in the fat composition of the meals. In the present study, we included 70 g fat per meal to exceed the normal lipoprotein capacity. Such a fat-rich test meal is obviously not applicable to everyday life but is recognised as a suitable way of studying PPL( Reference Holmer-Jensen, Mortensen and Astrup 16 , Reference Kolovou, Mikhailidis and Kovar 27 ).
We used paracetamol as an indicator of the liquid phase gastric emptying. Paracetamol was administered to the fat-rich meals. It is likely that the large amount of fat (70 g fat) contributes to a delay in gastric emptying and did so to the same extent in the four pre-meal situations. The WP (–15 min) pre-meal delayed gastric emptying more compared with the WP (–30 min) pre-meal. Furthermore, the paracetamol concentrations were lower 30 min postprandially for WP compared with casein and gluten, illustrating a delayed gastric emptying. This is in agreement with previous studies demonstrating that a WP pre-meal delays gastric emptying( Reference Ma, Stevens and Cukier 10 , Reference Bjornshave, Holst and Hermansen 17 ), but it is a new observation that the duration of the time gap between the pre-meal and the main meal also affects gastric emptying. It is likely that the AA level is higher before the meal when WP is given 30 min before the fat-rich mean compared with when it is given 15 min before. This may partly explain the difference in gastric emptying. Thus, we previously found that the BCAA, isoleucine, was higher after WP than after gluten and casein and that it was associated with a delayed gastric emptying( Reference Stanstrup, Schou and Holmer-Jensen 28 ). Interestingly, Ma et al.( Reference Ma, Jesudason and Stevens 29 ) recently showed that the ability to reduce postprandial glycaemia and delay gastric emptying was maintained in T2D subjects after intervention with 25 g WP as a pre-meal for 4 weeks.
One of the main strength of the present study was its randomised, crossover study design where each participant served as his or her own matched control. In addition, we used protein types applied in daily life that were easy to eat.
In conclusion, intake of 17·6 g protein pre-meal did not alter the lipid response (TAG and NEFA) to a fat-rich meal, and we must therefore reject our hypothesis. However, we demonstrated that hormone secretion (insulin and glucagon) depends on both pre-meal timing and protein quality. A WP pre-meal consumed 30 min before a meal stimulated hormone responses earlier than WP consumed 15 min before a meal. WP and casein displayed more potent insulinotropic actions compared with gluten protein. Finally, our results support that a WP pre-meal consumed 15 min before the fat-rich meal delays gastric emptying more than a WP pre-meal consumed 30 min before the meal.
Acknowledgements
The authors would like to extend our gratitude to Eva Mølgaard Jensen, Lene Trudsø Jensen and Lene Bruus Albæk for outstanding technical assistance. Furthermore, we are grateful for the assistance provided by Annemarie Kruse, Peter Reiter, Mette Bohl and Anne Grethe Schioldan during the meal tests. Milk protein powder was kindly provided by Arla Foods Ingredients Group P/S and Arla Foods amba. Gluten protein powder was kindly provided by Lantmännen.
This work was supported by grants from the Danish Dairy Research Foundation, Arla Foods Ingredients Group P/S and the Innovation Fund DK – MERITS (grant no. 4105-00002B). A. B. was supported by research grants from the Danish Diabetes Academy supported by the Novo Nordisk Foundation, Aarhus University and the Research Foundation of the Department of Endocrinology and Internal Medicine, Aarhus University Hospital. J. J. H. was supported by the Novo Nordisk Foundation.
A. B. and K. H. raised the research question and designed the study; A. B. and T. N. J. carried it out; A. B., T. N. J. and K. H. analysed the data; B. A., T. K. D. and J. J. H. contributed reagents/materials/analysis tools; A. B. wrote the article.
A. B., T. N. J., B. A., T. K. D., J. J. H. and K. H. have no conflicts of interest and other funding disclosures to declare.
Supplementary material
For supplementary material/s referred to in this article, please visit https://doi.org/10.1017/S0007114518003264


