


Introduction
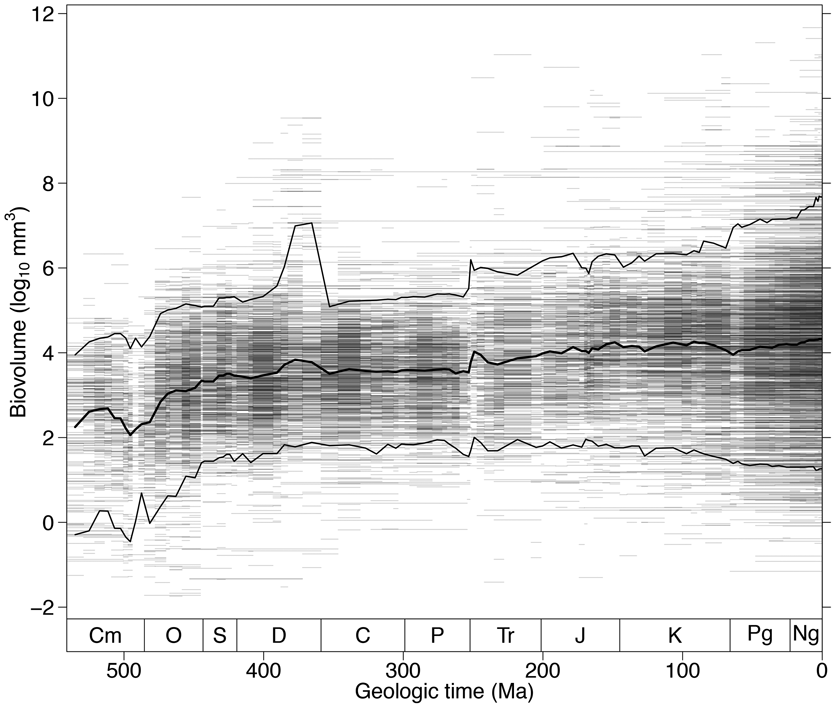
The biovolume of the average-sized marine animal genus has increased by more than two orders of magnitude since the beginning of Cambrian time (Fig. 1) (Heim et al. Reference Heim, Knope, Schaal, Wang and Payne2015). The proposed causes of this size increase include both an environment more permissive of larger size due to increasing availability of oxygen in seawater (Berner et al. Reference Berner, VandenBrooks and Ward2007; Dahl et al. Reference Dahl, Hammarlund, Anbar, Bond, Gill, Gordon, Knoll, Nielsen, Schovsbo and Canfield2010) and ecosystems more capable of supporting large animals through increasing levels of primary productivity (Tappan and Loeblich Reference Tappan and Loeblich1973; Peters Reference Peters1983; Vidal and Knoll Reference Vidal and Knoll1983; Bambach Reference Bambach1993; Thiebaux and Dickie Reference Thiebaux and Dickie1993; Bambach Reference Bambach1999; Vermeij Reference Vermeij2011, Reference Vermeij2016). However, not all phyla and classes experienced similar trends in size (Fig. 2). For example, chordates have become substantially larger, on average, over time, whereas mollusks have been nearly constant in mean size since the Ordovician. Differences in evolutionary trajectories of marine animal body size across phyla suggest that size increase has been promoted, enabled, or constrained by intrinsic biological characteristics of species and does not simply represent a uniform response of the biosphere to increased availability of food or oxygen.
Body-size evolution across the past 541 Myr. The distribution of fossil marine animal biovolumes across the Phanerozoic is shown. The horizontal lines depict genus durations and are semitransparent so overlapping ranges appear darker. The thick black line indicates the stage-level mean body size. The thin black lines demarcate the 5th and 95th percentiles. Cm, Cambrian; O, Ordovician; S, Silurian; D, Devonian; C, Carboniferous; P, Permian; Tr, Triassic; J, Jurassic; K, Cretaceous; Pg, Paleogene; Ng, Neogene.
Mean size with 95% confidence intervals across the past 541 Myr within the five marine animal phyla included in this study. The mean sizes for all genera with and without the largely meiofaunal class Ostracoda are plotted in the top left panel. The mean sizes of Cephalopoda over time are plotted with the Mollusca. The timescale abbreviations are same as in Fig. 1.

Physiological aspects of anatomy and ecology are the most apparent mechanisms by which phyla could differ in their ability to respond in terms of body-size evolution to changing selective pressures or environmental boundary conditions. Because trophic level is strongly associated with body size in modern marine ecosystems (Kerr and Dickie Reference Kerr and Dickie2001; Ferrón et al. Reference Ferrón, Martínez-Pérez and Botella2018), feeding ecology is one potential determinant of size evolution. Other aspects of functional ecology, such as tiering level and motility, could also have important associations with body size and differ in their distributions across phyla. Circulatory anatomy must also respond to changes in body mass, because the ratio of surface area to volume scales allometrically with body size (Schmidt-Nielsen Reference Schmidt-Nielsen1984). Just as the hierarchical structuring of molecules, organelles, cells, and tissues constrains the distribution of organismal size across the full tree of life (Heim et al. Reference Heim, Payne, Finnegan, Knope, Kowalewski, Lyons, McShea, Novack-Gottshall, Smith and Wang2017), differences in circulatory anatomy among phyla could play an important role in the evolution of body size in marine animals. Further, the respiratory medium animals use to acquire oxygen—whether water or air—is potentially a key physiological determinant of body size (Forster et al. Reference Forster, Hirst and Atkinson2012; Verberk and Atkinson Reference Verberk and Atkinson2013; Heim et al. Reference Heim, Knope, Schaal, Wang and Payne2015; Audzijonyte et al. Reference Audzijonyte, Barneche, Baudron, Belmaker, Clark, Marshall, Morrongiello and van Rijn2019).
To assess the extent to which the differences in body size among phyla can be explained by ecological traits, circulatory anatomy, respiratory medium, or other (untested) aspects of shared evolutionary history, we compiled a comprehensive global dataset of the sizes, feeding modes, circulatory anatomies, and respiratory media of fossil and extant marine animals. We documented not only the trends in size over time as they relate to these possible predictor variables, but also the timing of size increases. Our dataset covers the major bilaterian phyla that are well represented in the fossil record and have solitary (i.e., noncolonial) adult life forms. We also consider the body-size distributions of extant meiofaunal marine animals that respire cutaneously and lack circulatory systems in relation to larger and more complex marine macrofauna.
Data and Methods
Body-Size, Anatomical, and Ecological Data
Body Size
For the main analyses we analyzed a dataset of 13,723 fossil marine animal genera. All genera belong to the five solitary bilaterian animal phyla with diverse, well-preserved fossil records: Arthropoda, Brachiopoda, Chordata, Echinodermata, and Mollusca. This dataset is derived and updated from the data compiled by Heim et al. (Reference Heim, Knope, Schaal, Wang and Payne2015), and each genus has an estimate of body size. Our measure of body size is biovolume, which is estimated as the volume of an ellipsoid or cone based on the linear dimensions of the three primary body axes. Body axes were measured from published images with known scales. Each genus also has a stage-resolved stratigraphic range. Most sizes and stratigraphic ranges were taken from the Treatise on Invertebrate Paleontology, but other published sources were also used (for details, see Heim et al. Reference Heim, Knope, Schaal, Wang and Payne2015).
Physiological Anatomy
We considered the medium from which an animal extracts oxygen (i.e., water or air) and whether the animal has an open or closed circulatory system. In most species, the anatomical manifestation of respiratory medium is the presence of invaginated gas exchangers (i.e., internal lungs) in air breathers and evaginated gas exchangers (i.e., external gills) in water breathers. The important physiological difference between air and water breathing is that air breathers have more access to oxygen. Air holds more oxygen and is less viscous than water. Because of these properties, air breathers require much less ventilation of their respiratory organs to extract the same amount of oxygen than their water-breathing counterparts (Piiper Reference Piiper1982; Maina Reference Maina2002). In addition, the oxygen diffusion rate from alveolar air into lung tissues is much faster than diffusion from water into gill tissues (Maina Reference Maina2002, Reference Maina2011; Pauly Reference Pauly2010). Thus, breathing air allows for much more oxygen extraction, which in turn permits larger body size by reducing the surface area constraints at larger masses (for a full explanation of the surface area to volume problem in physiology, see Payne et al. Reference Payne, McClain, Boyer, Brown, Finnegan, Kowalewski, Krause, Lyons, McShea, Novack-Gottshall, Smith, Spaeth, Stempien and Wang2011 and references therein). The circulatory system also plays an important role in respiratory efficiency (LaBarbera and Vogel Reference LaBarbera and Vogel1982) and should further constrain size increase. Open circulatory systems consist of a heart that receives oxygenated blood from gas exchangers and then pumps respiratory fluids (blood or hemolymph) into sinuses, where diffusion takes place as membranes are bathed with the respiratory fluid. While in the sinuses, the respiratory fluid delivers oxygen to cells, takes in waste products, and mixes with nonrespiratory fluids. From the sinuses, fluids are then moved back toward the gas exchangers for reoxygenation before returning to the heart. By contrast, the respiratory fluids in closed circulatory systems are fully enclosed within vessels. Oxygen-rich respiratory fluid is received in the heart from the gas exchangers, then pumped through vessels to capillaries, where diffusion of oxygen into cells and of carbon dioxide back into the fluid takes place, before the fluid is returned to the heart. Relative to open circulatory systems, closed circulatory systems move respiratory fluids with higher pressure and greater velocity (LaBarbera and Vogel Reference LaBarbera and Vogel1982; Labarbera Reference LaBarbera1990; Reiber and McGaw Reference Reiber and McGaw2009). Also, respiratory fluids within closed systems do not mix with other fluids, and oxygen-rich fluids are kept separate from oxygen-depleted carbon dioxide–rich fluids. As a result, hemolymph in animals with open circulatory systems serves an oxygen storage function as evidenced by its relatively large volume (approximately 30% of total body water; Kanost et al. Reference Kanost, Resh, Cardé, Resh and Cardé2009). Blood within closed circulatory systems, by contrast, only constitutes approximately 5% of the animal's total mass (Lee and Blaufox Reference Lee and Blaufox1985) and primarily serves a transport function. Because of these characteristics, animals with closed circulatory systems should have greater respiratory efficiency (Maina Reference Maina2002) and, consequently, should be able to obtain larger body sizes, all else being equal.
We coded genera by their respiratory medium as being air breathers or water breathers and by their circulatory anatomy as having open or closed circulatory systems. Both of these traits were coded based on higher taxonomy, Linnaean class or order in most cases (see Supplementary Material for classification table). All genera in our dataset fell into three respiratory–circulatory modes: water breathers with open circulatory systems (N = 10,276), water breathers with closed circulatory systems (N = 3533), and air breathers with closed circulatory systems (N = 104). To a first approximation, there are no fully marine animals that breathe air and possess open circulatory systems. There are a few living insect species that have open circulatory systems and partially inhabit the oceans, but these taxa lack fossil records and are not considered here.
Ecology
We applied the widely adopted ecological framework of Bush and Bambach (Bambach et al. Reference Bambach, Bush and Erwin2007; Bush et al. Reference Bush, Bambach and Daley2007) to our marine animal dataset in order to code feeding mode and other potentially important ecological traits. This framework divides a theoretical ecospace along three axes, with each axis divided into six marginal states. The three axes are habitat tiering relative to the seafloor, level of motility, and mode of feeding. We used the ecological mode assignments of Knope et al. (Reference Knope, Heim, Frishkoff and Payne2015) to assign modes to genera. Our primary analyses focused on feeding mode, which describes the basic feeding method, subdividing genera into six categories: (1) suspension feeders, (2) surface-deposit feeders, (3) sediment miners, (4) grazers, (5) predators, and (6) other (e.g., chemo- and photosymbiosis, parasitism). We also considered feeding mode as a binary variable of predator (N = 4778) versus non-predator (N = 9135) to assess the impact of trophic level, given that predators are at least secondary consumers, whereas many of the non-predatory genera are predominantly suspension feeders, which are dominated by primary consumers. The full dataset is available in the online Supplementary Material.
Meiofauna
The main focus of this study is trends in macrofauna, thus our primary analyses exclude the meiofaunal class Ostracoda. Ostracods have diverse feeding modes, and most modern species lack respiratory and circulatory systems (Vannier and Abe Reference Vannier and Abe1995; Bambach et al. Reference Bambach, Bush and Erwin2007; Wilkinson et al. Reference Wilkinson, Wilby, Williams, Siveter, Vannier and Elewa2007). Unfortunately, morphological evidence of feeding mode, respiratory medium, and circulatory anatomy are rarely preserved in the fossil record of ostracods (Horne et al. Reference Horne, Cohen, Martens, Holmes and Chivas2002; Siveter et al. Reference Siveter, Siveter, Sutton and Briggs2007, Reference Siveter, Briggs, Siveter, Sutton and Joomun2013). By excluding ostracods from the main analyses, we are missing the smallest animals with a robust fossil record, particularly in the post-Paleozoic, but the impact on the overall trend in mean size is minimal (Fig. 2).
Despite the absence of adequate data on fossil meiofaunal groups, the size, respiratory, and circulatory characteristics of living meiofaunal groups are instructive. We have compiled and analyzed a dataset of body sizes for 264 free-living marine nematode genera and 138 free-living marine podocope ostracods to complement the primary analyses. Both nematodes and ostracods respire cutaneously and lack circulatory systems (Atkinson Reference Atkinson, Zuckerman and Dusenbery1980; Vannier and Abe Reference Vannier and Abe1995). Nematodes do not have respiratory or circulatory systems and rely on diffusion for internal oxygen delivery (Atkinson Reference Atkinson, Zuckerman and Dusenbery1980). Metabolically active organisms, such as nematodes, that rely on diffusion must keep their metabolically active tissues close to oxygenated water. Generally, these organisms must be less than 1 mm in diameter if spherical (Krogh Reference Krogh1941) and have a radius less than 1 mm if fusiform (Atkinson Reference Atkinson, Zuckerman and Dusenbery1980; Payne et al. Reference Payne, McClain, Boyer, Brown, Finnegan, Kowalewski, Krause, Lyons, McShea, Novack-Gottshall, Smith, Spaeth, Stempien and Wang2011). Nematodes are able to rely on diffusion because they are roughly cylindrical with a body radius much less than 1 mm (Atkinson Reference Atkinson, Zuckerman and Dusenbery1980). Podocopan ostracods, while slightly larger on average than nematodes, also lack respiratory and circulatory systems and conduct cutaneous respiration (Vannier and Abe Reference Vannier and Abe1995). Unlike nematodes, ostracods are not cylindrical, but they are able to increase their diffusion rate by ventilating sites of gas exchange by generating currents of oxygenated water using enlarged branchial plates on the cephalic maxillula (Horne Reference Horne2005; Olempska et al. Reference Olempska, Horne and Szaniawski2012).
Statistical Methods
To assess the associations of respiratory–circulatory mode and feeding mode on body size, we first examined size distributions of living genera. We then examined evolutionary trends in mean size within physiological and ecological groupings across the Phanerozoic to determine when and how the size differences that characterize the extant fauna developed. We have conducted analyses of extant and fossil genera separately, because combining genera that did not coexist will lead to higher genus counts for groups with high rates of taxonomic turnover. Confining comparisons of body-size distributions to standing genera at a single point in Earth history avoids this potential bias.
Modern
For extant genera, we compared body-size distributions grouped by respiratory–circulatory mode and by feeding mode. We also compared the variation in body size within the different modes using standard deviation. To test for significant differences in mean sizes among groups, we performed an ANOVA with Linnaean class as a random effect, which allowed us to account for the effects of shared evolutionary history on body size. Linnaean class is a crude measure of phylogeny, but there is not currently a phylogeny that covers the taxonomic and temporal scope of our dataset. We applied a Tukey's honest significant differences test to determine which pairs of groups are significantly different. Finally, we calculated effect size as eta-squared (η2) using the lsr package (Navarro Reference Navarro2015) for R (R Core Team 2019). η2 is the percent variance explained for each predictor variable in a factorial ANOVA. The sum of η2 across all variables is the total R 2 (Levine and Hullett Reference Levine and Hullett2002; Navarro Reference Navarro2015).
Fossil Record
For the extinct genera, we calculated mean size for each respiratory–circulatory mode and for each feeding mode in each of the 99 Phanerozoic stages. We also performed multiple linear regression in each stage to determine the relative strength of association of respiratory medium, circulatory system, and feeding mode with body size. Again, we included Linnaean class as a random variable to control for the possible influence of traits shared through evolutionary history without explicitly including class as a predictor variable in the analysis.
Results
Modern
Among the three respiratory–circulatory modes for living genera, air breathers are the largest marine animals, followed by water breathers with closed circulatory systems and then water breathers with open circulatory systems (Fig. 3A, Table 1). The mean size of genera that are closed circulatory air breathers is approximately three orders of magnitude larger than the mean size of genera that are closed circulatory water breathers. Further, the mean size of water-breathing genera with closed circulation is more than two orders of magnitude larger than the mean size of genera that are water breathers with open circulatory systems. This pattern of decreasing body size from air breathers with closed circulatory systems to water breathers with open circulation also holds for maximum and minimum size (Fig. 3A, Table 1). The difference in mean size between each pair of respiratory–circulatory modes is statistically significant (ANOVA: F = 718, p-value << 0.001) as are the means between all three combinations of respiratory–circulatory mode (Table 2). Thirty-seven percent of the variation in body size is explained by respiratory–circulatory mode (η2 = 0.37).
Body-size distributions of extant genera grouped by respiratory–circulatory mode and feeding mode. A, Box-and-whisker plots of log10 biovolume for each of the three respiratory–circulatory modes. B, Box-and-whisker plots of log10 biovolume for genera with predatory and non-predatory feeding modes. C, Box-and-whisker plots of log10 biovolume for each of the six feeding modes. Diamonds near centers of distributions are mean size. Sample sizes are given above each box plot.

Summary statistics for the body sizes of extant genera grouped by respiratory–circulatory mode and feeding modes. n, number of genera; Min, minimum size; Max, maximum size; Mean, mean size; Median, median size; SD, standard deviation of size. Size is measured as biovolume with units of log10 mm3.

Differences in mean size between all pairwise combinations of respiratory–circulatory modes and feeding modes. Confidence limits and significance were calculated with the Tukey's honest significant differences test. Only extant genera are included in the analysis.

As body size decreases from closed circulatory air breathers to open circulatory water breathers, the variance in size increases (Table 1). Quantitative comparisons of variances using a robust Brown-Forsythe Levene-type test of equal variances show that the variances among the groups are different (Table 3). Comparisons between the individual modes show unequal variances for some pairs. There is strong support for a difference between water breathers with open versus closed circulatory systems, slightly weaker support for differences between closed circulatory air breathers and open circulatory water breathers, and no difference in variance between air breathers and water breathers with closed circulatory systems (Table 3).
Comparison of variances between extant genera grouped by respiratory–circulatory mode. Statistical tests are the results from a robust Brown-Forsythe Levene-type test of equal variances.

Living genera also show a statistically significant difference in mean size between predatory and non-predatory feeding modes (Fig. 3B), but this difference is less than the differences among groupings based on respiratory–circulatory mode. Most of the difference in size among all feeding modes is due to the relatively small sizes of grazing genera, which “scrape or nibble” (Bush et al. Reference Bush, Bambach and Daley2007: p. 82) food off a substrate (ANOVA: F = 70.1, p-value << 0.001; Fig. 3C). The only significant size differences are between grazers and all feeding modes except “other” (only eight genera have a feeding mode of “other”; seven chemosymbiotic bivalves and one parasitic decapod) as well as between predators and suspension feeders (Table 2). Feeding mode only explains 13% of the variation in body size (η2 = 0.13).
We also used a two-way ANOVA to simultaneously consider the effects of respiratory–circulatory and feeding modes on extant marine animal genera with Linnaean class included as a random effect to control for phylogenetic nonindependence, and the results are consistent with the ANOVAs conducted separately on those variables. A plurality of the variance is explained by respiratory–circulatory mode (ANOVA: F = 645, p-value << 0.001, η2 = 0.30), while much less is explained by feeding mode (ANOVA: F = 49, p-value << 0.001, η2 = 0.05).
Fossil Record
The differences in size among extant genera with different respiratory–circulatory modes raise the question: Did the evolution of closed circulatory systems permit larger body size, or did large body size create selective pressure for more efficient respiration and circulation? The air breathers show no appreciable change in their mean size from their first appearance in the late Permian through the Pleistocene. This is not the case for the water breathers. All marine animals in the Cambrian were water breathers, and among these earliest animals were those with closed and open circulatory systems. During the Cambrian, animals with closed circulatory systems were actually smaller, on average, than animals with open circulatory systems (Fig. 4A). Following the initial evolution of small-bodied animals with closed circulatory systems, a relatively steady progression toward larger body size ensued through the remainder of the Phanerozoic. Overall, the water breathers with closed circulatory systems increased in mean size by five orders of magnitude, whereas animals with open circulatory systems increased in mean size by less than two orders of magnitude.
Mean trends in body size of marine animal genera across the past 541 Myr. Vertical lines are 95% confidence intervals. A, Mean size over time for each of the three respiratory–circulatory modes. B, Mean size over time for predatory and non-predatory genera. C, Mean size over time for five of the six feeding modes. The “other” feeding mode was excluded due to very small sample sizes over time.

The evolutionary history of water breathers with closed circulatory systems shows several intervals of rapid size increases and decreases. The first episode of increase occurred early in the Ordovician Period, by which point the mean size for genera with closed circulatory systems surpassed that for genera with open circulatory systems. This episode of size increase appears to be due in part to the radiation and sustained large size of nautiloid cephalopods (Fig. 2) (Novack-Gottshall Reference Novack-Gottshall2008; Klug et al. Reference Klug, Baets, Kröger, Bell, Korn and Payne2015). The first major decrease in mean size took place during the Late Devonian, a 23 Myr interval of persistent extinction of large-bodied fish species (Sallan and Galimberti Reference Sallan and Galimberti2015), and was followed by relative stasis for the remainder of the Paleozoic. The end-Permian mass extinction resulted in a short-lived increase in mean body size, reflecting selective survival of large-bodied genera, particularly bivalves, gastropods, and cephalopods (Fig. 5A) as well as higher extinction rates in smaller-bodied classes. For example, the brachiopod classes Rhychonellata and Strophomenata are, on average, smaller than Bivalvia (Fig. 5A), but experienced much greater extinction losses (Knoll et al. Reference Knoll, Bambach, Payne, Pruss and Fischer2007). Following the end-Cretaceous mass extinction, there was rapid increase in mean body size that corresponds to the preferential extinction of small-bodied cephalopods (i.e., ammonites were smaller, on average, than nautiloids) and bony fishes. Comparison of the mean sizes of end-Cretaceous mass extinction victims and survivors shows that in the most diverse classes, including bony fishes, cephalopods, and bivalves, survivors were much larger than their counterparts that went extinct during the Maastrichtian (Fig. 5B).
Comparisons of mean biovolumes within classes of victims and survivors of the two era-bounding mass extinctions. The sizes of the points depict relative genus richness (on log2 scale). The dashed lines are one-to-one lines. A, Lopingian genera classified into those that went extinct during the terminal epoch of the Permian and those that survived into the Triassic. Note that surviving brachiopods and crinoids tended to be smaller than victims of the same classes, while surviving molluscan genera tended to be larger than molluscan victims. B, Mean sizes of Maastrichtian genera, divided into those that went extinct in the terminal age of the Cretaceous and those that survived into the Danian. Note the general inverse relationship between overall body size and extinction selectivity. Victims in small-bodied classes tended to be larger than survivors, while survivors in large-bodied classes tended to be larger than victims.

In contrast to the differential size trends among respiratory–circulatory modes, both predators and non-predators exhibit trends of increasing mean size across the Phanerozoic. The magnitudes of the size increases are similar in both groups, but with predators consistently exhibiting larger mean body sizes (Fig. 4B). There are no systematic trends in size histories of individual feeding modes (Fig. 4C). Mean sizes are somewhat volatile in the early Paleozoic, then flatten out starting in the late Paleozoic, remaining relatively constant for the remainder of the Phanerozoic. Predators and grazers separate out as the largest and smallest feeding modes, respectively, while the remaining feeding modes converge on an intermediate size.
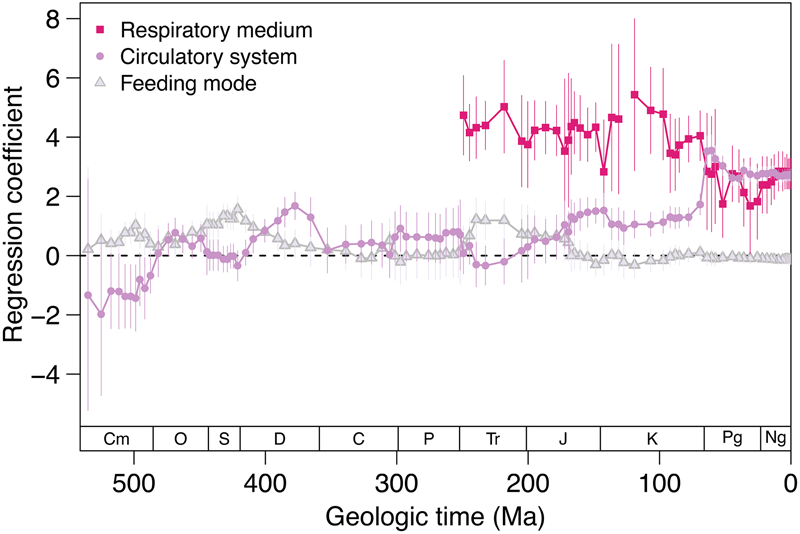
We used a linear mixed model with Linnaean class as a random effect to predict body size as a function of respiratory medium, circulatory anatomy, and feeding mode. This model differentiates between the strength of association of those three variables with body size over time (Fig. 6). Air breathing has been associated with larger body size since the first appearance of air breathers in the marine fossil record during late Permian time. During the Cambrian, closed circulatory systems were associated with smaller body sizes. Closed circulation became associated with larger body size during the Ordovician and reached a peak in the Late Devonian. The strength of association fluctuated during the remainder of the Paleozoic and Mesozoic before increasing rapidly in the Danian and remaining quite high for the Cenozoic. In contrast, the association between feeding mode and body size has been neutral to weakly positive with predators showing a slight tendency toward larger body sizes across the Phanerozoic. The strength of the association between size and feeding mode was greater than that for respiratory–circulatory mode until the Early Devonian. Thereafter, the association between size and circulatory anatomy has been stronger, except during the Triassic (Fig. 6).
Regression coefficients for respiratory–circulatory modes and feeding mode. The multiple linear regression has the form: body size ~ circulatory system + respiratory medium + feeding mode. Linnaean class is included as a random effect and all three predictor variables are binary. The feeding mode categories are non-predators (0) and predators (1). The circulatory system categories are open circulatory system (0) and closed circulatory system (1). The respiratory medium categories are water breathers (0) and air breathers (1). Positive coefficients correspond to a positive relationship between having a variable value of 1 and body size. Negative coefficients correspond to a negative relationship between having a variable value of 1 and body size. Vertical lines are 95% confidence intervals.
Other Aspects of Ecology
One of the advantages of a closed circulatory system is that it enables more active lifestyles. We demonstrate this relationship by comparing the distribution of respiratory–circulatory modes within different ecological modes. We calculated the proportion of genera in each of our respiratory–circulatory modes occupying each of the 18 marginal states of the Bush et al. (Reference Bush, Bambach and Daley2007) ecospace.
All of the air breathers are pelagic (Supplementary Fig. 1A). This result is expected, because air breathers need to access the ocean surface to breathe. However, air breathers are a relatively small portion of the overall fauna, and the vast majority of the pelagic animals in the dataset have closed circulatory systems. The tiering axis is partially independent of the motility axis, such that pelagic animals are entirely motile, but may be actively or passively so. Nevertheless, all of the pelagic genera with closed circulatory systems are fully motile, fast. About 20% of the semi-infaunal genera have closed circulatory systems, and a very small percentage of surficial genera have closed circulation. All of the fully infaunal and erect genera have open circulatory systems (Supplementary Fig. 1A).
The motility axis is more directly related to activity levels. Here we see a clear relationship between motility levels and the proportion of genera with closed circulatory systems (Supplementary Fig. 1B). All air-breathing genera are fully motile, fast; and all closed-circulation water breathers are motile and unattached. Of the water-breathing genera with closed circulatory systems, 80% are fully motile, fast; and nearly 20% are fully motile, slow.
Most of the air breathers are predators (Supplementary Fig. 1C), but there are a few genera distributed among the other feeding modes. Like the air breathers, most of the water-breathing genera with closed circulatory systems are predators, but a few are distributed across other modes. In this ecospace framework, predators are those animals that capture prey capable of resistance (Bush et al. Reference Bush, Bambach and Daley2007), which implies a high degree of activity, at least for short intervals of time.
To assess the relationship between respiratory–circulatory mode and the full suite of ecological modes, we compared the body-size distributions of the three respiratory–circulatory modes within each of the three ecological axes as well as within the eight ecological modes of life with genera occupying at least two respiratory–circulatory modes. The size distributions for respiratory–circulatory modes show remarkable consistency across marginal ecological states. Along the feeding axis (Supplementary Fig. 2), air breathers are larger than water breathers with closed circulation, which are in turn larger than water breathers with open circulation. Moreover, the median size of each respiratory–circulatory mode is similar across all feeding modes. The same pattern exists for tiering level, motility level, and the ecological modes (Supplementary Fig. 2).
Higher Taxonomy
Body size is a heritable trait (e.g., Rutledge et al. Reference Rutledge, Eisen and Legates1973; Leamy Reference Leamy1988; Smith et al. Reference Smith, Betancourt and Brown1995) so systematically larger or smaller sizes in ecological or anatomical groupings that are strongly conserved across phylogeny could result from factors other than those being examined. It is therefore noteworthy that the systematic differences in size between anatomical groupings hold when the dataset is separated into different higher taxonomic groups. The Mollusca and Chordata are the two phyla with multiple respiratory–circulatory modes, and both phyla show consistent sizes across ecological modes within respiratory–circulatory modes (Supplementary Fig. 3). The rank order of sizes is consistent across all phylum–ecology combinations: the air breathers are larger than water breathers with closed circulatory systems, which are in turn larger than water breathers with open circulatory systems. However, not only is the rank order consistent, the overall sizes are approximately equal. The size distributions for air breathers grouped by marginal ecological state are scattered around a body size of approximately 9 log10 biovolume units. The body-size distributions for all marginal ecological states of water breathers with closed circulatory systems, in both phyla, are scattered around a body size of approximately 6 log10 biovolume units. Finally, the size distributions for water breathers with open circulatory systems grouped by marginal ecological state are scattered around a body size of about 4 log10 biovolume units.
Meiofauna
Free-living marine nematodes are smaller and have a larger variance than podocope ostracods. The right tails of the nematode and ostracod body-size distributions overlap with the left tail of the size distribution for water breathers with open circulatory systems (Fig. 7). Overall, animals that lack respiratory and circulatory systems are much smaller than animals that possess them.
Body-size distributions of extant macrofaunal and meiofaunal genera based on respiratory–circulatory mode. Probability density distributions are plotted and were estimated by Gaussian kernel density estimation with the same bandwidth (0.214). The data used to calculate distributions for the Air–closed, Water–closed, and Water–open groups are the same as those used to generate Fig. 3A. The Water–none distributions were calculated for free-living, marine Podocopa (Class Ostracoda) and Nematoda. Podocopa and Nematoda are meiofauna that lack respiratory and circulatory systems.

Discussion
The differences in size among modern and fossil animal groups with differing respiratory–circulatory modes suggest that the efficiency of oxygen delivery to tissues is an important constraint on size evolution in marine animals. Respiratory medium and circulatory anatomy, which are among the most stable characters of body plans, were generally set by Cambrian time (Hall Reference Hall1992). As a result, the capacity, or lack thereof, to reach very large body size was established early in the evolutionary histories of animal phyla and classes. The influence of anatomical constraint on subsequent evolutionary trends is evident in the large and progressive increase in the mean and maximum sizes of closed-circulatory-system animals relative to those with open circulatory systems.
Feeding mode has also had an important influence on body size, but its influence has operated within the constraints imposed by respiratory medium and circulatory anatomy. Over the course of the Phanerozoic, the mean sizes of predators and non-predators increased roughly in parallel, reflecting the fact that both predators and non-predators exist in all three anatomical groupings. The offset in mean size between these groups has been relatively constant across time despite the increasing mean size of each group. This pattern is congruent with both theory (Woodward et al. Reference Woodward, Ebenman, Emmerson, Montoya, Olesen, Valido and Warren2005) and observation (Cohen et al. Reference Cohen, Jonsson and Carpenter2003) that body size generally increases with trophic level. The differences between predators and non-predators indicate that feeding mode is important in determining body size, but the stable differences within the long-term trend in each indicate that there are additional factors that determine size evolution over time.
It is important to distinguish between extrinsic drivers of body-size change and intrinsic factors that both permit and constrain change. Increasing availability of oxygen in the environment (e.g., Nursall Reference Nursall1959; Rhoads and Morse Reference Rhoads and Morse1971; Knoll and Carroll Reference Knoll and Carroll1999; Dahl and Hammarlund Reference Dahl and Hammarlund2011; Sperling et al. Reference Sperling, Frieder, Raman, Girguis, Levin and Knoll2013; Boag et al. Reference Boag, Stockey, Elder, Hull and Sperling2018) and increasing primary productivity (e.g., Bambach Reference Bambach1993, Reference Bambach1999; Vermeij Reference Vermeij2011, Reference Vermeij2016) are extrinsic factors that can drive body-size evolution. None of the body-size data presented here follow the Phanerozoic trend of atmospheric oxygen concentration, which fluctuates around 20% and had maxima in the Silurian and Mississippian and minima in the Ordovician and Jurassic (Schachat et al. Reference Schachat, Labandeira, Saltzman, Cramer, Payne and Boyce2018). Primary productivity has been suggested to have increased over the Phanerozoic (Martin Reference Martin1996), but this is reflected in neither growth rates (Saulsbury et al. Reference Saulsbury, Moss, Ivany, Kowalewski, Lindberg, Gillooly, Heim, McClain, Payne, Roopnarine, Schöne, Goodwin and Finnegan2019) nor ecological modes of life (McClain et al. Reference McClain, Heim, Knope and Payne2018). Respiratory–circulatory modes, and internal oxygen delivery mechanisms generally, are features of body plans that determine how easy or difficult it is to achieve any given size and, effectively, limit the size extremes associated with a given body plan (e.g., Heim et al. Reference Heim, Payne, Finnegan, Knope, Kowalewski, Lyons, McShea, Novack-Gottshall, Smith and Wang2017; Gearty et al. Reference Gearty, McClain and Payne2018). Our data show that external drivers, such as the increase in the proportion of predatory taxa, were important in body-size evolution early in the history of animals (Fig. 6), but they also demonstrate that the range of body sizes that is possible for any given clade is determined in large part by respiratory–circulatory mode and is independent of ecological mode of life.
The interpretation of respiratory–circulatory mode as a primary constraint on marine animal body size is evident by the consistency in body-size distributions. In no categorization of genera employed here is there an observed reversal of the primary pattern: air breathers > water breathers with closed circulatory systems > water breathers with open circulatory systems. Moreover, the maximum, minimum, and median sizes of genera within each respiratory–circulatory mode tend to be similar across ecological modes (Supplementary Fig. 2) and phyla (Supplementary Fig. 3).
The strong association between body size and respiratory–circulatory mode suggests constraint by hierarchical complexity of anatomy (McShea Reference McShea2001; Heim et al. Reference Heim, Payne, Finnegan, Knope, Kowalewski, Lyons, McShea, Novack-Gottshall, Smith and Wang2017). Considering vertical hierarchical complexity (Sterelny Reference Sterelny1999; McShea Reference McShea2001) from viruses to prokaryotes to protists to multicellular eukaryotes, “body”-size distributions of adjacent levels overlap at extreme values, but the modes are clearly distinct (Heim et al. Reference Heim, Payne, Finnegan, Knope, Kowalewski, Lyons, McShea, Novack-Gottshall, Smith and Wang2017). Organisms at the extreme sizes for their level of complexity tend to have morphological or functional adaptations to cope with the challenges of extreme size. For example, 98% of the volume of Thiomargarita, the largest known prokaryote, is occupied by a vacuole, limiting the metabolically active region of the cell to a thin film where diffusion is sufficient (Schulz Reference Schulz, Dworkin, Falkow, Rosenberg, Schleifer and Stackebrandt2006). In this study, we restricted the main analyses to solitary bilaterian metazoans, a subset of multicellular eukaryotes. For these animals to increase in overall body size from a small aggregate of eukaryotic cells, they must do more than simply increase the number of somatic cells, rather they must evolve specialized cells that are organized into tissues and organs. Budd and Jensen (Reference Budd and Jensen2000) proposed that the ancestor of animals with circulatory systems was an animal that relied on diffusion and intracellular convection to meet metabolic demands. Importantly, they argue that for this anatomical innovation to evolve, the right tail of the size distribution for diffusion-limited animals must overlap with the left tail of the size distribution of animals with circulatory systems. Our data support this model (Fig. 7), and we postulate that the most important sets of tissues and organs for increasing body size in animals are those associated with the respiratory and circulatory systems. These systems are essential for distributing oxygen from the environment to interior cells and, in a broader sense, are the systems that allow material exchange so that the entire animal can function as an integrated organism maintaining homeostasis. Our primary hypothesis is that the minimum and maximum sizes an animal can achieve are strongly constrained by physiological factors (Makarieva et al. Reference Makarieva, Gorshkov and Li2005; Maurer and Marquet Reference Maurer, Marquet, Smith and Lyons2013; Smith and Lyons Reference Smith, Lyons, Smith and Lyons2013; Ferrón et al. Reference Ferrón, Martínez-Pérez and Botella2018) and ultimately related to internal oxygen transport systems.
Definitively answering the question of what sets the absolute maximum and minimum sizes of marine animals is beyond the scope of this study. However, there is anecdotal evidence that physiology and anatomical complexity exert a strong control. All else being equal, simple organ systems should be more energetically efficient to develop and maintain than complex ones. We are referring here to horizontal complexity (McShea Reference McShea1996), which is the number of parts or part types (note that horizontal complexity is distinct from the vertical complexity discussed earlier). Under this framework, closed circulatory systems with veins, arteries, capillaries, multiple hearts, many-chambered hearts, and so forth are more complex than open circulatory systems. Animals with open circulatory systems are in turn more complex than animals that lack circulatory systems and rely on diffusion. If it is a general pattern that feeding efficiency increases with size (e.g., Mittelbach Reference Mittelbach1981; Ferrón et al. Reference Ferrón, Martínez-Pérez and Botella2018), the expectation is that some lower size limit exists where energy expenditures exceed energy intake. In addition, the parts involved take up space in the body; thus, simple space constraints may also limit the ability of animals with complex anatomies to function at very small sizes. It must also be true that the evolution of more complex internal oxygen delivery systems is required to make large increases in size (Schmidt-Nielsen Reference Schmidt-Nielsen1984; Budd and Jensen Reference Budd and Jensen2000).
Both nematodes and ostracods belong to the superphylum Ecdysozoa. Based on their position in the ecdysozoan phylogeny (Giribet Reference Giribet2016) and the limited fossil record (Poinar Reference Poinar2011), the ancestral nematode likely lacked circulatory and respiratory systems. The oldest unequivocal fossil nematode, Palaeonema, is Devonian in age; associated with plant fossils and “may have been a facultative plant parasite that supplemented its diet with various microorganisms” (Poinar et al. Reference Poinar, Kerp and Hass2008: p. 12); has a maximum diameter of 23 microns; and lacks evidence of respiratory or circulatory systems (Poinar et al. Reference Poinar, Kerp and Hass2008). The oldest known fully marine fossil nematode, Nemavermes, is Late Mississippian to Pennsylvanian in age (Schram Reference Schram1979; Poinar Reference Poinar2011), up to 6 mm in diameter (Poinar Reference Poinar2011), and also lacks evidence of a circulatory system. (We acknowledge that free-living marine nematodes have been reported from Upper Ordovician rocks [Knaust and Desrochers Reference Knaust and Desrochers2019], but the body fossils lack anatomical details and are diagnosed as nematodes based on overall body dimensions and associated trace fossils.) This paleontological evidence is consistent with the position of Nematoda on the ecdysozoan phylogeny within a large clade where all constituent phyla lack respiratory and circulatory systems. The putative ancestral state of nematodes is an important contrast to that of the ostracods. Unlike nematodes, ostracods are within the most derived ecdysozoan clade, Panarthropoda, in which the constituent phyla (Onychophora, Arthropoda) widely possess respiratory and circulatory systems. Evidence of respiratory and circulatory systems is common in crustaceans preserved in Cambrian Lagerstätten (Vannier et al. Reference Vannier, Williams and Siveter1997). Of particular relevance are the Bradoriida, which are Cambrian stem-group crustaceans that superficially resemble ostracods (Hou et al. Reference Hou, Siveter, Williams, Walossek and Bergström1996). Bradioriids possess evidence of hemolymph sinuses on their carapace that are similar to those of Recent myodocope ostracods and malacostracans (Vannier et al. Reference Vannier, Williams and Siveter1997). The presence of circulatory anatomy in stem-group crustaceans and in myodocope ostracods (Siveter et al. Reference Siveter, Sutton, Briggs and Siveter2003, Reference Siveter, Briggs, Siveter, Sutton and Joomun2013) suggests the possibility that podocope ostracods, which are much smaller than other bivalved crustaceans, including myodocopes and bradoriids (Vannier and Abe Reference Vannier and Abe1995), have lost their circulatory systems in response to miniaturization.
The evolutionary history of animal size clearly illustrates that body-size evolution has responded to anatomical features that existed, in most cases, by Cambrian time. Early in the history of animals, feeding mode was the strongest predictor of large body size (Fig. 6), and all water-breathing animals were relatively small (Fig. 3A). This result is consistent with escalatory hypotheses for the diversification of body plans during the Cambrian explosion, in which the advent of predation led to a diversification of animal forms due to the increasing complexity of ecological interactions (Stanley Reference Stanley1973; Peterson et al. Reference Peterson, McPeek and Evans2005; Marshall Reference Marshall2006; Butterfield Reference Butterfield2007, Reference Butterfield2011; Sperling et al. Reference Sperling, Frieder, Raman, Girguis, Levin and Knoll2013). However, the capacity for ecological escalation to drive upward trends in the overall mean body size was quickly exhausted for animals with open circulatory systems. Animals that had closed circulatory systems, on the other hand, were able to evolve toward substantially larger body sizes, because they possessed circulatory anatomy that could distribute oxygen and other materials throughout the large bodies rapidly and efficiently (LaBarbera and Vogel Reference LaBarbera and Vogel1982; Labarbera Reference LaBarbera1990; Maina Reference Maina2002; Reiber and McGaw Reference Reiber and McGaw2009). Air-breathing tetrapods further capitalized on this ability by extracting oxygen from air rather than water, where it is at higher concentration and can be taken up more rapidly and efficiently (Piiper Reference Piiper1982; Maina Reference Maina2002; Pauly Reference Pauly2010).
In arguing for important constraint on size evolution from respiratory medium and circulatory anatomy, we are not arguing that animals with closed circulatory systems are better adapted to their modes of life than those with open systems, nor are we suggesting that air breathers are better adapted to life in the oceans than are water breathers. In fact, water-breathing animals with open circulatory systems have efficient respiratory systems given their body sizes and respiratory demands (LaBarbera and Vogel Reference LaBarbera and Vogel1982; McMahon and Burnett Reference McMahon and Burnett1990; Maina Reference Maina2002). Moreover, the substantial diversity of animals in each anatomical grouping across hundreds of millions of years of Earth history and across multiple higher taxa clearly indicates that each combination is highly functional within a certain range of body sizes and metabolic demands. Nor are we suggesting that respiratory–circulatory mode is the only factor that determines the body size of individual species or higher taxa. For example, closed circulatory systems may enable individuals to be more motile, and being more motile is an advantage for capturing resources, thus enabling larger maximum sizes. That said, different combinations of respiratory media and circulatory anatomies are more or less effective at different body sizes, as indicated by the relatively limited overlaps in the size distributions across anatomical groupings (Fig. 7). Because these features of body plans are highly conservative, clades are fundamentally constrained in the ranges of body sizes they can achieve based on their respiratory–circulatory mode.
In summary, the evidence that respiratory medium and circulatory anatomy are strong constraints on animal body size holds among ecological modes and among higher taxa. Feeding mode was initially more important than respiratory–circulatory anatomy in animal body size, but the importance of anatomy has increased across time, even though the basic architectural design of the respiratory–circulatory mode has not changed. This finding suggests that while there were selective pressures for size change due to ecological interactions and the physical environment may have changed in terms of favorability for body size increases (e.g., increasing oxygen), the overall capacity of phyla and classes to respond to these pressures is strongly constrained by anatomical features that were mostly established during Ediacaran or Cambrian time and have, by and large, not changed since.
Acknowledgments
This research was supported by a CAREER grant from the U.S. National Science Foundation to J.L.P. (EAR-1151022) with additional support from the School of Earth, Energy, and Environmental Sciences at Stanford University. Supplementary figures, raw data files, and R code used for all analyses are permanently archived with Dryad (https://doi.org/10.5061/dryad.pk0p2ngjk). N.A.H., M.L.K., and J.L.P designed the study; N.A.H., S.H.B., L.B., S.C., S.H., A.J., C.N., A.P., N.R., S.S., and I.V. carried out analyses. All authors contributed to writing the paper.


 Open access