

Weight self-perceptions
Overweight and obesity have reached epidemic proportions( Reference Flegal, Carroll and Kuczmarski 1 , Reference Flegal, Carroll and Ogden 2 ). Two in three American adults are overweight or obese, compared with 46 % in 1976–1980 and 54 % in 1988–1994( Reference Flegal, Carroll and Kuczmarski 1 , Reference Ogden, Carroll and Kit 3 ). This secular trend is alarming because obesity is related to several chronic disease risk factors and outcomes, including heart attack, stroke, cancer, diabetes, hypertension and high cholesterol( Reference Pi-Sunyer 4 , Reference Dixon 5 ). Recent estimates are that obesity may increase annual medical costs by nearly $US 3000 per person and that total US health expenditures related to obesity may have reached as high as $US 190 billion in 2005, or one-fifth of all health expenditures( Reference Cawley and Meyerhoefer 6 ). Efforts to prevent weight gain and facilitate weight loss are now a top public health priority( 7 ).
An important factor influencing weight-loss efforts is a person’s self-perception of his/her own weight status, or whether a person believes that he/she is underweight, overweight or about the right weight( Reference Yaemsiri, Slining and Agarwal 8 – Reference Neumark-Sztainer, Paxton and Hannan 10 ). For example, Yaemsiri et al. found that, after adjustment for actual weight status, US women who perceive themselves as overweight have sixty-six times greater odds of wanting to lose weight and 3·7 times greater odds of actually engaging in weight-control behaviours than women who perceive themselves as normal weight or underweight( Reference Yaemsiri, Slining and Agarwal 8 ). They also found that men perceiving themselves as overweight are thirty-four times as likely to want to weigh less and 2·8 times as likely to engage in weight-control behaviours. Studies conducted among a range of diverse populations have found that perceptions affect weight-control behaviours regardless of age, ethnicity and other social characteristics( Reference Lee, Harris and Catley 11 – Reference Strauss 13 ).
Social factors and weight self-perceptions
Weight self-perceptions often do not align with objectively assessed weight status( Reference Chang and Christakis 14 – Reference Johnson-Taylor, Fisher and Hubbard 16 ). Paeratakul et al. found that about 18 % of normal weight US adults misperceive themselves as overweight and that 40 % of overweight adults and 13 % of obese adults misperceive themselves as normal weight( Reference Paeratakul, White and Williamson 15 ). The accuracy of weight self-perceptions varies based on social and demographic factors, including gender, age, marital status, socio-economic status and race/ethnicity( Reference Chang and Christakis 14 – Reference Dorsey, Eberhardt and Ogden 20 ). Using data from the 1999–2004 National Health and Nutrition Examination Survey (NHANES), Johnson-Taylor et al. found that about half of overweight men fail to perceive themselves as overweight, compared with under a quarter of overweight women( Reference Johnson-Taylor, Fisher and Hubbard 16 ). Gender differences in weight self-perceptions may result from body type expectations that differ across genders: in a national sample of adults, Maynard et al. found that men reported an ideal body type that was 2·5 kg/m2 greater than that of women( Reference Maynard, Serdula and Galuska 21 ). Paeratakul et al. found that people with greater educational attainment and higher income were more likely than other people to perceive themselves as overweight( Reference Paeratakul, White and Williamson 15 ). Chang and Christakis found that younger men and women were more likely to perceive themselves as overweight than those who were 55 years old or older( Reference Chang and Christakis 14 ). They also found that men who were never married were less likely than married men to perceive themselves as overweight.
Bennett and Wolin used data from the 1999–2002 NHANES to examine the relationship between weight self-perceptions and race/ethnicity, finding that overweight and obese Blacks and Latinos have two to three times the odds of misperceiving their weight status relative to Whites( Reference Bennett and Wolin 19 ). Several studies have confirmed that Whites are more likely than Blacks and Latinos to perceive themselves as overweight, regardless of actual weight status( Reference Paeratakul, White and Williamson 15 , Reference Smith, Thompson and Raczynski 18 , Reference Dorsey, Eberhardt and Ogden 20 ). Interestingly, Maynard et al. found that White men have lower desired weight than Black men (82·1 kg v. 84·4 kg, respectively), but that the mean desired weight of Latino men (76·8 kg) is much lower than for either Blacks or Whites( Reference Maynard, Serdula and Galuska 21 ). Among women, mean desired weight of Whites and Latinos is similar (60·9 kg v. 60·2 kg, respectively), but is higher among Blacks (66·6 kg).
Secular trends
A reason why weight self-perceptions vary based on social and cultural characteristics is likely that body image ideals are socially constructed. Research suggests that body image ideals and weight self-perceptions are influenced by social comparisons with body types portrayed in advertisements and the media, as well as comparisons with peers, family members and others( Reference Richins 22 – Reference Jones 26 ). Social comparisons have interesting implications when considered within the context of secular trends in obesity. As mean body mass has increased over the last several decades, an individual’s parents, peers and other social referents are now more likely to be overweight and obese. These secular trends may have affected body image ideals and, consequently, weight self-perceptions.
In fact, several studies have found that body ideals and weight self-perceptions have changed over time such that people are now less likely to perceive themselves as overweight( Reference Johnson-Taylor, Fisher and Hubbard 16 , Reference Burke, Heiland and Nadler 17 , Reference Maynard, Serdula and Galuska 21 , Reference Johnson, Cooke and Croker 27 ). Johnson-Taylor et al. found that fewer overweight adults in the USA recognized they were overweight in 1999–2004 than in 1988–1994( Reference Johnson-Taylor, Fisher and Hubbard 16 ). Weight misperceptions increased significantly among adults with BMI of 25·0–27·4 kg/m2; however, there was no significant change among those with a BMI greater than 27·5 kg/m2. Johnson-Taylor and colleagues conclude that people’s ‘perception of a healthy weight is expanding to include those who are mildly overweight’( Reference Johnson-Taylor, Fisher and Hubbard 16 ). Consistent with this, Maynard et al. found that the average desired weight of US adults increased by 2·27 kg (5·1 lb) between 1994 and 2003.
To our knowledge, few studies have examined how trends in weight self-perceptions may have varied across social groups. The primary exception is Burke et al., who used NHANES data to investigate whether secular trends in weight self-perceptions were consistent between age groups( Reference Burke, Heiland and Nadler 17 ). Among women, those authors observed a decline in the tendency to self-classify as overweight that was concentrated among women aged 17–35 years. Among men, the decline in perceived overweight was consistent across age groups.
We believe it is important to examine the relationship between race/ethnicity and weight self-perceptions, as well as understand whether this relationship has changed over time. Racial/ethnic groups differ considerably in obesity rates, body image ideals and weight self-perceptions. Secular trends in overweight and obesity prevalence also differ by race/ethnicity, which may have caused concurrent changes in weight self-perceptions. In 1988–1994, a greater proportion of Mexican-American men than Black men were obese (23·1 % v. 21·3 %, respectively), but by 2007–2008 this pattern had reversed (to 35·9 % v. 37·3 %, respectively)( Reference Flegal, Carroll and Kuczmarski 1 , Reference Ogden, Carroll and Kit 3 ). Among women, increases in the prevalence of overweight and obesity that took place between 1976–1980 and 2007–2008 were greater among Whites than Blacks, but many more Black women were overweight or obese in both the earlier and later periods.
In the present study, we use NHANES data from 1988–1994 and 1999–2008 to examine racial/ethnic disparities in weight self-perceptions, as well as to understand how these disparities have changed over time. In particular, we examine secular trends among Whites, Blacks, US-born Mexican Americans and foreign-born Mexican Americans. Our hypothesis is that individuals in all racial/ethnic groups will be less likely to perceive themselves as overweight in the later period, largely because body sizes and obesity rates have increased. We further hypothesize that the magnitude of declines in the tendency to self-classify as overweight will vary between racial/ethnic groups, with larger declines among racial/ethnic minorities than among Whites. This latter hypothesis is based on the fact that overweight and obesity rates were higher among minorities than among Whites in 1988–1994, and in many cases have risen faster.
We stratify by nativity among Mexican Americans for several reasons. First, Mexican immigrants were typically raised in Mexico and may have different body image ideals than US-born Mexican Americans. Second, the obesity epidemic has been particularly pronounced in Mexico over the last several decades, with recent estimates suggesting the prevalence of obesity is now greater in Mexico than in the USA. We hypothesize that differences between the USA and Mexico, as well as social differences between native-born and immigrant populations, have likely affected body image ideals and weight self-perceptions. We do not stratify by nativity among Whites or Blacks primarily because the foreign-born make up a small proportion of these racial/ethnic groups within the NHANES sample and because nativity differences in weight self-perceptions (and many other outcomes) likely vary within racial/ethnic groups based on country of origin.
Methods
Data source
Data are from NHANES III (1988–1994) and continuous NHANES (1999–2008)( 28 ). NHANES began in the early 1960s as a series of studies designed to assess the health and nutritional status of adults and children in the USA. NHANES III was an autonomous study representative of the US population from 1988 to 1994. In 1999, NHANES became a continuous series of annual surveys. Public-use data for continuous NHANES are released in two-year data cycles that are each national probability samples of the US population during their respective years. In the current study, we use pooled NHANES data from two time periods: (i) 1988–1994 and (ii) 1999–2008.
In general, the study design employed by NHANES III is very similar to that employed by continuous NHANES. Each study is a stratified, multistage probability sample of the civilian non-institutionalized population in the USA. About fifteen counties are visited per year for both NHANES III and continuous NHANES. Counties are selected from strata defined by geography and proportions of minority populations. Further details on the sampling strategy and study design employed by NHANES are available elsewhere( 28 ).
Variables
We classify participants’ weight self-perceptions as ‘overweight’ or ‘not overweight’ based on a question asking, ‘Do you consider yourself now to be overweight, underweight, or about the right weight?’ For context, we report objectively measured BMI, the prevalence of overweight and obesity, participants’ desired weight loss and self-reported weight-loss attempts. We assess desired weight loss based on a question asking, ‘Would you like to weigh more, less, or stay about the same?’ We assess weight-loss attempts using a question that asks, ‘During the past 12 months, have you tried to lose weight?’ We classify participants’ race/ethnicity as White, Black, US-born Mexican American, immigrant Mexican American, other Latino or other.
Data analyses
We use the statistical software package Stata version 12 for all analyses. Our analytic sample includes 37 050 NHANES participants aged 18 years and older with complete data regarding their measured BMI, weight self-perceptions, race/ethnicity, nativity, age, gender, family income, educational attainment and marital status. To account for the complex survey design, we use Stata’s set of ‘svy’ commands and the sample weights and strata variables included in the NHANES public-use files.
To assess trends in weight self-perceptions and related outcomes, we present percentage distributions of categorical variables and means of continuous variables, stratified by race/ethnicity and NHANES time period. We use Stata’s ‘test’ command to assess the statistical significance of differences between survey periods based on adjusted Wald tests. P values refer to the null hypothesis that values are the same between the two NHANES time periods.
We use a series of gender- and race/ethnicity-specific logistic regression models to predict the relationship between BMI and weight self-perceptions within each time period. The independent variables in these unadjusted models are BMI, BMI2 and BMI3. We then use logistic regression to assess racial/ethnic variation in whether or not participants self-classify as overweight, after adjustment for age, marital status, educational attainment, annual household income, BMI and BMI2. In each model, we include a dummy variable to examine change in overweight self-perceptions between the earlier and later survey periods. We include interactions terms between the survey period dummy and race/ethnicity categories to assess change in racial/ethnic disparities between survey periods.
Results
We present sociodemographic characteristics of participants in NHANES III (1988–1994) and the 1999–2008 continuous NHANES in Table 1. Mean age increased from 43·5 years to 46·0 years across survey periods. In both survey periods, 52 % of the weighted sample was male and 48 % female. About two-thirds of the sample was married in both periods. In both survey periods, 13 % of the sample had an annual family income ≤100 % of the federal poverty level (FPL) and 21 % had family income between 101 and 200 % of the FPL. Educational attainment increased between survey periods: 24 % of participants in the 1988–1994 sample had less than a high-school education and 41 % had greater than a high-school education, compared with 19 % and 55 % in the 1999–2008 sample, respectively. Fewer participants in the later survey period had an annual family income between 201 % and 400 % of the FPL (30 % v. 39 % in the earlier period), but more had an income >400 % of the FPL (36 % v. 27 %). The racial/ethnic composition of the samples changed slightly across survey periods, with a lower proportion of White participants in the 1999–2008 sample and slightly more Mexican American, other Latino and ‘other/multi’ participants. Across periods, 74 % of participants were White, 11 % Black, 3 % US-born Mexican American, 4 % immigrant Mexican American, 5 % other Latinos and 4 % of another race/ethnicity or multiracial.
Descriptive statistics of the participants; US adults aged 18 years and older (n 37 050), National Health and Nutrition Examination Survey (NHANES)
FPL, federal poverty level.
† P values are based on a Wald test adjusted to account for the NHANES survey design.
In Table 2, we present weight-related outcomes among all participants and overweight and obese participants, stratified by survey period, gender and race/ethnicity. Between surveys, mean BMI increased for each gender and racial/ethnic group (P<0·001 for all groups). Among men, the prevalence of overweight (BMI≥25·0 kg/m2) increased within all racial/ethnic groups (P=0·014 for US-born Mexican Americans; P<0·001 for all other groups). Overweight prevalence also increased among women of all race/ethnicities (P=0·004 for Mexican immigrants; P<0·001 for all other groups). Mean BMI rose among overweight men of all racial/ethnic groups (P<0·001 for all groups), by an average of 1·2 kg/m2 between survey periods. Mean BMI also rose among overweight women of all racial/ethnic groups (P<0·001 for Whites and Blacks; P=0·005 among US-born Mexican Americans; P=0·009 among Mexican immigrants).
Weight-related outcomes among the participants; US adults aged 18 years and older (n 37 050), National Health and Nutrition Examination Survey (NHANES; data for 1988–1994 are from NHANES III and data for 1999–2008 are from continuous NHANES)
* Value was significantly different from that in the 1988–1994 survey period at P<0·001 level.
Despite significant increases in mean BMI and overweight prevalence among the full sample, as well as increased mean BMI among the overweight, the proportion of adults who perceived themselves as overweight was largely the same across survey periods. In other words, weight perceptions did not track with the increase in body sizes that occurred between the earlier and later time periods. There were no significant changes in weight self-perceptions among overweight men of any race/ethnicity. Similarly, there were no significant changes in weight self-perception among either US-born or immigrant Mexican-American women who were overweight. Furthermore, the percentage of overweight White and Black women who perceived themselves as overweight fell significantly between periods (P=0·038 and P=0·024, respectively).
Table 2 also includes weight preferences and self-reported weight-loss attempts in the previous year. Weight preferences vary considerably by gender and by race/ethnicity. For example, 78 % of White men in the 1999–2008 sample preferred to weigh less than their current weight, compared with 57 % of Black men, 75 % of US-born Mexican-American men and 57 % of Mexican immigrant men. Among overweight women in the 1999–2008 sample, 93 % of Whites preferred to weigh less, compared with 83 % of Blacks, 91 % of US-born Mexican Americans and 81 % of Mexican immigrants. These differences by gender and race/ethnicity were remarkably consistent across survey periods, with no significant changes between 1988–1994 and 1999–2008 for any group. The percentage of overweight participants who attempted to lose weight in the previous year also differed by gender and race/ethnicity. Significantly fewer overweight White and Black men attempted to lose weight in the earlier period (38 % and 32 %, respectively) than in the later period (44 % and 37 %, respectively; P<0·001 for Whites and P=0·03 for Blacks). There were no significant trends in weight-loss efforts among either group of Mexican-American men. Weight-loss efforts declined even more steeply among overweight White and Black women, from 67 % and 63 % in the earlier period, respectively, to 57 % and 52 % in the later period (P<0·001 for both groups).
In Fig. 1 we present a series of plots of the predicted probability that participants self-classified as overweight, based on a set of gender- and race/ethnicity-specific logistic regressions of weight perceptions on BMI, BMI2 and BMI3 (note that these regression models are unadjusted for factors unrelated to gender, race/ethnicity and BMI). The plots show the probability that an individual of a particular gender and race/ethnicity would self-classify as overweight at different BMI values. The plots show a number of interesting patterns. First, the ‘tipping point’ at which the majority of people perceive themselves as overweight (i.e. predicted probability >0·5) is several BMI points higher for men than women. Among Whites in the 1988–1994 sample, for example, this tipping point occurs at a BMI of approximately 26·0 kg/m2 for men and 22·5 kg/m2 for women. The plots also illustrate important differences in weight self-perceptions across racial/ethnic groups. Among White men in the earlier period, the tipping point occurs at a BMI of 26·0 kg/m2, compared with 28·0 kg/m2 for Blacks, 26·5 kg/m2 for US-born Mexican Americans and 27·9 kg/m2 for Mexican immigrants.
Predicted probability that participants perceive themselves as overweight based on BMI, BMI2 and BMI3 according to gender (a, c, e, g, men; b, d, f, h, women), race/ethnicity (a, b, White; c, d, Black; e, f, US-born Mexican American; g, h, immigrant Mexican American) and time period (![]() , 1988–1994;
, 1988–1994; ![]() , 1999–2008); US adults aged 18 years and older (n 37 050), National Health and Nutrition Examination Survey (NHANES; data for 1988–1994 are from NHANES III and data for 1999–2008 are from continuous NHANES)
, 1999–2008); US adults aged 18 years and older (n 37 050), National Health and Nutrition Examination Survey (NHANES; data for 1988–1994 are from NHANES III and data for 1999–2008 are from continuous NHANES)
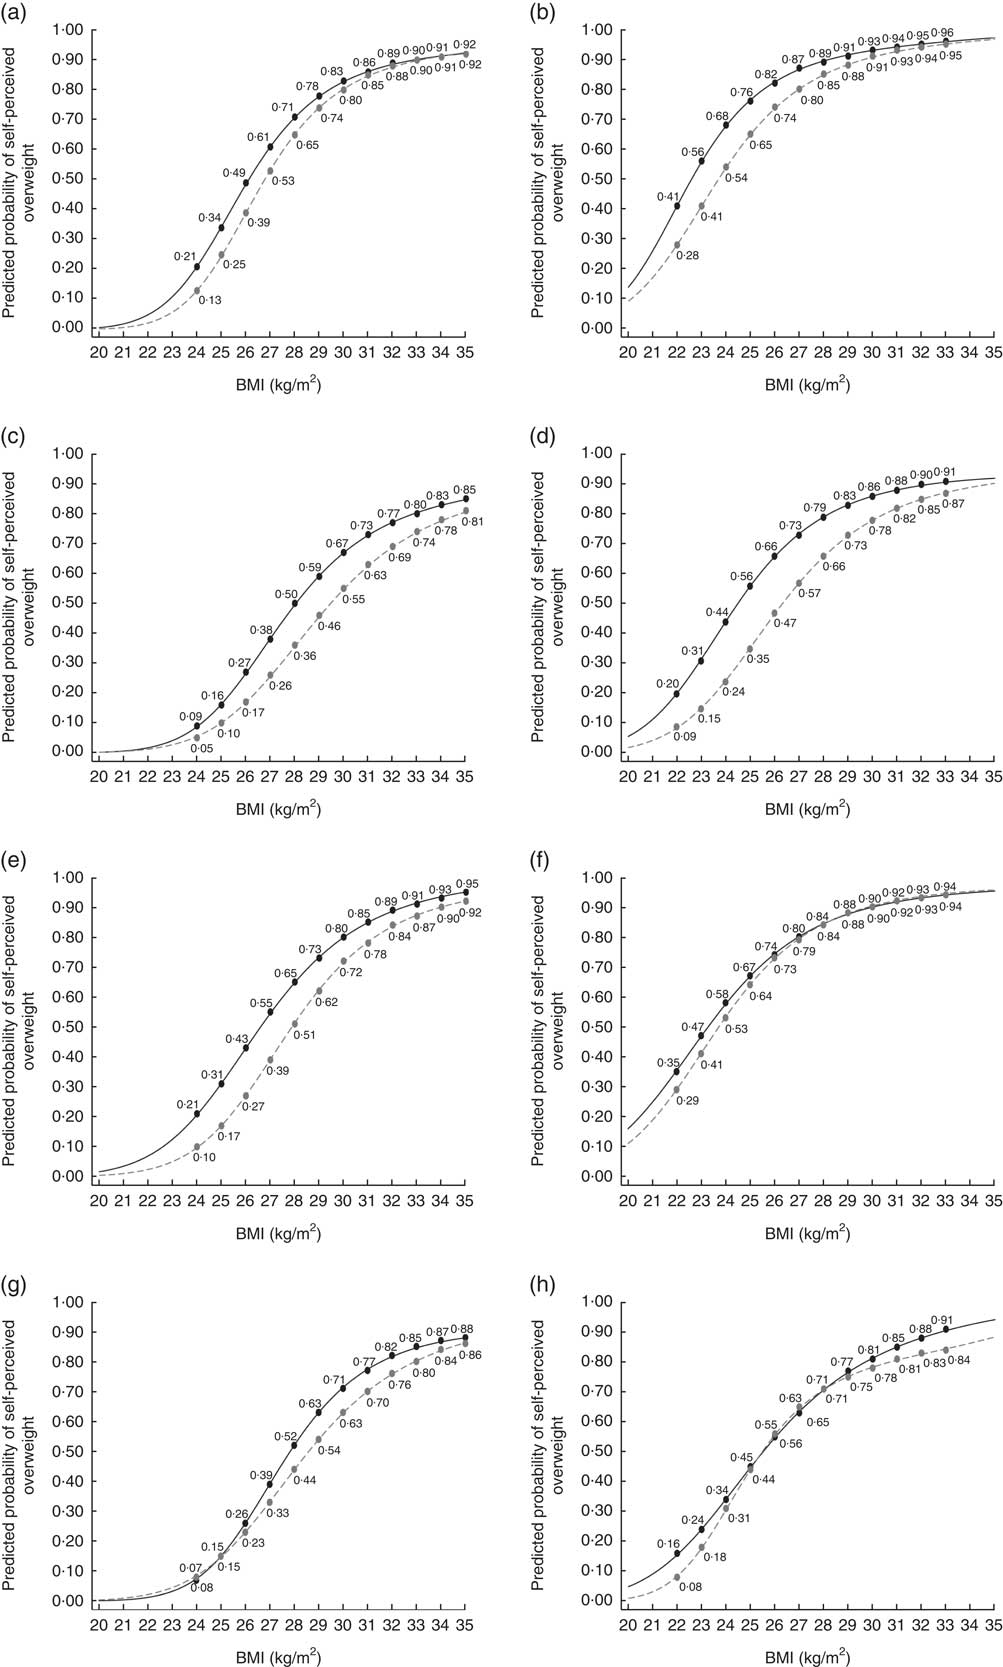
The plots in Fig. 1 also suggest that the largest changes in weight self-perceptions occurred at different points along the BMI spectrum based on gender and race/ethnicity. Among Black women, for example, the largest change in weight self-perceptions occurred at a BMI of 25·0 kg/m2, with 56 % perceiving themselves as overweight or obese in 1988–1994, compared with 35 % in 1999–2008. Among White women, the largest decline in the probability of self-classifying as overweight occurred at BMI of 23·0 kg/m2, falling from 56 % in 1988–1994 to 41 % in 1999–2008. Among every other group, the largest declines were concentrated among those with BMI in the overweight category, ranging from 25·0 kg/m2 among Black women to 29·0 kg/m2 among Mexican immigrant men. In general, declines in the probability of self-classifying as overweight were centred among people who were moderately overweight, but substantial shifts also took place among those in the normal weight range. The primary exceptions were White women, among whom the greatest shifts were in the ‘normal’ range, and Mexican immigrant men and Black men, among whom shifts were almost entirely among the overweight and obese.
In general, there were at least small declines in overweight perceptions among most groups, with particularly large declines among Black women, Black men and US-born Mexican-American men. The major exception is that there was little or no shift in weight self-perceptions among US-born Mexican-American women or Mexican immigrant women. To facilitate comparison of trends in weight self-perceptions across racial/ethnic groups, in Table 3 we present the same results at specific BMI points. These results are based on the same predicted probabilities presented in Fig. 1 and are from a set of gender- and race/ethnicity-specific logistic regressions of weight perceptions on BMI, BMI2, and BMI3. The results suggest declines in the probability of self-classifying as overweight were larger among Black men and women than their White counterparts, particularly at BMI of 27·0 and 30·0 kg/m2.
Predicted probability that participants at specific BMI points perceive themselves as overweight based on gender- and race/ethnicity-specific regressions of overweight self-perceptions on BMI, BMI2 and BMI3; US adults aged 18 years and older (n 37 050), National Health and Nutrition Examination Survey (NHANES; data for 1988–1994 are from NHANES III and data for 1999–2008 are from continuous NHANES)
We use multivariate logistic regression to investigate whether trends in weight self-perceptions can be explained by shifting demographics or other social factors that may have changed between social periods (Table 4). The table includes separate regressions for the following groups: (i) all men; (ii) overweight and obese men; (iii) all women; and (iv) overweight and obese women. We include regressions specifically for the overweight and obese since, from a clinical perspective, the accuracy of perceiving oneself as overweight differs by BMI. Our results suggest that weight self-perceptions are associated with several sociodemographic factors. After adjustment for other factors, additional age is associated with a decrease in the likelihood of perceiving oneself as overweight. Similarly, adults who have never been married are less likely than their married counterparts to self-classify as overweight. In contrast, both educational attainment and household income are positively associated with overweight self-perceptions. Even after adjustment for sociodemographics and BMI, the odds of self-classifying as overweight fell significantly between survey periods among all men (P<0·001), overweight and obese men (P<0·01), all women (P<0·001) and overweight and obese women (P<0·001). Racial/ethnic differences in weight perceptions persist after adjustment for other factors. Furthermore, the interaction terms suggest that disparities in weight-self perceptions between Whites and Blacks grew between survey periods (P<0·05 for all Black men, obese Black men and all Black women). In contrast, disparities in weight self-perceptions between overweight and obese White women and overweight and obese Mexican immigrant women decreased between survey periods.
Logistic regression models predicting self-perceived overweight status among the participants; US adults aged 18 years and older (n 37 050), National Health and Nutrition Examination Survey (NHANES), 1988–1994 and 1999–2008
FPL, federal poverty level; Ref., referent category.
*P<0·05, **P<0·01, ***P<0·001.
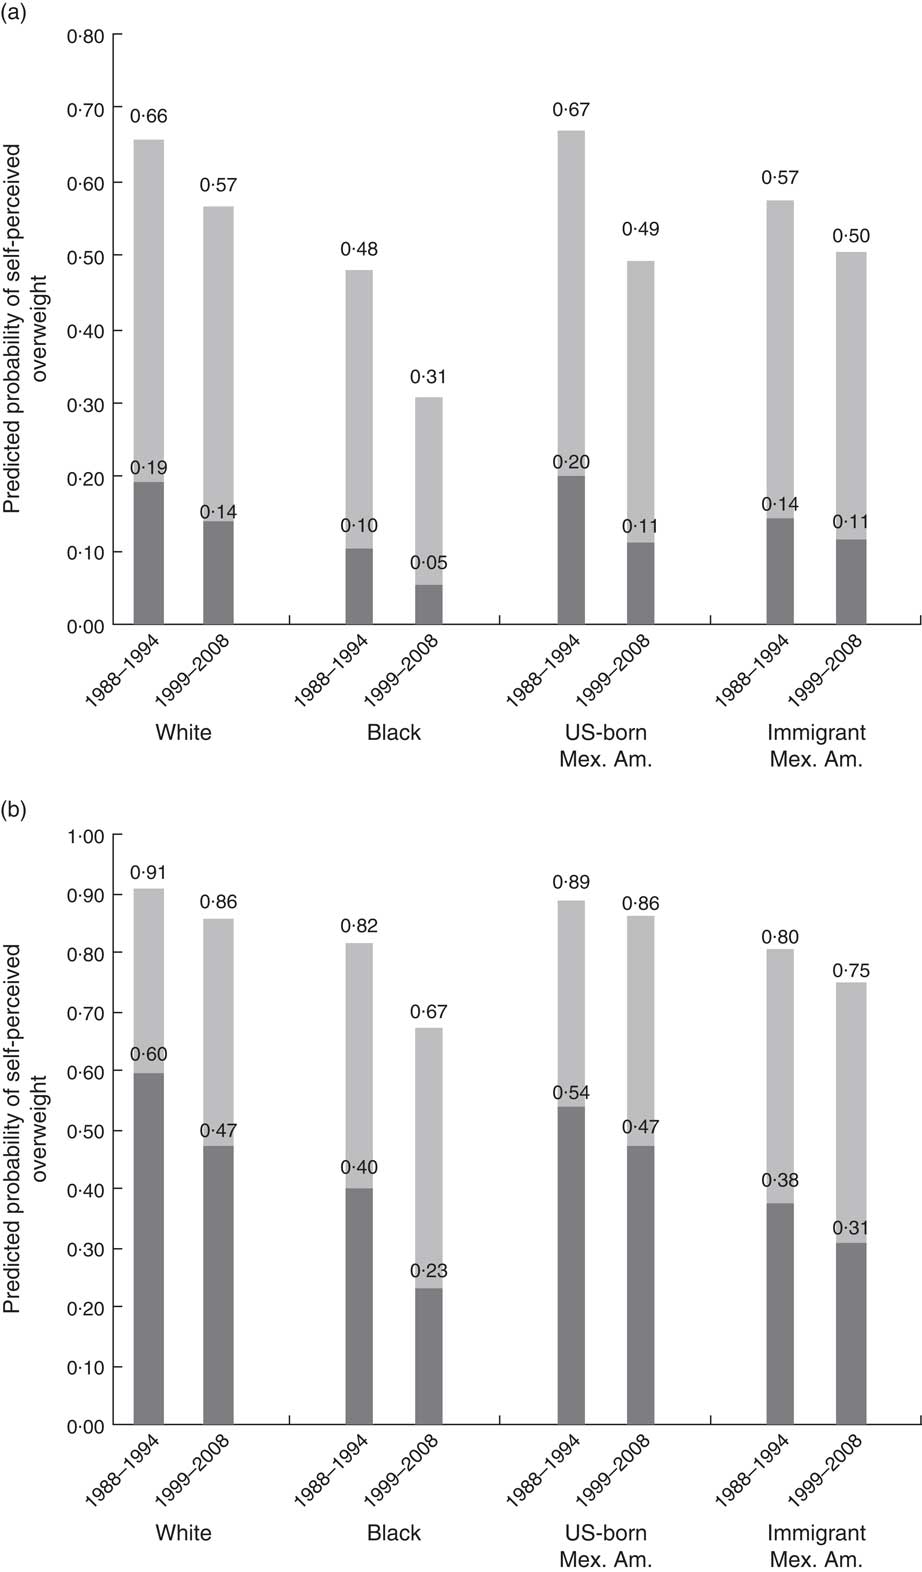
To facilitate interpretation, we use the logistic regression models for ‘all men’ and ‘all women’ in Table 4 to predict the probability that ‘typical’ individuals will self-classify as overweight. These predicted probabilities (Fig. 2) are based on a 45-year-old, married individual with income >400 % of the FPL and more than a high-school education. Consistent with the approach of Burke et al., we present predictions for individuals in the ‘normal weight’ category (BMI=23·0 kg/m2) and those in the ‘overweight’ category (BMI=27·0 kg/m2). The predictions demonstrate that declines in overweight perceptions were not consistent across genders and racial/ethnic groups. In particular, overweight perceptions declined much more sharply among Black men and US-born Mexican-American men than among White men. A similar pattern held for Black women relative to White women, but not for US-born or immigrant Mexican-American women.
Predicted probability that participants perceive themselves as overweight, based on multivariate logistic regression models in Table 2, according to gender (a, men; b, women), race/ethnicity (Mex. Am., Mexican American), time period and BMI (![]() , BMI=27 kg/m2;
, BMI=27 kg/m2; ![]() , BMI=23 kg/m2); US adults aged 18 years and older (n 37 050), National Health and Nutrition Examination Survey (NHANES; data for 1988–1994 are from NHANES III and data for 1999–2008 are from continuous NHANES)
, BMI=23 kg/m2); US adults aged 18 years and older (n 37 050), National Health and Nutrition Examination Survey (NHANES; data for 1988–1994 are from NHANES III and data for 1999–2008 are from continuous NHANES)
Discussion
The present study has contributed in several ways to our understanding of racial/ethnic disparities in weight self-perceptions. Consistent with previous research, we found that people with higher income and greater educational attainment are more likely to perceive themselves as overweight, however older people are less likely to perceive themselves as overweight( Reference Chang and Christakis 14 , Reference Paeratakul, White and Williamson 15 ). We also found that weight perceptions are significantly associated with marital status among our full sample of both men and women. This is somewhat different from the findings of Chang and Christakis, who found that marital status affected weight perceptions only among men( Reference Chang and Christakis 14 ).
We also found that weight self-perceptions changed over time and that these changes were not consistent across racial/ethnic groups, genders, or between US-born Mexican Americans and their immigrant counterparts. In general, we found that the likelihood of self-classifying as overweight declined between 1988–1994 and 1999–2008. This finding is consistent with the limited previous research that has examined trends in weight self-perceptions( Reference Johnson-Taylor, Fisher and Hubbard 16 , Reference Burke, Heiland and Nadler 17 , Reference Johnson, Cooke and Croker 27 ). We agree with other authors who have speculated that changes in weight perceptions are likely an indicator of shifting social norms that reflect the rise in overweight and obesity that has occurred over the last several decades( Reference Johnson-Taylor, Fisher and Hubbard 16 , Reference Maynard, Serdula and Galuska 21 ). As overweight and obesity have increased, the body types that people see in their daily lives and in the media have likely also changed. People likely view larger body types as more normative and socially acceptable than in the past. In support of this conclusion, Maynard et al. found that the average desired weight of adults increased by 2·27 kg (5·1 lb) between 1994 and 2003( Reference Maynard, Serdula and Galuska 21 ).
A novel finding of our study is that disparities in weight self-perceptions, particularly between Whites and Blacks, seem to have widened over time. In the earlier survey period, Black males and females were less likely to perceive themselves as overweight than Whites of the same BMI. Both groups experienced a downward shift in overweight self-perceptions between survey periods, but this shift was more pronounced among Blacks and took place over a wider range of BMI values. The result was widening disparities, particularly at higher BMI values (i.e. between approximately 28·0 and 32·0 kg/m2 among men and 25·0 and 30·0 kg/m2 among women). For example, our BMI curves suggest that 73 % of Black men and 83 % of White men with BMI of 31·0 kg/m2 would have classified themselves as overweight in 1988–1994, compared with 63 % and 80 %, respectively, in 1999–2008.
Another important finding of our study is that weight self-perceptions differed considerably between US-born and immigrant Mexican Americans. Immigrants of both genders were less likely to self-classify as overweight, a pattern that was consistent across BMI values. We believe this may be due to different social norms related to body image and weight between the USA and Mexico. Research in different countries suggests that perceptions of healthy and attractive body types vary widely between societies( Reference Swami, Caprario and Tovée 29 – Reference Cogan, Bhalla and Sefa-Dedeh 31 ), while research in Mexico suggests that larger body sizes are often seen as healthy and desirable( Reference Guendelman, Fernald and Neufeld 32 ). We believe that an important area for future research will be to continue to track trends in weight self-perceptions among US-born and immigrant Mexican Americans, because social norms, body image ideals and weight self-perceptions will likely change in response to the obesity epidemic among Mexican-origin populations in both countries.
The high prevalence of weight status misperception among overweight and obese participants in the present study, as well as the large and widening disparities between some racial/ethnic groups, highlights the need for improvements in knowledge regarding healthy weight and healthy body types. One way to do this may be through patient–provider interactions. For example, Pool et al. found that overweight and obese adults were nearly twice as likely to report significant weight loss in the previous year if their health-care provider told them they were overweight( Reference Pool, Kraschnewski and Cover 33 ). Our findings suggest that such an approach would benefit the population as a whole, since weight misperception is common across all racial/ethnic groups and both genders, and may have particular benefit among racial/ethnic minorities.
There are several important limitations of the present study. NHANES data are cross-sectional, making it impossible to establish causality in the relationship between changes in BMI and overweight prevalence and concurrent changes in weight self-perceptions. Similarly, the observed trends in weight-self-perceptions may have been caused by time-varying covariates that were unobserved in our study. Even if this is the case, we believe our findings are important because they highlight the need for us to further examine causal mechanisms that have caused weight self-perceptions to change over time. NHANES III and continuous NHANES were not meant to be combined in one analysis, and doing so may have introduced some level of bias to our multivariate results (i.e. Table 4). Similarly, the NHANES sample weights were not intended to be used in the exact way that we used them. We do not believe, however, that pooling NHANES waves is a fatal flaw: we conducted sensitivity analyses with the unweighted sample that returned very similar multivariate results. The present study also has strengths. One is our use of large, national data sets that included large minority samples and multiple time points. A further strength is that NHANES III and continuous NHANES collected objectively measured height and weight data and assessed weight self-perceptions using the same protocol and instruments. This is important, because it reduces the likelihood that differences between surveys, which we attribute to changes over time, are ‘data artifacts’ caused by changes in study protocol.
Conclusion
We have presented evidence that weight self-perceptions have changed over time. These trends were not consistent between men and women or across racial/ethnic groups, which in some cases resulted in widening of disparities in weight self-perceptions. Further research is necessary to understand how changes in weight self-perceptions and social norms may affect weight outcomes and weight management.
Acknowledgements
Acknowledgements: The authors thank Carol S. Aneshensel for her substantial contributions to the theory and methodology of this paper. Financial support: This work was supported by National Heart, Lung, and Blood Institute (all authors, grant number 5P50HL105188), (B.A.L., grant number 1F31HL116109). The National Heart, Lung, and Blood Institute had no role in the design, analysis or writing of this article. Conflict of interest: None. Authorship: B.A.L. conceptualized the study, conducted the analyses and drafted the manuscript. D.G., A.N.O. and M.L.P. helped draft the manuscript. Ethics of human subject participation: Data for this study are from the de-identified, public-use data files available for download on the website of the National Center for Health Statistics.


