


INTRODUCTION
Sedimentary deposits frozen continuously in permafrost since the Pleistocene preserve important evidence for climate and environmental change and for the interchange of flora and fauna between Eurasia and the Americas. They also help us to evaluate the stability of permafrost and its resilience to Earth system change over the course of the Pleistocene. Ancient permafrost, however, is difficult to date, because its components (mineral particles, ice, organic remains, and liquid water) experience complex histories of warming and cooling and deposition and freezing by different processes and at various depths and times and—in the case of organic remains—often preserve exceptionally well before reworking and refreezing, resulting in ages that are anomalously old relative to the depositional age of the sediment. Such complexities must be considered carefully when dating the time of permafrost formation or thaw or the minimum age of permafrost preserved in the geologic record.
Dating of Pleistocene permafrost beyond the range of radiocarbon dating is challenging, though several promising methods have been applied. Radiocarbon dating of organic material incrementally buried in aggrading sedimentary sequences has provided some relatively robust chronologies of up to ~40–50 ka for syngenetic (upward) permafrost growth (e.g., Wetterich et al., Reference Wetterich, Tumskoy, Rudaya, Andreev, Opel, Meyer and Schirrmeister2014; Murton et al., Reference Murton, Goslar, Edwards, Bateman, Danilov, Savvinov, Gubin, Ghaleb, Haile, Kanevskiy, Lozhkin, Lupachev, Murton, Shur, Tikhonov, Vasil'chuk, Vasil'chuk and Wolfe2015). Beyond this age range, methods applied to date permafrost include optically and infrared-stimulated luminescence dating of sand and silt (e.g., Demuro et al., Reference Demuro, Arnold, Froese and Roberts2013; Opel et al., Reference Opel, Wetterich, Meyer, Dereviagin, Fuchs and Schirrmeister2017) back to ~210 ka (Ashastina et al., Reference Ashastina, Schirrmeister, Fuchs and Kienast2017), radioisotope disequilibria (230Th/234U) of frozen peat to ~220 ka (Wetterich et al., Reference Wetterich, Tumskoy, Rudaya, Kuznetsov, Maksimov, Opel, Meyer, Andreev and Schirrmeister2016, Reference Wetterich, Rudaya, Kuznetsov, Maksimov, Opel, Meyer, Günther, Bobrov, Raschke, Zimmermann, Strauss, Fuchs and Schirrmeister2019), uranium isotope (234U/238U) series of ground ice to ~200 ka (Ewing et al., Reference Ewing, Paces, O'Donnell, Jorgenson, Kanevskiy, Aiken, Shur, Harden and Striegl2015), and palaeomagnetic analysis of silty to sandy deposits to ~200 ka (Andreev et al., Reference Andreev, Grosse, Schirrmeister, Kuzmina, Novenko, Bobrov and Tarasov2004). Still older ages of ~610 ka have been obtained from 36Cl/Cl ratios of ground ice (Blinov et al., Reference Blinov, Alfimov, Beer, Gilichinsky, Schirrmeister, Kholodov, Nikolskiy, Opel, Tikhomirov and Wetterich2009), and ~740 ka from fission track dating of tephra above ground ice (e.g., Froese et al., Reference Froese, Westgate, Reyes, Enkin and Preece2008; Davies et al., Reference Davies, Jensen, Froese and Wallace2016). Nonetheless, some of these applications of dating methods are in early stages of development, and calculated ages have large uncertainties. Moreover, increasingly old permafrost deposits are rare (due to erosion and/or thaw) or tend to be deeply buried. Overall, therefore, information about the age, nature, and distribution of permafrost preserved since before the last interglaciation (~132–117 ka)—that is, ancient permafrost—is scarce.
Here, we determine the age of ancient permafrost at the Batagay megaslump, east Siberia, in a multimethod dating study. The slump headwall exposes four generations of ice wedges and sand–ice (composite) wedges that formed synchronously with permafrost growth and two woody beds that represent the remains of two episodes of taiga forest development before the modern Holocene forest. Thus, the ancient permafrost at Batagay potentially provides one of the longest—but discontinuous—terrestrial records of Pleistocene environments in western Beringia (east Siberia). We report results from optically stimulated luminescence (OSL) dating of quartz grains and post-infrared infrared (pIRIR) luminescence dating of K-feldspar grains from aeolian sand that has remained continuously frozen since ice wedges formed concurrently with deposition (syngenetically). Additionally, we use radiocarbon methods to date organic macroremains from ice wedges and host sediments and provide a starting point (base age) for 36Cl/Cl dating of the wedge ice itself. Both 36Cl/Cl and radiocarbon dating methods take advantage of accelerator mass spectrometry (AMS). This study builds on earlier work at the Batagay megaslump (Ashastina et al., Reference Ashastina, Schirrmeister, Fuchs and Kienast2017; Murton et al., Reference Murton, Edwards, Lozhkin, Anderson, Savvinov, Bakulina and Bondarenko2017b; Opel et al., Reference Opel, Murton, Wetterich, Meyer, Ashastina, Günther and Grotheer2019; Vasil'chuk and Vasil'chuk, Reference Vasil'chuk and Vasil'chuk2019; Vasil'chuk et al., Reference Vasil'chuk, Vasil'chuk, Budantseva and Vasil'chuk2020) and integrates all available dating results for the permafrost sequence exposed there. The aims of this study are (1) to test several independent methods for dating of ancient permafrost, (2) to develop a suitable multimethod framework to date the ancient permafrost deposits at the Batagay megaslump, and (3) to improve the chronological constraints for the latter. Additionally, we provide the first application of 36Cl/Cl dating of ground ice with independent testing of ages using other dating methods. Our study provides the framework for planning future, systematic dating of the site.
STUDY SITE
The Batagay megaslump (67.58°N, 134.77°E) is the largest known retrogressive thaw slump in the world, measuring ~1.8 km long and >0.8 km wide in 2019. The slump has developed over the past five decades and was first studied in 2011 (Kunitskiy et al., Reference Kunitsky, Syromyatnikov, Schirrmeister, Skachov, Grosse, Wetterich and Grigoriev2013). It is located on a hillslope at an elevation of ~330 m above sea level (for the highest part of the headwall), near the town of Batagay, in the Yana Highlands of northern Yakutia (Fig. 1). This region is characterized by a strongly continental climate and increasing temperature and precipitation since the mid-twentieth century. At Batagay, the mean annual air temperature over the period 1988–2017 was −12.4°C, with a mean winter (December to February) air temperature of −40.0°C and a mean summer (June to August) air temperature of 13.7°C (Murton et al., Reference Murton, Savvinov, Opel, Panin and Romanenkoin press). About half of the mean annual precipitation of 203 mm (i.e., 106 mm) falls in summer. The permafrost is continuous and ~200 to 500 m thick (fig. 15.2 in Yershov, Reference Yershov1998), with mean annual ground temperatures of −8.0°C to −5.5°C and active-layer thicknesses between 0.2 and 1.2 m, depending on soil and vegetation types (Ivanova, Reference Ivanova, Phillips, Springman and Arenson2003).
(a) Location map of Beringia. Red dashed box shows location of panel b. (b) Location map showing the topographic setting of the Batagay megaslump within the Yana River basin, northern Yakutia. Glacial limits during the last (Sartan) glaciation, according to Glushkova (Reference Glushkova, Ehlers, Gibbard and Hughes2011), are indicated. Red dashed box shows location of panel c. (c) Topographic map of the Batagay region, showing the location of the megaslump on a northeast-facing hillslope. Contours at 20 m intervals; grid spacing at 4 km.

The vegetation near Batagay comprises mainly open woodlands dominated by Cajander larch (Larix cajanderi) with birch (Betula exilis or Betula divaricata) undergrowth and a lichen–green moss ground cover. Birch (Betula pendula) occurs in some burnt areas. Higher upland areas are typically covered by thickets of dwarf stone pine (Pinus pumila), mountain tundra, or stony debris. Permafrost podburs are the most common soil type beneath open woodlands of larch, and underdeveloped stony soils characterize rubbly mountain areas. Peaty and humus–gley soils underlie the bottoms of small river valleys, whereas the terraced floodplains of the Yana and Batagay rivers contain underdeveloped sandy soils and alluvial permafrost soils.
In palaeoenvironmental terms, the study region has probably remained unglaciated throughout the late Cenozoic (Batchelor et al., Reference Batchelor, Margold, Krapp, Murton, Dalton, Gibbard, Stokes, Murton and Manica2019) and belonged to the ice-free subcontinent of Beringia (Fig. 1a). A sequence of permafrost deposits about 60 m thick crops out in the slump and can be divided into seven stratigraphic units (Fig. 2; Table 1) and summarised as follows. Above slate bedrock is (1) a diamicton at least 0.5 m thick, containing abundant clasts of slate, that is interpreted as colluvium. The overlying (2) lower ice complex (~3–7 m thick) contains woody material—including in situ tree stumps as well as woody debris related to erosional features within the ice complex—and ice wedges at least 2–3 m high and 1 m wide truncated along their tops by a thaw unconformity. There are also traces of an erosional surface overlain by gravelly deposits along the top of this unit. The woody material is thought to represent the remains of a forest bed. Above the lower ice complex, (3) a lower sand unit (≤20 m thick) of pore-ice-cemented fine sand interpreted as aeolian sand-sheet deposits contains tall, narrow syngenetic ice wedges and composite wedges up to 0.5 m wide. In places, (4) prominent lenses of woody debris (≤3 m thick) sharply overlie the lower sand unit below a prominent disconformity (erosional surface). The woody debris is interpreted as a second forest bed and is overlain by few metres of sand at the base of (5) an upper ice complex (~20–25 m thick) dominated by large syngenetic ice wedges up to a few metres wide and at least several metres high set within silty and sandy deposits. The upper ice complex probably formed as a result of a substantial increase in snow meltwater supply into thermal contraction cracks relative to the limited water supply to the narrow wedges in the lower sand unit. The upper ice complex plunges downslope beneath and partly grades into (6) the upper sand unit (~20–30 m thick, and similar in nature and interpretation to the lower one), which is best exposed near the slump exit. Capping the sequence is (7) a near-surface layer of brown sand and modern soil (~1–3 m thick).
(a) Panoramic photograph of the Batagay megaslump showing the main stratigraphic units and locations of sections 1 and 2. (b) Schematic stratigraphic section of the exposed units along the slump headwall, with approximate positions of the studied sections. Numbers 2 to 6 represent cryostratigraphic units summarised in Table 1. Modified from Opel et al. (Reference Opel, Murton, Wetterich, Meyer, Ashastina, Günther and Grotheer2019).

Stratigraphic units of the permafrost sequence exposed in the Batagay megaslump.a

a Based on Ashastina et al. (Reference Ashastina, Schirrmeister, Fuchs and Kienast2017), Murton et al. (Reference Murton, Edwards, Lozhkin, Anderson, Savvinov, Bakulina and Bondarenko2017b), Opel et al. (Reference Opel, Murton, Wetterich, Meyer, Ashastina, Günther and Grotheer2019), Vasil'chuk and Vasil'chuk (Reference Vasil'chuk and Vasil'chuk2019), Vasil'chuk et al. (Reference Vasil'chuk, Vasil'chuk, Budantseva and Vasil'chuk2020), and field observations in spring 2019.
b IRSL, infrared-stimulated luminescence; OSL, optically stimulated luminescence; n/a, not analysed.
c MIS, Marine Isotope Stage.
METHODS AND DATA
Fieldwork
Sediment and ground-ice samples for dating in the present study were taken during fieldwork in summer 2017 based on cryostratigraphic observations that largely confirm earlier interpretations (Ashastina et al., Reference Ashastina, Schirrmeister, Fuchs and Kienast2017, Reference Ashastina, Kuzmina, Rudaya, Troeva, Schoch, Römermann and Reinecke2018; Murton et al., Reference Murton, Edwards, Lozhkin, Anderson, Savvinov, Bakulina and Bondarenko2017b). We focused on sampling at two sections in different parts of the exposure (Fig. 2): (1) the contact of the lower ice complex to the lower sand in a gully of the icy badlands on the slump bottom (section 1, Fig. 3) and (2) the upper ice complex and the upper sand in a headwall slope in the southern part of the slump (section 2, Fig. 4).
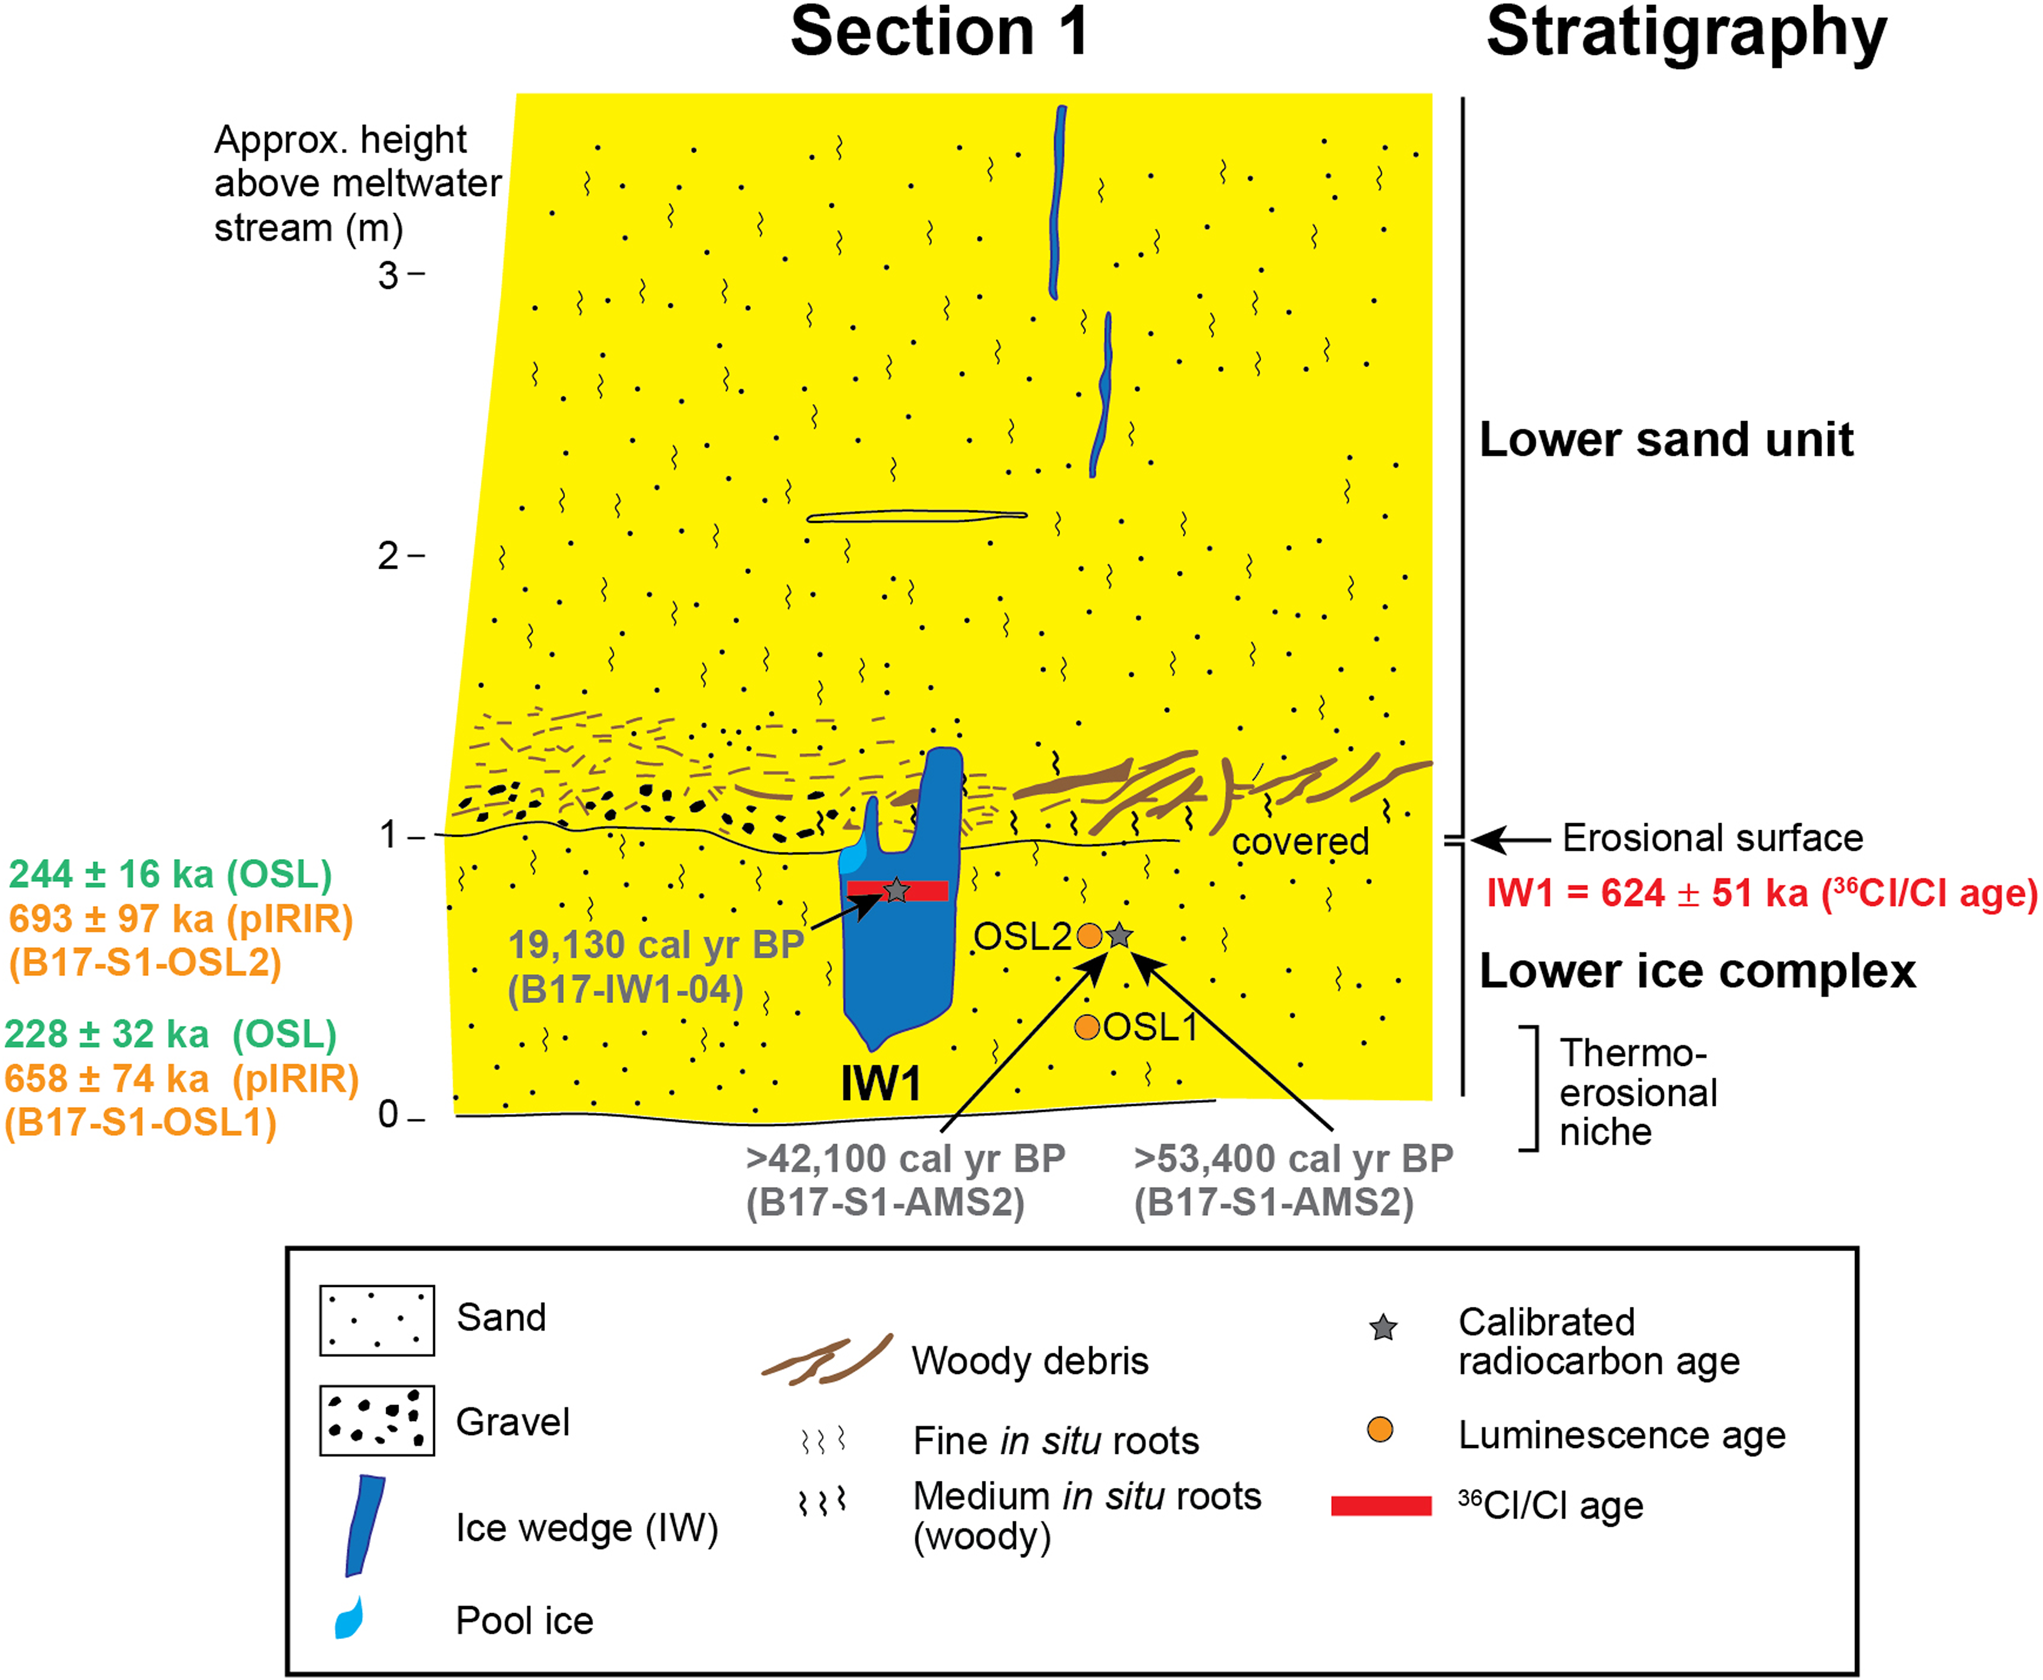
Schematic cryostratigraphic sketch of section 1, showing age estimates. Radiocarbon ages are given as calibrated median ages where available or otherwise as uncalibrated ages (see Table 5). The post-infrared infrared-stimulated luminescence (pIRIR) and optically stimulated luminescence (OSL) ages are associated with the orange circles labelled “OSL1” and “OSL2.”
Schematic cryostratigraphic sketch of section 2, showing age estimates. Radiocarbon ages are given as calibrated median ages where available or otherwise as uncalibrated ages (see Table 5). The post-infrared infrared-stimulated luminescence (pIRIR) and optically stimulated luminescence (OSL) ages are associated with the orange circles labelled “OSL3” to “OSL7.”

Samples for luminescence dating (n = 7) were taken from freshly thawed undisturbed sediments using a metal cylinder. The samples were immediately shielded from sunlight, tightly sealed, and stored cool until analysis. We additionally sampled the frozen sediments for analysis of radionuclide concentrations by gamma spectrometry and for measurements of ice content. We sampled ice wedges for 36Cl/Cl dating (n = 4) by chainsaw. In total, we cut ~2 kg of ice and stored it cool in sample bags. After melting the ice, we filled two 1 L low-density polyethylene bottles with the meltwater and kept them cool until analysis. Organic macroremains were picked from sediment and wedge-ice samples for radiocarbon dating (n = 12; Opel et al., Reference Opel, Murton, Wetterich, Meyer, Ashastina, Günther and Grotheer2019; this study).
Luminescence dating
In luminescence dating, age estimates of the time of sedimentation (Huntley et al., Reference Huntley, Godfrey-Smith and Thewalt1985) are premised upon reduction of the time-dependent signal in minerals (OSL) to zero through exposure to sunlight. Once sediment is buried, the OSL signal accrues through exposure to natural litho- and cosmogenic radiation. The total burial dose related to the observed luminescence signal intensity is found by estimating the dose of laboratory radiation (equivalent dose) that produces luminescence equal to that measured from the sample of interest. Based on this dose-luminescence response relationship, the dosimeter (typically quartz and feldspar) can then be converted to a chronometer by estimating the rate of dose absorption. The luminescence age is generally defined by the quotient:

General accounts of the method can be found in, for example, Aitken (Reference Aitken1998) and Bøtter-Jensen et al. (Reference Bøtter-Jensen, McKeever and Wintle2003). Quartz is typically the mineral of choice in OSL dating, owing principally to the temporal stability of its luminescence signal and rapid resetting of this signal by sunlight during sediment transport before deposition (e.g., Wallinga, Reference Wallinga2008; Wintle, Reference Wintle2008). However, saturation of the quartz signal usually limits its application to samples with burial doses of <200 Gy (Wintle, Reference Wintle2008) and thus restricts the maximum datable age to 100–200 ka (assuming a Dr range of 2 to 1 Gy/ka, respectively). Feldspars saturate at higher doses compared with quartz, but anomalous fading of their infrared-stimulated luminescence (IRSL) signal (Wintle, Reference Wintle1973; Huntley and Lamothe, Reference Huntley and Lamothe2001) has complicated the use of these minerals due to the need for additional corrections (e.g., Auclair et al., Reference Auclair, Lamothe and Huot2003; Kars et al., Reference Kars, Wallinga and Cohen2008). Because the anomalous fading rate displayed dose-dependent behaviour (e.g., Li and Li, Reference Li and Li2008), overestimation was reported for corrected ages, especially in older samples (e.g., Li and Li, Reference Li and Li2011). However, the discovery of an IR signal with significantly reduced fading in K-feldspars (pIRIR; Thomsen et al., Reference Thomsen, Murray, Jain and Botter-Jensen2008) and the subsequent development of measurement protocols (e.g., Buylaert et al., Reference Buylaert, Murray, Thomsen and Jain2009; Li et al., Reference Li, Roberts, Jacobs and Li2014b) have recently encouraged wider adoption of these minerals and provide the potential to date samples with burial doses of up to 1500 Gy (e.g., Wintle, Reference Wintle2008; Zhang and Li, Reference Zhang and Li2020). Given the Dr values present at the site (~2–3 Gy/ka; Table 2) and the potential for quartz samples at depth to be close to saturation, we adopted a paired quartz OSL and K-feldspar pIRIR approach to luminescence dating.
Dose-rate parameters from 125–180 μm quartz and K-feldspar isolates for luminescence dating.

a Cosmic dose rate for ~68°N, 135°E, 300 m above sea level.
Sample preparation
Luminescence samples were prepared and measured in the Luminescence Dating Laboratory, University of Gloucestershire. To preclude optical erosion of the signal, the sediment samples were collected in opaque tubing and processed under controlled laboratory illumination provided by Encapsulite RB-10 (red) filters. The fine-sand fraction (125–180 μm) of six samples was segregated and subjected to acid and alkaline digestion (10% HCl, 15% H2O2) to remove carbonate and organic components, respectively. Density separations at 2.53 and 2.58 g/cm3 were undertaken to isolate the K-feldspar fraction. Minerals >2.58 g/cm3 were then subjected to an HF acid digestion (40%, 60 min) to etch the outer 10–15 μm layer affected by alpha radiation; 10% HCl was then added to remove acid-soluble fluorides, and the sample was then dried and resieved. Quartz was concentrated from the remaining heavy-mineral fraction using a density separation at 2.68 g/cm3. Sample mass proved a constraint in this study, with a dry mass of ~450 g yielding ~70 mg to, exceptionally, 250 mg of each mineral type within the modal sand fraction (125–180 μm). Depending on the mass remaining after sample preparation, up to 12 multigrain 8 mm aliquots of quartz and K-feldspar were mounted on stainless-steel cups and aluminium discs, respectively, to determine De values. Owing to limited quantities of quartz and K-feldspar, sample GL17121 was not progressed to De measurement. Given the magnitude of De values above 120 Gy, and thus the relatively old ages previously reported for the site by Ashastina et al. (Reference Ashastina, Schirrmeister, Fuchs and Kienast2017), intergrain analysis using single-grain or small aliquots was not considered of utility in this study. In this it is assumed that intergrain De distribution is dominated by microdosimetric effects, with the passage of time serving to amplify the influence of spatial variations in dose rate over De variation forced by partial bleaching and pedoturbation. Bulk subsamples for Dr assessment were homogenized in a mill, with 50 g then placed in a polystyrene pot with a polyethylene lid and stored for 3 weeks to enable radon stabilisation.
Measurement
Quartz and feldspar naturally exhibit marked intersample variability in luminescence per unit dose (sensitivity). Therefore, the estimation of dose absorbed since burial requires calibration of the natural signal using known doses of laboratory radiation. De values were quantified using a single-aliquot regenerative-dose (SAR) protocol based on Murray and Wintle (Reference Murray and Wintle2000, Reference Murray and Wintle2003) for quartz and Li et al. (Reference Li, Roberts, Jacobs and Li2014b) for K-feldspar. In the case of quartz, this was facilitated by a Freiberg Instruments Lexsyg Smart irradiation-stimulation-detection system (Richter et al., Reference Richter, Richter and Dornich2015). The quartz was stimulated at 445 ± 3 nm and 80 mW/cm2 by blue laser diodes combined with 3 mm Schott GG420 and HC448/20 filters in front of each diode. Quartz was held at ~125°C (105°C substrate temperature) during optical stimulation to preclude charge retrapping within the 110°C TL trap (Murray and Wintle, Reference Murray and Wintle2000, Reference Murray and Wintle2003). IR stimulation, provided by IR laser diodes stimulating at 850 ± 3 nm filtered by 3 mm RG 715 and delivering ~ 200 mW/cm2 to the sample, was used to detect feldspar contamination (Hütt et al., Reference Hütt, Jaek and Tchonka1988). The significance of such contamination was assessed using post-IR OSL ratios (Duller, Reference Duller2003). Resulting photon emissions from quartz were divided from stimulating photons by 2.5 mm Hoya U-340 and 1 mm NG4 glass filters, and a Delta BP 365/50 interference filter, then detected by a Hamamatsu H7360-02 bi-alkaline cathode photomultiplier. The OSL signal was derived from the initial 0.1 s of stimulation, subtracting a background count based on the final 5 s of stimulation. Aliquot irradiation was conducted using a 90Sr/90Y β source delivering 0.11 Gy/s.
K-feldspars were analysed using a Risø TL-DA-15 irradiation-stimulation-detection system (Markey et al., Reference Markey, Bøtter-Jensen and Duller1997; Bøtter-Jensen et al., Reference Bøtter-Jensen, Mejdahl and Murray1999). IR stimulation for K-feldspars was provided at 875 ± 80 nm (IR diodes, Telefunken TSHA 6203, ~40 mW/cm2). IR stimulation was performed at 50°C then 200°C in an attempt to minimise fading signals, with the pIRIR signal then measured at 250°C (pIRIR250; Li et al., Reference Li, Roberts, Jacobs and Li2014b). K-feldspar emissions were filtered by 2 mm Schott BG-39 and 3 mm Schott BG-3 glass and detected by an EMI 9235QA photomultiplier fitted with a blue–green sensitive bi-alkaline photocathode. The pIRIR signal was determined from the initial 1.2 s of data, less a background count derived from the final 10 s of stimulation. Irradiation of K-feldspars was provided by a 90Sr/90Y β source conveying 0.07 Gy/s.
Sensitivity change was monitored using a test dose (5 Gy for quartz; 30 Gy for GL17171 quartz; 33 Gy for K-feldspar) and corrected by dividing the natural and regenerative-dose blue-OSL and pIRIR signals (Lx) by the test-dose signal response (Tx). Hot bleaches were applied after each SAR cycle, at 280°C for quartz (Murray and Wintle, Reference Murray and Wintle2003) and 320°C for K-feldspar (Li et al., Reference Li, Roberts, Jacobs and Li2014b).
Dose recovery tests help to assess whether a SAR protocol might accurately determine absorbed dose (Murray and Wintle, Reference Murray and Wintle2003). The dose recovery ratio (the quotient of an applied dose close in magnitude to the De value of a sample and recovered dose; Table 3) should be statistically concordant with unity. For the quartz fraction, dose recovery tests were performed for a range of preheats (180°C–280°C for 10 s). The thermal treatment resulting in a dose recovery ratio consistent with unity was then selected for the De measurement. For the K-feldspar fraction, the efficacy of a 300°C preheat for 60 s (Li et al., Reference Li, Roberts, Jacobs and Li2014b) was assessed from the average of dose recovery ratios of three aliquots. The limited quantity of K-feldspar in GL17117 (B17-S1-OSL2) precluded a dose recovery test for this sample.
Luminescence parameters from 125–180 μm quartz and K-feldspar isolates for dating.

a Lexsyg smart substrate temperature.
b IR, infrared; OSL, optically stimulated luminescence.
c Age estimates expressed relative to 2017. Uncertainties in age are quoted at 1σ confidence, are based on analytical errors, and reflect combined systematic and experimental variability.
Anomalous fading tests on K-feldspar were conducted for two samples, one from the upper ice complex (GL17121), the other from the lower ice complex (GL17171)(Table 4). Fading measurements were adapted from the procedure outlined by Auclair et al. (Reference Auclair, Lamothe and Huot2003) to align with the pIRIR measurement protocol in this study. To minimise the influence of initial sensitivity change upon fading calculations, each aliquot was subjected to the first SAR cycle of the K-feldspar measurement protocol. Aliquots were then bleached for 4 h in a Hönle SOL2 solar simulator to minimise any residual, optically sensitive signals. Each aliquot was then given a 474 Gy dose and preheated at 300°C for 60 s before storage. For GL17121, storage intervals were 38, 214, 544, and 1259 h; those for GL17171 differed slightly: 39, 350, 1105, and 1265 h. Lx/Tx values were obtained for three aliquots per storage interval and g-values were calculated using the R Luminescence package (Kreutzer et al., Reference Kreutzer, Schmidt, Fuchs, Dietze, Fischer and Fuchs2012).
K-feldspar IR50, pIRIR200, and pIRIR250 g values calculated for samples GL17121 and GL17171.

De values were interpolated from regenerative dose response curves (DRCs) and fitted with a single saturating exponential, using Analyst (Duller, Reference Duller2015). For samples GL17117 (B17-S1-OSL2) and GL17171 (B17-S1-OSL1), single exponential fits produced infinite estimates of De. In both instances, De values were based on exponential plus linear fits. Given the use of multigrain aliquots in this study, age estimates are based on measures of De centrality; weighted mean De values were calculated using the central age model (CAM; Galbraith et al., Reference Galbraith, Roberts, Laslett, Yoshida and Olley1999) within the R Luminescence package (Kreutzer et al., Reference Kreutzer, Schmidt, Fuchs, Dietze, Fischer and Fuchs2012).
U, Th, and K concentrations and U disequilibrium (228Ra/238U) within the sediment were measured from subsamples using a laboratory-based Ortec GEM-S high-purity Ge coaxial detector spectrometer system, calibrated with certified reference materials supplied by CANMET (Table 2). Values of 228Ra/238U were, with the exception of GL17119 (B17-S2-OSL4) and GL17121 (B17-S2-OSL6), consistent with unity, suggesting negligible U disequilibrium. Using DRAC (Durcan et al., Reference Durcan, King and Duller2015), estimates of radionuclide concentration were converted into external, lithogenic Dr values (Adamiec and Aitken, Reference Adamiec and Aitken1998), accounting for Dr modulation forced by grain size (Mejdahl, Reference Mejdahl1979) and gravimetric moisture content (Zimmerman, Reference Zimmerman1971). Owing to the persistence of permafrost in the region, we assume gravimetric water content to be representative of the burial period. Nevertheless, the correction assumes liquid water instead of the in situ ice content, a distinction that is yet to be investigated in detail. Lithogenic radiation internal to K-feldspar grains was assumed to derive from a K content of 12.5% (Huntley and Baril, Reference Huntley and Baril1997). Cosmogenic Dr values were calculated on the basis of sample depth, geographic position, and matrix density (Prescott and Hutton, Reference Prescott and Hutton1994). Luminescence ages are reported as thousands of years (ka) before the time of sampling. The difference between the year of sampling (e.g., 2017 in the present study) is considered negligible compared with the year AD 1950 datum for the Pleistocene 14C ages reported here.
14C dating
Organic remains from the samples of ice-wedge ice and the host sediment were picked for radiocarbon dating at the MICADAS 14C dating facility of the Alfred Wegener Institute, Bremerhaven. Detailed descriptions of the laboratory procedures are given in Opel et al. (Reference Opel, Murton, Wetterich, Meyer, Ashastina, Günther and Grotheer2019). In addition to the previously published radiocarbon ages in Ashastina et al. (Reference Ashastina, Schirrmeister, Fuchs and Kienast2017), Murton et al. (Reference Murton, Edwards, Lozhkin, Anderson, Savvinov, Bakulina and Bondarenko2017b), Opel et al. (Reference Opel, Murton, Wetterich, Meyer, Ashastina, Günther and Grotheer2019), Vasil'chuk and Vasil'chuk (Reference Vasil'chuk and Vasil'chuk2019), and Vasil'chuk et al. (Reference Vasil'chuk, Vasil'chuk, Budantseva and Vasil'chuk2020), two more sediment samples from the upper sand unit were newly dated (Table 5). Results are given as F14C values (Reimer et al., Reference Reimer, Brown and Reimer2004). Conventional radiocarbon ages are presented in years before present (yr BP). Ages within the calibration range were calibrated to years before present (cal yr BP), that is, before AD 1950, using Calib 8.20 (Stuiver and Reimer, Reference Stuiver and Reimer1993) based on the IntCal20 data set (Reimer et al., Reference Reimer, Austin, Bard, Bayliss, Blackwell, Bronk Ramsey and Butzin2020). Calibrated age values are rounded to the nearest 10 yr.
Radiocarbon ages of organic remains in ice wedges and host sediments as well as respective sample depths.a

a The samples at the AWI MICADAS 14C dating facility were radiocarbon dated as gas targets (Lab ID ends with 1.1) or graphite targets (Lab ID ends with 2.1). The ages were calibrated using CALIB 8.2 (Stuiver and Reimer, Reference Stuiver and Reimer1993) and the IntCal20 calibration curves (Reimer et al., Reference Reimer, Austin, Bard, Bayliss, Blackwell, Bronk Ramsey and Butzin2020). Calibrated age values are rounded to the nearest 10 yr. Calibrated finite radiocarbon ages are shown in Figure 8. n/r, not reported; n/a, not analysed; n/i, not identified; S, sediment; IW, ice wedge.
b References: (1) Ashastina et al. (Reference Ashastina, Schirrmeister, Fuchs and Kienast2017); (2) Murton et al. (Reference Murton, Edwards, Lozhkin, Anderson, Savvinov, Bakulina and Bondarenko2017b); (3) Opel et al. (Reference Opel, Murton, Wetterich, Meyer, Ashastina, Günther and Grotheer2019); (4) Vasil'chuk and Vasil'chuk (Reference Vasil'chuk and Vasil'chuk2019); (5) Vasil'chuk et al. (Reference Vasil'chuk, Vasil'chuk, Budantseva and Vasil'chuk2020); and (6) this study.
c interpreted as relocated material by Vasil'chuk et al. (Reference Vasil'chuk, Vasil'chuk, Budantseva and Vasil'chuk2020).
d Interpreted as nonfinite date by Murton et al. (Reference Murton, Edwards, Lozhkin, Anderson, Savvinov, Bakulina and Bondarenko2017b).
e Interpreted as relocated material by Opel et al. (Reference Opel, Murton, Wetterich, Meyer, Ashastina, Günther and Grotheer2019).
f The angular brackets [ ] indicate that the calibrated range impinges on end of calibration data set.
36Cl/Cl dating
Background and age calculation
The 36Cl/Cl dating method determines the difference in ages between distinctly different generations of ground ice within permafrost, based on measurements of 36Cl/Cl ratios, that is, the radionuclide (36Cl) relative to the two stable nuclides (35Cl and 37Cl). The 36Cl/Cl method was first applied to permafrost samples from Cape Svyatoy Nos, northeastern Siberia (Gilichinsky et al., Reference Gilichinsky, Nolte, Basilyan, Beer, Blinov, Lazarev and Kholodov2007). Dating of a more representative collection of ice samples from permafrost exposed along the coast of the Dmitry Laptev Strait (Blinov et al., Reference Blinov, Alfimov, Beer, Gilichinsky, Schirrmeister, Kholodov, Nikolskiy, Opel, Tikhomirov and Wetterich2009; Fig. 1a) showed the potential of the method and identified its limitations and uncertainties. As 10Be was previously found unsuitable and again confirmed (Merchel et al., Reference Merchel, Beutner, Opel, Rugel, Scharf, Tiessen, Weiß and Wetterich2019) for dating ground ice with substantial sediment inclusions, 36Cl/Cl dating is, therefore, the radionuclide dating method of choice, and its basis is briefly described here.
The long-lived radioactive isotope of chlorine 36Cl (half-life T 1/2 = 301 ± 2 ka; Endt, Reference Endt1990; Firestone, Reference Firestone and Shirley1996) forms mainly in nuclear reactions of galactic and solar cosmic ray particles on atmospheric argon. 36Cl atoms generated in the stratosphere enter the troposphere and, after mixing with the tropospheric fraction, are deposited on the Earth's surface by wet precipitation and by dry sedimentation. The mean global cosmogenic production rate of 36Cl in the atmosphere is about 24 atoms/m2/s (Masarik and Beer, Reference Masarik and Beer2009), which supports local surface fluxes, depending on geographic location and climatic conditions.
The stable isotopes of chlorine (35Cl and 37Cl), according to the well-established global chlorine cycle (Graedel and Keene, Reference Graedel and Keene1996), enter the troposphere by sea spray and return to the Earth's surface with atmospheric water. The local deposition flux of Cl depends on the distance to oceans and on the dominant local wind directions. In regions with permafrost, winter precipitation enters ice wedges mainly in spring as snow meltwater percolates and refreezes in thermal contraction cracks (Opel et al., Reference Opel, Meyer, Wetterich, Laepple, Dereviagin and Murton2018). Then, after an ice wedge ceases growing and becomes isolated from new atmospheric inputs of 36Cl, the 36Cl/Cl ratio decreases with time, following the law of radioactive decay. The time interval between the ages of two ice-wedge samples is determined by the difference in their residual 36Cl/Cl ratio. Obviously, the validity of the dating rests on the assumption that the 36Cl/Cl input into the atmospheric water cycle is constant and that the ice wedge is a closed system.
The directions of moisture fluxes, from west to east in northern Europe and Asia, indicate that most moisture presently reaching Siberian regions with longitudes <140°E originates from the relatively warm northern Atlantic Ocean (Kuznetsova, Reference Kuznetsova1998). Moisture transport from the cold Arctic Ocean to Siberia can be considered negligible, particularly during winter, when the Arctic Ocean is covered by sea ice. Therefore, the change in distance of north Siberian regions to the Arctic Ocean is not expected to influence the deposition flux of stable chlorine.
Temporal and spatial variations in 36Cl atmospheric flux reflect a combination of variations in production and transport. The production rate of 36Cl has a strong latitudinal dependence caused by the shielding effect of the Earth's magnetic field. However, strong mixing of the stratospheric air masses (Heikkila et al., Reference Heikkila, Beer and Feichter2008) eliminates most of this effect. The production rate is also affected by temporal changes of solar activity and of the geomagnetic field intensity, which both modulate the cosmic ray flux in time. The corresponding decadal- to centennial-scale variations of 36Cl concentration are well preserved in polar ice cores (Muscheler et al., Reference Muscheler, Joos, Beer, Muller, Vonmoos and Snowball2007), but their resulting effect should cancel out when averaged on the geologic timescale.
The upper limit of age determination of wedge ice is defined by 36Cl in situ production. Such production may occur at the place of fixation by thermal-neutron capture of stable 35Cl contained in ice. These low-energy neutrons originate from cascades of cosmic ray interactions above and below the ground level, and from the decay of natural uranium and thorium. The dating limit is reached when the atmospheric concentrations in ice decay to the level of the in situ production and corresponds to an age limit of 3 Ma (Tikhomirov and Blinov, Reference Tikhomirov and Blinov2009). This limit likely exceeds the age of most terrestrial permafrost samples.
The 36Cl/Cl method proposes that the time interval Δt between the formation of two ice-wedge horizons (1 and 2) is calculated from the corresponding 36Cl/Cl ratios according to the formula:

The mean lifetime of 36Cl is τ36 = T 1/2/ln 2 = (434 ± 3) ka. For the model base sample of known age, the equation gives the absolute age of the deeper sample. Thus, 36Cl/Cl age estimates are reported as the age difference, in thousands of years (ka), between the younger and older ice wedges.
Sample processing and AMS measurements
Water melted from ice wedges was chemically treated in a dedicated 36Cl (i.e., Cl- and S-free) chemistry laboratory at the Helmholtz-Zentrum Dresden-Rossendorf. The only suitable chemical form for 36Cl AMS measurements is AgCl; hence, radiochemical separation needs to produce AgCl, preferably with high chemical yield and low isobar (36S) abundance. Having experienced low chemical yield (20%–35%) for AgCl from large groundwater and ice samples during routine sample treatment, we split the four ice-wedge samples (Table 6) of this study into two halves and applied our routine method, as well as an alternative one with a preconcentration step using anion exchange. Details have been presented earlier (Merchel et al., Reference Merchel, Beutner, Opel, Rugel, Scharf, Tiessen, Weiß and Wetterich2019). Further sample processing followed routine protocols for calcite samples but without the use of isotopically enriched 35Cl carrier (Merchel et al., Reference Merchel, Braucher, Alfimov, Bichler, Bourlès and Reitner2013). Individual results of 36Cl/35Cl presented in Table 6 for the two aliquots of each sample can be interpreted as replicate measurements. Resulting AgCl was pressed into dedicated Cu sample holders (Pavetich et al., Reference Pavetich, Akhmadaliev, Arnold, Aumaître, Bourlès, Buchriegler and Golser2014) without taking any further precautions like AgBr backing for additional isobar suppression. A specialised ion source with lowest cross-contamination and long-term memory (Pavetich et al., Reference Pavetich, Akhmadaliev, Arnold, Aumaître, Bourlès, Buchriegler and Golser2014) attached to the 6 MV tandem accelerator (Rugel et al., Reference Rugel, Pavetich, Akhmadaliev, Enamorado Baez, Scharf, Ziegenrücker and Merchel2016) was used for AMS measurements at the DREAMS (DREsden AMS) facility. All 36Cl/Cl data are traceable to the primary-type standard material SM-Cl-11 with a nominal ratio of (1.079 ± 0.010) × 10−11 (Merchel et al., Reference Merchel, Bremser, Alfimov, Arnold, Aumaître, Benedetti and Bourlès2011). The sequential age difference of the measured samples, calculated with Eq. 2, is presented in Table 6 (“Calculated Age Difference”). The given uncertainties are calculated formally from experimental results and do not include nonstatistical uncertainty of their interpretation.
Sample information and results from accelerator mass spectrometry for 36Cl/Cl dating.a

a The data are traceable to primary-type standard material SM-Cl-11 (Merchel et al., Reference Merchel, Bremser, Alfimov, Arnold, Aumaître, Benedetti and Bourlès2011). The given uncertainties include statistical measurement uncertainties, the given uncertainty of the standard used, and the uncertainty of the mean of the standard measurement.
b Age difference between this sample and the one above.
RESULTS
Luminescence dating
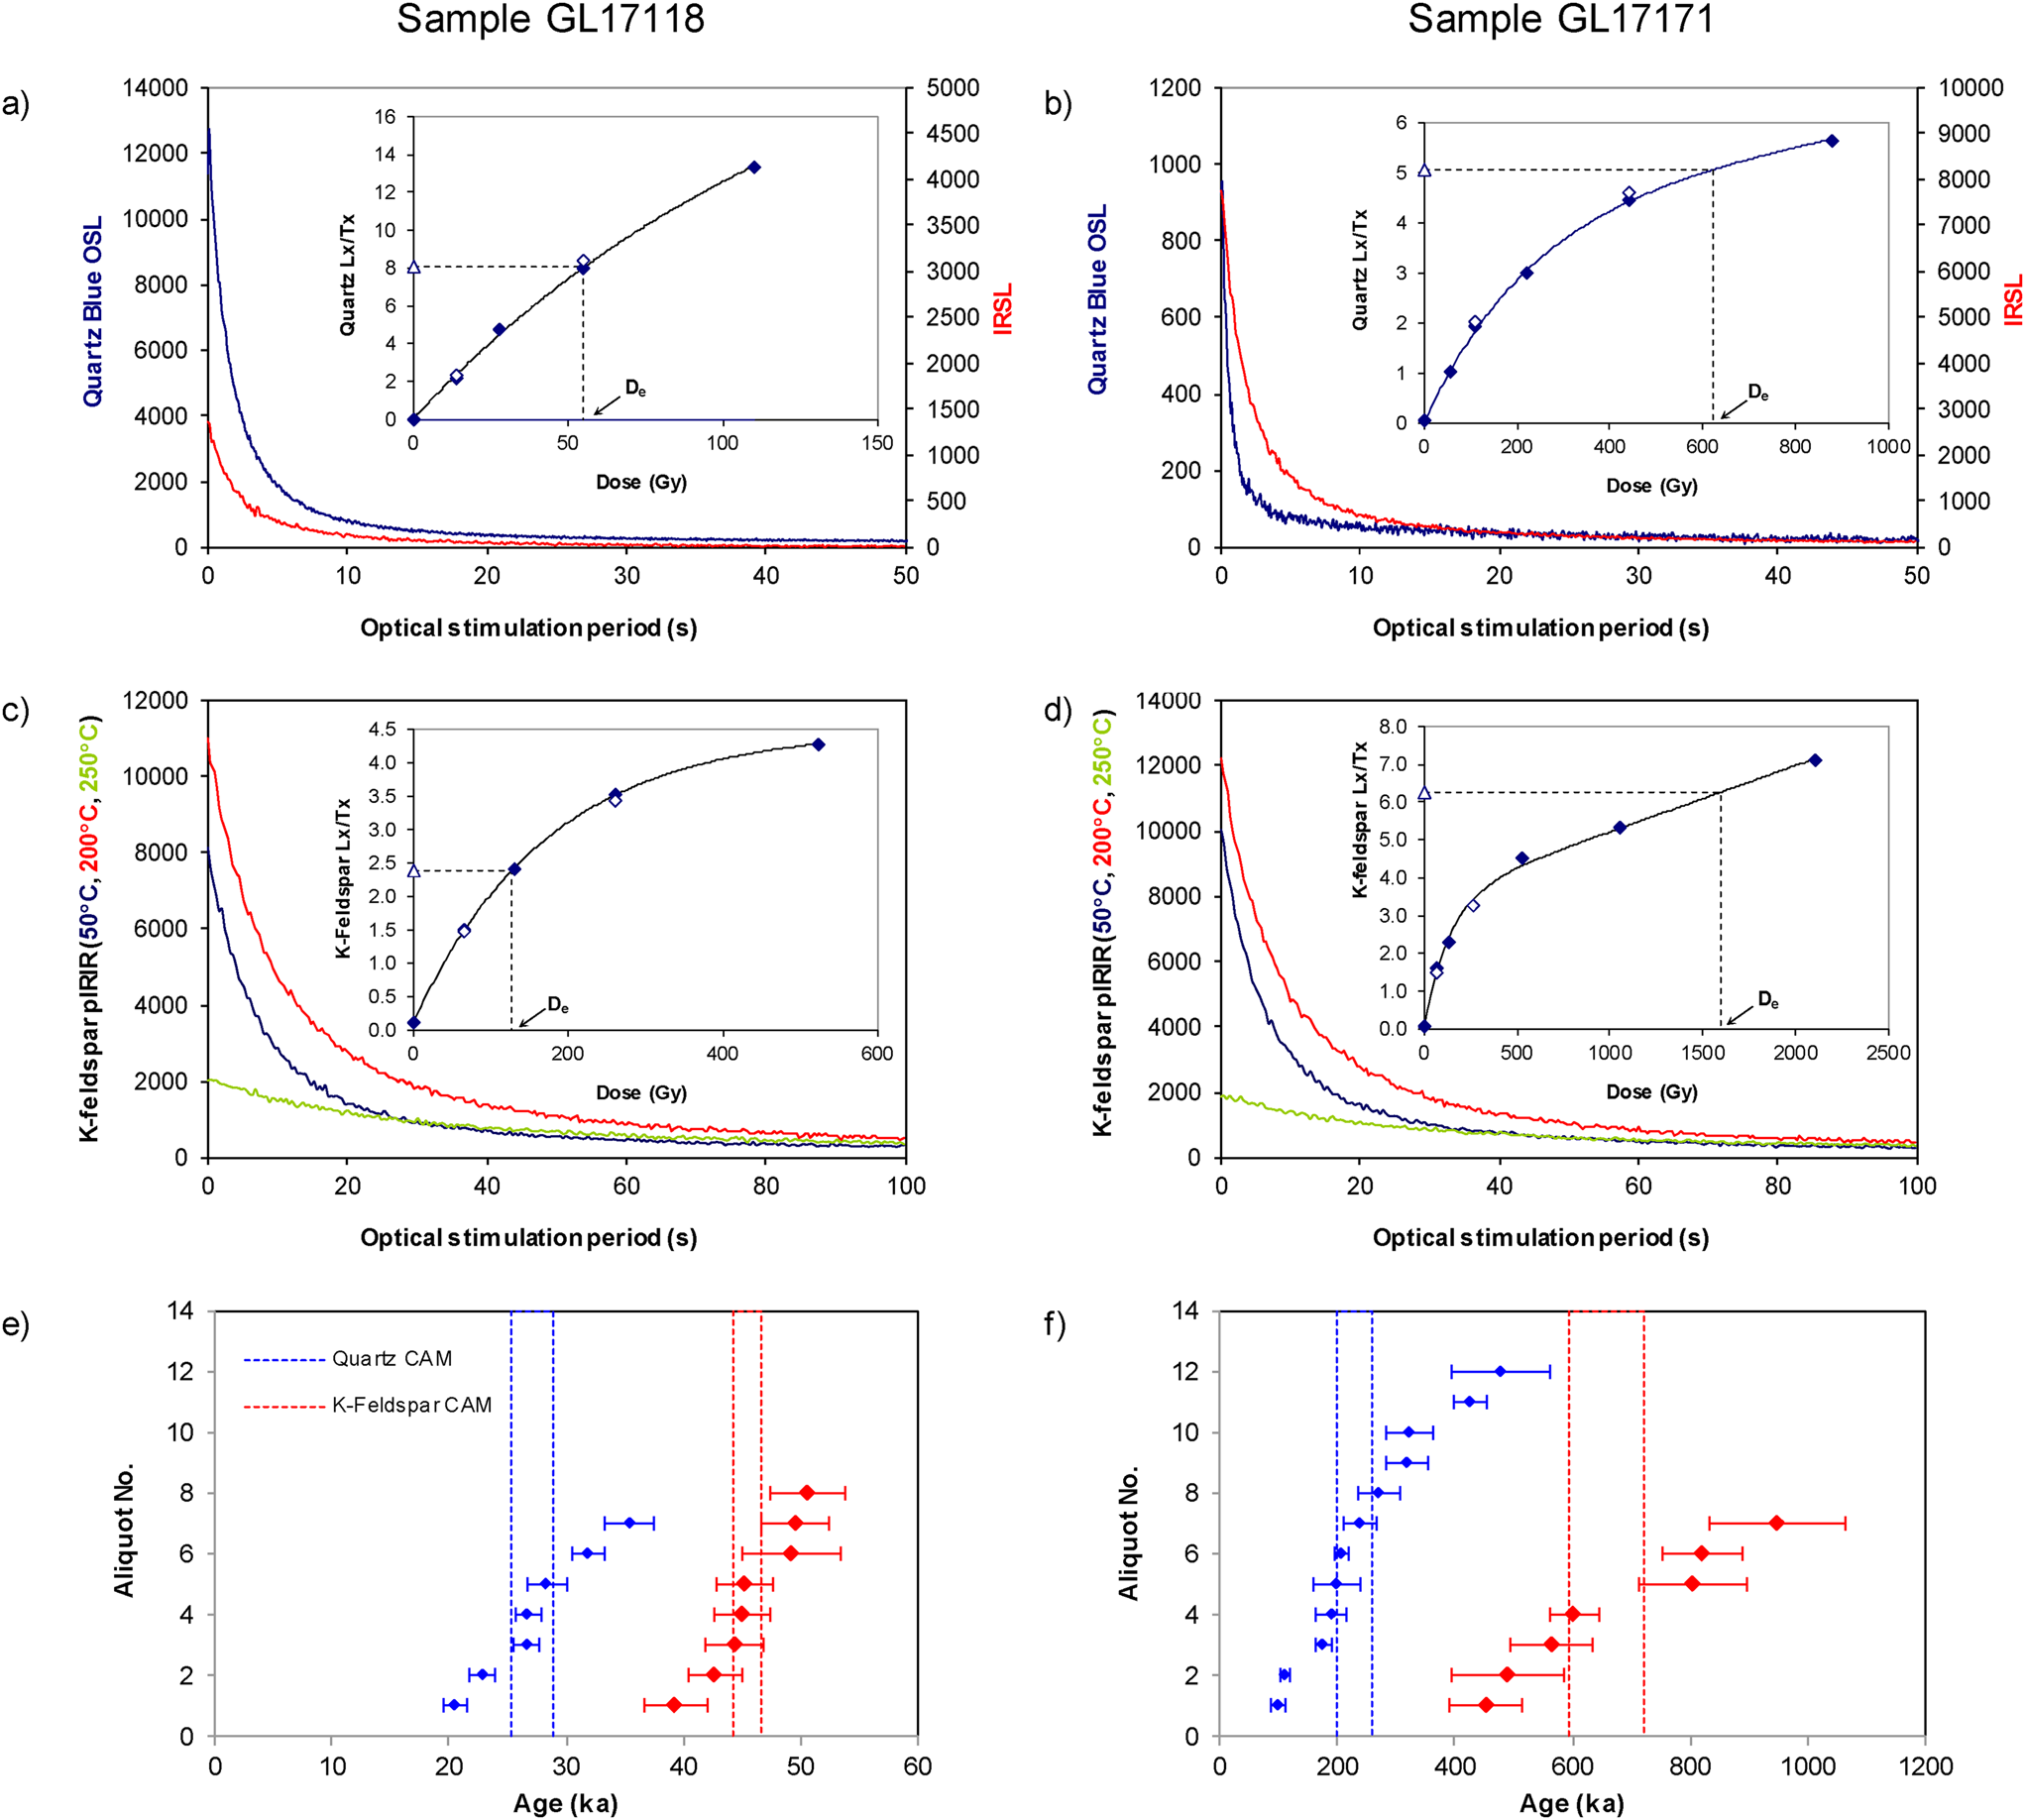
De, Dr, and luminescence age data are presented in Tables 2 and 3; Figure 5 illustrates representative signal decays and DRCs, as well as inter-aliquot age distributions. The strong IRSL response (Fig. 5a and b) and post-IR OSL ratios (Table 3) for quartz suggest the presence of significant feldspar contamination. A 2-week, 35% H2SiF6 digestion was subsequently applied to one sample (GL17172) in an attempt to remove the contaminant (Jackson et al., Reference Jackson, Sayin and Clayton1976; Berger et al., Reference Berger, Mulhern and Huntley1980) without significantly altering quartz grain size. The SAR analysis was then repeated, producing a negligible IRSL signal, a post-IR OSL ratio consistent with unity (Table 3), and an OSL fast component more consistent with that of quartz (ca. 94% of the signal at t = 0), all suggesting removal of the contaminant.
Dose–response curves (DRCs) and inter-aliquot age distributions for samples GL17118 (B17-S2-OSL3, left column) and GL17171 (B17-S1-OSL1, right column), representative of the sample suite; the top and bottom optically stimulated luminescence (OSL) samples from the Batagay megaslump sequence. (a and b) blue OSL and infrared-stimulated luminescence (IRSL) signal decays from quartz; (c and d) IR50, pIRIR200, and pIRIR250 signal decays from K-feldspar; insets are the associated Lx/Tx DRCs (open triangle, natural signal; closed diamonds, regenerative-dose signals; open diamonds, repeat regenerative doses). (e and f) inter-aliquot age distributions and central age models (CAM) derived from quartz blue OSL and K-feldspar pIRIR250.
Dose recovery ratios are, except for GL17119 (B17-S2-OSL4), consistent with unity for the majority of quartz samples, indicating accurate retrieval of applied laboratory doses (Table 3). For K-feldspar extracts, dose recovery ratios from pIRIR250 generally produced overestimates of the applied dose by 10%–30% (Table 3). Figure 6 highlights that dose recovery ratios for IR50 and pIRIR200 demonstrate greater consistency with unity. Low and high dose repeat ratios (Table 3) for both quartz and K-feldspar are generally consistent with unity, which suggests adequate correction of any sensitivity change that progressed with laboratory measurement. In general, the variation in De beyond counting statistics (% overdispersion) increases with depth, most likely as a function of the proximity of absorbed dose to saturation. Overdispersion is generally higher for quartz than K-feldspar, which on a multigrain aliquot likely reflects a greater proportion of K-feldspar grains contributing to the luminescence signal relative to quartz.
Dose recovery ratios for IR50, pIRIR200, and pIRIR250 of three aliquots from sample GL17171 (B17-S1-OSL1).

K-feldspar fading tests on GL17121 and GL17171 reveal a pattern consistent with previous studies of pIRIR signals (e.g., Thomsen et al., Reference Thomsen, Murray, Jain and Botter-Jensen2008), whereby the g-value depends on IRSL stimulation temperature (Fig. 7; Table 4). For both samples, the IR50 signal displayed the greatest IRSL decay during storage. However, the g-value for GL17171 (8.30 ± 0.98%/decade) was much higher than that calculated for GL17121 (2.96 ± 0.98%/decade). GL17121 displayed negligible fading at elevated stimulation temperatures, with the pIRIR200 and pIRIR250 signals producing g-values statistically consistent with zero. For GL17171 the pIRIR200 signal still observed significant decay (g = 3.44 ± 1.02%/decade), whereas the pIRIR250 signal produced a g-value indistinguishable from zero.
Signal depletion as a function of storage time for the IR50 (blue circles), pIRIR200 (red crosses), and pIRIR250 (green triangles) signals for samples GL17121 (a) and GL17171 (b). Storage times (t) and Lx/Tx ratios were normalised to the first/prompt measurements (t c) at 38 and 39 h for panels a and b, respectively.

Six age estimates were produced from each of the quartz and K-feldspar fractions (Table 3). Samples from the same mineral produce ages that are in stratigraphic order. However, except for GL17120 (B17-S2-OSL5), all quartz ages are significantly younger than those from K-feldspar by 20%–65%. The lower ice complex, sampled at depths of ~50 and 49.5 m below the ground surface, yielded quartz OSL ages of 228 ± 32 ka and 244 ± 16 ka, and K-feldspar pIRIR ages of 658 ± 74 ka and 693 ± 97 ka (GL17171 and GL17117, B17-S1-OSL1 and B17-S1-OSL2, respectively). The upper ice complex, sampled ~5 m above its base (GL17172), yielded a quartz OSL age of 57.5 ± 5.8 ka and a K-feldspar pIRIR age of 90.5 ± 6.2 ka. The upper sand unit, sampled at depths of 11, 2.3, and 2.1 m below the ground surface, provided quartz OSL ages of 40.0 ± 3.9 ka, 41.0 ± 3.9 ka, and 27.1 ± 2.1 ka, and K-feldspar pIRIR ages of 61.0 ± 3.7 ka, 50.9 ± 3.5 ka, and 45.5 ± 2.9 ka (GL17120, GL17119, and GL17118 corresponding to B17-S2-OSL5, B17-S2-OSL4, and B17-S2-OSL3, respectively).
14C dating
Several radiocarbon ages yielded lower 14C intensities than the blanks included in the respective sequence. For these cases, data are given as F14Csample < F14Cblank, resulting in minimum ages (Table 5). Based on all available radiocarbon ages from the Batagay megaslump, but excluding those considered as redeposited by the original authors (Ashastina et al., Reference Ashastina, Schirrmeister, Fuchs and Kienast2017; Murton et al., Reference Murton, Edwards, Lozhkin, Anderson, Savvinov, Bakulina and Bondarenko2017b; Opel et al., Reference Opel, Murton, Wetterich, Meyer, Ashastina, Günther and Grotheer2019; Vasil'chuk and Vasil'chuk, Reference Vasil'chuk and Vasil'chuk2019; Vasil'chuk et al., Reference Vasil'chuk, Vasil'chuk, Budantseva and Vasil'chuk2020), it is obvious that radiocarbon dating covers only the uppermost units of the stratigraphy, that is, the Holocene cover and the upper parts of the upper sand and the upper ice complex, whereas the respective lower parts of these units yield nonfinite radiocarbon ages. The Holocene cover deposits exhibit only one age of 0.39 cal ka BP. The upper sand unit has finite ages that range from 15.09 to 42.39 cal ka BP. The finite age range of the upper ice complex spans from 27.16 to 52.21 cal ka BP (Table 5). Nonfinite ages from both sediment and wedge ice of the upper ice complex are common and might suggest formation of this unit started well before 50 cal ka BP. The lowermost three units—the woody debris layer, the lower sand, and the lower ice complex—show nonfinite radiocarbon ages, with one exception from the woody debris layer (49,320 ± 3,150 yr BP interpreted as a nonfinite age by Murton et al., Reference Murton, Edwards, Lozhkin, Anderson, Savvinov, Bakulina and Bondarenko2017b). It is notable that previous sampling in the megaslump at different accessible locations and uncertainties about exact sampling depth complicate the understanding of age–depth relations.
36Cl/Cl dating
AMS results for 36Cl/35Cl measurements are presented as individual results for the two aliquots of each sample. Assuming natural 35Cl/37Cl, they can be transformed into 36Cl/35+37Cl ratios if needed. 36Cl/35Cl sample values are two to three orders of magnitude above typical machine blank values, hence, no blank correction has been applied. Total uncertainties in the dating include those associated with the statistical measurement of the samples, the standard SM-Cl-11 used (Merchel et al., Reference Merchel, Bremser, Alfimov, Arnold, Aumaître, Benedetti and Bourlès2011), the mean of the standard measurement, and an additional 6% systematic uncertainty to account for unstable measurement conditions (Table 6).
Weighted mean 36Cl/35Cl ratios of the four studied ice wedges range from (2.79 ± 0.12) × 10−12 for the stratigraphically youngest ice wedge B17-IW4 to (7.11 ± 0.34) × 10−13 for the stratigraphically oldest ice wedge B17-IW1 and decrease with depth (Table 6). The corresponding calculated ages are in correct stratigraphic order, that is, without age reversals. They show that the ice wedge B17-IW5 from the upper ice complex is 10 ± 19 ka older than ice wedge B17-IW4 from the upper sand. Ice wedge B17-IW6, also from the upper ice complex, is 11 ± 20 ka older than ice wedge B17-IW5. Ice wedge B17-IW1, from the lower ice complex, is 573 ± 42 ka older than ice wedge B17-IW6 (Table 6).
DISCUSSION
Methods of permafrost age determination
A major problem in determining the age of permafrost is that dating methods are generally not well established on frozen material and must be applied to differing constituents (i.e., organic remains, quartz, feldspar, ice) that may have different formation processes and ages. For example, ice wedges are—due to their downward-directed formation—younger (by up to many thousands of years or more) than their host sediments at the same altitude and may penetrate multiple layers of sediment, each of differing age. Some of these uncertainties relate to unknown influences of [1] freezing and thawing or warming and cooling and [2] temperature-gradient-induced migration of unfrozen water through porous media on chemical and physical parameters important to the four age-determination techniques applied at Batagay.
Luminescence dating
Based on the diagnostics deployed, issues of luminescence age reliability are fivefold. First, the mass of quartz and K-feldspar within the modal grain fraction is relatively small, which meant that after preliminary measurements as few as seven multigrain aliquots were available to produce a luminescence age. Future sampling should aim to retrieve twice the bulk mass from the site (~1 kg). Nonetheless, the luminescence ages are in stratigraphic order and distinct between units. Second, a nonstandard post-HF (H2SiF6) step is required to remove feldspar contamination from quartz sand samples in the Batagay sequence. For the single sample where this acid treatment was used (GL17172, B17-S2-OSL7), there was a modest though statistically insignificant increase in De relative to its untreated counterpart (Table 3). At this point, we consider the age estimates from quartz untreated with H2SiF6 as minima owing to the dominance and probable anomalous fading of the contaminating feldspar IRSL signal.
Third, for the K-feldspar samples, the mean dose recovery ratio for most samples indicates that the measured dose overestimates the applied laboratory dose by 10%–30% (Table 3). Of the five samples for which a dose recovery test was undertaken, only sample GL17172 (B17-S2-OSL7) returned a mean pIRIR250-based dose recovery ratio consistent with unity. In contrast, the mean dose recovery ratios for IR50 and pIRIR200 approximate unity for each sample. The success of SAR dose recovery tests in previous studies using high-temperature K-feldspar pIRIR signals has varied, with measured doses overestimating (e.g., Thiel et al., Reference Thiel, Buylaert, Murray and Tsukamoto2011), underestimating (e.g., Li and Li, Reference Li and Li2011), and consistent with (e.g., Li et al., Reference Li, Roberts, Jacobs and Li2014b) the applied dose. The proposed origins of this inconsistent performance can be summarised as an effect of residual signals, present before the initial laboratory dose is applied (e.g., Stevens et al., Reference Stevens, Markovic, Zech, Hambach and Sümegi2011) and/or remaining after each regenerative dose (e.g., Colarossi et al., Reference Colarossi, Duller and Roberts2018), and an effect of sensitivity changes within the first measurement cycle (e.g., Qin et al., Reference Qin, Chen, Li and Zhou2018) and/or between the first and second cycles (Roberts, Reference Roberts2012). A poor high-temperature pIRIR dose recovery outcome does not necessarily translate directly to an inaccurate estimate of burial age (e.g., Thiel et al., Reference Thiel, Buylaert, Murray and Tsukamoto2011), but it is clear that the effects of residual signals and response to measurement conditions can vary between samples. It is therefore essential to compare high-temperature K-feldspar pIRIR SAR age estimates with independent chronological controls.
Fourth, despite varying degrees of IRSL decay for the lower stimulation temperatures, for both GL17121 and GL17171 the pIRIR250 signal does not appear to significantly fade at room storage temperatures. It is acknowledged that the evaluation of fading is limited by laboratory time scales and precision. However, it is also noted that lower levels of anomalous fading in K-feldspar have previously been observed under frozen conditions (e.g., Krause et al., Reference Krause, Krbetschek and Stolz1997; Preusser et al., Reference Preusser, Müller and Schlüchter2001, Reference Preusser, Geth and Schlücter2003; Preusser and Schlüchter, Reference Preusser and Schlüchter2004; Huntley and Lian, Reference Huntley and Lian2006; Thomsen et al., Reference Thomsen, Murray, Jain and Botter-Jensen2008; Fuchs et al., Reference Fuchs, Böhlert, Krbetshek, Preusser and Egli2013).
Finally, the characteristic saturation point (D0) for K-feldspar in these samples, derived from fitting a single exponential to DRCs, is broadly comparable to the “D1” value (D0 value for first of a double exponential fit; 142 ± 35 Gy) presented by Li et al. (Reference Li, Roberts, Jacobs, Li and Guo2015) for pIRIR250 Lx/Tx-based DRCs in their evaluation of standardised DRCs for K-feldspar. All but the two deepest samples, GL17117 and GL17171, produce De values that are lower than 2D0 (86% saturation of a single exponential DRC), proposed by Wintle and Murray (Reference Wintle and Murray2006) as the upper limit for quartz OSL age estimation. The De values for GL17117 (B17-S1-OSL2) and GL17171 (B17-S1-OSL1) also exceed 3D0 (95% saturation of a single exponential DRC). Given this observation and that De values were derived from non-standard, exponential plus linear fits, the pIRIR250 ages associated with GL17117 (B17-S1-OSL2) and GL17171 (B17-S1-OSL1) should be treated with caution if considered in isolation.
Given the range of uncertainties discussed, it is essential that the reliability of luminescence age estimates be considered through a comparison of quartz OSL, K-feldspar pIRIR250, and independent age controls. The relative difference in ages between quartz OSL and K-feldspar pIRIR250 increases with depth. Quartz ages are 20%–40% younger than those for K-feldspar through the upper sand and upper ice complex, whereas those for quartz within the lower ice complex are ~65% younger than those for K-feldspar. The removal of feldspar contamination in sample GL17172 (B17-S2-OSL7) reduces the discrepancy between quartz and K-feldspar ages from 36% to 25%, though this shift is not statistically significant. Given the relatively high preheat and cutheat temperatures (>200°C, substrate >160°C) used for quartz measurements in this study, any thermally unstable, ultrafast OSL component is unlikely to explain the age gap between quartz treated with H2SiF6 and K-feldspar (Jain et al., Reference Jain, Choi and Thomas2008). Further, it is the quartz age that remains consistent with the 36Cl/Cl ages in the upper ice complex, with the K-feldspar age being significantly higher despite the relatively large uncertainties in the 36Cl/Cl estimates (Fig. 8). For GL17172 at least, this might suggest that it is the K-feldspar that is overestimating age. Residual doses have frequently been observed in pIRIR studies. These are typically less than ~35 Gy but can range from ~17 to 145 Gy (Lowick et al., Reference Lowick, Trauerstein and Preusser2012; Li et al., Reference Li, Jacobs, Roberts and Li2014a). They appear sample dependent rather than driven by bleaching conditions (Li et al., Reference Li, Jacobs, Roberts and Li2014a), but when combined with the burial dose can produce age overestimates. In the case of GL17172, the K-feldspar age exceeds that of quartz by virtue of an additional 63 Gy (accounting for differences in Dr between quartz and K-feldspar). Although the aeolian nature of the sedimentary deposits from which the luminescence samples were extracted would have promoted bleaching, there was insufficient sample to estimate sample-specific residual dose through laboratory bleaching experiments. At this point, we assume 63 Gy to be the upper limit of residual dose. The lower sand was previously dated by Ashastina et al. (Reference Ashastina, Schirrmeister, Fuchs and Kienast2017) using quartz OSL and K-feldspar IR50 (Fig. 8) and ascribed to MIS 6. Though the age estimates are stratigraphically consistent, there is no independent chronological control in this unit, and there is again divergence between the quartz and K-feldspar age estimates, with the former 32% younger than the latter. The IR50 signal is not corrected for anomalous fading and is considered here to be a minimum age estimate.
Schematic overview of all available chronostratigraphic data of the Batagay megaslump summarised from (1) Ashastina et al. (Reference Ashastina, Schirrmeister, Fuchs and Kienast2017); (2) Murton et al. (Reference Murton, Edwards, Lozhkin, Anderson, Savvinov, Bakulina and Bondarenko2017b); (3) Opel et al. (Reference Opel, Murton, Wetterich, Meyer, Ashastina, Günther and Grotheer2019); (4) Vasil'chuk and Vasil'chuk (Reference Vasil'chuk and Vasil'chuk2019); (5) Vasil'chuk et al. (Reference Vasil'chuk, Vasil'chuk, Budantseva and Vasil'chuk2020); and (6) this study. Stratigraphy not to scale (see Table 1). Radiocarbon ages are shown as calibrated ages in ka BP. Note that this compilation is based on several sampling campaigns by different researchers working at different sections, which precludes placing the data in true vertical order. The positions of 36Cl/Cl and 14C ages above luminescence age do not have depth significance and are solely to show the single data points clearly. Glacial–interglacial cycles shown in the lower graph derive from the marine isotope stages of the LR04 stack of benthic δ18O (Lisiecki and Raymo, Reference Lisiecki and Raymo2005) and a current review of past interglaciations (Past Interglacials Working Group of PAGES, 2016), which are given here for chronologic orientation. MIS numbers above the curve indicate interglacial maxima (interstades of the Late Pleistocene are given in brackets). MIS numbers below the curve indicate glacial maxima. At the bottom of the plot, “H” stands for Holocene and “E P” for Early Pleistocene.

Within the lower ice complex, it is the K-feldspar pIRIR250 age that is coeval with that from 36Cl/Cl, with the quartz OSL age estimate significantly younger. It is unlikely that the difference here between quartz and K-feldspar ages relates to residual doses in the latter; it would require a residual of ~1100 Gy to explain the divergence, which is an order of magnitude higher than any previously reported residual dose. Although the Lx/Tx DRCs for the quartz OSL and K-feldspar pIRIR250 signals in this unit have similar D0 values (Table 3), it appears that quartz has crossed a threshold where it underestimates age. This may in part relate to anomalous fading driven by feldspar IRSL contamination of the quartz OSL signal. This underestimation also likely afflicts the quartz age from the lower sand unit (Ashastina et al. Reference Ashastina, Schirrmeister, Fuchs and Kienast2017), which is less than the IR50 K-feldspar age estimate that in itself is probably an underestimate due to anomalous fading. The agreement in age between K-feldspar pIRIR250 and 36Cl/Cl is encouraging, but it is acknowledged that De values associated with the former exceed 3D0 (95% saturation), and until further work is conducted pIRIR250 indicates that the lower ice complex dates to at least 650 ka.
14C dating
The 14C dating of different organic materials has proven useful to varying degrees for determining the age of the upper part of the permafrost sequence at Batagay. Organic samples dated (n = 40) from the upper ice complex, the upper sand unit, and the cover layer comprise plant macrofossil remains (wood fragments, twigs, leaves, stems, in situ rootlets, charcoal), ground-squirrel droppings, insect remains, and unidentified microinclusions within ice wedges (Table 5). The calibrated ages range from 0.39 cal ka BP in the cover layer to 51.92 cal ka BP, and numerous ages are nonfinite (Table 5). Interpretation of the finite 14C ages, however, highlights a number of problems. First, some material, particularly wood fragments, is likely reworked—for example by thermal erosion from permafrost—and simply provides maximum ages of sediment deposition. Therefore, we compare 14C ages obtained only from in situ material with ages from other methods. Second, unidentified organic material in microinclusions in wedge ice (Vasil'chuk and Vasil'chuk, Reference Vasil'chuk and Vasil'chuk2019; Vasil'chuk et al., Reference Vasil'chuk, Vasil'chuk, Budantseva and Vasil'chuk2020) makes interpretation of ages obtained by these authors difficult without knowing exactly how the material relates to the age of the host ice. Finally, depth measurements obtained from different parts of the large and topographically variable floor and headwall of the megaslump had to be integrated, and this introduced considerable error in determining the samples’ precise stratigraphic positions. This error is compounded by the downslope inclination of the stratigraphy and the variable thickness and geometry of the stratigraphic units (Fig. 2) and by local irregularities in the distribution of ice and mineral soil. Nonetheless, the age estimates suggest in broad terms that the cover layer is of Holocene age, the upper sand unit began forming sometime within MIS 3 (58–28 ka) and formation continued into MIS 2 (28–11.7 ka), and the upper ice complex developed during MIS 3, but the starting time of formation is not known, because the oldest ages are beyond the effective limit of 14C dating (~40–50 ka).
We recommend that the best material for 14C dating of syngenetic permafrost at Batagay is plant material that can be identified taxonomically and is in growth position within the stratigraphic sequence. Such material includes in situ roots and tree stumps. Where in situ material is not available, we recommend dating of fragile macrofossils— which are unlikely to have survived significant reworking and are likely representative of the palaeoecological conditions and therefore local environment —a strategy adopted in stringent 14C dating studies from other permafrost regions (e.g., Mann et al., Reference Mann, Groves, Reanier and Kunz2010; Kennedy et al., Reference Kennedy, Froese, Zazula and Lauriol2010; Murton et al., Reference Murton, Goslar, Edwards, Bateman, Danilov, Savvinov, Gubin, Ghaleb, Haile, Kanevskiy, Lozhkin, Lupachev, Murton, Shur, Tikhonov, Vasil'chuk, Vasil'chuk and Wolfe2015, Reference Murton, Bateman, Telka, Waller, Whiteman and Kuzmina2017a).
36Cl/Cl dating
As the 36Cl/Cl method provides relative ages with respect to a starting point of known age, we need to use other available age information to constrain the age of the reference ice wedge. We decided not to select the youngest and uppermost ice wedge B17-IW4 from the upper sand as the reference ice wedge, because (1) it is located only about 2 m below the modern surface (Fig. 4) and (2) its stable-isotope composition is quite close to that of a Holocene ice wedge nearby (Opel et al., Reference Opel, Murton, Wetterich, Meyer, Ashastina, Günther and Grotheer2019). Hence, we cannot exclude that this ice wedge is an epigenetic Holocene ice wedge, that is, it developed substantially later than the time of deposition of its host sediments of MIS 3 to MIS 2 age (Fig. 4), as discussed in detail by Opel et al. (Reference Opel, Murton, Wetterich, Meyer, Ashastina, Günther and Grotheer2019). Instead, we selected ice wedge B17-IW5 from the upper ice complex as the reference for the 36Cl/Cl dating results. Based on the available 14C ages for this ice wedge (calibrated median age 29 cal ka BP) and its host sediments (> 50 cal ka BP), we estimate about 40 ± 10 cal ka BP as starting point (base age) for the 36Cl/Cl ice-wedge age calculations.
The deduced ages for the ice wedges from older strata are 51 ± 30 ka for ice wedge B17-IW6 from the upper ice complex and 624 ± 51 ka for ice wedge B17-IW1 from the lower ice complex (Table 6, “Interpreted Absolute Age”). It is notable that under the present assumptions, the large uncertainty range of the 36Cl/Cl age of B17-IW6 covers the OSL age estimate from the upper ice complex but is somewhat younger than the pIRIR age. The 36Cl/Cl age of B17-IW1 from the lower ice complex is distinctly older than the OSL ages from the lower ice complex but falls well into the uncertainty range of both pIRIR ages (Fig. 7). These results support the earlier finding of Blinov et al. (Reference Blinov, Alfimov, Beer, Gilichinsky, Schirrmeister, Kholodov, Nikolskiy, Opel, Tikhomirov and Wetterich2009) that the strength of the 36Cl/Cl method is to get age estimates for ice on long (i.e., glacial–interglacial) time scales, whereas it is not able to sufficiently resolve shorter (i.e., multimillennial) age differences between ice wedges. Due to the long lifetime of 36Cl (434 ka), the method is more applicable to old (Middle Pleistocene) ice wedges than to younger (Late Pleistocene) ones.
However, the method's critical assumption is that the ratio of concentrations of cosmogenic 36Cl to stable chlorine at a given time corresponds to the mean atmospheric value, which remains constant during the period of stable climatic conditions. As the potential influence of climatic changes cannot be excluded or quantitatively estimated so far, the results of the 36Cl/Cl method should not be used as the only source of information but as supplementary evidence in combination with other dating results.
Dating synthesis
The new age estimates obtained from the four dating methods can be compared with the full data set of ages (Tables 3, 5, and 6) to evaluate the likely age of the lower ice complex, the upper ice complex, and the upper sand (Fig. 8). The lower ice complex provides two pIRIR ages of 658 ± 74 ka and 693 ± 97 ka from sand that, within uncertainties, are indistinguishable not only from each other but also from a single deduced 36Cl/Cl age of 624 ± 51 ka from ice wedge B17-IW1. Accepting the caveats of pIRIR250 Lx/Tx saturation, this consistency provides reasonable confidence that the lower ice complex developed during the early Middle Pleistocene or earlier, and we provisionally suggest an age of about 650 ka (MIS 16) or earlier.
The upper ice complex shows reasonable agreement between ages from three of the four dating methods. Sixteen finite 14C ages of ~50 to 27 cal ka BP and seven nonfinite 14C ages from different sections within the slump, one deduced 36Cl/Cl age of 51 ± 30 ka, and one OSL age of 67.6 ± 9.9 ka point to the development of the upper ice complex during MIS 3, possibly ceasing during the early part of MIS 2. Nonetheless, we suspect that some of the 14C ages near the effective limit of 14C dating (~40–50 ka) underestimate the true age of ice-complex development, which could have started earlier during MIS 4.
The upper sand unit also shows reasonable agreement between ages from two of the dating methods. Eight finite 14C ages of ~42 to 15 cal ka BP and two nonfinite 14C ages are fairly similar to the three quartz OSL ages of 40.0 ± 3.9 ka, 41.0 ± 3.9 ka, and 27.1 ± 2.1 ka. These OSL ages are affected by feldspar contamination, but removal of this contaminant from GL17172 suggests any shift in age would be statistically insignificant at these depths. The agreement is strengthened if we select only those organic samples that were demonstrably in situ (i.e., rootlets) or that included delicate organic material (e.g., Empetrum nigrum leaves) that is unlikely to have survived much reworking. This selection provides three finite 14C ages from in situ rootlets of ~27 and 22 cal ka BP from a depth of ~1 m below the ground surface and one age of ~41 ka BP from a depth of 18.5 m. Additionally, a single age of ~42 cal ka BP was obtained from a depth of ~11 m, though the sample is considered less reliable than the rootlets on account of its composite nature (leaf, twigs, and Cyperaceae remains). The three pIRIR ages of 61.0 ± 3.7 ka, 50.9 ± 3.5 ka, and 45.5 ± 2.9 ka are somewhat greater than the 14C and OSL ages, which we attribute to residual doses within the K-feldspars. No deduced age is available from the 36Cl/Cl method, because we used ice wedge B17-IW5 from the upper ice complex as a reference and hence cannot calculate an age for ice wedge B17-IW4. Overall, we infer that the upper sand unit accumulated during MIS 3 and 2, though further dating is needed to corroborate this and to determine the time when deposition commenced.
Palaeoenvironmental significance
The dating results (Fig. 8) suggest that the lower ice complex formed during or before MIS 16 (~677–622 ka), a pronounced glacial period with substantial glaciations in the Northern Hemisphere (Batchelor et al., Reference Batchelor, Margold, Krapp, Murton, Dalton, Gibbard, Stokes, Murton and Manica2019). Direct dating of permafrost to ~650 ka represents the oldest known permafrost in western Beringia and the second-oldest known ice in the Northern Hemisphere. The ancient permafrost at Batagay dates from the early part of the Middle Pleistocene, which began ~774 ka, during MIS 19 (Head, Reference Head2019). Only permafrost from the Klondike, Yukon, in eastern Beringia, is known to be older than that at Batagay and dates to ~740 ka (Froese et al., Reference Froese, Westgate, Reyes, Enkin and Preece2008). The ancient permafrost at Batagay indicates that ice-rich permafrost has survived repeated episodes of climate warming, including multiple glacial terminations and even the exceptionally warm and wet conditions during a “super-interglaciation” at 420 ka (MIS 11c; Vaks et al., Reference Vaks, Gutareva, Breitenbach, Avirmed, Mason, Thomas, Osinzev, Kononov and Henderson2013, Reference Vaks, Mason, Breitenbach, Kononov, Osinzev, Rosensaft, Borshevsky, Gutareva and Henderson2020; Wennrich et al., Reference Wennrich, Andreev, Tarasov, Fedorov, Zhao, Gebhardt and Meyer-Jacob2016), the warmer-than-present last interglaciation (MIS 5e; CAPE, 2006), and the warm climate of the Holocene thermal maximum (Kaufman et al., Reference Kaufman, Ager, Anderson, Anderson, Andrews, Bartlein and Brubaker2004; Renssen et al., Reference Renssen, Seppä, Heiri, Roche, Goosse and Fichefet2009). Clearly, the remaining lower ice complex, buried under ~50 m of covering permafrost deposits, has been resilient to natural climate and environmental change over multiple glacial–interglacial cycles (Fig. 8), though it is vulnerable to anthropogenic disturbance and local thermokarst activity (Murton et al., in press). Additionally, the thaw unconformity and erosional surface at the top of the lower ice complex (Fig. 3) indicate that this ice complex experienced partial thaw and erosion before deposition of the lower sand unit; thaw and erosion of unknown magnitude occurred on one or more occasions between MIS 16 and 4.
The direct dating of permafrost at Batagay to ~650 ka or earlier can be compared with inferences about permafrost conditions based on indirect evidence from western Beringia. The onset of permafrost during the late Pliocene has been inferred from pollen spectra consistent with a change in vegetation toward tundra and cold-adapted larch–birch forest from samples in and near Lake El'gygytgyn in Chukotka, northeastern Russia (Glushkova and Smirnov, Reference Glushkova and Smirnov2007; Andreev et al., Reference Andreev, Tarasov, Wennrich, Raschke, Herzschuh, Nowaczyk, Brigham-Grette and Melles2014; Brigham-Grette et al., Reference Brigham-Grette, Melles, Minyuk, Andreev, Tarasov, DeConto and Koenig2013; Fig. 1a) and from a reduction of Ca2+ flux into the lake, attributed to reduced chemical weathering in the catchment, after 3.3 Ma, during the M2 cooling event (Wennrich et al., Reference Wennrich, Minyuk, Borkhodoev, Francke, Ritter, Nowaczyk, Sauerbrey, Brigham-Grette and Melles2014). The present study cannot confirm a late Pliocene onset of permafrost in western Beringia, because such permafrost may have thawed and re-formed multiple times during the late Pliocene and Early Pleistocene, but it does provide robust evidence that the permafrost of the lower ice complex has persisted at the Batagay site continuously since at least ~650 ka. Such persistence is consistent with the absence of observed speleothem growth—due to permafrost freezing up the karst vadose system in caves—since ~429 ka (MIS 11) in a Siberian cave (Ledyanaya Lenskaya) near the boundary between continuous and discontinuous permafrost (see Vaks et al., Reference Vaks, Gutareva, Breitenbach, Avirmed, Mason, Thomas, Osinzev, Kononov and Henderson2013, Reference Vaks, Mason, Breitenbach, Kononov, Osinzev, Rosensaft, Borshevsky, Gutareva and Henderson2020).
Given its great age, the permafrost of the lower ice complex offers excellent potential for preservation of ancient flora and fauna, including remains of environmental DNA as well as palaeoclimate proxies (ice, sediments), back to the early Middle Pleistocene. However, some limitations must be considered. Most prominent are gaps in the stratigraphy (e.g., erosional surfaces) that complicate correlation of the stratigraphy at Batagay with those from other Beringian sites.
CONCLUSIONS AND OUTLOOK
Four conclusions are drawn from this study. First, good agreement of age estimates between two independent dating methods (pIRIR dating of K-feldspar from sand and 36Cl/Cl dating of ice-wedge ice) provides a reasonable degree of confidence in dating ancient permafrost that has persisted since before the last interglaciation.
Second, the 36Cl/Cl method provides a valuable means of dating ancient ground ice. The method is more applicable to old (Middle Pleistocene) ice wedges than to younger (Late Pleistocene) ones.
Third, if the pIRIR and 36Cl/Cl dating are correct, ancient permafrost within the lower ice complex at Batagay megaslump has been preserved since the early Middle Pleistocene (~650 ka or earlier) and represents the oldest known permafrost that has been directly dated in western Beringia and the second-oldest known dated permafrost in the Northern Hemisphere.
Fourth, the ancient permafrost at Batagay has been resilient to multiple episodes of climate warming and environmental change but is vulnerable to local disturbance by anthropogenic and thermokarst activity.
In terms of outlook, multiple dating methods—including 14C, pIRIR, OSL, and 36Cl/Cl—are needed to date ancient permafrost, and a future priority should be to apply them to silt-rich yedoma in western Beringia in which palaeomagnetic dating can be added to the methods used in the present study. Further sampling campaigns should seek to secure larger (~1 kg) sediment samples to expand the number of luminescence aliquots and range of measurements, including direct assessment of pIRIR250 residual doses, post-H2SiF6 quartz analysis, and investigation of the quartz age barrier at Batagay through thermally transferred OSL dating (Duller and Wintle, Reference Duller and Wintle2012). Tephras or microtephras should also be sought in western Beringia, as they have proved invaluable in dating of permafrost sequences in eastern Beringia. Future permafrost dating studies at the Batagay megaslump are needed to confirm the obtained results and to shed light on the disconformities between the lower ice complex and the lower sand as well as the lower sand and the woody debris layer.
Acknowledgments
Parts of this research were carried out at the Ion Beam Centre (IBC) at the Helmholtz-Zentrum Dresden-Rossendorf e. V., a member of the Helmholtz Association. We would like to thank the DREAMS operator team, Roberto Llovera, Collin Tiessen, and René Ziegenrücker, for their assistance with AMS measurements. We thank Kseniia Ashastina (Max Planck Institute for the Science of Human History) and Petr Danilov and Vasiliy Boeskorov (North-East Federal University) for field assistance in 2017. We thank referees Duane Froese and Olav Lian and editors Jeff Pigati and Nicolas Lancaster for their valuable comments on earlier versions of the article.
Financial Support
This research was supported by the Deutsche Forschungsgemeinschaft (grant nos. OP217/3-1, OP217/4-1, and WE4390/7-1) and by the Royal Society (grant no. IE150192 to Mary Edwards, University of Southampton).


 Open access