


INTRODUCTION
Education is perhaps the most generally used independent variable in public opinion research. Yet the extent to which a person is educated, which is the predominant way in which education is conceptualized in political science, is just one way in which education may affect political beliefs and behavior. In this article, we suggest that the substantive field of education has an independent, and important, role to play over and above the level of education.
We suspect that this holds for many topics in public opinion research. However, space constraints lead us to select one in particular: voting for GAL (or green) and TANFootnote 1 (or nationalist) parties in Europe. This topic has generated an extensive literature that seeks to understand the social bases of the socio-cultural divide. Recent research reveals that the level of a person’s education plays directly into this conflict: most GAL voters have college degrees; most TAN voters have only secondary education.
The question we pose and seek to answer is whether it makes sense to extend our understanding of education to include its substance—that is a person’s field of education—in addition to its level. In the next section, we explain why we think this is worth doing.
EDUCATION AND THE SOCIO-CULTURAL DIVIDE
A growing body of evidence reveals that a person’s education is profoundly related to their attitudes and behavior. However, the reasons for this are subject to debate (e.g., Bornschier et al. Reference Bornschier, Häusermann, Zollinger and Colombo2022; De Jong and Kamphorst Reference De Jong and Kamphorst2024; Ivarsflaten and Stubager Reference Ivarsflaten, Stubager and Rydgren2013). Why does level of education matter for vote choice (Abou-Chadi and Hix Reference Abou-Chadi and Hix2021; Kitschelt and Rehm Reference Kitschelt and Rehm2023)? Is the level of a person’s education a cause, or is it a consequence of processes earlier in a person’s life (Cavaillé and Marshall Reference Cavaillé and Marshall2019; Kuhn, Lancee, and Sarrasin Reference Kuhn, Lancee and Sarrasin2021; Scott Reference Scott2022)? Our prior is that these questions apply with no less force to the substance as to the level of education.
We seek to make three contributions. Our core finding is that voting on the divide depends on the human-centeredness of a person’s education. Second, we propose a parsimonious index to measure this. Third, we provide a causal explanation by examining the timing of the effect on a person’s life.
Fields of education vary widely in their content, methods of analysis, modes of explanation, and intellectual discourse (Ladd and Lipset Reference Ladd and Lipset1975; van de Werfhorst, de Graaf, and Kraaykamp Reference van de Werfhorst, de Graaf and Kraaykamp2001). What a person studies has implications for their material benefits, social status, employment opportunities, social networks, and arguably for their worldview (Iannelli, Gamoran, and Paterson Reference Iannelli, Gamoran and Paterson2018; Schulz, Solga, and Pollak Reference Schulz, Solga and Pollak2023; Somers et al. Reference Somers, Cabus, Groot and van den Brink2019). Our guiding hypothesis is that the degree to which a person’s education engages human behavior in its diverse social and cultural contexts predicts their voting on the contemporary socio-cultural divide, that is for GAL or TAN parties.
GAL and TAN parties take explicit stands on a transnational cleavage involving the cosmopolitan defense of immigration and European integration on the one side and the protection of national culture and national sovereignty on the other (Dassonneville, Hooghe, and Marks Reference Dassonneville, Hooghe and Marks2024; De Vries Reference De Vries2018; Ford and Jennings Reference Ford and Jennings2020). This extends Lipset and Rokkan’s (Reference Lipset, Rokkan, Lipset and Rokkan1967) cleavage theory which conceives party families as the expression of oppositions that are not assimilated by extant political parties (Häusermann and Kriesi Reference Häusermann, Kriesi, Beramendi, Häusermann, Kitschelt and Kriesi2015; Hooghe and Marks Reference Hooghe and Marks2018; Reference Hooghe and Marks2022; Kriesi et al. Reference Kriesi, Grande, Lachat, Dolezal, Bornschier and Frey2006). A cleavage perspective anticipates that such oppositions are embedded in social characteristics (Langsæther Reference Langsæther2023; Marks et al. Reference Marks, Attewell, Hooghe, Rovny and Steenbergen2023). An extensive literature finds that education plays directly into GAL and TAN voting; our claim is that the substance of a person’s education provides substantial additional leverage.
Our second contribution focuses on measurement. Beyond the lack of data, it has proven difficult to conceptualize and operationalize fields of education in ways amenable to vote choice models. In most research, educational field has been conceived as a series of nominal categories for individual fields or it has been aggregated using the STEM (science, technology, engineering, math) categorization. The former approach requires at least a dozen dummy variables. The latter approach is more parsimonious, but it is not well fit for the purpose of modeling voting.Footnote 2
Building on the work of sociologists, we operationalize field of education as a continuous variable that captures the human-centeredness of a person’s education as the weight of cultural-communicative skills relative to economic-technical skills, in short, CECT (Cultural, Economic, Communicative, and Technical).
Our third contribution is to explain when and how a person’s field of education affects their voting. We distinguish between (1) self-selection prior to a person’s education in a particular field which is the result of a person’s upbringing, their genetic make-up, and their family and friend networks (Corno and Carlana Reference Corno and Carlana2021; Kunst Reference Kunst2022; Zollinger and Attewell Reference Zollinger and Attewell2023); (2) the direct effect of the educational process itself which is the result of the particular skills learned, the values conveyed, and socialization in field-related networks (Stubager Reference Stubager2008; Surridge Reference Surridge2016); and c) a post-education effect arising from the field content of a person’s occupation (Kitschelt and Rehm Reference Kitschelt and Rehm2014). We find that stronger links in the causal chain are forged early in life—even before a student enters a field specialization. However, in contrast to much current research on the level of education, we also find that a person’s field of education has a direct effect during the educational process and a post-education effect in a person’s subsequent occupation.
Any account of the effect of field of education on voting faces several inferential challenges. Perhaps most obviously, we need to deal with the imbalance of field specializations across levels of education. Some fields, like agriculture or technical training, are biased to secondary education while others, including law, social sciences, and natural sciences, are more predominant in post-secondary education. This raises the possibility that the variance associated with field of education is, at least in part, a function of level of education. In response, we uncover a statistically significant and substantial field effect among both lower educated and higher educated, consistent with the claim that the association between a person’s field of education and their vote choice is independent of whether they attended college.
Further, we need to examine the possibility that occupational location accounts for the effect of educational field. This is an acute question because, after level of education, the second most powerful influence on GAL and TAN voting is a person’s occupation (Häusermann and Kriesi Reference Häusermann, Kriesi, Beramendi, Häusermann, Kitschelt and Kriesi2015; Kitschelt and Rehm Reference Kitschelt and Rehm2014; Oesch and Rennwald Reference Oesch and Rennwald2018). Beyond controls for occupational categories, we introduce models that consider the knowledge content of an occupation, which we measure as its average educational field score. Both a person’s field score and the knowledge content of their occupation are robustly significant in models that include an array of dichotomous variables for occupations.
A prominent concern for any analysis of education and voting is the marked gender imbalance across fields. Engineering, for example, is disproportionately male, while the arts and humanities are disproportionately female. At the same time, we also know that women are more likely than men to vote GAL, and men are more likely than women to vote TAN (Abou-Chadi, Breyer, and Gessler Reference Abou-Chadi, Breyer and Gessler2020; Dancygier Reference Dancygier2020; Harteveld and Ivarsflaten Reference Harteveld and Ivarsflaten2018). To what extent, then, is the association between educational field and voting on the socio-cultural divide a product of the gendering of fields? We confirm that field has a strong and significant effect independent of gender.
Finally, we need to assess the robustness of our claims in different national contexts. Prior research on the political attitudes of those in different educational fields has used datasets confined to a single country, yet our theory applies more broadly. The force of this concern is heightened by research revealing that the socio-cultural divide differs across space and time (Boräng, Naurin, and Polk Reference Boräng, Naurin and Polk2023; Grande and Kriesi Reference Grande, Kriesi, Kriesi, Grande, Dolezal, Helbling, Höglinger, Hutter and Wüest2012; Hutter and Kriesi Reference Hutter and Kriesi2019), and that competition between GAL and TAN parties is mediated by institutions (Gidron, Adams, and Horne Reference Gidron, Adams and Horne2023; Koedam, Binding, and Steenbergen Reference Koedam, Binding and Steenbergen2023), historical legacies (Rovny and Polk Reference Rovny and Polk2019), and party strategy (Rovny Reference Rovny2013; Weeks et al. Reference Weeks, Meguid, Kittilson and Coffé2023).
In the next section, we set out expectations relating field of education to GAL and TAN voting before theorizing the timing of the effect over a person’s life, that is, prior, during, and following education in a specific field. We then assess the validity of these priors along two paths. First, we exploit the power that comes with large-N cross-sectional data from the European Social Survey to probe the association between educational field and vote choice. This allows us to impose a range of statistical controls, to subset the sample into theoretically meaningful groups, and to show the robustness of our core claims across a variety of countries. We then use Dutch panel data (LISS) and the German Socio-Economic Panel (SOEP) to identify the influence of education over a person’s life. While the weightiest effects arise from self-selection into a field of education, we also detect a direct effect of education as well as a post-education effect through the field-specific content of someone’s occupation. We conclude by summarizing our findings and some implications for future research.
FIELD OF EDUCATION AND VOTING ON THE CONTEMPORARY DIVIDE
In this section, we outline a field theory of voting focusing on the skills conveyed in an educational field. Our hypothesis is that human-centered fields have an affinity with GAL voting, while those with little human-centered content have an affinity with TAN voting.
Following Kraaykamp, Tolsma, and Maarten (Reference Kraaykamp, Tolsma and Maarten2013) and van de Werfhorst and Kraaykamp (Reference van de Werfhorst and Kraaykamp2001), we consider four skills that differentiate fields of education:
-
• Cultural: the extent to which a field rewards expertise in artistic, literary, and cultural expression. Those who select into a cultural field are trained in historical analysis, artistic judgment, writing, and reading.
-
• Communicative: the extent to which a field rewards expertise in social interaction, group instruction, and public speaking. Those who select into a communicative field are trained in presentation skills, social scientific analysis, psychology, communication, and teaching.
-
• Economic: the extent to which a field rewards expertise in business and market behavior. Those who select into an economic field are trained in management, accounting, commerce, and law.
-
• Technical: the extent to which a field rewards expertise in production processes and concrete tasks. Those who select into a technical field are trained in machinery use, automation, mathematical calculation, and test procedures.
This fourfold schema is intended to encompass the range of skills conveyed in education, extending Bourdieu’s (Reference Bourdieu1984) theory of cultural and economic capital.Footnote 3 Two of these skills—cultural and communicative—summarize our core expectation that human-centered education is associated with voting on the socio-cultural cleavage.
Cultural-communicative fields consider how human interaction shapes individual and collective experience. While their methods and content vary, both engage human behavior in its diverse contexts (Maxwell Reference Maxwell2020, 6). Fields with a strong cultural component foster creative expression and esthetic appreciation as they expose students to different cultural narratives and encourage students to engage—and appreciate—diversity of norms and ways of life. By promoting an understanding of the social constraints under which people act, communicative education enhances interpersonal skills and cultural tolerance. To the extent that “people learn certain ways of explaining social events as a byproduct of their professional training,” cultural-communicative training alerts students to the “impact of the cultural context on the development of causal judgments” (Guimond, Begin, and Palmer Reference Guimond, Begin and Palmer1989, 127–8). A capacity to “better understand and appreciate other people’s standpoints” has been linked to liberal gender-role attitudes (van de Werfhorst and de Graaf Reference van de Werfhorst and de Graaf2004, 216); progressive attitudes on social issues (Carnevale et al. Reference Carnevale, Smith, Drăzanová, Gulish and Campbell2020, 18 and Table C1); cosmopolitanism (Maxwell Reference Maxwell2020); and libertarian attitudes on immigration/multiculturalism (Magni Reference Magni2024). These attitudes are in line with the ideological underpinnings of GAL parties which typically “support the cultural opening of European societies, as they do not see much importance in the conservation of their countries’ national identities and traditional ways of life; in addition, they are open toward concerns for racial equality and rights for immigrants” (Dolezal Reference Dolezal2010, 542).
The educational schema distinguishes economic skills from those conveyed by other social sciences. Material incentives—chiefly income and capital—are considered decisive for how markets function, how prices allocate resources in response to supply and demand, and how business is managed. While economic skills can be expected to chiefly bear on the economic left–right dimension of conflict, we suspect that they also lean to the TAN side of the socio-cultural divide. The “general expectation is thus that people who have acquired extensive economic educational resources are materialistic in their consumption and conservative in their sociopolitical orientation” (van de Werfhorst, de Graaf, and Kraaykamp Reference van de Werfhorst, de Graaf and Kraaykamp2001, 298). Students in fields oriented to economic skills tend to attribute unemployment and poverty to personal failings (Guimond, Begin, and Palmer Reference Guimond, Begin and Palmer1989, 128) and score higher on ethnocentrism (Elchardus and Spruyt Reference Elchardus and Spruyt2009, 449).
Technical skills are most distant from the human-centered skills developed in cultural-communicative fields. Technical skills are oriented to the manipulation of the natural world. While technical fields intersect with human society on a number of levels, they bracket the interpersonal concerns raised by human-centered fields. In a study of Muslim extremism, Gambetta (Reference Gambetta2016, 132, 147) finds that students in engineering display a “preference for order, structure, and certainties” and “a penchant to seek simple and unambiguous explanations of the social world and its ills.”
In all, research on the attitudes associated with educational fields suggests that the relative weight of human-centered skills in a person’s education provides a window into that person’s worldview. We extend this line of argument in two respects. First, we propose that the effect of a person’s field of education reaches beyond political attitudes to voting.Footnote 4 Second, we hypothesize that field of education is associated with voting on both sides of the socio-cultural divide. This motivates the following hypotheses:
H1a. The greater the proportion of cultural-communicative content in a person’s education, the more likely they are to vote GAL.
H1b. The smaller the proportion of cultural-communicative content in a person’s education, the more likely they are to vote TAN.
We consider three phases in a person’s life when the link between education and voting may be formed: in the educational experience itself; prior to education through self-selection into a particular field; or later in life, following education. Here we draw on research on the level of education to hypothesize when a link between field and voting might be formed.
According to the direct effect hypothesis, education has a contemporaneous effect on a student’s values through exposure to values and interactions with peers. Education’s role in conveying knowledge and honing critical thinking may promote social liberalism—a cognitive effect (Surridge Reference Surridge2016). University professors may transmit liberal values in their courses—a formal socialization, or instruction, effect (Apfeld et al. Reference Apfeld, Coman, Gerring and Jessee2023; Gross and Fosse Reference Gross and Fosse2012; Ladd and Lipset Reference Ladd and Lipset1975; Lazarsfeld and Thielens Reference Lazarsfeld and Thielens1958). And universities as sites where young people experiment with diverse ideas and practices may nurture liberalism—an informal socialization or peer effect (Carnevale et al. Reference Carnevale, Smith, Drăzanová, Gulish and Campbell2020). We hypothesize that these mechanisms do not solely pertain to a person’s level of education, but also their field. In short, a person’s attitudes may change because of the skills they learn and how these skills are reinforced by the people they interact with during their education (Hyman and Wright Reference Hyman and Wright1979; Scott Reference Scott2022; Surridge Reference Surridge2016).
Alternatively, the self-selection hypothesis states that experiences prior to education shape both a person’s political attitudes and their educational choices. Hence there is no direct effect of education: Variables tapping a person’s education serve as proxy for experiences earlier in life (e.g., Corno and Carlana Reference Corno and Carlana2021; Kunst, Kuhn, and van de Werfhorst Reference Kunst, Kuhn and van de Werfhorst2023). The role of parents looms large among the possible sources of self-selection (Hyman and Wright Reference Hyman and Wright1979; Lancee and Sarrasin Reference Lancee and Sarrasin2015) as does inherited social class (Breen and Müller Reference Breen and Müller2020). The type of diploma obtained may reflect the social milieu in which people are raised and socialized (Bourdieu Reference Bourdieu1984). Once again, research is heavily oriented to the level of education, but recent Dutch and Norwegian studies show substantial association between the educational fields of parents and children (Helland and Wiborg Reference Helland and Wiborg2019; van de Werfhorst, de Graaf, and Kraaykamp Reference van de Werfhorst, de Graaf and Kraaykamp2001).
Finally, the post-education hypothesis considers that a person’s field of study shapes their working life beyond the years they spend in education. The principal expectation here is that “education leads to differences in values by constituting groups with different material interests and capabilities” (Stubager Reference Stubager2008, 333). According to this view, education’s indirect effect stems from its allocative effect on income, economic security, and status. For example, a person who studies finance or medicine is more likely to have a higher income or social status, and this can influence their voting behavior.
Although Stubager (Reference Stubager2008) and van de Werfhorst, de Graaf, and Kraaykamp (Reference van de Werfhorst, de Graaf and Kraaykamp2001) discuss the contrasting effects of educational fields in conveying values on the libertarian-authoritarian dimension, the literature on education has focused primarily on level of education, and within that on the difference between secondary and post-secondary education. The predominant finding is that individuals chiefly self-select into post-secondary education and that, as a consequence, variables tapping a person’s education and post-education experience are a proxy for experiences prior to education (Lancee and Sarrasin Reference Lancee and Sarrasin2015; Margaryan, Paul, and Siedler Reference Margaryan, Paul and Siedler2021).
However, we need to examine field of education with a fresh mind. There is good reason to believe that the substance of a person’s education may be no less formative for a person’s political values than whether they went to college or not. Fields of education foster distinct cultural, economic, communicative, and technical skills; they engage students in social networks; and they prepare for distinctive, often lifelong, occupational experiences. Hence, we need to entertain the possibility that the direct and post-education effects may be more causally powerful for field of education than for level of education.
Our expectations regarding the mechanisms through which field of education influences voting behavior are summarized as follows:
H2. Differences in voting behavior on the socio-cultural divide are formed during education in a given field.
H3. Differences in voting behavior on the socio-cultural divide are formed prior to education in a given field.
H4. Differences in voting behavior on the socio-cultural divide are formed after education in a given field.
Building on hypothesis H4, we theorize that the logic of educational field extends through a person’s occupation. Research on the effect of going to college focuses, for good reason, on its allocative effects for a person’s life chances, but research on field of education needs to be more encompassing. A person’s field defines the skills that can shape a person’s working life—the nature of the occupation, its social networks, and its work logic.
The field basis of an occupation—defined as what those in an occupation have on average studied—can be conceptualized as varying along the cultural-communicative versus technical-economic dimension. Cultural-communicative skills underpin the work logic of occupations such as social work and teaching for which social interaction, cultural understanding, and empathy are necessary. Technical-economic skills underpin the work logic of occupations related to engineering and marketing for which technical expertise and management are necessary. To the extent that the field basis of an occupation reinforces its work logic and patterns of social interaction, so we may expect to find that those in an occupation employing workers with a higher than average cultural-communicative education will lean GAL and those in occupations employing workers with higher than average technical-economic education will lean TAN.
Beyond the experience of the job itself, social closure in the occupation may exert a socialization effect as a response to repeated interaction with other workers (Zacher and Rudolf Reference Zacher and Rudolf2023). The classic literature on socialization and normative control finds that field-specific education, training, and apprenticeship for an occupation “solidifies preexisting attitudes, instills explicit codes of behavior, or otherwise generates homogeneity among recruits” (Kitschelt and Rehm Reference Kitschelt and Rehm2014; Weeden and Grusky Reference Weeden and Grusky2005, 151). Employees may observe how others approach their work or interact informally, with the potential for shared worldviews to emerge around the predominant educational background of those working in the occupation.
The argument proposed here has much in common with an occupational theory of vote choice which distinguishes, on one axis, occupations with an interpersonal work logic from those that have a technical or organizational work logic, and a second axis, the level of marketable skills in the occupation (Kitschelt and Rehm Reference Kitschelt and Rehm2014, Table 2; Oesch Reference Oesch2006, Table 2). Both occupational theory and field theory use the ISCO coding of occupations as units of analysis to predict political preferences. However, they utilize contrasting methods to generate expectations. Whereas occupational theory codes occupations into discrete categories by hand, field theory estimates the educational skills of those employed in an occupation to predict their political preferences.
H4a. The greater the proportion of cultural-communicative content in a person’s occupation, the more likely they are to vote GAL.
H4b. The smaller the proportion of cultural-communicative content in a person’s occupation, the more likely they are to vote TAN.
DATA AND MEASURES
We adopt the European Social Survey (ESS) to assess the relationship between educational field, social bases, and vote choice for GAL and TAN parties. To evaluate whether self-selection into education or experiences during or after education undergird the effect of educational field, we turn to panel data from the Dutch Longitudinal Internet Studies for the Social Sciences (LISS) and the German Socio-Economic Panel (SOEP). These longitudinal panels contain not just respondents’ highest completed degree, but their field of study.
The 2004, 2006, and 2008 waves of the European Social Survey are the only waves that contain information on respondents’ substantive field of education.Footnote 5 The unit of observation is the respondent who is at least 21 years old and who reports which party they voted for in the last national election.Footnote 6 We extract dichotomous dependent variables—voting GAL or voting TAN—from this vote choice item. To categorize parties on the socio-cultural divide, we follow the Chapel Hill Expert Survey classification (Jolly et al. Reference Jolly, Bakker, Hooghe, Marks, Polk, Rovny and Steenbergen2022). The TAN party bloc consists of radical right or radical-nationalist parties; the GAL party bloc consists of Green parties, social-liberal parties, and new left parties. Hence, the ESS sample consists of 15 European countries in 2004, 2006, and 2008 where a GAL party, a TAN party, or both parties were on the ballot.Footnote 7
To estimate the effect of our chief independent variable, field of education, we adapt information from the 1998 Family Survey of the Dutch Population asking respondents to assess how much each of 16 skills was emphasized in their education (van de Werfhorst, de Graaf, and Kraaykamp Reference van de Werfhorst, de Graaf and Kraaykamp2001). These are grouped into four categories: cultural, economic, communicative, and technical. The rating for each category ranges from 1 (very limited extent) to 5 (very large extent).
Our theory connects the relative preponderance of human-centered education to voting on the socio-cultural divide. We measure the prominence of cultural and communicative skills for understanding human coexistence relative to economic and technical skills. Because these skills are assumed to be independent of each other, and additive, in that their sum measures a person’s educational resources, we can combine them in a part-to-whole ratio measure. The variable, CECT, is estimated as follows: for a given field, it is the ratio of communicative plus cultural skills to the sum of the four skill categories:
 $$ \mathrm{CEC}{\mathrm{T}}_i=\frac{\mathrm{c}\mathrm{ommunicativ}{\mathrm{e}}_i+\mathrm{cultura}{\mathrm{l}}_i}{\mathrm{c}\mathrm{ultura}{\mathrm{l}}_i+\mathrm{economi}{\mathrm{c}}_i+\mathrm{communicativ}{\mathrm{e}}_i+\mathrm{technica}{\mathrm{l}}_i}. $$
This variable is introduced into the ESS survey in two ways.Footnote 8 First, we project the field-specific CECT ratio to each respondent’s chief substantive field of specialization from a list of 14 fields. Each respondent who reported the field of their highest qualification receives an educational CECT score. Second, we calculate the average CECT of respondents in each ISCO-3 level occupation and we apply an occupational CECT score to each individual in that occupation. Here we take advantage of the micro-level information in ESS that identifies each respondent’s ISCO-3 digit occupation (116 categories) using the ILO’s Standard Classification of Occupations (ISCO-88). Both educational CECT and occupational CECT are rescaled 0–1 for ease of interpretation.
To estimate the allocative effect of field of education with respect to income, we calculate the average income for all respondents who report a particular field of education at each of five levels of education. Each respondent is then assigned one of 70 values depending on their level of education (five levels) within their educational field (14 fields).
We use conventional operationalizations for gender (dichotomy), level of education (five-category), age (year), location (five-category), secularism (seven-category), and income (deciles). Occupational Status classifies a person’s job or past job into eight categories using information on employment relationship, work logic, and job content derived from ISCO-88 following Oesch (Reference Oesch2006).
Supplementary Material provides information on country coverage (Table A.1) and operationalization of the independent variables (Tables A.2a, A.2b, and A.2c). Additional Material on Dataverse provides details on descriptives (Section A), the conceptual foundation of CECT (Section B), alternative operationalizations of the CECT variable (Sections C and D) and level of education (Section E), and how we categorize GAL and TAN parties (Section A).
The LISS is a true probability panel of about 5,000 Dutch households that started in 2006 (www.lissdata.nl). LISS field categories are virtually identical to the fields in the Family Survey of the Dutch Population, and GAL and TAN parties are represented in parliament for all survey years. The dependent variables are thermometer scales reporting whether a respondent finds a given party sympathetic on a 0 to 10 scale. For each respondent, we calculate their mean thermostat score for GAL parties (Groenlinks, D66, and PvdD) and TAN parties (PVV and FvD).Footnote 9
The SOEP is a true probability panel of about 15,000 German households from 1984 to 2020 (https://www.diw.de/). Aside from the benefit of a larger sample and a nearly two-decade longer time horizon, the dependent variable—vote intention—is closer to the dependent variable in the ESS survey. Green vote intention takes on a value of 1 or 0. We do not probe vote intention for a TAN party because popular support was extremely low until 2013. We compress the SOEP’s more fine-grained information on substantive education and vocational training into the field categories used for ESS and LISS. See Supplementary Tables A.8 and A.9 for a description of key independent variables in LISS and SOEP.
EDUCATIONAL AND OCCUPATIONAL CECT
We begin by visualizing the distribution of educational CECT and occupational CECT in the ESS sample in Figure 1 from lowest to highest CECT. The standard deviation for educational CECT is 0.32 and that for occupational CECT is 0.19. Observations are dispersed on educational CECT with an interquartile range of 0.43. The distribution picks up divergent scores for individuals in fields with low CECT (agriculture; technical, engineering, transport; economics and commerce), close to average CECT (health care; general education; public order and safety), and high CECT (science and math; personal care; social studies; humanities and the arts; teacher training).
Distribution of CECT in the European Social Survey
Note: The figure shows the distribution of educational and occupational CECT, whereby the bars represent the percentage of respondents with a given educational CECT score (left) and the percentage of respondents working in an occupation with a given average CECT score (right). Broken vertical lines indicate the 25th, 50th, and 75th percentiles. For example, educational CECT for those who studied engineering is 0.04; for economics students, 0.19; for medical and health students, 0.55; for social studies, 0.86; and for those who completed teacher training, 1.00. The occupational CECT score for engineers is 0.10; for builders, bricklayers, and stonemasons, 0.20; for finance or marketing managers, 0.40; for childcare workers, 0.59; for translators and interpreters, 0.70; and for primary school teachers, 1.00. ESS data for 2004–2008 for 15 European countries.
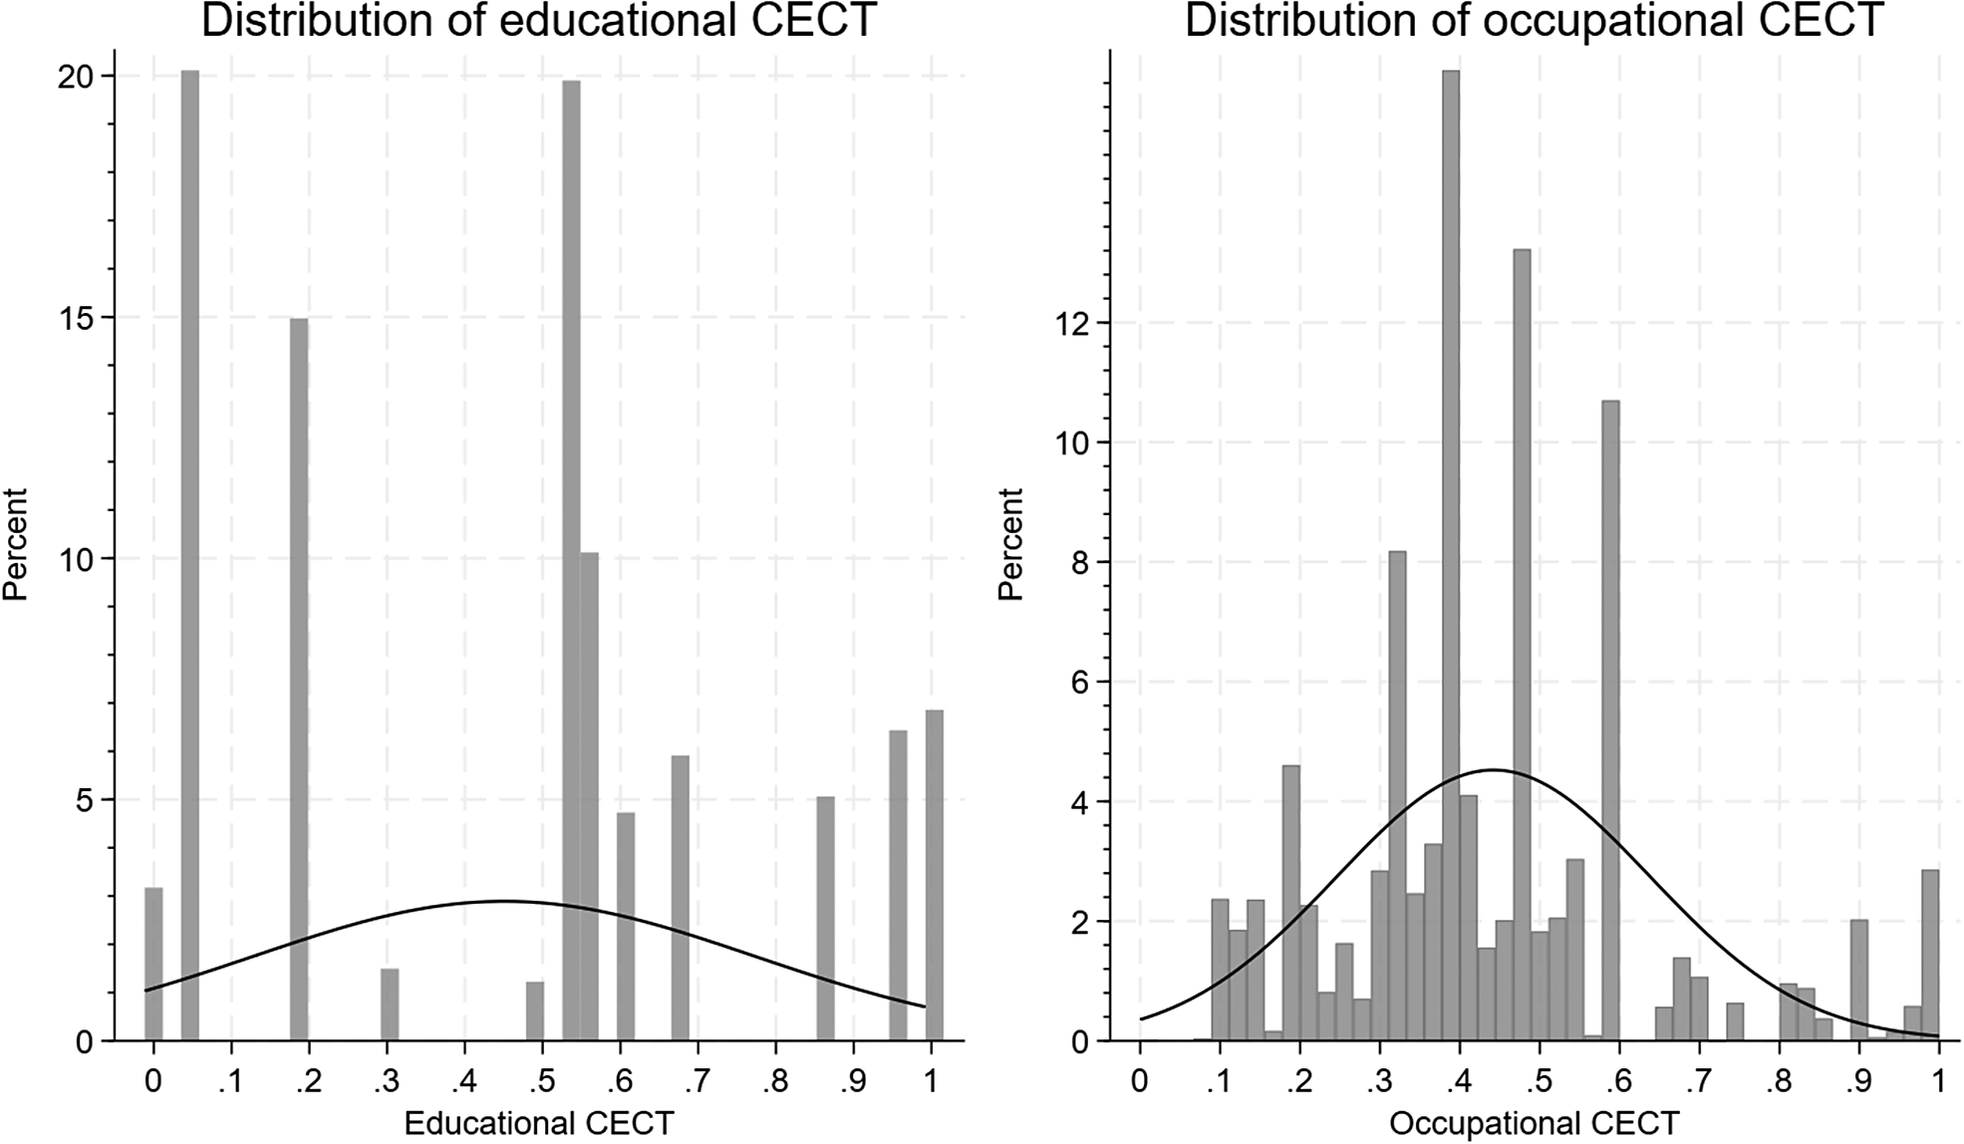
The average CECT of occupations is more single peaked. Around half of all 116 ISCO-3 occupations lie within a 0.19 band around the median (0.42), but the distribution has long tails. High CECT occupations include teachers, librarians, authors, and journalists; low CECT occupations include civil, electrical, mechanical, and chemical engineers, and crop and animal producers.
RESULTS
We begin by assessing the association between field of education and voting on the socio-cultural divide using ESS data, controlling for gender, urban/rural location, income, age, secularism, and temporal confounders. While this cannot rule out the possibility that an omitted variable causes both field and voting, using a larger N than available in panel data offers greater scope for stratification to control for confounding variables and provides greater confidence in the cross-national generalizability of our results. We employ multilevel mixed-effects logistic models in which individuals are hierarchically nested in occupations and countries.
Figure 2 reports log odds coefficients and 95% confidence intervals for GAL and TAN voting and confirms our priors concerning field of education. Educational CECT (H1a; H1b) and occupational CECT (H4a; H4b) are significant at p-levels below 0.0001 and are substantively strong. When we translate the coefficients into predicted probabilities, a one-unit increase in educational CECT—from agriculture to teaching—is associated with an increase in the probability of voting GAL from 7.2% to 13.8% (±0.7) and a decrease in voting TAN from 8.0% to 5.8% (±0.6). A one-unit increase in occupational CECT is associated with an increase in the probability of voting GAL from 7.1% to 14.1% (±0.5) and a decrease in voting TAN from 9.6% to 4.4% (±1.0).
Field of Education and Voting GAL or TAN
Note: This figure plots the coefficients for factors that explain who voted GAL or voted TAN; the coefficients express differences in log odds (with 95% intervals) from multilevel mixed-effects logistic models with oim clustering by country and ISCO-3 occupations. For example, a coefficient of 0.78 for educational CECT indicates that, for a one-unit increase in educational CECT (from 0 to 1), the log odds of voting GAL instead of any other party increase by 0.78. Translated in probabilities, this is equivalent to an increase from 7.2% to 13.8%. Educational CECT taps the cultural-communicative content of an individual’s field of education; occupational CECT taps the average educational CECT in a respondent’s ISCO-3 level occupation. Full results are in Supplementary Table A.3.
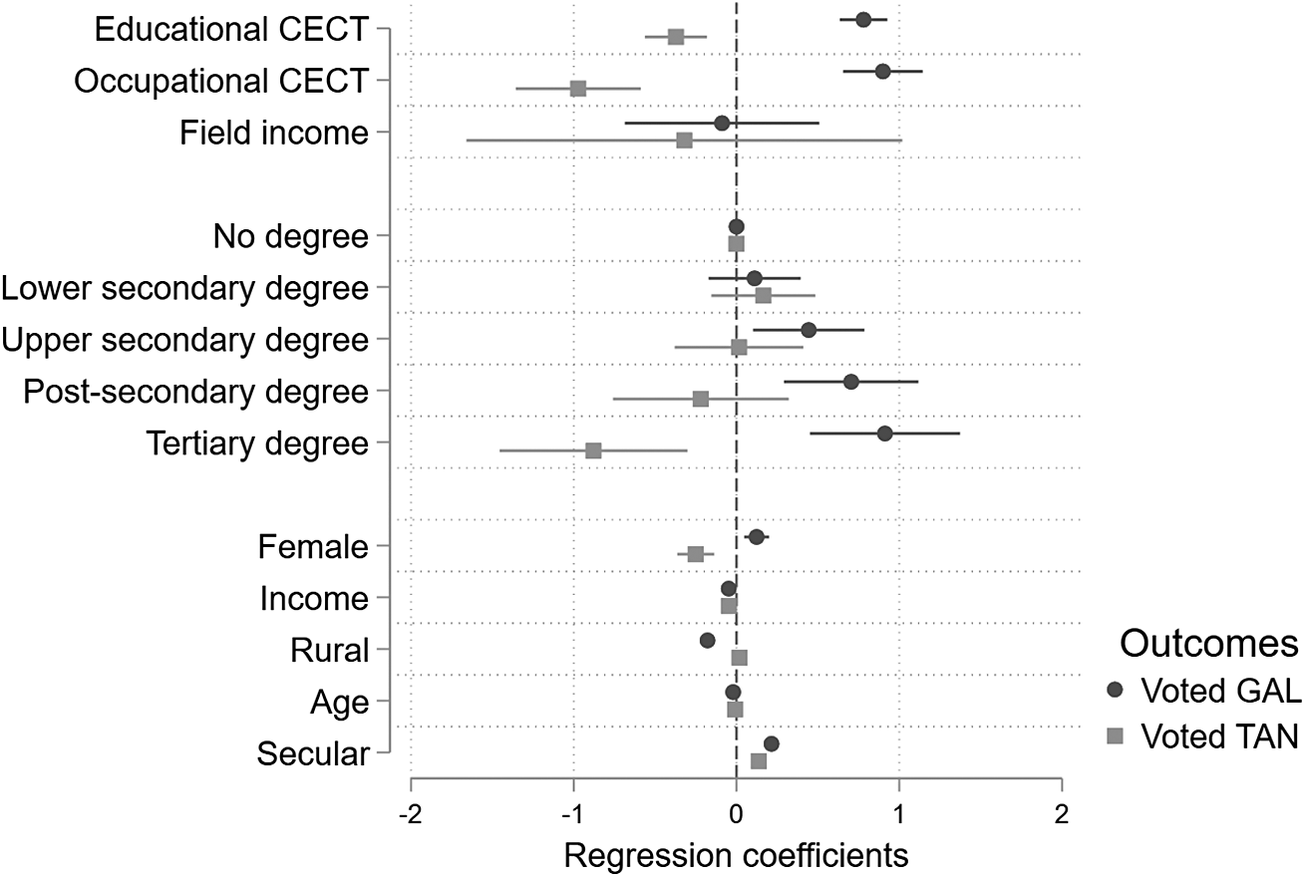
The baseline sample average for GAL voting in countries with a GAL party on the ballot is 9.6% and that for TAN voting in countries with a TAN party on the ballot is 7.0%. So the differences reported here are large in both absolute and proportional terms. Proportionately, variables tapping field of education are associated with an increase (or decrease) in voting for GAL or TAN parties ranging from 51% to 133%.Footnote 10
This analysis also confirms the significance of a person’s level of education for GAL and TAN voting. The probability that a person with tertiary education votes GAL is 13.1% compared to 6.5% for someone with less than a secondary degree, and the probability that a person with less than a secondary degree votes TAN is 9.6% compared to 3.9% for someone with a tertiary diploma.
The third variable in Figure 2 is field income—the average income of those who studied the same educational field at the same educational level—which taps the income allocative effect of field of education. This variable is insignificant in this model as in subsequent model specifications that include a five-category level of education variable. Personal income is negatively associated with both GAL and TAN voting. The results of both income variables suggest that the socio-cultural divide cannot be reduced to conflict between economic winners and losers. The coefficient for gender is smaller than either of the educational coefficients. Finally, as others have found, in Europe religion has limited bite on socio-cultural conflict: both GAL and TAN voters tend to be secular (Guth and Nelsen Reference Guth and Nelsen2021).
We next extend the model to encompass categorical controls for occupation using the conventional eight-category Oesch (Reference Oesch2006) schema. This is a stringent test for our theory because the Oesch categorization seeks to capture interpersonal work logic and hierarchical relationships that might overlap with the skill characteristics of those employed in a particular occupation—that is, the properties that CECT is designed to tap.
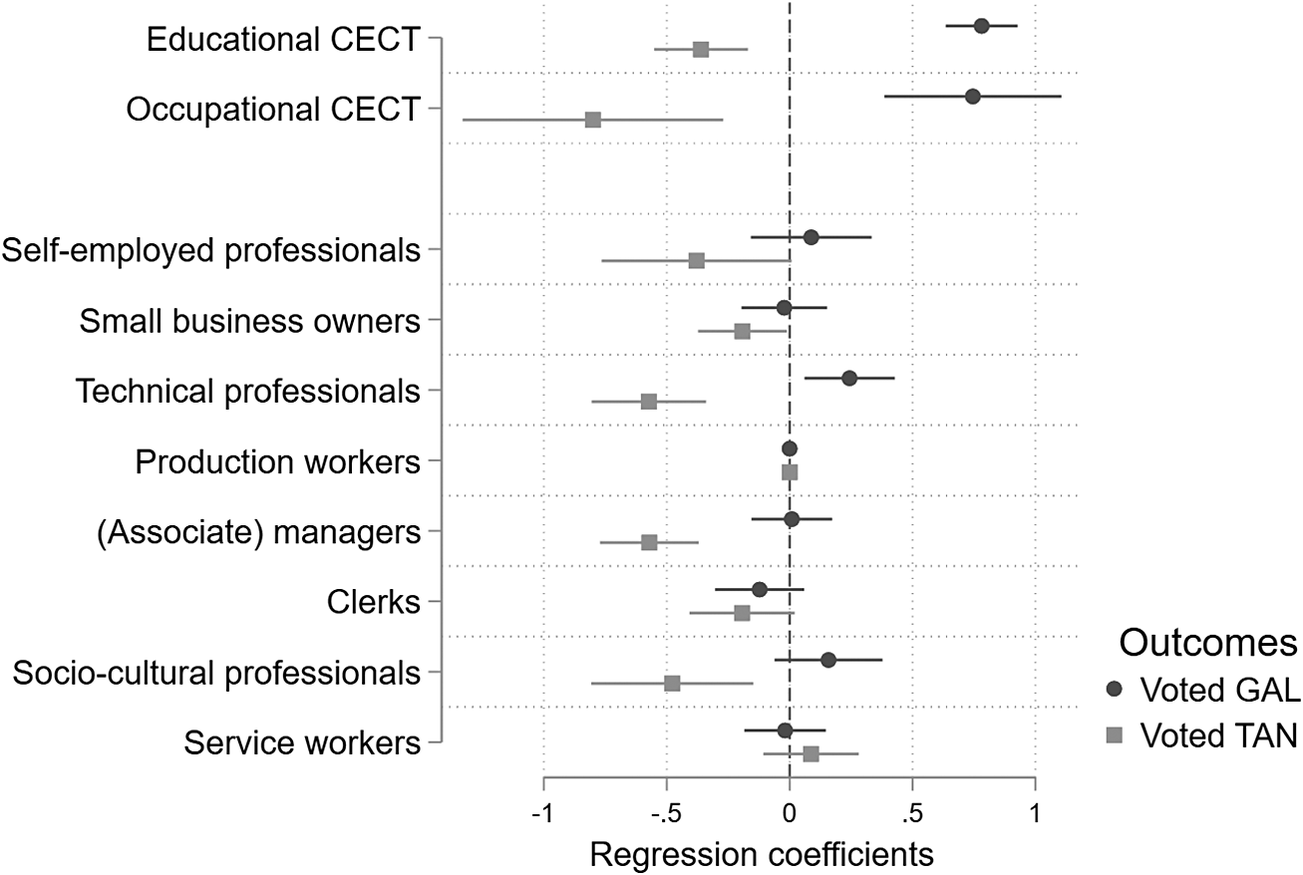
However, the results in Figure 3 reveal that both field and occupation provide useful information for predicting voting on the socio-cultural divide. Educational CECT and occupational CECT on GAL voting remain highly significant at p < 0.0001, with the coefficient for educational CECT on TAN voting at p = 0.0003 and for occupational CECT on TAN significant at p = 0.0062. The substantive effects remain large. The probability of voting GAL increases from 7.8% to 13.8% with a one-unit increase in educational CECT, and the probability of voting TAN decreases from 8.2% to 6.0%. The corresponding shifts for a one-unit increase in occupational CECT are from 7.1% to 15.8% for GAL and from 9.3% to 4.9% for TAN. It is also worth noting that this analysis confirms expectations concerning occupation and voting, with those in the professions tending to vote GAL, and production and service workers voting TAN. Hence this suggests that the underlying theories at stake are complementary rather than mutually exclusive.
Field, Occupation, and Voting GAL or TAN
Note: This figure plots the coefficients of variables that explain who voted GAL or TAN; the coefficients express differences in log odds (with 95% intervals) from multilevel mixed-effects logistic models with oim clustering by country and ISCO-3 occupations. Controls for the level of education, field income, gender, age, income, rural/urban, secularism, and time-fixed effects. For example, a log odds coefficient of −0.80 for occupational CECT means that for a one-unit increase in occupational CECT (from 0 to 1), the log odds of voting TAN decrease by 0.80. Translated in probabilities, this means a decrease in the probability of voting TAN instead of any other party from 9.6% to 4.4%. The reference category for occupation is production workers. Full results are in Supplementary Table A.4.
We now stratify the sample to conduct specification tests in response to potential inferential challenges. One such challenge arises from the fact that the incidence of post-secondary education is unevenly distributed across fields. For example, 68.2% of individuals reporting humanities as their specialization have a post-secondary degree, but only 26.4% of those specializing in agriculture do. If field merely stands in for level of education, the effect of educational CECT would disappear if we subset the sample into those with post-secondary education and those without.
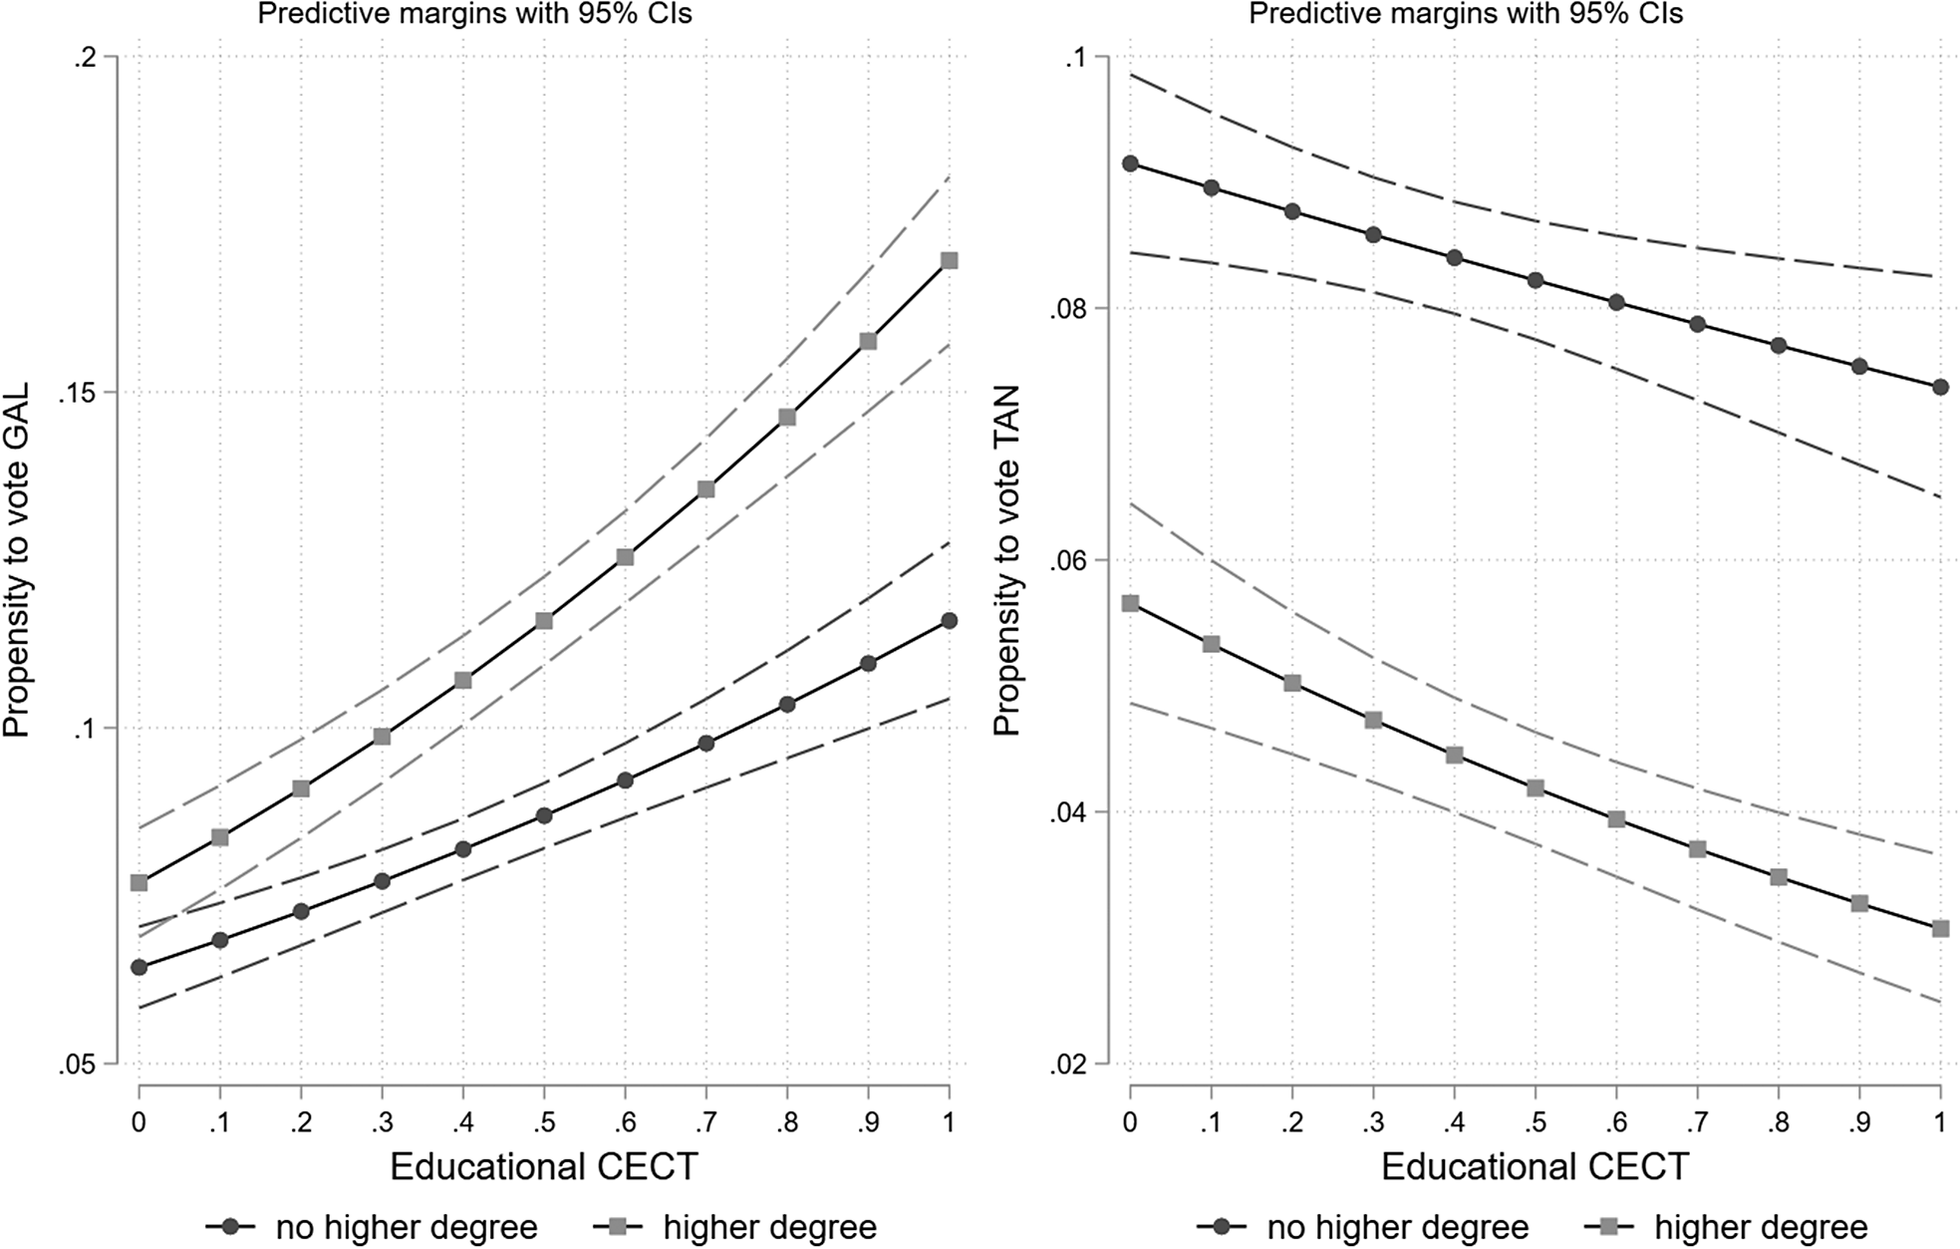
Figure 4 presents results under controls. It reveals that the association is more marked for GAL than for TAN voting, and stronger for those with post-secondary education. Educational CECT is associated at p < 0.0001 with voting GAL for both higher and lower educated individuals. For TAN voters, the association is p = 0.0007 for higher educated and p = 0.011 for lower educated individuals. In substantive terms, the probability that a person with a post-secondary degree in social studies (CECT = 0.86) votes GAL is 15.3% (±0.9%) against 7.9% (±0.6%) for a person with a post-secondary degree in engineering (CECT = 0.03). A social studies graduate has a 3.4% (±0.6%) probability of voting TAN against 5.5% (±0.8%) for an engineer. The significant association for both subsets reinforces confidence in our prior that field of education and level of education are not substitutes but have independent predictive power.
The Effect of Field of Education among Higher and Lower Educated
Note: This figure plots how the effect of educational CECT on voting GAL (left panel) or voting TAN (right panel) varies among those who completed higher education and those who did not; plotted here are predicted probabilities (with 95% confidence intervals) derived from multilevel mixed-effects logistic models with oim clustering by country and ISCO-3 category. Slopes with squares show how educational CECT (X-axis) is associated with vote propensity among higher educated (Y-axis). Slopes with circles show the same for lower educated respondents. Standard controls, with full results are in Supplementary Table A.5.
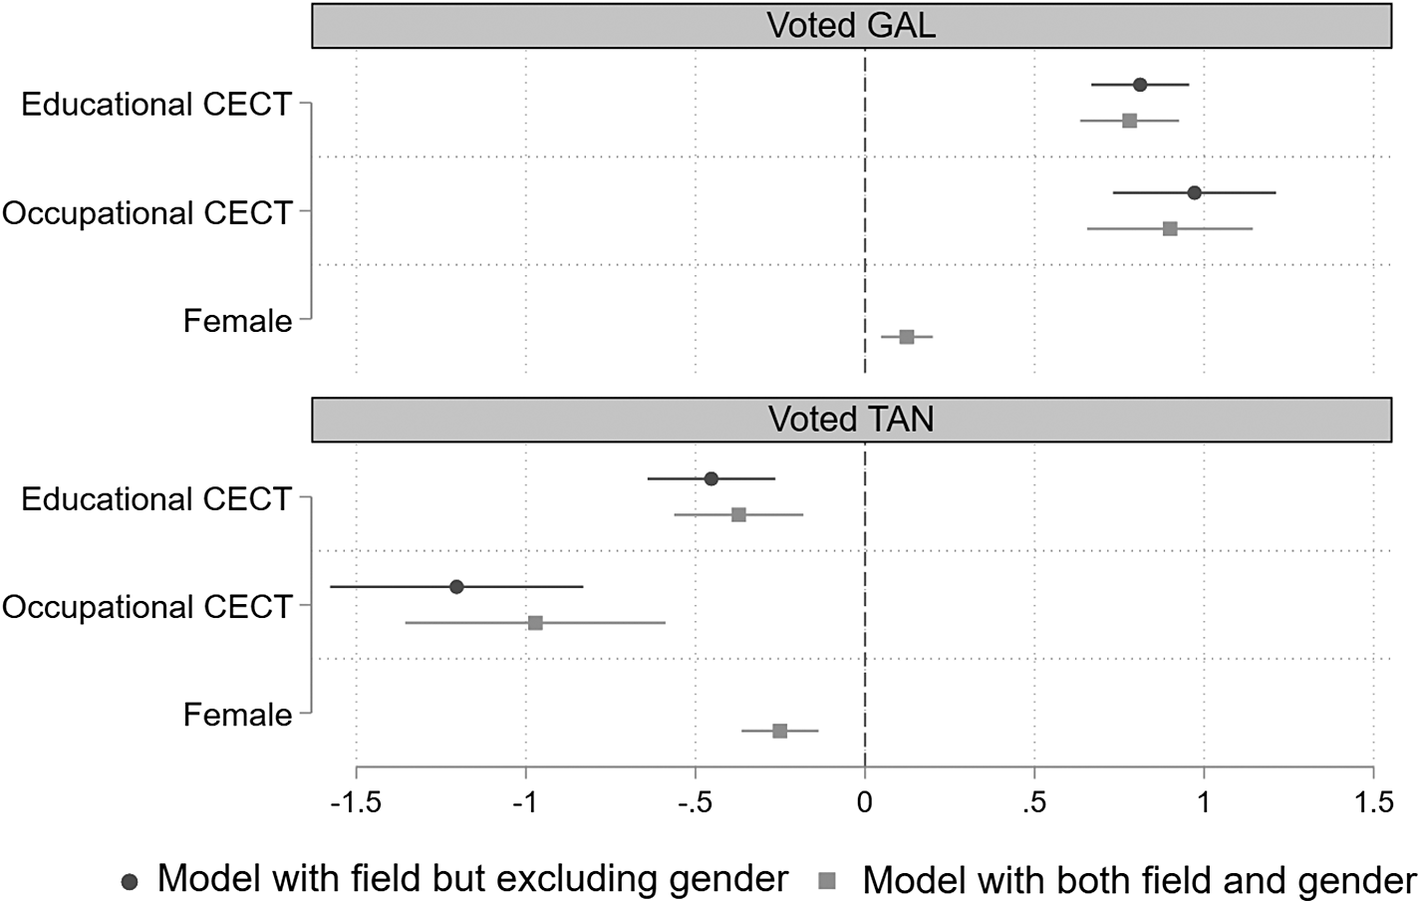
A second inferential challenge arises from gender sorting. To what extent can the effect of field can be attributed to differential selection by boys and girls into fields of specialization? In Figure 5, we contrast a model with field, but without gender, to our baseline model that includes both gender and CECT. This shows that the effect of field is extremely robust under controls for gender. Further analysis reveals that a model with field alongside gender is superior to one with gender alone or with field alone, as shown by its lower Bayesian Information Criterion (Supplementary Table A.6). Hence knowing a person’s field of education reveals new information about someone’s propensity to vote on GAL or TAN—not information that can be derived from a person’s gender. Gender contributes to GAL or TAN voting, but its effect is smaller than either CECT variable.
The Effect of Field on GAL and TAN Voting with or without Controlling for Gender
Note: This figure plots the effect of field and gender on voting GAL (top panel) or TAN (bottom panel); the coefficients are differences in log odds (95% confidence intervals). Each panel compares two models: one model in which log odds for educational and occupational field CECT are estimated without controlling for gender, and one model that includes gender as control. The figure shows that including gender as control does not significantly change the effect size for educational or occupational CECT. The log odds are calculated from multilevel mixed-effects logistic models with oim clustering by country and ISCO-3, with standard controls. Full results are in Supplementary Table A.6.
Before we move on to investigate the timing of the link between field of education and voting, we address two further questions. The first concerns whether we are right to think that field of education has an especially strong association with voting on the socio-cultural divide relative to mainstream Left/Right voting. Analyses show that field of education is less predictive of voting for mainstream Left or Right parties than for GAL and TAN parties though, as expected, CECT variables are negatively associated with Right voting and positively associated with Left voting (see Section F on Dataverse).Footnote 11
A second question concerns cross-national robustness. Although the multi-level models contain fixed effects for country, there is still the possibility that our findings are not robust across countries. This is a valid concern, particularly in light of variation in educational systems between early-track and late-track specialization and the fact that the educational schema was generated with data from the Netherlands, an early-track system. We address this along two paths. First, contemporary data from a late-track system produce similar results: A survey conducted by the authors in 2023 in the United States replicates (r = 0.84) the incidence of skills by field of education (Supplementary Appendix E).
Second, we disaggregate the analysis by country (see Section G on Dataverse). Field of education predicts GAL or TAN voting in Austria, Belgium, Denmark, Finland, Germany, Greece, the Netherlands, Norway, Spain, Sweden, and Switzerland. In France, field of education is signed in the expected direction, but not significant. We suspect that majoritarian electoral systems (including France, the UK, and the US) increase the association of field of education with mainstream parties that, by virtue of electoral disproportionality, encompass GAL and TAN constituencies.Footnote 12 In France, field theory tells us as much about voting for the mainstream Left and mainstream Right parties in the early 2000s than about voting for Les Verts or the Front National.
WHERE DO DIFFERENCES BETWEEN FIELDS COME FROM?
We hypothesize the effect of field of education at distinct stages in a person’s life. Do individuals internalize distinctive values and political preferences while studying a particular field (H2); is field of education a proxy for prior life-shaping factors such as parental or peer group socialization (H3); or does a person’s occupational experience after education shape their preferences (H4)? To answer these questions, we turn to panel datasets: the Dutch LISS, which allows us to test these hypotheses for both GAL and TAN parties, and the German SOEP, which allows a test only for GAL (the Greens) but with a considerably larger number of respondents that permits more fine-grained analysis across a person’s life phases.
We first examine the timing of the effect of an individual’s CECT which measures the relative preponderance of cultural-communicative skills in a person’s education. We then examine the extent to which occupational CECT, the average CECT of those in a person’s occupation, has an independent effect on vote choice or is a proxy for prior processes.
Educational CECT in Time
We begin by probing whether the connection between a person’s field of education and their party sympathies is established during and/or after study. To do so, we restrict the sample to respondents who were in the panel while in high school and before field specialization and who stay in the panel for at least one wave after they complete education. In the LISS, this produces a sample of 443 respondents with 2,271 observations where the youngest respondents are 17 or 18. In the SOEP, we have a sample of 4,040 respondents with 46,364 observations, and the youngest respondents are 16. We calculate an individual’s CECT in the year they complete post-secondary education and use this information to back-predict someone’s party sympathy when that person is in high school. If the link between field and voting is established during post-secondary education or subsequently in the labor market, we would not detect it in high school. If, by contrast, a person’s later field already predicts party sympathy in high school, this indicates that prior life-shaping characteristics influence both field choice and party sympathy.
We run standard multivariate regression models with standard errors clustered at the respondent level. In the LISS, the outcome variables are mean sympathy scores for GAL parties (GL, D66, and the PvdD) and TAN parties (PVV and the FvD) on 0–10 scales. In the SOEP, the outcome variable is whether respondents would consider voting for the Greens (1 or 0). The main explanatory variable of interest is later CECT, a respondent’s CECT score after completing education and coded in the same way as in the ESS analysis. We control for level of education (post-secondary degree). Coefficients for later CECT are allowed to vary by life-stage: in high school or during/after post-secondary education (LISS); in high school, in post-secondary education, or after education (SOEP).
Figure 6 shows the effect of someone’s later CECT at different life phases and indicates that later CECT is indeed already predictive of a person’s party sympathy in high school (light gray triangles). In the top panel (SOEP) the effect is larger for those in post-secondary education (gray triangles) and larger still for those in the workforce (black circles). This is consistent with the notion that experiences during education or in the labor market may reinforce the effect of field choice. In the two lower panels (LISS) we do not find significant differences in this direction, which may be due to the much smaller sample size.
The Effect of Educational CECT in High School, Post-Secondary Education, and Post-Education
Note: Explaining vote sympathy with educational CECT by life phase, regression coefficients with 95% intervals. The top panel (SOEP) plots the coefficients of a model that predicts vote intention for the Greens (0 or 1); the middle and bottom panels (LISS) plot the coefficients of models that predict sympathy (0 to 10) for GAL (GL, D66, and PvdD) and TAN (PVV, FvD) parties. These models control for level of education. Standard errors are clustered at the respondent level. Full results are in Supplementary Tables A.10 and A.11.
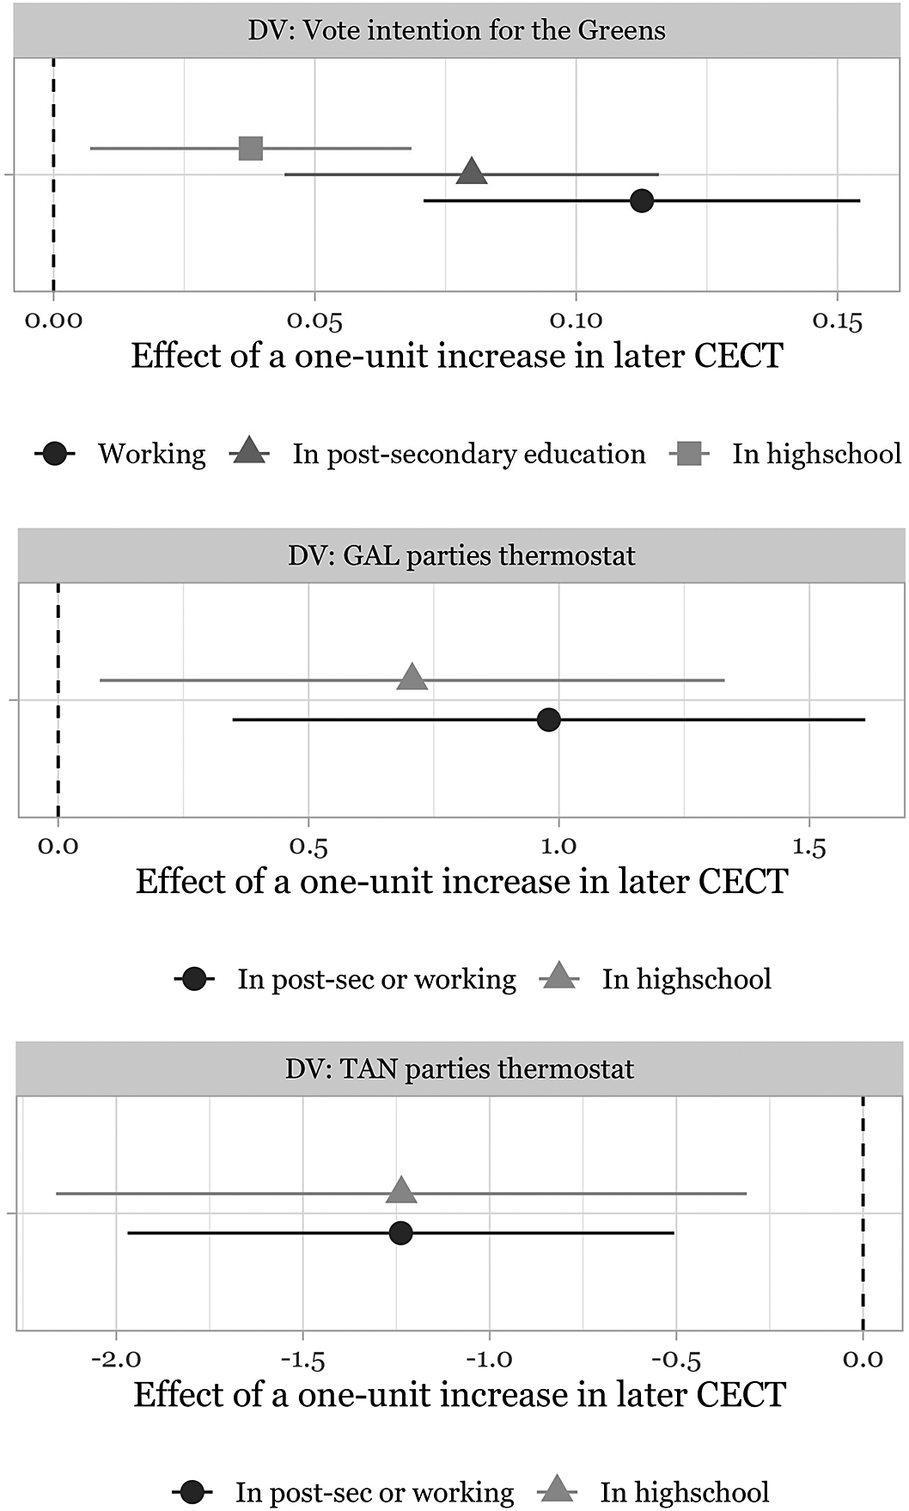
These results are consistent with H3 on self-selection into a field. Party sympathies on the socio-cultural divide start to diverge even before someone completes high school, and an individual’s later educational field provides a reliable predictor of this divergence. That is to say, the factors that influence a person’s political sympathies also tend to influence their choice of educational field. However, the divergence arising from self-selection into a field appears to widen during education (H2) and at work (H4).
The second analysis focuses on the experience of education in a specific field (H2) while filtering out the effects of self-selection. Our goal is to hold constant the social background of an individual and compare the same people before and after they attend higher education. Our prior is that the effect of attending higher education varies by the CECT content of field. Finding a within-individual effect of attending post-secondary education in a particular field is evidence that part of the influence of field is caused by experiences during education—a direct effect.
The outcome of interest is the Average Treatment effect on the Treated (ATT) of attending post-secondary education. The ATT captures the within-individual effect of receiving a treatment compared to what would have happened if an individual had not received that treatment. We code a respondent as treated from the year they enroll in higher education. The ATT thus captures the within-individual effect of attending higher education. We restrict the sample to individuals aged up to 30—the years in which a person is considered to be most impressionable.
We use the “IFEct” counterfactual estimator developed by Liu, Wang, and Xu (Reference Liu, Wang and Xu2024) to estimate the ATT. This estimator incorporates an interactive fixed effects (IFEct) specification that models time-varying confounds as latent factors and builds on synthetic-control methods to form a unique counterfactual for each treated unit. The estimation procedure has four steps: (1) time-trends are modeled using control-group observations; (2) the counterfactual outcome for each treated observation is predicted based on the model from the first step; (3) for each treated individual, the treatment effect is estimated by taking the difference between the observed outcome and the counterfactual outcome; (4) the estimator takes the average of all the individual treatment effects. Because treated observations of early treatment adopters never serve as controls for late treatment adopters—since we compare each individual to their own counterfactual—the estimator accounts for the problems associated with negative weighting in TWFE regressions (de Chaisemartin and D’Haultfœuille Reference de Chaisemartin and D’Haultfœuille2020).Footnote 13
An additional benefit of this approach is that it generates a dynamic treatment effects plot which formalizes the visual tests researchers generally use to assess whether there are parallel trends and which indicates whether the strict exogeneity assumption is plausibly met. Using the IFEct estimator, we run three models: one with the full sample, one with low-CECT individuals (CECT at or below the median), and one with high-CECT individuals (CECT above the median). We employ the larger N in the SOEP data.
Table 1 and Figure 7 convey the results. Table 1 reports the IFEct within-individual effect of attending higher education for three groups: all respondents, those in high-CECT fields, and those in low-CECT fields. The first column reveals a direct effect of higher education: people who complete higher (or post-secondary) education become 3% more likely to lean GAL. Of particular interest to our argument, the second and third columns show that the direct effect varies by field: the effect is nearly twice as large for those in educational fields with high CECT, such as teaching, social studies, or science (+4.1%) than for those in low-CECT fields such as engineering, business, or agriculture (+2.2%).
IFEct Within-Individual Effect of Attending Higher Education in a Particular Field on Voting Green
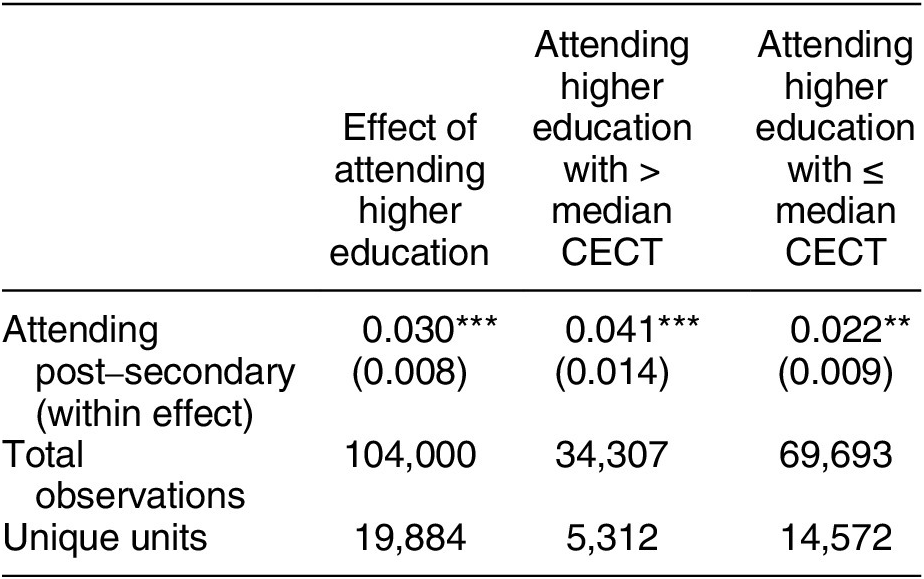
Note: Explaining the direct effect of higher education in a particular field, predicted probabilities of leaning Green. We use the Interactive Fixed Effects models developed by Liu, Wang, and Xu (Reference Liu, Wang and Xu2024). ***p < 0.001; **p < 0.01; *p < 0.05.
The Within-Individual Effect of Attending Higher Education with a Particular CECT Score on Vote Intention for the Greens
Note: SOEP panel to predict leaning Green (1 or 0) using IFEct models (Liu, Wang, and Xu Reference Liu, Wang and Xu2024). We focus on the effects among the full sample (top plot) and subsets with higher than median and lower than (or equal to) median CECT (bottom two plots). Dots and whiskers show the regression coefficients with 95% confidence intervals. Full results are in Table 1.
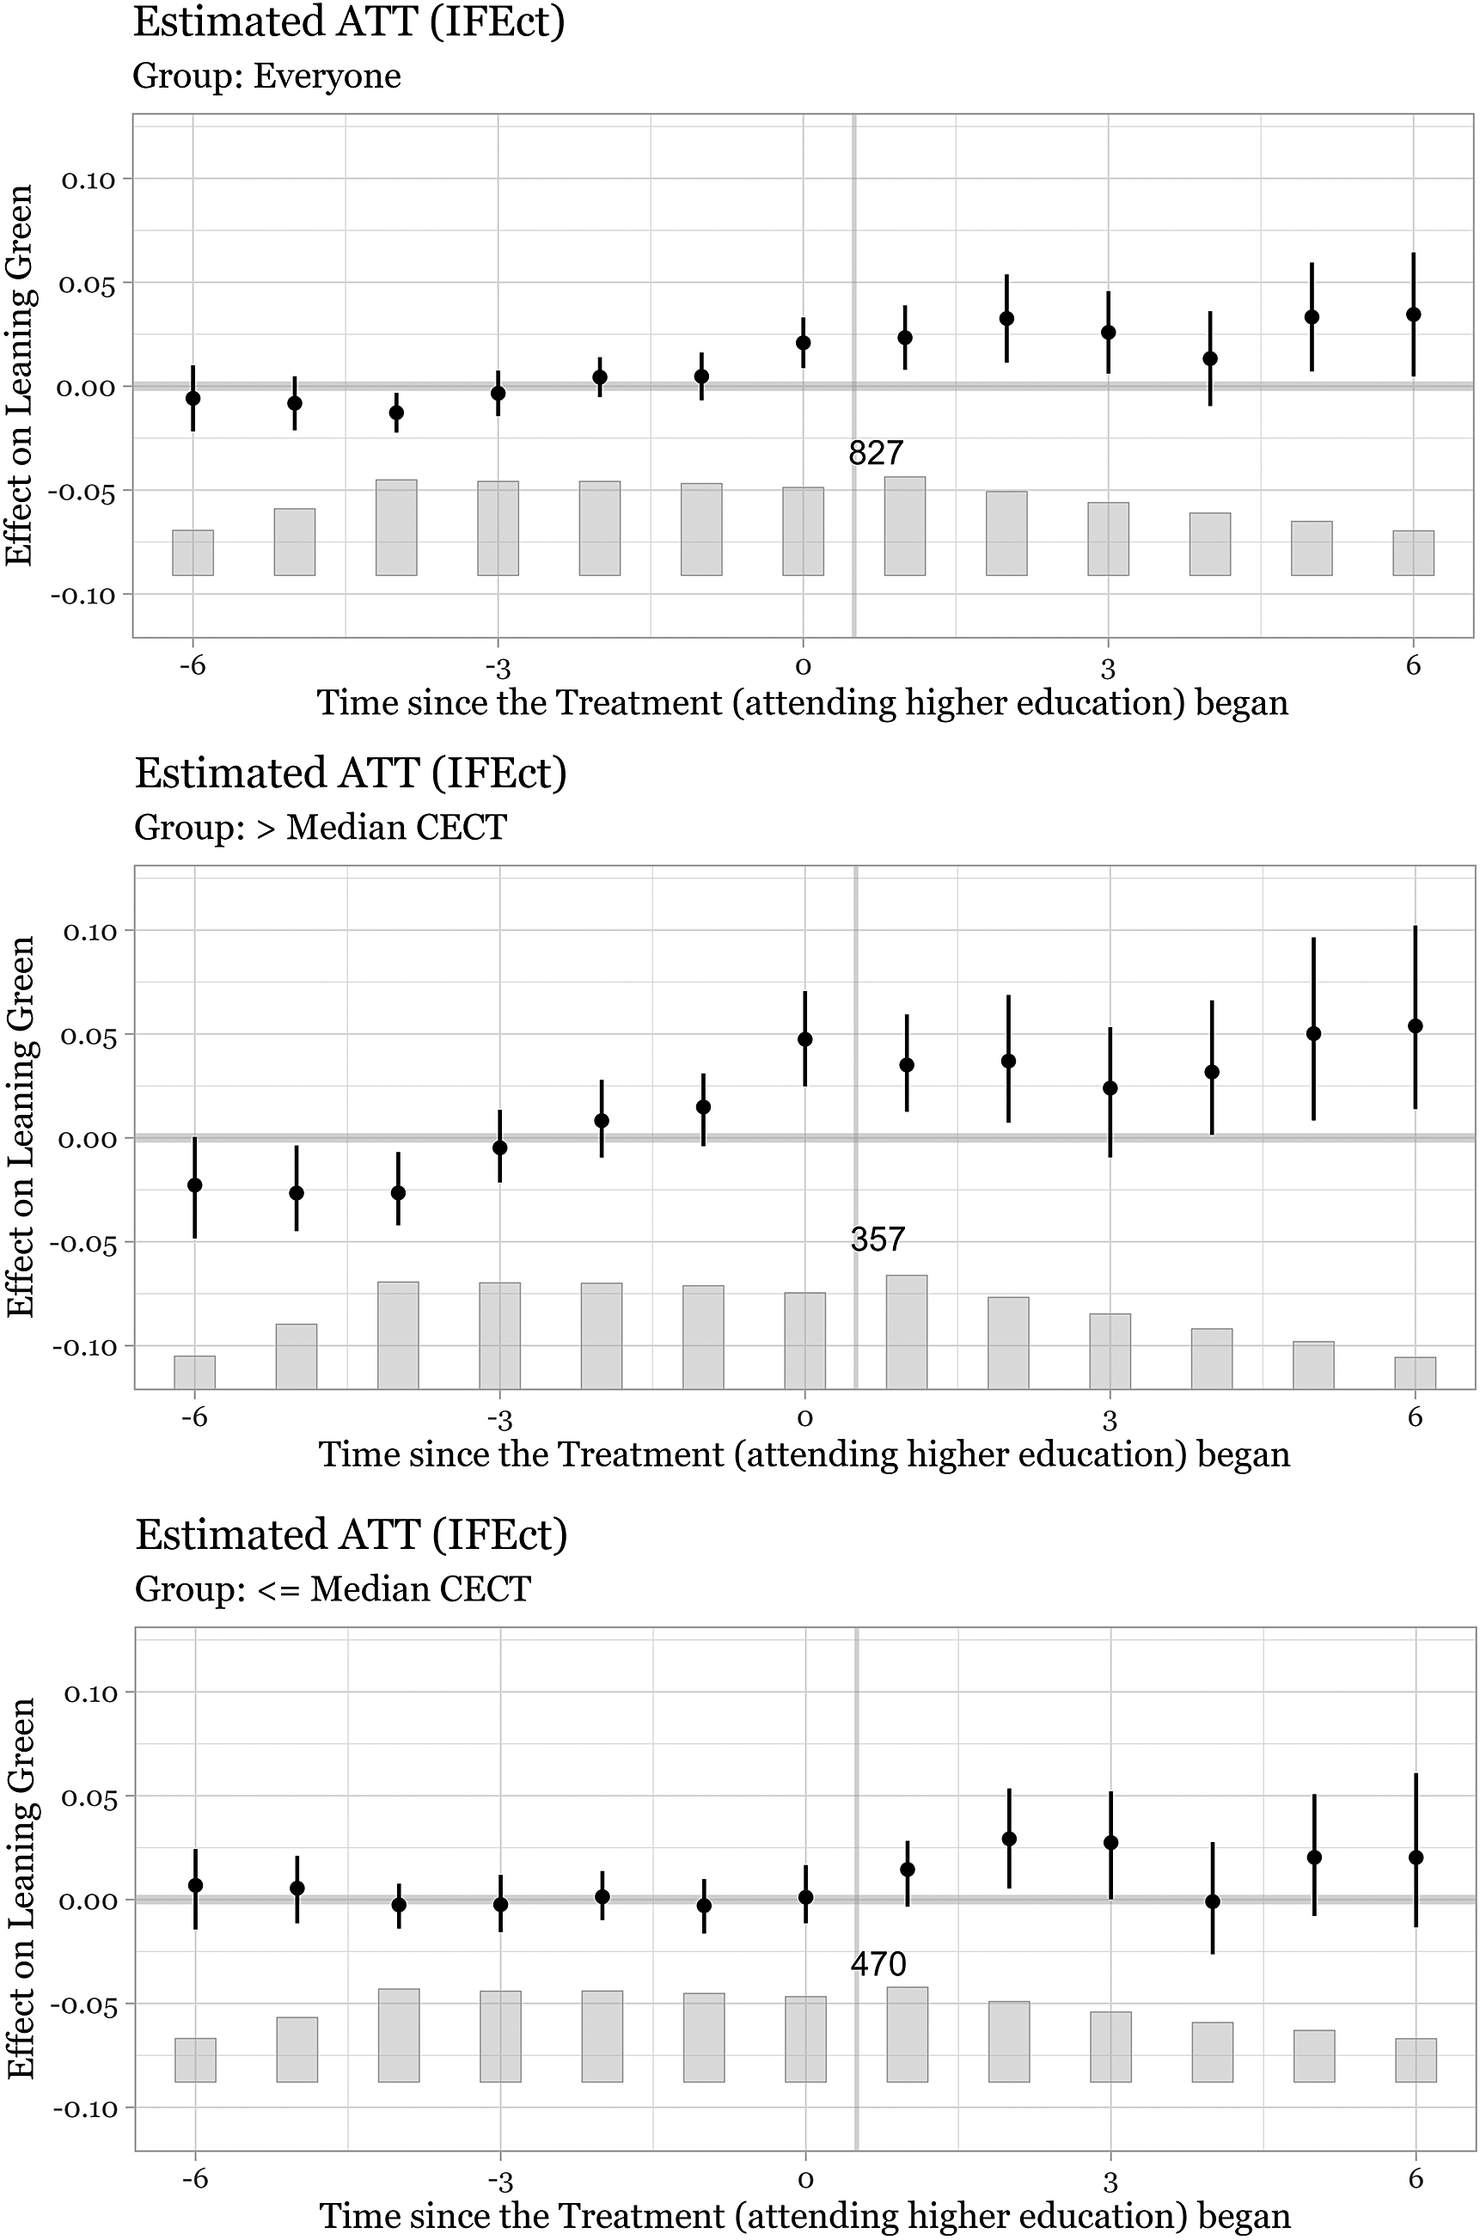
All three panels in Figure 7 show that the parallel trends assumption largely holds. There are no strong pre-trends or substantial violations of parallel trends, although there is a small anticipation effect one year before attending post-secondary education for the entire sample as well as for individuals with above-median CECT. There is also a small significant negative effect around five years before treatment. Overall, Figure 7 shows that the effect of attending higher education is already visible one year into education, suggesting that the treatment effects reported in Table 1 are not driven by experiences after graduating. This is consistent with hypothesis H2.
Occupational CECT in Time
We now examine the post-education effect of field, by evaluating how occupational CECT affects vote choice. Occupational CECT may have an independent effect on vote choice to the extent that a person’s job immerses them in a particular cultural-communicative environment (H4a; H4b). Alternatively, the effect of occupational CECT may proxy for individual self-selection in occupations based on their educational CECT.
Our approach is similar to that for educational CECT. The first model estimates whether a person’s later occupational CECT explains their attitudes while they are still studying. A person’s later occupational CECT is estimated as the average of an individual’s occupational CECT for each year they are in the labor market after completing education. As before, we control for having a post-secondary degree. We use both the LISS and the SOEP. If an individual’s occupational CECT does not influence attitudes when a person is still studying, then it is reasonable to believe that the effect of occupational CECT that we find in the ESS is primarily due to on-the-job experiences. By contrast, if a person’s later occupational CECT predicts attitudes when they are still in school, this suggests that occupational CECT is a proxy for factors that have shaped their attitudes at birth, during childhood and adolescence.
To further flesh out this self-selection mechanism, a second model adds a person’s educational CECT. If a person selects into an occupation based on their educational CECT, the effect of occupational CECT should weaken. We run the following models (for the SOEP, we can once again distinguish between three life phases):
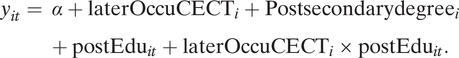 $$ {y}_{it}={\displaystyle \begin{array}{l}\alpha +\mathrm{laterOccuCEC}{\mathrm{T}}_i+\mathrm{Postsecondarydegre}{\mathrm{e}}_i\\ {}+\hskip2px \mathrm{postEd}{\mathrm{u}}_{it}+\mathrm{laterOccuCEC}{\mathrm{T}}_i\times \mathrm{postEd}{\mathrm{u}}_{it}.\end{array}} $$
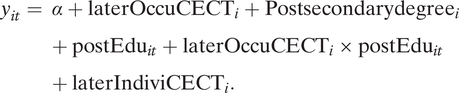 $$ {y}_{it}={\displaystyle \begin{array}{l}\alpha +\mathrm{laterOccuCEC}{\mathrm{T}}_i+\mathrm{Postsecondarydegre}{\mathrm{e}}_i\\ {}+\hskip2px \mathrm{postEd}{\mathrm{u}}_{it}+\mathrm{laterOccuCEC}{\mathrm{T}}_i\times \mathrm{p}{\mathrm{ostEdu}}_{it}\\ {}+\hskip2px \mathrm{laterIndiviCEC}{\mathrm{T}}_i.\end{array}} $$
Figure 8 shows the results. The panels on the left reveal that later occupational CECT is significantly associated with vote sympathies in each life phase. The panels on the right show that when controlling for educational CECT, occupational CECT weakens. This indicates that occupational CECT matters in part because it strongly correlates with educational CECT; that is to say, people choose an occupation based on the field they study. However, importantly, the models also reveal that, in two of the three panels, occupational CECT remains a significant predictor of vote sympathy during education and post-education even while controlling for educational CECT. In support of H4a and H4b, this means that field-specific experiences on the job further cement political attitudes and behavior.
The Effect of Occupational CECT during Education and Post-Education
Note: Explaining vote sympathy with occupational CECT by life phase, regression coefficients with 95% intervals. Models in the panels on the left show the effect of occupational CECT on vote sympathy without controlling for educational CECT; models on the right control for educational CECT. The outcome is binary (leaning GAL) for SOEP (top panels) and the outcome is a thermostat scale from 0 to 10 for LISS capturing attitudes toward GAL parties (middle and bottom panels). All models use respondents for whom we have observations while they are in education as well as while they are on the job market. Standard errors are clustered at the respondent level. Full results are in Supplementary Tables A.13 and A.14.

Taken together, field of education is indicative of life-long experiences that influence a person’s party sympathy on the socio-cultural divide. The panel analysis provides strong evidence that experiences prior to education shape both a person’s party sympathy and their choice of educational field, but studying and graduating in a particular field and, beyond that, working in an occupation with high cultural-communicative content tends to reinforce these sympathies. Both educational CECT and occupational CECT are predictors of political behavior on the socio-cultural divide across the three life phases.
CONCLUSION
An extensive and growing literature finds that a person’s level of education is a potent predictor of their political attitudes and behavior. When it is not a key explanatory variable, level of education routinely features as a control.Footnote 14 In this article, we make a case for considering a person’s field of education alongside their level of education. Here we focus on voting for GAL and TAN parties in Europe, a substantively important topic for which the level of education is widely considered to be a powerful predictor. We confirm this but find that a person’s field of education is strongly and independently associated with both GAL and TAN voting.
Fields of education vary widely in their substantive content, their social networks, their psychological associations, and they arguably stand as a proxy for social characteristics that reach back into childhood and early adulthood. We find evidence for self-selection, but we also find that the effect of a person’s field choice begins during their education and continues over their life course. Hence our account suggests that individuals self-select into socialization.
Our findings are in line with a political sociology that seeks to understand how socially rooted choices shape a person’s life course and political affinities. Education was once conceived as a source of dealignment in which political choice becomes malleable and unpredictable. This article suggests, on the contrary, that a person’s field of education is a vital ingredient in a cleavage theory of voting on the contemporary divide.
However, our analysis reveals important gaps in our understanding. First and foremost, while the panel data we use confirm that experiences prior, during, and following a person’s field of education influence their political attitudes, there is still much to learn about the precise mechanisms. It would be deeply instructive, for instance, to dig beneath the general term “socialization” to discover what in particular is responsible for the effects we detect during childhood and early adulthood. Or to take the effect of field in a person’s occupation, what is the relative importance of status, income, and socialization on the job? Progress here requires better dynamic data as well as better models.
The authors of this article are certainly not alone in perceiving the partisan implications of human-centered education. Education has always had broad social and political ramifications, and which subjects to teach and fund are intensely contested by politicians who appear to be aware of the broader stakes. Decisions about which disciplines to encourage or eliminate have a sharp partisan edge that, according to the analysis presented here, bears directly on the transnational divide.
Finally, a word of caution. While the data used here range over the past two decades, it is worth stressing that the causality of voting reflects the structure of conflict in a particular society at a particular time. There is no reason to believe that the ideological affinities of fields of study are time invariant. In former communist societies, for example, social scientists often served as ideological mouthpieces of the ruling elite. The core finding of this article is that field and voting are profoundly connected. Only future research can assess how long this will hold.
SUPPLEMENTARY MATERIAL
To view supplementary material for this article, please visit http://doi.org/10.1017/S0003055424000583.
DATA AVAILABILITY STATEMENT
Research documentation and data that support the findings of this study are openly available at the American Political Science Review Dataverse: https://doi.org/10.7910/DVN/YMLR66.
Acknowledgments
Earlier drafts were presented at the European University Institute (Florence), the University of Siena, Pompeu Fabra University, the University of Zurich, ARENA Oslo University, the University of North Carolina at Chapel Hill, the European Union Studies Association (Miami), the European Political Science Association (Glasgow), and the MEDem conference at the University of Vienna. The authors would like to thank participants at these events for their comments, and especially Simon Bornschier, Simone Cremaschi, Silja Häusermann, Elisabeth Ivarsflaten, Seth Jolly, Kate McNamara, Jan Rovny, and Herman van de Werfhorst. All authors contributed equally.
FUNDING STATEMENT
This research was funded by the Advanced European Research Council grant TRANSNATIONAL (#885026) administered by the Robert Schuman Centre, EUI, Florence, and the Kenan and Burton Craige Research Foundations at the University of North Carolina at Chapel Hill.
CONFLICT OF INTEREST
The authors declare no ethical issues or conflicts of interest in this research.
ETHICAL STANDARDS
The authors affirm this research did not involve human participants.


 Open access
Comments
No Comments have been published for this article.