Introduction
The West Antarctic ice sheet (WAIS) is thought to be especially unstable because most of its bed lies well below sea level. The WAIS is thinning overall, with thickening in the west and thinning in the north (Reference Rignot and ThomasRignot and Thomas, 2002). Ice streams draining into the Ross and Ronne Ice Shelves have been studied extensively over the past 20 years, and many show signs of substantial ongoing or recent changes. The Ross ice streams show a positive mass balance of 33 ±6 km3 a–1, largely caused by the recent slow-down of Kamb Ice Stream (former Ice Stream C). The ice streams draining into the Ronne Ice Shelf show a very slight thinning, with a calculated mass balance of –9±8km3 a–1. By contrast, glaciers draining into the Amundsen Sea region of West Antarctica have accelerated within the past 10– 20 years, with a rapid associated grounding-line retreat and thinning of –72±12km3 a–1 (Reference Rignot and ThomasRignot and Thomas, 2002).
Mass-balance studies are especially absent for slow-moving parts of the WAIS, where ice dynamic effects are probably less significant. Although the impact on the overall mass balance of the ice sheet is predictably small, the study of the slow-moving ice sheet is relevant for detecting possible glacier changes due mainly to climate forcing and to help assess the vulnerability of the WAIS to climate warming.
Blue-ice areas (BIAs) are especially suited for ground mass-balance studies. They are formed by negative mass balance sustained both by enhanced sublimation over the bare ice and by erosion due to wind-driven snow (Reference JonssonJonsson, 1992; Bintanja, 1999). Rock outcrops suitable for establishing reference markers are normally available near BIAs, with the added advantage that the influence of changes in firn compaction on mass balance can be neglected. Changes in the extent of BIAs can also be used to infer climate change (Reference BintanjaBintanja, 1999).
In this work, we present a detailed analysis of the stake measurements performed at Horseshoe Valley, southern Ellsworth Mountains, West Antarctica, in the period 1996– 97, including ice-flow velocities from global positioning system (GPS) measurements. Data extend from the BIA of Patriot Hills north to Douglas Peaks, and are used to calculate the ice flux across a transverse profile. The mass balance is evaluated from repeat surveying of the glacier surface, and also from calculation of the ice flux across a transverse profile of Horseshoe Valley. Analysis of the 1997 radar data will be presented elsewhere.
Field Area
The Heritage Range, southern Ellsworth Mountains, is located on the escarpment region of Antarctica, with steep surface slopes (USGS, 1966), strong katabatic winds (>30ms–1; Reference Carrasco, Casassa, Rivera, Carrasco, Casassa and RiveraCarrasco and others, 2000) and low accumulation rates (~50 kg m–2 a–1; Reference Casassa, Brecher, Cárdenas and RiveraCasassa and others, 1998a). Several BIAs have been identified on the leeward areas of the nunataks in the Heritage Range (Reference SwithinbankSwithinbank, 1987).
The Patriot Hills (80˚18’ S, 81˚22’ W) (Fig. 1) compose the southernmost peaks of the Heritage Range. The maximum elevation is 1246ma.s.l. (USGS, 1966), with nunataks protruding 400m over the surrounding ice sheet. The prominent BIA located leeward (north) of Patriot Hills is 8.5 km long and 1.7 km wide.
Location of Patriot Hills, southern Ellsworth Mountains. E: Evans Ice Stream; R: Rutford Ice Stream; S: Skytrain Ice Rise; I: Institute Ice Stream; F: Foundation Ice Stream. The box corresponds to location of the satellite image shown in Figure 2.
Horseshoe Valley is located north of Patriot Hills, flowing northwest–southeast with an approximate length of 60 km and a width of 30 km (Fig. 2). It is separated from northward-flowing Union Glacier by Enterprise Hills, is bounded to the northeast by Enterprise Hills and Douglas Peaks, and to the southwest by Liberty Hills, Marble Hills and Patriot Hills (Reference Webers, Bauer, Anderson, Buggisch, Ojakangas, Spörli, Webers, Craddock and SplettstoesserWebers and others, 1992). In addition to in situ accumulation, Horseshoe Valley is fed by three main outlet glaciers draining from the inland ice sheet, which flow through mountains in the Independence Hills, Marble Hills, Liberty Hills and Guarcello Peak. Ice flows eastward onto the Ronne Ice Shelf, with the grounding line located 45 km northeast of Patriot Hills, at Hercules Inlet.
ASTER (band 1) mosaic of four satellite scenes available for Horseshoe Valley and vicinity, acquired on 4 January 2001 (northern part), and two scenes of 9 January 2003 (southern part). The mosaic was geometrically corrected using the orbital parameters provided. Pixel size is 15 m. EH: Enterprise Hills; UG: Union Glacier; GP: Guarcello Peak; LH: Liberty Hills; MH: Marble Hills; IH: Independence Hills; RP: Redpath Peaks; TS: Three Sails; PH: Patriot Hills; HV: Horseshoe Valley; DP: Douglas Peaks; MyH: Meyer Hills; SIR: Skytrain Ice Rise; HI: Hercules Inlet. The line joining points P1 and H34 corresponds to the transverse profile of Figure 3, with ice flowing from left to right. The margins of Horseshoe Valley are shown with a black line. The line on Hercules Inlet corresponds to the grounding line on the Ronne Ice Shelf. Coordinates in km (UTM-17S), with northing on the ordinate and easting on the abscissa. The image was obtained from the United States Geological Survey (USGS) Earth Resources Observation Systems (EROS) Data Center.
The BIA located on the northern margin of Patriot Hills was studied in the mid-1980s for its potential use as an ice runway (Reference SwithinbankSwithinbank, 1987), and in November 1987 a DC-4 aircraft landed there on wheels for the first time (Reference SwithinbankSwithinbank, 1998). This BIA has been used frequently since then, mainly for commercial operations by Adventure Network International, and since 1995 as a summer base for Chile’s Antarctic programme.
Glaciological research in the Heritage Range had been limited to airborne radio-echo sounding (RES) by the Scott Polar Research Institute (SPRI)/US National Science Foundation (NSF)/Technical University of Denmark (TUD) and the British Anatarctic Survey (BAS) at a resolution coarser than 10km (Reference VaughanVaughan and others, 1994; Reference Lythe and VaughanLythe and others, 2001); accumulation measurements from snow pits at a spacing of 50–100km along an International Geophysical Year (1957– 58) traverse (Reference Bull and QuamBull, 1971); and a few ice-velocity data between Independence Hills and Patriot Hills (Reference Ishimaru, Yoshikawa, Kizaki, Harada, Yoshikawa, Harada and IshimaruIshimaru and others, 1995).
In 1995 the Chilean Antarctic Institute (INACH) started a scientific programme with the logistic support of the Chilean Air Force (FACH), using C-130 aircraft landing on wheels on the ice runway of Patriot Hills. Four field campaigns have been conducted, in 1995 (January and November), 1996 (November–December) and 1997 (November–December), with studies on glaciology (Reference Casassa, Brecher, Cárdenas and RiveraCasassa and others, 1998a, Reference Casassa and Oerterb) and climatology (Reference Carrasco, Casassa, Rivera, Carrasco, Casassa and RiveraCarrasco and others, 2000).
Mass-balance and ice radar measurements of the 1995 field campaigns were limited to an area of 6 km radius in the vicinity of Patriot Hills (Reference Casassa, Brecher, Cárdenas and RiveraCasassa and others, 1998a). Stake measurements showed net ablation over the BIA, while net accumulation was observed away from Patriot Hills, increasing to the north. Results from optical surveying of stakes suggested that the ice is in near-equilibrium in the area, with no significant elevation change over the glacier. Ground-based RES showed thicknesses of about 400m at the centre of the BIA.
In 1996 and 1997 the stake network was extended 30 km north of Patriot Hills, to Douglas Peaks (Figs 2 and 3). Preliminary analyses of the 1996 and 1997 data showed deep (>1 km) and complex subglacial topography and low velocities near Patriot Hills which increased to about 20 m a–1 at the centre of Horseshoe Valley (Reference Casassa and OerterCasassa and others, 1998b). Detailed analyses of the 1996 and 1997 data are presented below.
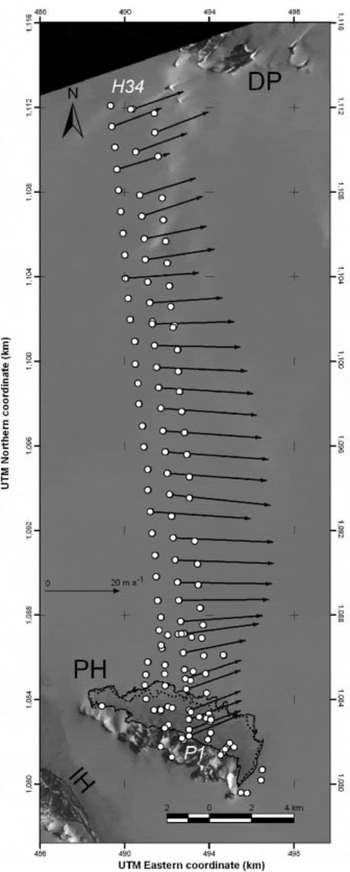
Close-up of Figure 2, an ASTER composite (bands 1, 2 and 3 Nadir) of a 9 January 2003 image with velocity vectors along the transverse profile P1–H34 of Horseshoe Valley. The image was geolocated using ground GPS sites obtained in the rock area and ice margin of Patriot Hills. PH: Patriot Hills; IH: Independence Hills; DP: Douglas Peaks. White circles are survey stations measured during at least two field campaigns from 1995 to 1997. The continuous black line and the dashed black line around the Patriot Hills BIA are explained in Figure 4. Coordinates in km (UTM-17S).

Methods
Cartography and satellite imagery
The most detailed existing maps of Horseshoe Valley are the 1 : 250 000 scale ‘Union Glacier’ (79–80˚ S) and ‘Liberty Hills’ (80–81˚ S) sheets published by USGS (1966), with contour lines at 200m intervals only in the vicinity of the nunataks. These maps were supplemented with four Advanced Spaceborne Thermal Emission and Reflection Radiometer (ASTER) satellite images at 15m pixel resolution (visible and near-infrared bands) (Fig. 2). A mosaic was generated using the four ASTER images: two acquired on 4 January 2001 (northern part of Fig. 2) and two from 9 January 2003 (southern part of Fig. 2). The images were geometrically corrected using the orbital parameters provided. Based on the southern images (4 January 2003), a colour composite was generated from ASTER bands 1, 2 and 3 Nadir, using a histogram-equalized stretch (Figs 3 and 4). The colour composite was geolocated using reference points available at Patriot Hills and the vicinity which were clearly identified on the imagery and were measured on the ground by differential GPS, yielding an average horizontal accuracy better than 2 pixels (i.e. 30 m). Orthorectification of the image can be neglected since for a maximum ice-sheet relief of about 150 m, as is the case for the BIA of Patriot Hills, the associated horizontal distortion is 23m (1.5 pixels) in the cross-track direction, whereas in the direction of the satellite groundtrack the distortion is practically zero (personal communication from A. Kaab, 2003).
Patriot Hills BIA. This is a close-up of the ASTER composite image (Fig. 3). CB97 was the 1997 base camp; ANI is the camp of Adventure Network International; A1–A2 is the blue-ice runway; E1 is the reference station on bedrock; P1 station is located on ice, 10 m from the margin of the BIA; and PH1246 is the main summit of Patriot Hills (1246ma.s.l. according to USGS, 1966). White circles are survey stations measured during at least two field campaigns from 1995 to 1997. The continuous black line corresponds to the maximum extent of the BIA on 8 and 9 Decemebr 1997; surveyed with ground GPS. The dashed black line is the BIA extent according to the 9 January 2003 ASTER image. Coordinates in km (UTM-17S).

Snow pits
Snow-pit observations were performed in situ during every field campaign (Tables 1 and 2) The pit depth was 2.2 m in January 1995, 5.2 m in November 1995, 1 m in December 1996 and 1.3m in December 1997. Snow densities were measured with a 20 cm long cylindrical tube of 0.5 L volume and a digital scale with 1 g resolution. Temperatures were measured in 1995 and 1996 with a dial thermometer and in 1997 with a digital thermometer with 0.1˚C resolution, calibrated in all four seasons with a mercury thermometer available at the weather station at base camp (Reference Carrasco, Casassa, Rivera, Carrasco, Casassa and RiveraCarrasco and others, 2000). Temperatures in January 1995, November 1996 and November 1997 were measured over a period of <1 hour. In November 1995 the 5.2 m deep pit was dug over a 3 day period, with firn temperatures measured over a period of <1 hour d–1. In all cases, the firn temperatures were measured immediately after digging the pit.
Firn temperature at Patriot Hills base camp (790ma.s.l.)
Firn density at Patriot Hills base camp (790ma.s.l.)
Stake measurements
The stake network of 1995, composed of 28 stations, was extended in 1996 to a total of 150 stakes. Stakes were remeasured in 1997. Exposed stake heights were measured with a tape measure with a precision better than 1 cm. A transverse profile was installed across Horseshoe Valley, with three lines of stakes at a spacing of 1 km, covering the area from the BIA at Patriot Hills to Douglas Peaks on the northern end of the valley (Fig. 3). A line of 25 stakes extending to Redpath Peaks, located south of Patriot Hills, was installed in 1996.
Stakes were installed in hand-augered holes to a depth close to 1 m in blue ice and 70 cm in snow. Exposed stake heights were measured at least once every field season.
Survey measurements
In January and November 1995 the stake network was measured by means of theodolite surveying, yielding a vertical precision of 13 cm at the northern end of the traverse, 6 km from Patriot Hills. Three reference stations located on the northern rock slopes of Patriot Hills were occupied in 1995 (Fig. 4).
In 1996 and 1997, dual-frequency GPS receivers were used in differential mode (Topcon and Leica models respectively). Station E1 on bedrock was reoccupied and used as a reference station. An additional bedrock point was measured on the summit of Patriot Hills (PH1246 in Fig. 4). A base station was occupied daily on the glacier at base camp, correcting for glacier displacement relative to station E1, which was measured every 5 days on average. Baseline lengths vary from 60m close to E1 to nearly 30km at the northern end of Horseshoe Valley.
In 1996, GPS data acquisition was every 5 s, with a rapid static observation technique and a minimum occupation time of 10 min. In 1997, acquisition was also every 5 s, with a rapid static technique and a minimum occupation time of 3 min at each station. Data were processed with several commercial software packages (TurboSurvey, SKI, GeoGenius and GrafNav) which yielded similar results. Coordinates obtained with GrafNav were finally selected. Nominal vertical and horizontal precisions for stake positions ranged from a few mm to several cm. However, based upon comparison of redundant measurements obtained with similar receivers, similar occupation times and baseline lengths in glaciers of Patagonia, more realistic values of 15cm for the horizontal uncertainty and 30 cm for the vertical uncertainty were obtained, which are also assumed to be reasonable values for the Horseshoe Valley data.
The BIA extent was measured in 1997 using a dual-frequency kinematic procedure. Although nominal horizontal precision is only a few decimetres after differential correction, more realistic precisions of 1 m in the horizontal coordinate and 2 m in the vertical coordinate are adopted based on comparison of kinematic cross-tracks obtained earlier in Patagonia.
The position for station E1 was fixed to a coordinate of UTM-17S N 1,082,643.87 m, E 491,885.20 m, in 1997 and an ellipsoidal elevation of 781.29 m, all values referred to the World Geodetic System 1984 ellipsoidal height (WGS84). This position was used to assign absolute coordinates for the 1996 and 1995 surveys.
Results
BIA extent
The perimeter of the BIA was mapped on 8 and 9 December 1997 using kinematic GPS mounted on a snowmobile. In many sectors, the precise snow/ice interface was not easy to detect, with intermittent patches of thin snow covering the bare ice. A maximum-extent criterion for the northern margin of the bare ice was applied, joining ice areas with patches of snow in between, yielding a BIA of 14.5± 0.4 km2 (Fig. 4). The southernmost extent of the BIA could not be precisely mapped in the field because of difficulties in driving the snowmobile along the bare-ice margin close to the lateral moraine at Patriot Hills. Instead, the BIA margin from the ASTER satellite image was used as the southern BIA margin.
The extent of the BIA was also derived from the geolocated ASTER composite image of Figure 4, based on the brightness contrast between snow and ice (Reference Orheim and LucchittaOrheim and Lucchitta, 1990). Applying a maximum-extent criterion to that used in the field, an area of 12.1 ±0.7 km2 was obtained for 9 January 2003. A minimum-extent criterion was also applied, not considering snowpatches between bare-ice areas, yielding an area of 11.2 km2. Considering the maximum-extent criterion, a BIA reduction of 2.4 ±1.1 km2 was obtained, which is equivalent to 17% in the 6 year period between December 1997 and January 2003. The area reduction is probably due to the reduced snow cover observed in 1997 at Patriot Hills, as is shown by means of the snow accumulation data.
Firn temperature and density
Firn temperature cooled rapidly at depth (Table 1; Fig. 5). Firn temperature at 5 m depth is –26˚C, which is close to the mean annual air temperature of –30˚C estimated for Patriot Hills (Reference King and TurnerKing and Turner, 1997). The firn temperature close to the surface (0–20 cm) at the time of the pit observation was similar to the air temperature measured at base camp. The colder temperatures of 1995 and warmer temperatures of 1997 in the top 1m layer can be explained by seasonal changes in temperature, January being warmer than November, and also by interannual variability, with a very warm 1997 summer period.
Firn density and temperature measured at Patriot Hills base camp (790ma.s.l.), 20–28 November 1995. The density curve is a logarithmic fit to the data. Higher firn temperatures at 2–3.6m are caused by warming during a 24 hour period when the 2 m depth layer was exposed to air temperatures.

Mean air temperature at Patriot Hills base camp between 8 November and 4 December 1995 was –15˚C, much colder than the observed –7˚C average temperature in the period 18 November–13 December 1997 (personal communication from J. F. Carrasco, 1997). In the period 6–8 December 1997, temperatures were anomalously high, with 3 days of maximum air temperatures above zero, and an absolute maximum of 2.5˚C (Carrasco and others, 2000). During that time, there was widespread melting over the BIA, with deep (~1m) melt lakes forming at the edge of Patriot Hills. No melting was observed over the snow-covered glacier, but significant softening of the surface snow occurred. Analyses of US National Center for Atmospheric Research/National Centers for Environmental Prediction (NCAR/NCEP) data indicate that the 1997 warm event coincides with the build-up of a blocking ridge which advects warm air from the Southern Ocean into the interior of Antarctica (Reference Carrasco, Casassa, Rivera, Carrasco, Casassa and RiveraCarrasco and others, 2000). Inspection of 1958–97 synoptic data showed 17 similar cases in the 40 year period.
Snow structure was composed of hoar crystals at depth in all epochs, which indicates a strong thermal gradient in the surface layers of the glacier at Patriot Hills. Denser and harder layers were detected in a few places at depth, but there was no evidence of ice layers down to 5.2 m depth, and therefore no indication of melt.
Firn densities in the 1 m surface layer increase logarithmically with depth (Table 2; Fig. 5), with a mean value for the four field seasons of 383 kg m–3 at the surface to 413 kg m–3 at 90 cm. In 1997, surface density was 402 kg m–3, 8% higher than in the three earlier epochs, possibly because of higher air temperatures during that season, as indicated above. At 5.1 m depth, firn density reaches a mean value of 500 kg m–3 (Fig. 5).
Ablation/accumulation
The heights of 84 stakes were measured during the period 1996–97 at Horseshoe Valley (Fig. 6). A mean snow density of 383 kg m–3 and a mean ice density of 917 kg m–3 were used for calculating accumulation and ablation rates for the 1 year period. Results show ablation over the BIA and accumulation over snow, as expected (Reference Casassa, Brecher, Cárdenas and RiveraCasassa and others, 1998a; Reference BintanjaBintanja, 1999). There is a large scatter in the data, which indicates the importance of local snow redistribution effects, evidenced by the random formation of sastrugi which reach amplitudes of up to 40 cm north of the BIA.
Ablation and accumulation rates at Horseshoe Valley derived from stake measurements between November 1996 and November 1997. Patriot Hills is located on the left of the plot, and Douglas Peaks on the right. Crosses are stakes on ice on the BIA; diamonds are stakes on snow; and circles are stakes on a transition zone between ice and snow. Ablation is observed on the BIA and on the transition zone, while accumulation occurs on Horseshoe Valley. The curve is a polynomial fit to the data.

Mean accumulation in the central part of Horseshoe Valley is 70 kg m–2 a–1, while the maximum ablation occurred at the edge of the BIA, close to Patriot Hills, with –170 kg m–2 a–1. A small area between Universal Transverse Mercator (UTM) 1084 and 1086 km (Figs 4, 6 and 7), at the northwestern margin of the BIA which includes a snow-covered portion of Horseshoe Valley to the north, is a ‘transition zone’ with net ablation in 1996–97.
A large difference in the accumulation values close to Patriot Hills is observed between the periods 1996–97 and 1995–96, with rates five times smaller in 1996–97. There is a large interannual variability in the accumulation rate at Patriot Hills, which in turn must be due to regional weather variability (Reference King and TurnerKing and Turner, 1997; Reference Carrasco, Casassa, Rivera, Carrasco, Casassa and RiveraCarrasco and others, 2000).
In the ‘snow’ region of Figure 7, accumulation values were similar in the periods January–November 1995 and 1996–97. Large differences in ablation rates can be observed in the BIA (‘I’ in Fig. 7) zone between January and November 1995 and 1996–97, with 50% smaller ablation values in 1995. Although part of this variability can be explained in terms of the shorter and colder time interval between measurements in 1995, there is probably also significant interannual snowfall variability, as also observed elsewhere in Antarctica.
Ablation and accumulation rates at the BIA and its northern margin, derived from stake measurements in 1995, 1996 and 1997. Diamonds indicate the period November 1995–January 1995; circles represent November 1996–November 1995; and crosses are November 1997–November 1996. I denotes ice on the BIA; T is the transition zone between ice and snow; and S is snow in Horseshoe Valley. The continuous line represents a lineal fit for 1996–97, and the dashed line is a parabolic fit for 1995–96. On snow, at UTM N 1087 km, the accumulation rates were five times smaller in 1996–97 and January–November 1995 than in 1995–96.

Ice velocity
Repeat GPS measurements of stakes in 1996–97 provided ice velocities along the transverse profile of Patriot Hills (Fig. 3) for a period of 357–368 days. The middle line of the three parallel transverse lines was chosen because missing data were fewer than in the western or eastern stake lines. In the case of four centre-line stakes where there are no velocity data, the velocities obtained for the stake immediately to the west are shown (Fig. 3).
Velocities ranged from 13 ma–1 near the margins, to a maximum of 25ma–1 at the centre of the profile. Considering an uncertainty of 0.15m in the horizontal coordinates measured by differential GPS, an ice velocity uncertainty of 0.21 ma–1 is obtained, which is equivalent to a 2% uncertainty for the slower velocities and 1% at the centre-line velocity. All vectors indicate an easterly direction of flow, toward the Ronne Ice Shelf, located 45 km to the northeast.
Mass balance
Surface mass balance can be estimated based on changes in surface elevations between epochs (November 1996– November 1995; November 1997–November 1996; and November 1997–November 1995). Considering an uncertainty of 30 cm for GPS measurements and 13cm for the 1995 optical survey, uncertainties associated with estimates for elevation changes are ±42cm for 1996–97 and ±35cm for 1996–95 and 1997–95. Stakes moved downslope during the measurement interval, so a slope correction was applied based on elevation data obtained at 1 km grid resolution (Fig. 3). Measured slopes are <3.6%, with an average value of 1.2%. Height differences (Δh) for a total of 81 stakes are shown in Figure 8, with an average change of +0.43 ±0.42ma–1 and a large amplitude of |Δh| =2.5ma–1, with 1.5ma–1 > Δh > =1.0ma–1. This suggests that the mass balance of Horseshoe Valley was slightly positive during the measurement period.
Elevation differences of the ice/snow surface in three periods between 1995 and 1997 at Horseshoe Valley. Patriot Hills is on the southern (left) margin of the valley, and Douglas Peaks on the northern (right) margin. The mean of 81 points is +0.43±0.42ma–1. The straight line is a lineal fit to the data.
A positive mass-balance trend increasing to the north can be inferred from the data of Figure 8, with a minimum value of Δh = 0 (steady state) close to Patriot Hills (at UTM northing 1080 km) and a thickening of Δh = +0.8ma–1 close to Douglas Peaks (at UTM northing of 1112 km), which is equivalent to a mass-balance increase of 0.8ma–1 × 383 kg m–3, or 31 cm a–1w.e. In the period January 1995– November 1995, a mean thickening of 11 ±11cm was obtained over the BIA (Reference Casassa, Brecher, Cárdenas and RiveraCasassa and others, 1998a), indicating that the BIA was in near-steady-state conditions within this period, which agrees with the present result obtained for the area close to Patriot Hills.
The uncertainty of the vertical component of the GPS coordinate ±42cm for 1996–97 can explain the entire scatter of Δh averaged across Horseshoe Valley (±0.42 m). In addition to the GPS uncertainty, there is a noise due to random sastrugi formation over firn, which is estimated to be ±0.6m, considering a maximum sastrugi amplitude of 40 cm for each epoch. However, the mean thickening of +0.43±0.42ma–1 detected in 1996–97, which increases to +0.8 m a–1 at the northern margin of Horseshoe Valley, might also be a true signal, reflecting a positive mass input, for example by increased snow accumulation during the period or enhanced ice flow from the interior of the valley. The snow accumulation data observed in 1995–97 do not support an increased accumulation for 1996–97, but rather a decrease in accumulation with respect to 1995–96 as explained earlier. Similarly, no data exist to support a hypothesis of increased ice flow from the interior of the valley.
Discussion
The ‘geodetic’ mass-balance method described above shows a positive mass balance for Horseshoe Valley, with a mean value of +0.43±0.42ma–1, which is not significantly different from zero. An independent method for computing mass balance is by calculation of the difference between snow accumulation in the upper catchment of Horseshoe Valley and ice flux through the gate formed by the cross-profile of Figure 3. For this purpose, estimates of snow accumulation, ice velocities and ice thickness are needed.
Ablation/accumulation values show a maximum ablation of 170 kg m–2 a–1 at the southern edge of the BIA and a mean accumulation of 70 kg m–2 a–1 at the centre of Horseshoe Valley (Figs 6 and 7). This value of 70 kg m–2 a–1 is much smaller than the accumulation of 150 kg m–2 a–1 reported by Reference Giovinetto and BullGiovinetto and Bull (1987) for the area. Giovinetto and Bull’s values were based on snow-pit data collected at a spacing of 50–100km (Reference Bull and QuamBull, 1971), which probably better represents the average conditions for the ice sheet rather than the accumulation around the nunataks.
The mean accumulation of 70 kg m–2 a–1 in the centre of the valley, obtained from Figure 6, is probably an underestimate because of the low accumulation rates observed in 1996–97. The data of Figure 7 indicate that snow accumulation in 1995–96 was five times larger than in 1996–97, with accumulation rates in excess of 250 kg m–2 a–1 6km north of Patriot Hills. Mean values of accumulation are probably closer to 70 kg m–2 a–1 than to 250 kg m–2 a–1, based both on the small (~70 kg m–2 a–1) values during the period January–November 1995 which agree with the 1996– 97 data, and also on the accumulation rate of 150 kg m–2 a–1 away from the mountains (Reference Giovinetto and BullGiovinetto and Bull, 1987). A mean value of 100±30 kg m–2 a–1 for the accumulation rate across the south–north transect of Horseshoe Valley (Fig. 3) was chosen. This mean value takes into account the net ablation occurring at the BIA of Patriot Hills, and assumes that it can be extrapolated to the rest of Horseshoe Valley.
An area of 1087±100 km2 results for the Horseshoe Valley catchment above transect P1–H34 in Figure 3, obtained by digitizing the ASTER image of Figure 2, following the ice divide clearly distinguished along the mountain ridges. This yields a total surface balance of 0.11 ±0.04 km3 a–1 using the net accumulation of 100±30 kg m–2 a–1 for the basin.
Ice thicknesses across the gate P1–H34 are known from observations performed with a 2.5 MHz snowmobile-based impulse radar system (RES) in 1995, 1996 and 1997 (data to be reported elsewhere). Due to the radar system limitations, a maximum ice thickness of 1095 m was obtained at station H10, about 6 km north of Patriot Hills (Fig. 9). After 11 km without detecting bottom reflections, the RES system began to register bedrock topography again, with a maximum penetration of 1212 m (17km north of Patriot Hills, at station H21, along profile P1–H34 in Fig. 9). Ice thicknesses showed a monotonic decrease from H10 to Patriot Hills. North of station H21, a subglacial nunatak is evident at H28 (km 24 in Fig. 9), with ice thicknesses reaching values close to zero at km 30 (station H34), at the foot of Douglas Peaks.
Cross-section of Horseshoe Valley, from the margin of the BIA at Patriot Hills (station P1 on the left of the graph) to a point 30 km north (H34 on the right of the graph), at the foot of Douglas Peaks. Diamonds correspond to the surface elevation of stakes, measured by GPS. Squares are bed elevations measured with ice radar. The dashed line is a polynomial interpolation of the radar data. The maximum interpolated ice thickness is 1520 m.
A sixth-degree polynomial interpolation was applied to the radar data of Figure 9, resulting in a maximum ice thickness of 1520m at km 12 of Figure 9 (at stake H16). An independent maximum ice thickness of 1300m can be derived for the Horseshoe Valley profile from existing subglacial topography (Reference VaughanVaughan and others, 1994), compiled from airborne radar data of SPRI/NSF/TUD and BAS. Based on the measured RES values of Figure 9, 1300m is likely an underestimate, and the interpolated maximum thickness of 1520m is used in the following calculation.
The profile P1–H34 is divided into 32 rectangular sections with a mean width of 950 m, varying between 300 and 1600 m. For each section we know the surface velocity (u
s) from repeat GPS observations (Fig. 3). Considering a frozen bed with no basal motion, ice movement by simple shear and a flow-law exponent n = 3, the depth-averaged velocity ![]() can be calculated as (Reference PatersonPaterson, 1994):
can be calculated as (Reference PatersonPaterson, 1994):
Basal motion should not be affected by melt events such as that of December 1996, since the ice temperatures at depth are low (~–30˚C) and meltwater should refreeze in the near-surface layers. Ice flux (F) is calculated as the sum of individual fluxes across the 32 sections, each having a different value of ice thickness (Hi), depth-averaged velocity ![]() and width (Wi):
and width (Wi):
A total flux of 0.44 ±0.08 km3 a–1 is obtained, incorporating uncertainties of 10% for the ice thickness (an average ice thickness of 878m across the profile), 6% for the depth-averaged ice velocities (mean of 16.5 ma–1 across the profile) and 2% for the section width (total of 30.4 km across the valley). The flux of 0.44 km3 a–1 obtained for the transverse profile of Horseshoe Valley is comparable to the outflow of stagnant Kamb Ice Stream, which is 0.5 km3 a–1 (Reference Rignot and ThomasRignot and Thomas, 2002).
This output flux for Horseshoe Valley is four times larger than the snow-accumulation input for the basin, which is 0.11 ±0.04km3 a–1 as calculated above. Assuming steady-state conditions, the flux difference (0.33±0.04km3 a–1) must be supplied by flow from the inland ice sheet, which drains through three main ice cliffs in mountain gaps along Independence Hills, Marble Hills, Liberty Hills and Guarcello Peak. No data for the ice cliffs are available, but an approximate estimate indicates that for a total width of 20km along the ice cliffs (Fig. 2), and an estimated depth-averaged ice velocity of 20 ma–1, an average ice thickness of 825 m would be needed to provide a flux of 0.33 km3 a–1, which is not unreasonable considering the large thicknesses measured at Patriot Hills.
An alternative explanation can be proposed by assuming non-steady-state conditions, as suggested by the thickening of +0.43±0.42ma–1 measured at Horseshoe Valley. This positive mass balance could be at least partially a result of increased flow from the interior of the WAIS. More detailed measurements are needed in the future to establish mass-balance trends in the area, particularly repeated elevation and ice-flow measurements across Horseshoe Valley, and also ice-flow data across the ice cliffs that drain portions of the WAIS into Horseshoe Valley.
Conclusions
Detailed ablation/accumulation measurements with a stake network of nearly 100 stations show large interannual variability, with net accumulation over the main part of Horseshoe Valley and net ablation over the BIA area close to Patriot Hills.
Height differences of the ice sheet measured by differential GPS at 81 stakes between Patriot Hills in the south and Douglas Peaks in the north show a thickening of +0.43±0.42ma–1 which may not be significant. The dataset will serve as a baseline for future monitoring of the ice sheet in the vicinity of Patriot Hills.
Calculation of ice flux across a transverse profile in Horseshoe Valley shows a total outflow which is four times larger than the inflow due to snow accumulation in the upper Horseshoe Valley. If the ice is in near-equilibrium, the flux deficit must be supplied by ice flow from the inland ice sheet that drains through ice cliffs along the Heritage Range. If the ice is thickening as our mass-balance measurements might suggest, then either the snow accumulation has increased, which was not observed in the field, or perhaps the ice flow from the inland ice sheet has accelerated. New detailed measurements are needed to establish the mass balance of the ice sheet in this area.
Acknowledgements
Field research was part of Project 158, sponsored by Instituto Antártico Chileno (INACH), with the logistic support of FACH. The USGS and Global land Ice Measurements from Space (GLIMS) provided ASTER satellite images. The late E. Garca and V. Villanueva, and also J. Quinteros, J. Carrasco, R. Smith, R. Carvallo, C. Cárdenas and the ground crew members of FACH, provided valuable collaboration during the field campaigns. The support of Universidad de Magallanes is appreciated. R. Severino processed GPS data. T. Benham collaborated at Cambridge University. Comments from two reviewers improved the manuscript. Centro de Estudios Cientficos is a Millennium Science Institute and is funded in part by grants from Fundaciόn Andes and the Tinker Foundation.