

Introduction
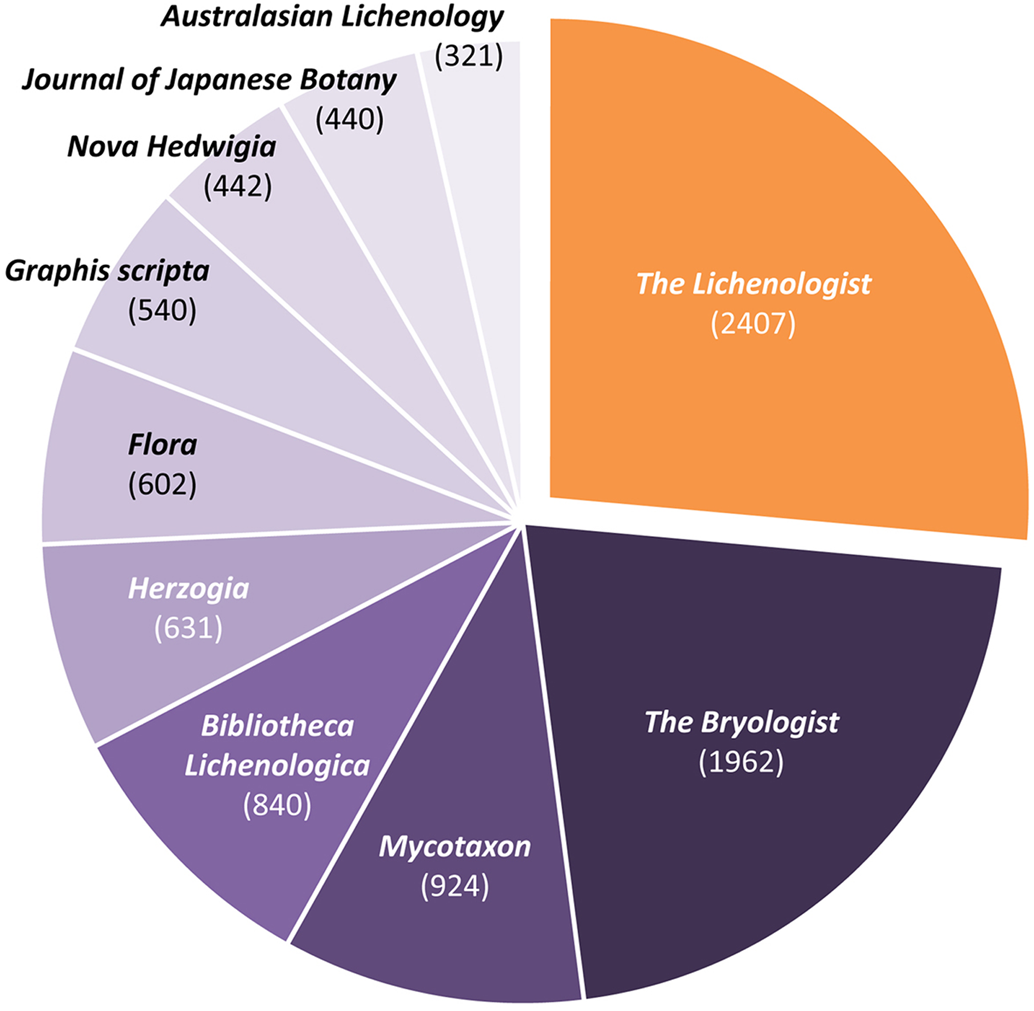
Founded in 1958 by the British Lichen Society (BLS), The Lichenologist soon established itself as the flagship journal of studies related to lichens and has maintained this position until today. Its output is paralleled only by its North American counterpart, The Bryologist, the journal of the American Bryological and Lichenological Society (ABLS). Among over 51 000 lichen-related papers recorded in the Recent Literature on Lichens database (RLL) (http://nhm2.uio.no/botanisk/lav/RLL/RLL.HTM; Timdal Reference Timdal2010) up to 2019, over 2400 (4.7%) were published in The Lichenologist (Fig. 1). These cover a broad range of topics, from taxonomy, systematics and molecular phylogeny, to ecology and biogeography, to applications in biochemistry and biomonitoring. Almost half of these papers appeared under the senior editorship of Peter D. Crittenden, our esteemed colleague and friend honoured with this issue, who took responsibility for the journal in the year 2000 and only recently, after a 20-year tenure, handed over this role to a new tandem, Christopher J. Ellis and Leena Myllys (Ellis & Myllys Reference Ellis and Myllys2020).
Comparison of the total output of lichen-related papers of the ten most prolific journals publishing on lichen-related topics up to 2019 (extracted from the Recent Literature on Lichens database; http://nhm2.uio.no/botanisk/lav/RLL/RLL.HTM). In colour online.
In this paper, the output of The Lichenologist over the past 20 years (2000–2019) is reviewed and analyzed, outlining how the journal has developed over these two decades and paying homage to the extraordinary efforts Peter has put into maintaining and increasing the role of The Lichenologist as the world's flagship journal in lichenology.
Material and Methods
All publications recorded in the Recent Literature on Lichens database (http://nhm2.uio.no/botanisk/lav/RLL/RLL.HTM; Timdal Reference Timdal2010) up to 2019 were downloaded. The records were first sorted according to journal and, after cleaning up the journal data, the number of publications per journal was computed.
In a second step, all papers published in The Lichenologist (2453) were filtered and checked for duplicates, which were removed. The data set was then divided into papers published between 1958 and 1999 (1256) and between 2000 and 2019 (1197). The subset from between 2000 and 2019 was further edited and analyzed as follows (see Supplementary Material S1, available online):
■ All authors were checked and standardized.
■ For each author and publication, the affiliation country was recorded.
■ Titles were checked and corrected where necessary.
■ Each publication was screened and scored for topic, using the following designations: Allelopathy, Biodeterioration, Biodiversity and Conservation, Biogeography, Biography, Biology, Biomonitoring, Biotechnology, Book Review, Chemistry, Culturing, Ecology, Ecophysiology, Editorial, Environment, Fossils, History, Interactions, Lichenicolous, Metabolism, Microbiome, Morphology, Nomenclature, Ontogeny, Photobionts, Phylogenomics, Phylogeny and Evolution, Pollution, Population Genetics, Resources, Symbiosis, and Taxonomy; a paper could have more than one designation.
■ Each publication was screened and scored for countries covered.
■ Each publication was screened and scored for genera covered; where possible, outdated genus assignments were complemented by current generic classifications (e.g. in Caloplaca s. lat., Lobaria s. lat., Parmelia s. lat. etc.).
■ Recorded genera were classified to family level based on Lücking et al. (Reference Lücking, Hodkinson and Leavitt2017a, Reference Lücking, Hodkinson and Leavittb).
The 2-year impact factor (IF) of the journal for the period from 1999 to 2018 was obtained from SCImago (https://www.scimagojr.com/journalsearch.php?q=19312&tip=sid&clean=0). To analyze which parameters potentially contribute to the impact factor, the following were assessed:
■ Mean number of authors per paper per year (volume).
■ Total number of country origins of authors per year (volume).
■ Diversity of topics per year (volume).
■ Mean number of topics per paper per year (volume).
■ Proportion of non-taxonomic topics per year (volume).
■ Diversity of study countries per year (volume).
■ Mean number of study countries per paper per year (volume).
■ Diversity of genera per year (volume).
■ Mean number of genera per paper per year (volume).
■ Proportion of studies with phylogenetic components per year (volume).
■ Inclusion of a thematic issue in volume.
For each IF year, the mean value for the two preceding years for each parameter was computed and then each parameter was plotted against the IF, to calculate the corresponding Spearman rank correlation. To analyze which parameter predominantly contributed to IF in a multiple regression model, three multiple regression models were tested:
■ Forward stepwise linear multiple regression.
■ Backward stepwise linear multiple regression.
■ General non-linear multiple regression with log link function.
To assess the impact of individual publications, citation records of all papers published between 2000 and 2019 were obtained from the Web of Science (http://apps.webofknowledge.com; Salisbury Reference Salisbury2019) and, for comparison, also from Google Scholar (https://scholar.google.com; Falagas et al. Reference Falagas, Pitsouni, Malietzis and Pappas2008; Harzing & Alakangas Reference Harzing and Alakangas2016; Martín-Martín et al. Reference Martín-Martín, Orduna-Malea, Thelwall and López-Cózar2018) for the 30 most cited papers.
Results and Discussion
General development of the journal
The Lichenologist started out in November 1958 with the first issue of Volume 1, with Peter W. James as senior editor and privately published by the British Lichen Society. Volume 1 was published with five issues between 1958 and November 1961. All issues maintained a basic cover layout, although the first three issues experimented with colour until arriving at the classic mint green with issue 3 that would be in use until the year 2000 (Fig. 2). The 3-year span for a single volume continued with Volume 4 (1968–1970) and 5 (1971–1973), and it was only with Volume 6 (1974) that consecutively numbered volumes became synchronized with calendar years.
A selection of cover designs for The Lichenologist between 1958 and 2019. Upper row, from left to right: covers of Volume 1, Parts 1 (1958), 2 (1959) and 3 (1959), showing the development of background coloration towards the classic mint green. Middle row, from left to right: first issue in the classic layout (Volume 4, Part 1, 1968), with Peter James as editor; last issue in the classic layout with Dennis Brown as sole editor (Volume 31, Part 6, 1999); first issue, still in the classic layout, with Peter Crittenden as editor in tandem with Brown (Volume 32, Part 1, 2000). Lower row, from left to right: first issue in the new layout (Volume 33, Part 1, 2001); one of the most striking volume layouts, combining Cladia (Pulchrocladia) retipora with a blue-dominated design (Volume 37, Part 1, 2005); last issue in the new design developed by Peter (Volume 51, Part 6, 2019). In colour online.
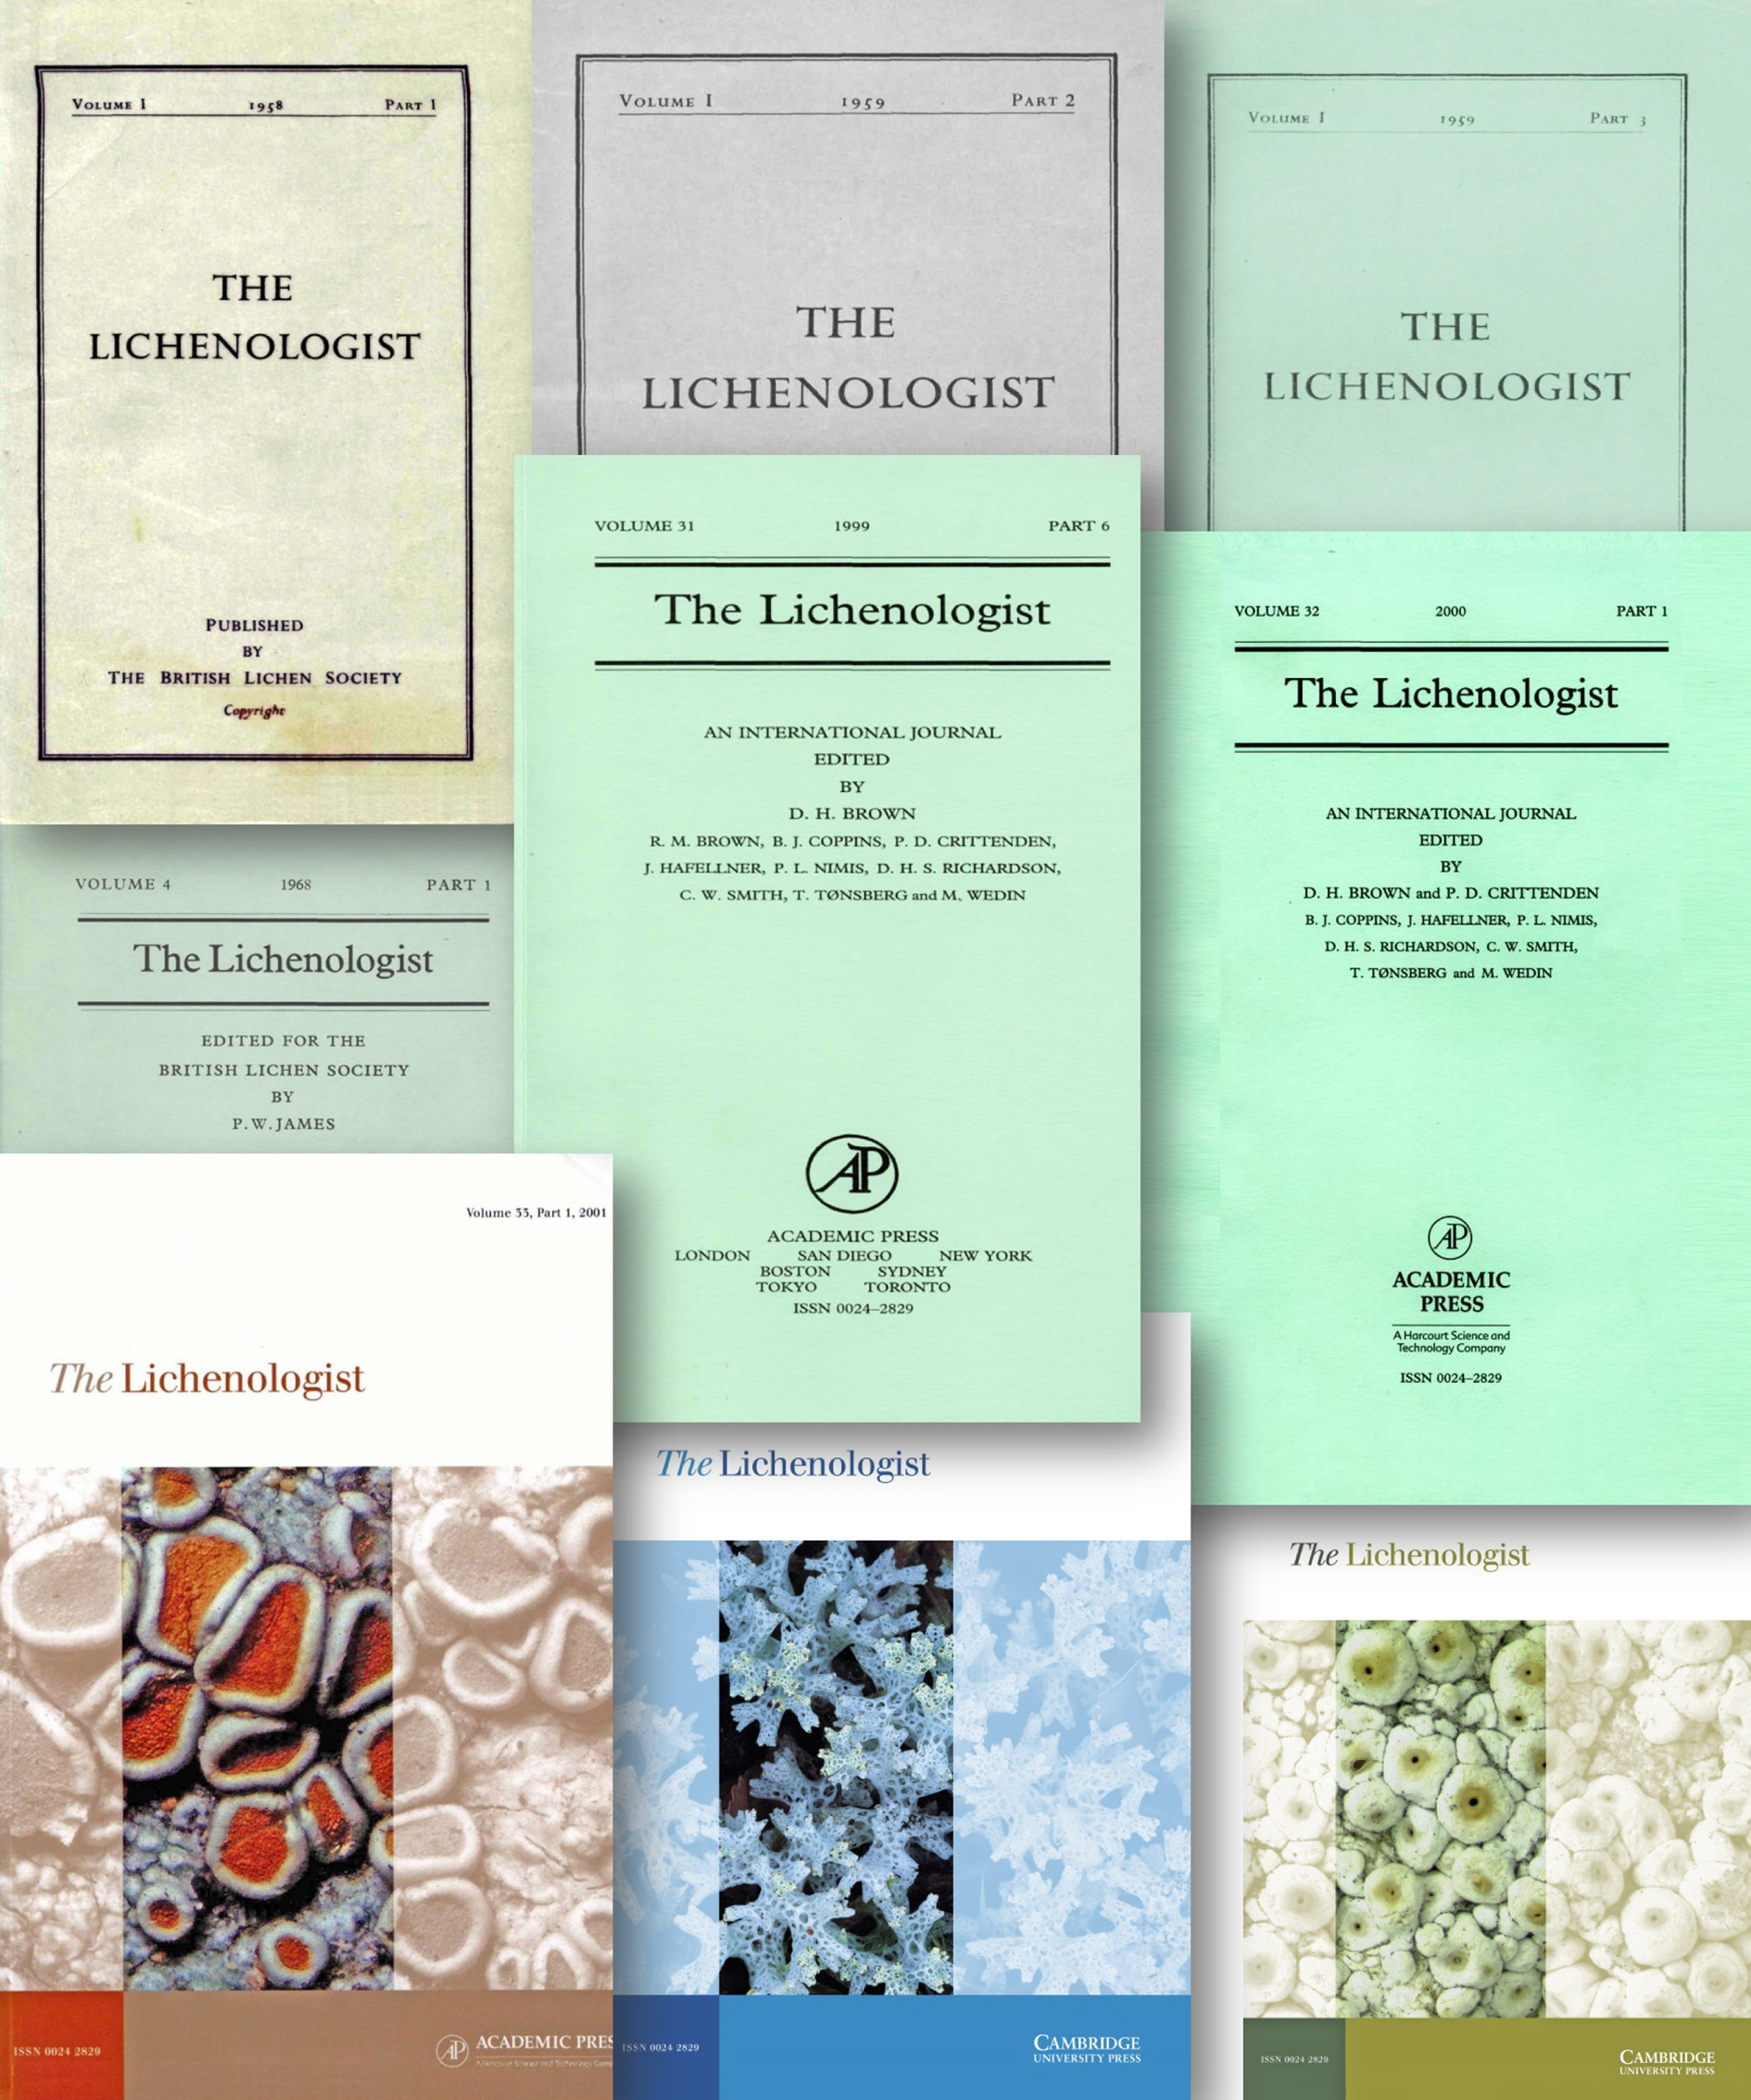
Beginning with the first issue of Volume 4 in 1968, the journal maintained a consistent cover layout for 32 years until the year 2000 (Fig. 2). During this period, Peter James continued as editor until 1977 (Volume 9), in that year in tandem with David L. Hawksworth. Hawksworth then took over in 1978 (Volume 10) and stayed on until 1988 (Volume 20), in that year in tandem with Dennis H. Brown who continued as editor until 2000 (Volume 32). During Brown's tenure, a major change was the switch to six annual issues in 1995 (Volume 27); in previous calendar year-based volumes, the number of issues had oscillated between mostly three and later four, rarely two. In 1997, the journal started to be indexed, resulting in the first 2-year impact factor in 1999.
In 2000, with Volume 32, Peter D. Crittenden started as senior editor of the journal, the first two issues in tandem with Dennis Brown and from issue 3 onwards as sole editor, continuing in this role until 2019 (Volume 51). Lasting 20 years, Peter's tenure as senior editor has substantially surpassed that of all of his predecessors; indeed, the number of papers published under Peter's editorial supervision (1197) almost matches that of all papers published under his three predecessors combined (1256). Peter can look back on a very successful period which has seen substantial developments in scientific research on lichens, but also significant changes in matters of publication. The first task that Peter took on was modernizing the layout and printing of the journal, adopting a larger page size and an entirely new cover layout with Volume 33 in 2001. The new layout combined an elegant design, playing with colour coordination between the graphic layout of the background and a selected lichen photograph, with a changed cover each volume (Fig. 2).
During his tenure, Peter witnessed major changes in the way taxa, and specifically fungi including lichens, are validly described: the new option of effective publication through electronic media and the discontinuation of an obligate Latin diagnosis (with the option to use either English or Latin), both starting on 1 January 2012, and obligate registration of new fungal names, which commenced on 1 January 2013 (McNeill et al. Reference McNeill, Barrie, Buck, Demoulin, Greuter, Hawksworth, Herendeen, Knapp, Marhold and Prado2012). To this, the Code added the obligate registration of newly designed types, such as lectotypes, neotypes and epitypes, with a starting point of 1 January 2019 (Turland et al. Reference Turland, Wiersema, Barrie, Greuter, Hawksworth, Herendeen, Knapp, Kusber, Li and Marhold2018). Peter managed to implement these changes smoothly.
Peter's tenure also saw the rise of molecular phylogeny as the predominant approach to lichenological studies in the past two decades. At the beginning of his editorship, on average less than 10% of the papers per year included molecular methods, and this proportion has grown to sometimes over 50% in the past few years (see below). Witnessing these developments, Peter also actively implemented changes to the scope of manuscripts published by the journal. Individual issues of the journal were dedicated to thematic topics bundling papers on a particular subject and thus generating a higher level of attention by readers. Thus far, this covered Graphidaceae (41(4), 2009), Thelotremataceae (42(2), 2010), Parmeliaceae (43(6), 2011), and Trypetheliaceae (48(6), 2016). Other thematic issues not specifically labelled included one on Physciaceae (33(1), 2001) and a set of papers from Session II of the 5th Symposium of the International Association for Lichenology in Tartu, Estonia, in 2004, ‘Quality and Quantity: maintaining biological diversity in space and time’ (38(4), 2006). Another strategy has been to encourage longer, more comprehensive papers: between 2000 and 2019, the mean number of pages per paper per year increased from mostly under 9 to largely over 11, with three of the four highest paper length averages in the past four years (Fig. 3). The highest page numbers for individual publications during this period were 220 (Aptroot & Lücking Reference Aptroot and Lücking2016), 90 (Lücking et al. Reference Lücking, Archer and Aptroot2009), 70 (Kistenich et al. Reference Kistenich, Bendiksby, Ekman, Cáceres and Timdal2019), 63 (Diederich & Etayo Reference Diederich and Etayo2000) and 61 (Moncada et al. Reference Moncada, Lücking and Betancourt-Macuase2013). However, lengthy contributions had occasionally also been published prior to 2000, the five highest page numbers of individual papers being comparable to those listed above, namely 115 (Hawksworth et al. Reference Hawksworth, James and Coppins1980), 89 (Hawksworth Reference Hawksworth1969), 81 (Hawksworth Reference Hawksworth1972) and 71 for two papers (Gilbert Reference Gilbert1980; Lücking et al. Reference Lücking, Sérusiaux, Maia and Pereira1998).
Development of the mean number of pages per publication per year in The Lichenologist from 2000 to 2019. Highest maxima for selected years are indicated. In colour online.

From 2016 (Volume 48) onwards, so-called ‘single naked species descriptions’ (SNSD) were no longer admitted for editorial reasons, a measure also adopted by several other journals specializing in lichen and fungal taxonomy. It forced authors to develop different publication models, enhancing alpha-taxonomy by elements with broader impact, such as incorporating molecular data or improved taxonomic or natural history context, and generating a more inclusive framework especially through the addition of updated identification keys. The latter in particular has been a useful by-product of this policy, although it shows tendencies towards inflation when adding a new key each time a new species is published in the same genus. Following the model by Lumbsch et al. (Reference Lumbsch, Ahti, Altermann, Amo de Paz, Aptroot, Arup, Bárcenas Peña, Bawingan, Benatti and Betancourt2011), multi-authored papers compiling individual new species descriptions have become a new outlet allowing for rapid cataloguing of unrecognized taxa (Aptroot et al. Reference Aptroot, Ertz, Etayo, Gueidan, Mercado-Díaz, Schumm and Weerakoon2016; Lücking et al. Reference Lücking, Nelsen, Aptroot, Benatti, Binh, Gueidan, Gutiérrez, Jungbluth, Lumbsch and Marcelli2016a; Sheard et al. Reference Sheard, Ezhkin, Galanina, Himelbrant, Kuznetsova, Shimizu, Stepanchikova, Thor, Tønsberg and Yakovchenko2017).
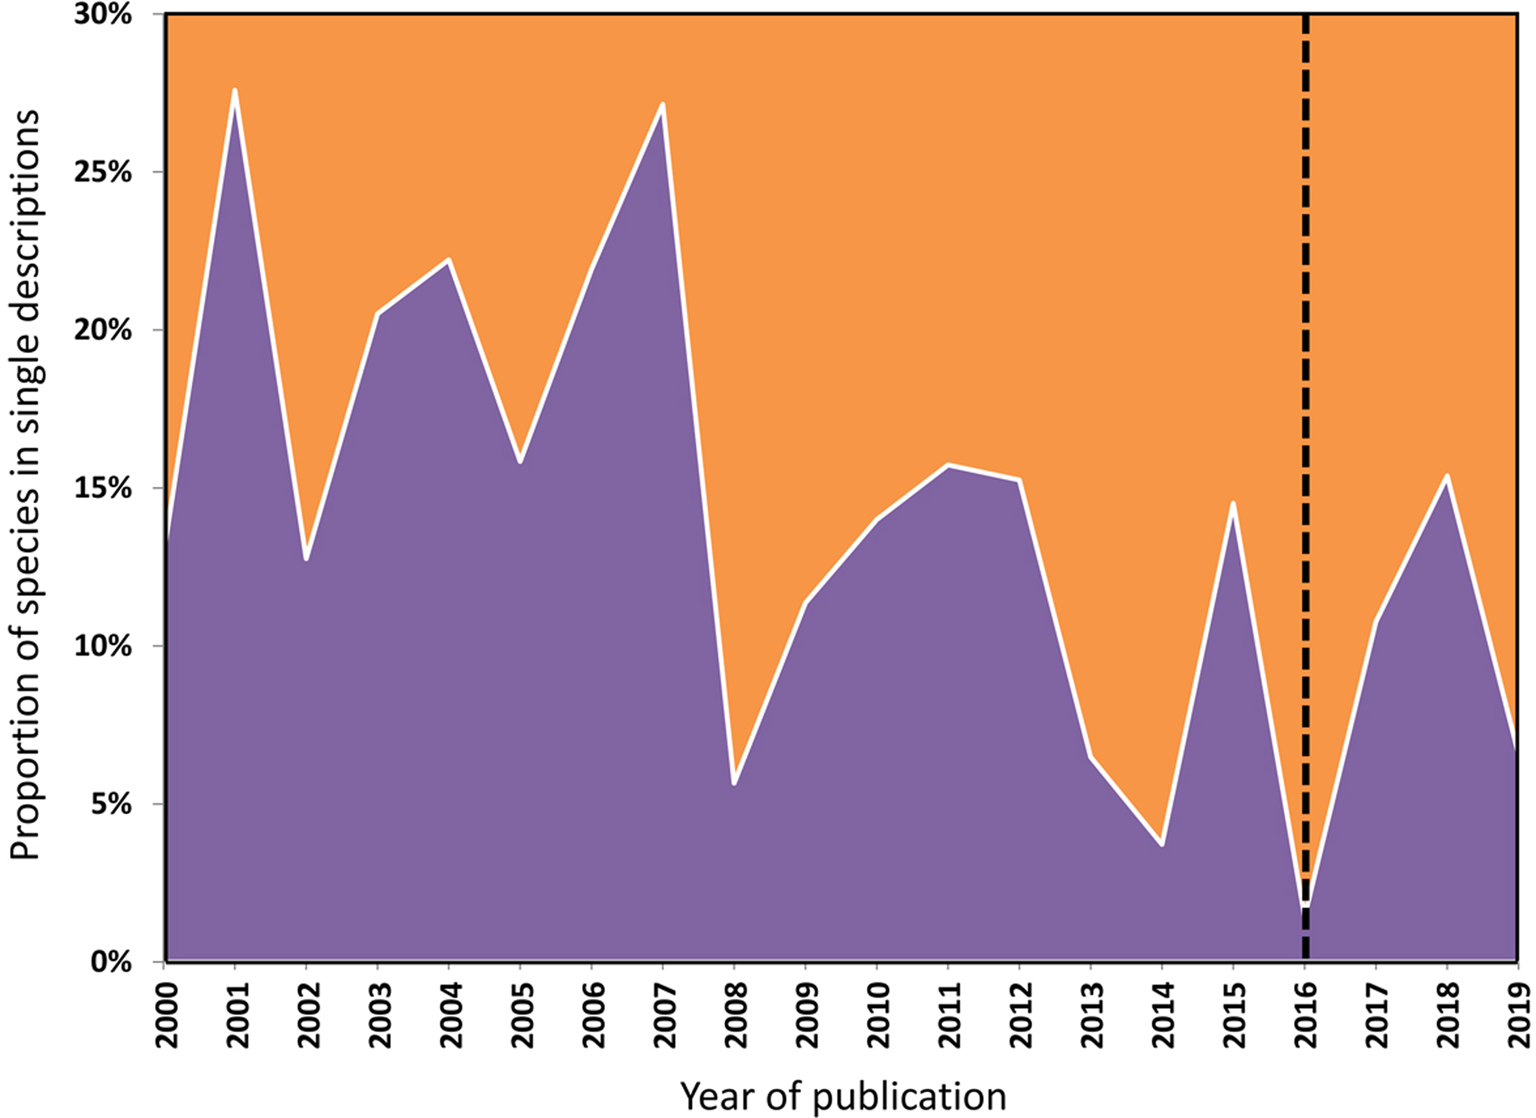
While the change in editorial policy to no longer accept SNSD might be seen as controversial, it was justified by the notion that a scientific journal is primarily a reading source and not a taxonomic encyclopedia. The attractiveness, and hence impact, of a journal lies in provoking immediate curiosity in a broad readership, whereas SNSD are largely of technical interest to a smaller community of specialists. This does not mean that journals should block the description of new species; on the contrary! After all, new species discoveries are the single most important component of cataloguing our planet's diversity and laborious contributions by taxonomists, in particular non-professionals, are at the core. Nevertheless, blended with other publication models such as those mentioned above, The Lichenologist has generated its higher impact and has aimed to receive more immediate attention also from non-specialists. It is worthwhile noting that even before the new measure was implemented, the proportion of species established through SNSD had already declined (Fig. 4). The main difference is that since 2016, single descriptions require an enhanced component. Indeed, most new species were established as part of broader treatments, even prior to the new policy. Between 2000 and 2019, a total of 2069 new species were described in The Lichenologist, out of a total of 2988 since the first issue in 1958, which corresponds to 69% of all newly described species in 32% of the time. Thus, the rate of new species descriptions increased from 22 per year between 1958 and 1999 to 103 per year between 2000 and 2019. Of the 2069 species established in the past two decades under Peter's tenure as senior editor, only 227 (11%) were described in single species descriptions, corresponding to 19% of all papers, whereas 89% were established using other publication models. Notably, between 2000 and 2015, before introducing the new policy of editorial rejection of SNSD, a mean of 96 new species had been published per year in the journal, whereas between 2016 and 2019, this figure increased to 135 new species per year. It thus appears that authors have not only accepted and successfully implemented this new measure, but also had followed its spirit long before the measure was introduced.
Development of the proportion of species established in papers with single species descriptions per year in The Lichenologist from 2000 to 2019. The dotted line indicates the start of the new policy of editorial rejection of ‘single naked species descriptions’ (SNSD). In colour online.
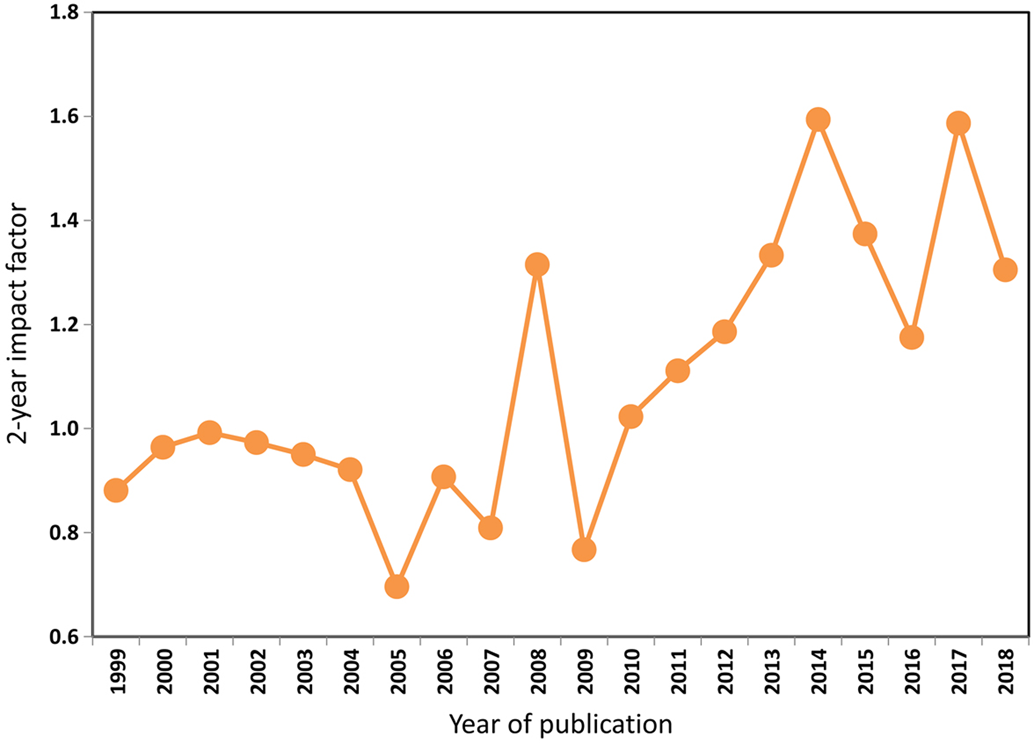
In 1999, just before Peter took over as senior editor, The Lichenologist started to receive annual 2-year impact factors (IF). During the first ten years until 2009, the IF largely oscillated between 0.8 and 1.0, with a single drop to 0.696 in 2005 and a single peak at 1.315 in 2008. Since then, Peter managed a continuous increase, with values constantly over 1.1 and two times (2014, 2017) up to 1.594 and 1.587 (Fig. 5). These values are distinctly above those of journals with similar specialized scope that frequently publish about lichens, such as Herzogia, Mycotaxon, Nova Hedwigia and Phytotaxa, with the exception of The Bryologist, which has seen a similarly successful tenure in its senior editorship by James (‘Jim’) D. Lawrey since 2012 (Lücking et al. Reference Lücking, Dal Forno and Will-Wolf2019). The flourishing development of both journals in parallel is not by accident; indeed, Peter and Jim have developed a successful collaboration aimed at increasing the quality of both journals during the past two decades, aided by Jim having served as an associate editor for The Lichenologist since 2005 (Lücking et al. Reference Lücking, Dal Forno and Will-Wolf2019).
Development of the 2-year impact factor of The Lichenologist from 1999 to 2018 (extracted from SCImago; https://www.scimagojr.com/journalsearch.php?q=19312&tip=sid&clean=0). In colour online.
Authorship of publications between 2000 and 2019
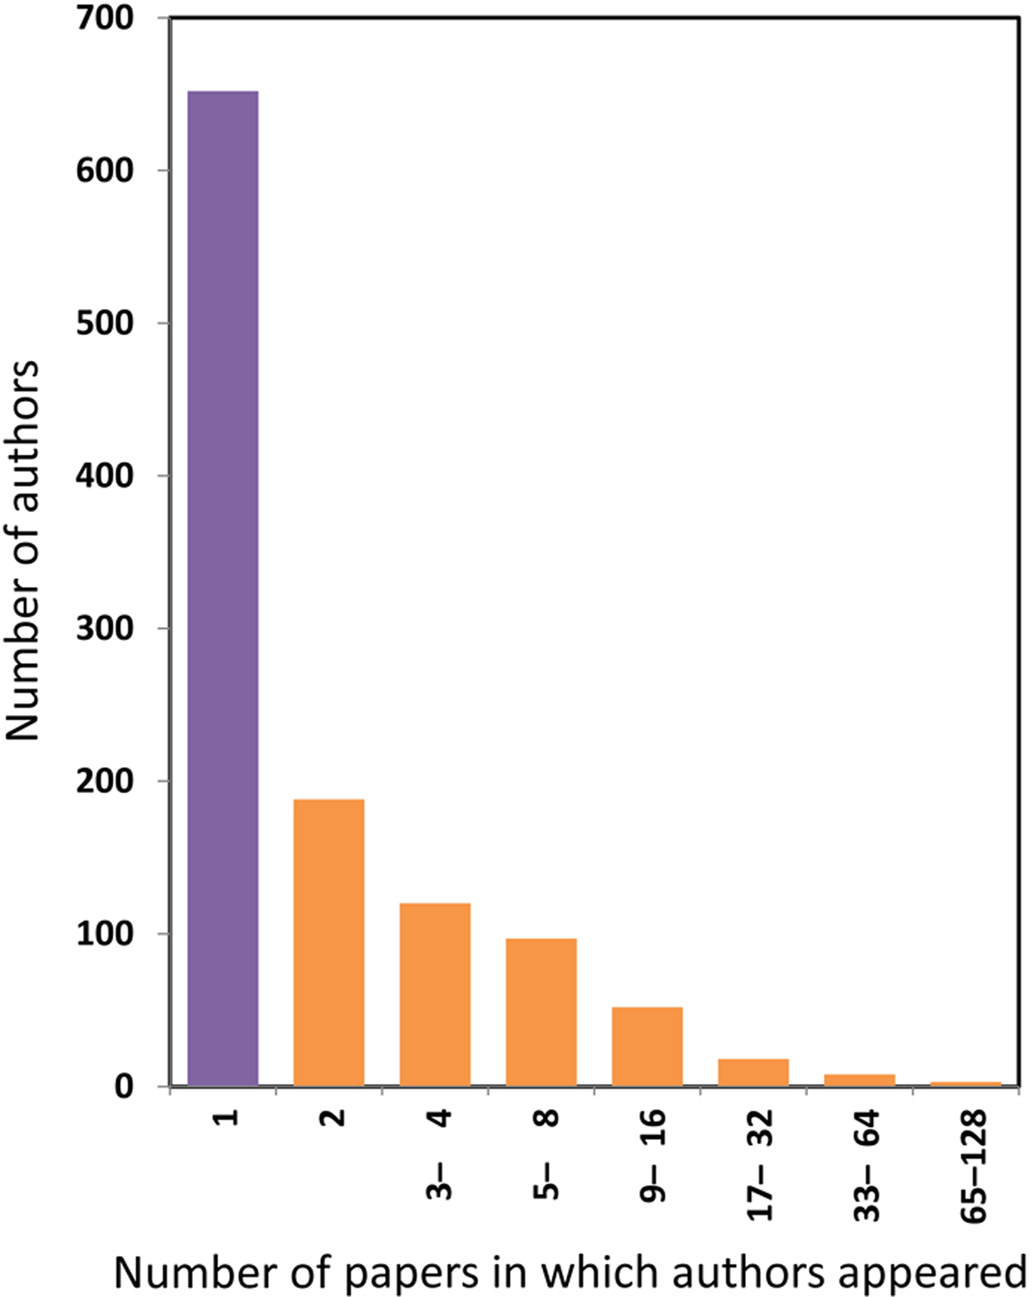
A total of 1138 different authors was recorded for the 1197 papers published in the journal during Peter's tenure as senior editor between 2000 and 2019. Of these, 637 (57%) appeared only once as author, while ten had 33 or more publications and, of these, three had between 65 and 93 (Fig. 6).
Frequency distribution of individual authorships and co-authorships in publications in The Lichenologist from 2000 to 2019. Authors publishing only once during this time are highlighted in purple. The x-axis was scaled logarithmically, with a possible maximum of up to 128 appearances as (co-)author in the last category, although the realized maximum was 93. Purple and orange are represented by darker and lighter shades, respectively. In colour online.
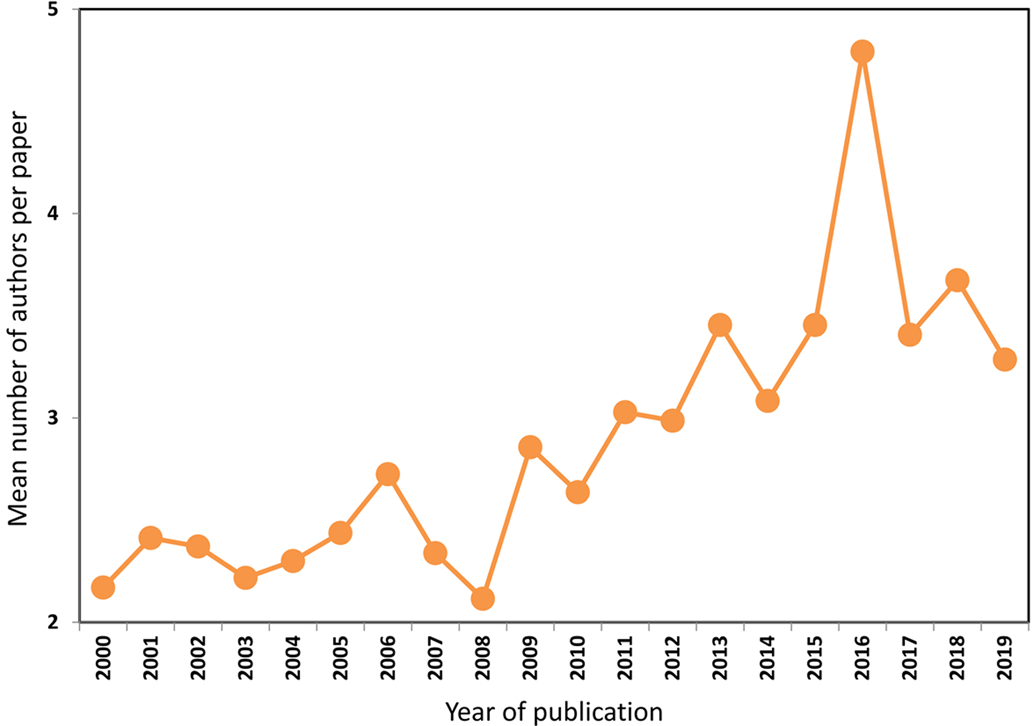
The mean number of authors per paper per year has continuously increased during the past two decades, remaining below 2.5 at the beginning of the millennium but then growing to around 3.5 (Fig. 7). For comparison, prior to 2000, the mean number of authors was 1.6. The peak in 2016 was caused by one paper with 30 authors on the phylogeny of Trypetheliaceae (Lücking et al. Reference Lücking, Nelsen, Aptroot, Barillas de Klee, Bawingan, Benatti, Binh, Bungartz, Cáceres and Canêz2016b), thus far the record for the journal, and this was bolstered by two papers with 15 authors each, one on new species in Trypetheliaceae (Lücking et al. Reference Lücking, Nelsen, Aptroot, Benatti, Binh, Gueidan, Gutiérrez, Jungbluth, Lumbsch and Marcelli2016a) and one on lichen diversity and air pollution in the Niagara Escarpment World Biosphere Reserve in North America (McMullin et al. Reference McMullin, Bennett, Bjorgan, Bourque, Burke, Clarke, Gutgesell, Krawiec, Malyon and Mantione2016). The paper with the second highest number of authors (20) was published by Stofer et al. (Reference Stofer, Bergamini, Aragon, Carvalho, Coppins, Davey, Dietrich, Farkas, Kärkkäinen and Keller2006), analyzing the richness of lichen functional groups in relation to land use intensity across Europe.
Mean number of authors per publication per year in The Lichenologist from 2000 to 2019. In colour online.
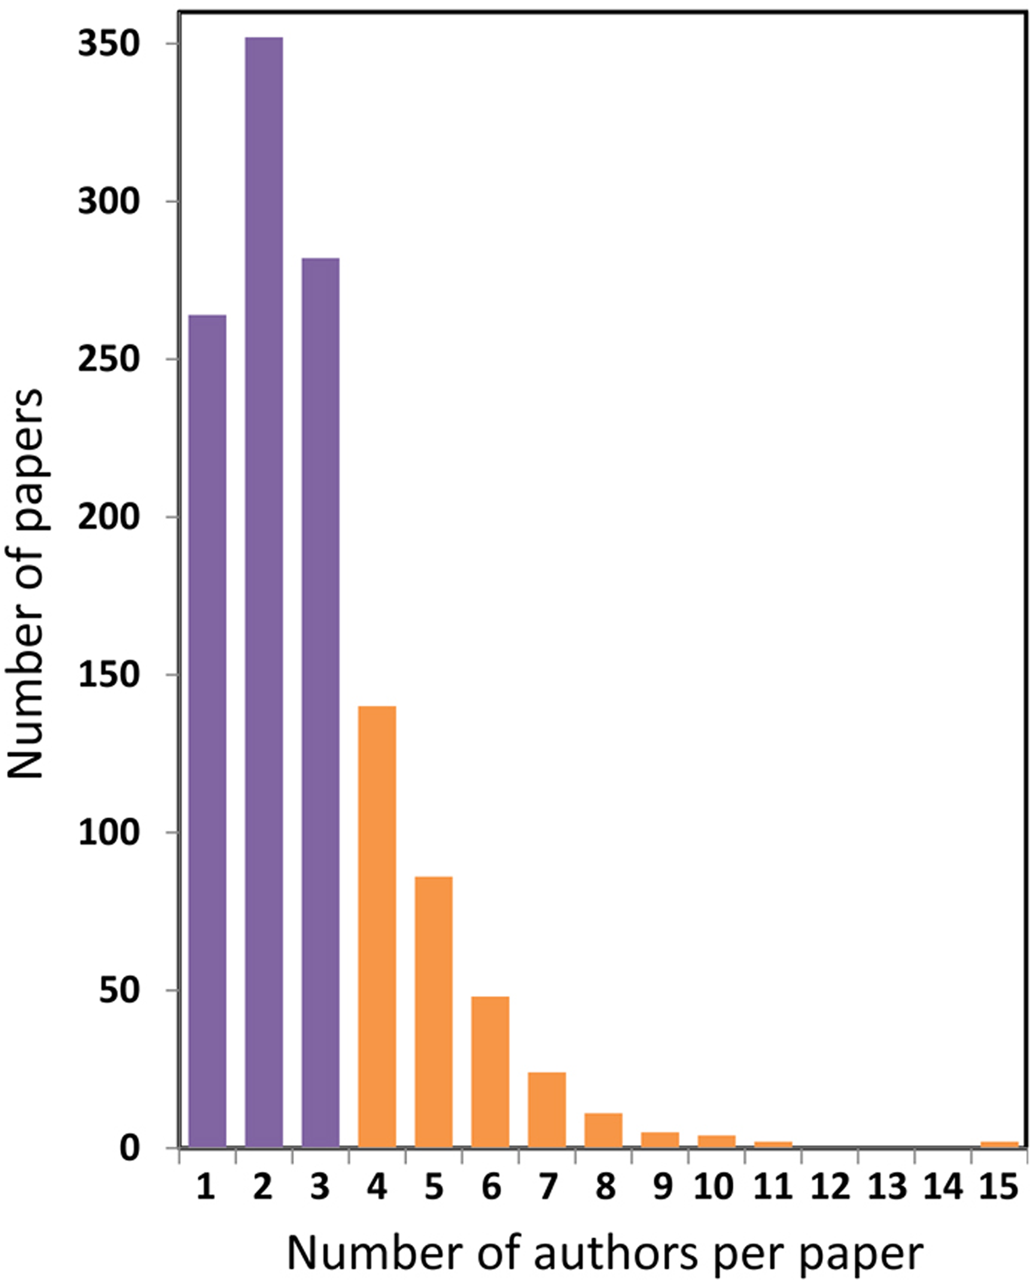
There have been 264 single-authored papers (22%), 634 papers with two or three authors (53%), 216 papers with four or five authors (19%), 92 papers with six to ten authors (7.5%), and six papers with more than ten authors (0.5%). By far the most frequent number was between one and three authors, representing 75% of all papers (Fig. 8). For comparison, prior to 2000, 59% of all papers were single-authored and 97% of all papers had between one and three authors. Thus, authorship in The Lichenologist during the past two decades has followed a general trend towards multi-authored papers (Wuchty et al. Reference Wuchty, Jones and Uzzi2007; Nabout et al. Reference Nabout, Parreira, Teresa, Carneiro, Cunha, Ondei, Caramori and Soares2015; Logan Reference Logan2016; Teixeira da Silva & Dobránszki Reference Teixeira da Silva and Dobránszki2016), although this development was not as pronounced as it was in scientific journals in general, which as of 2019 showed a mean of 6.0 authors with papers frequently having over 100 authors (Aboukhalil Reference Aboukhalil2014).
Frequency distribution of the number of authors per publication in The Lichenologist from 2000 to 2019. Two additional papers had 20 and 30 authors, respectively (not included in graph). Papers with up to three authors are highlighted in purple. Purple and orange are represented by darker and lighter shades, respectively. In colour online.
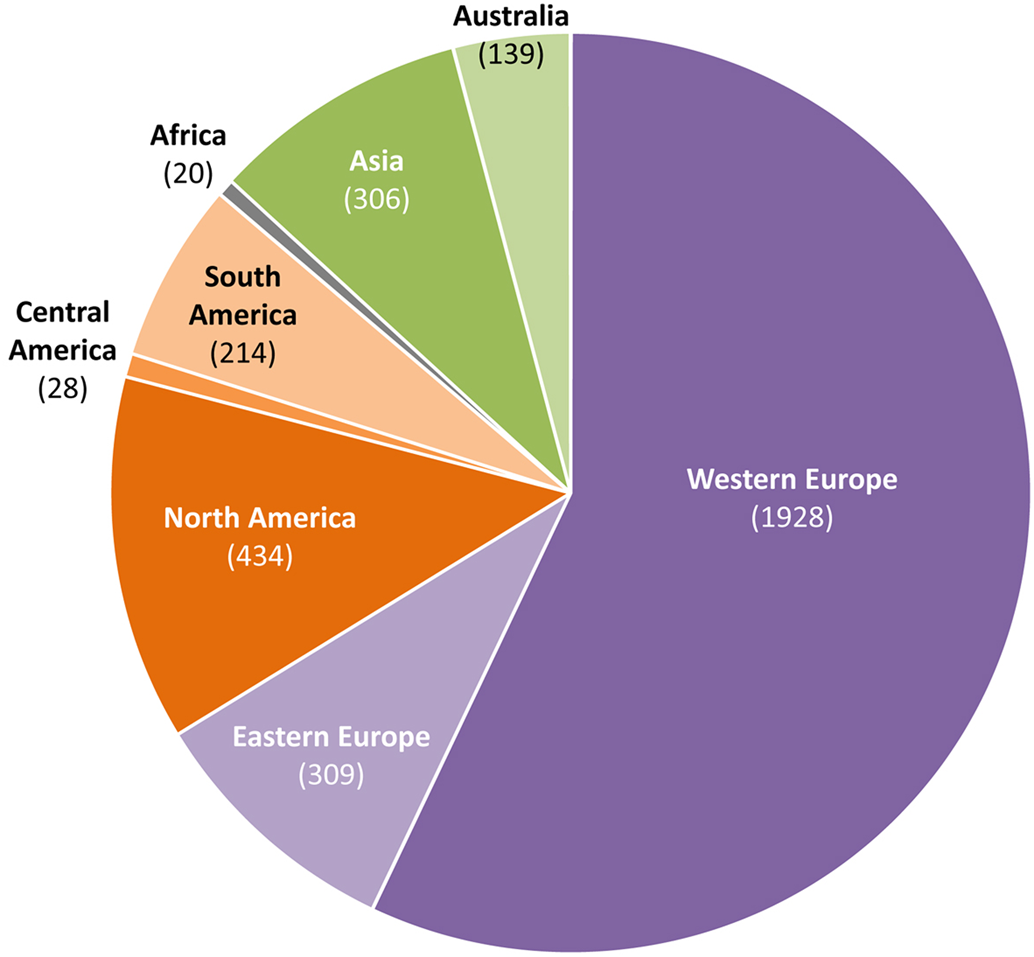
The overwhelming majority of author contributions between 2000 and 2019, based on affiliation at the time of publication, came from Europe (66%), particularly Western Europe (57%), followed by North America (13%), Asia (9%), Latin America (7%), in particular South America (6%), and Australia (4%). Few author contributions came from Africa (Fig. 9). This reflects an ongoing issue in mycology in general, although geographical balance is much improved compared to historical times (Lücking Reference Lücking2020).
Geographical author contributions (frequency) based on affiliation at the time of publication in The Lichenologist from 2000 to 2019. In colour online.
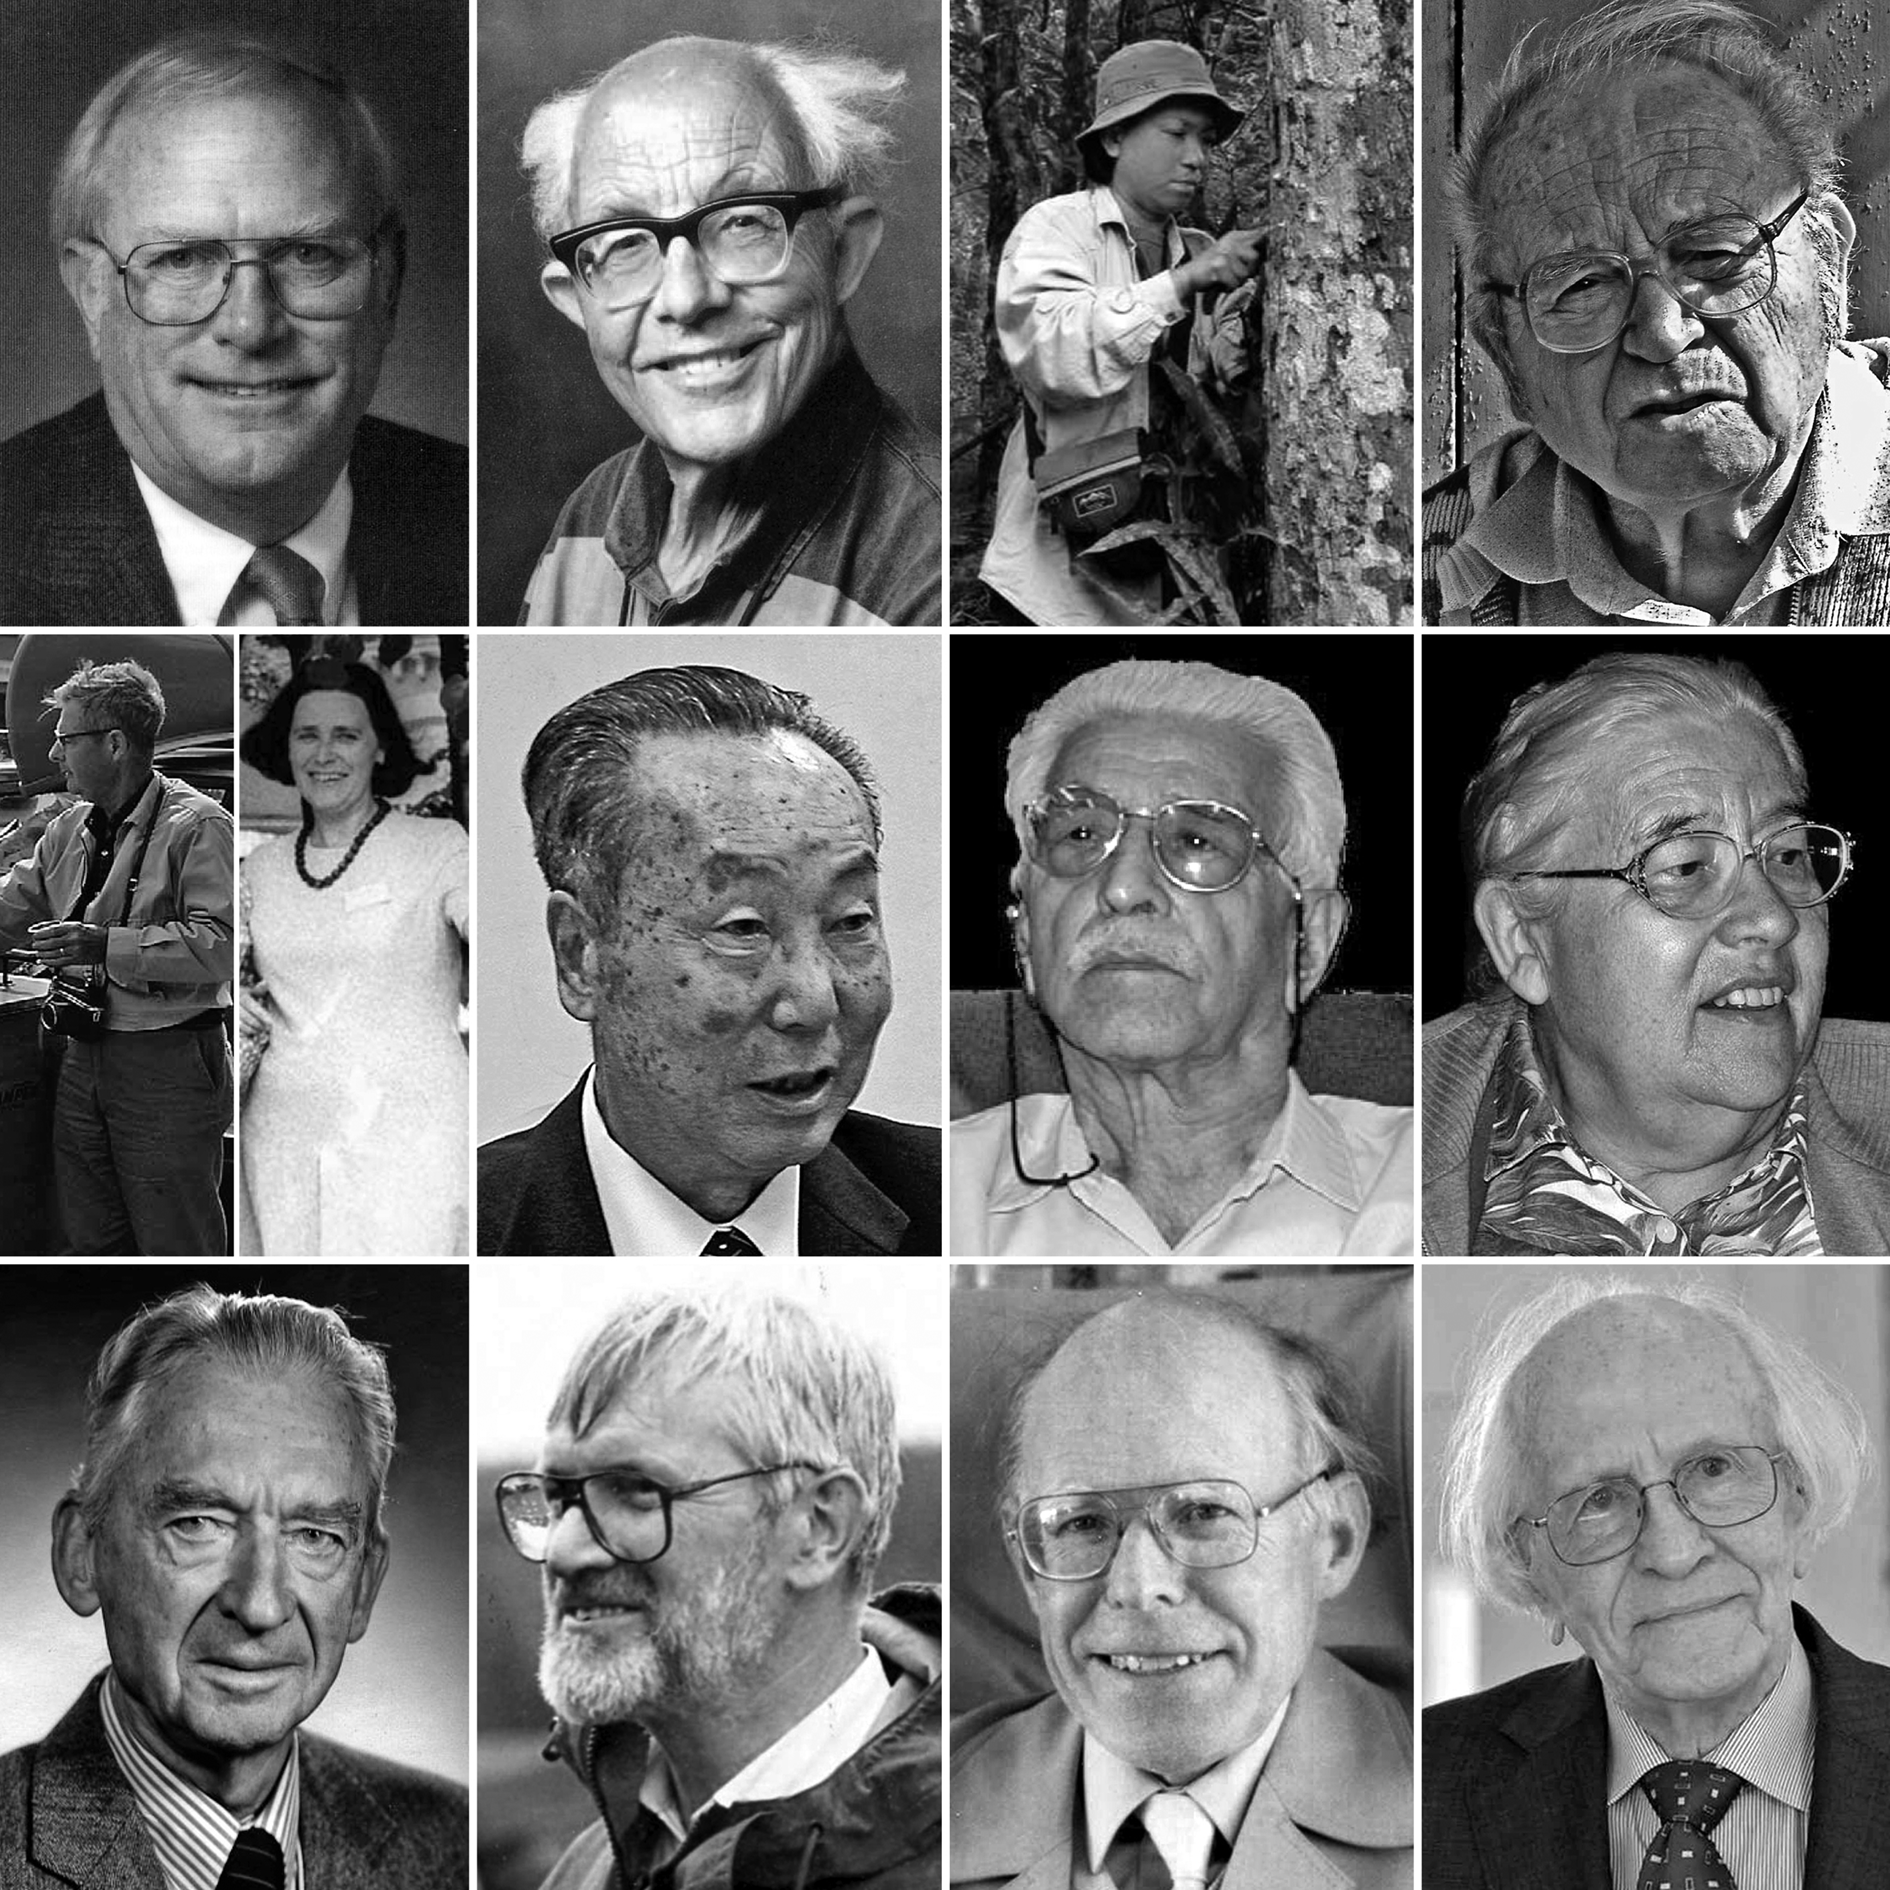
Peter's tenure as senior editor of The Lichenologist during the past two decades saw the passing of some of the greatest lichenologists of the 20th century, with tributes published in the journal (Fig. 10). These included: William Louis Culberson (1929–2003), a pioneer in the chemotaxonomy of lichens (Elix & Nash Reference Elix and Nash2003); Oliver Lathe Gilbert (1936–2005), past president of the British Lichen Society and editor of the British Lichen Society Bulletin (Purvis Reference Purvis2005); Natsurang Homchantara (1957–2006), the first trained lichenologist in Thailand, who received her PhD with Brian Coppins in the UK in 1999 and passed away at the young age of 49 (Boonpragob Reference Boonpragob2010); Antonín Vězda (1920–2008), arguably one of the leading lichen taxonomists of all time (Farkas et al. Reference Farkas, Lücking and Wirth2010); John Walter Thomson (1913–2009), a pioneer in North American contemporary lichenology (Ahti Reference Ahti2009); Nina Sergeevna Golubkova (1932–2009), leading Russian lichenologist (Biazrov et al. Reference Biazrov, Zhurbenko and Seaward2010); Syo Kurokawa (1926–2010), Japanese lichenologist and world expert in Parmeliaceae and Physciaceae, who developed the TNS herbarium into a world-class collection (Kashiwadani Reference Kashiwadani2011); Dharani Dhar Awasthi (1922–2011), known as the ‘Father of Indian Lichenology’ (Singh Reference Singh2013); Aino (Marjatta) Henssen (1925–2011), who single-handedly redefined the importance of anatomy and ontogeny in lichen fungi for taxonomy and systematics (Lumbsch & Döring Reference Lumbsch and Döring2012); Rolf Santesson (1916–2013), a pioneer in the modern taxonomy of foliicolous lichens and ahead of his time envisioning a phylogenetic classification of lichen fungi (Tibell & Moberg Reference Tibell and Moberg2014); Peter Wilfrid James (1930–2014), a prominent figure in British lichenology, founding member and past president of the BLS, and first editor of The Lichenologist (Wolseley et al. Reference Wolseley, Jørgensen, Kantvilas and Thüs2015); Jack Rodney Laundon (1934–2016), also a founding member and past president of the BLS, astute in questions of nomenclature (Seaward & Hawksworth Reference Seaward and Hawksworth2017); and Otto Ludwig Lange (1927–2017), one of the foremost authorities on ecophysiological studies in lichens (Green Reference Green2019). Some of these well-remembered colleagues published their last or only scientific papers in The Lichenologist (Homchantara & Coppins Reference Homchantara and Coppins2002; Gilbert Reference Gilbert2004; Vězda in Lücking et al. Reference Lücking, Sérusiaux and Vězda2005; James Reference James2010; Lange in Bader et al. Reference Bader, Zotz and Lange2010; Laundon Reference Laundon2010).
Renowned lichenologists who passed away during the past two decades, with tributes published in The Lichenologist. Upper row, from left to right: William L. Culberson (1929–2003), Oliver L. Gilbert (1936–2005), Natsurang Homchantara (1957–2006), Antonín Vězda (1920–2008). Middle row, from left to right: John W. Thomson (1913–2009), Nina S. Golubkova (1932–2009), Syo Kurokawa (1926–2010), Dharani Dhar Awasthi (1922–2011), Aino Henssen (1925–2011). Lower row, from left to right: Rolf Santesson (1916–2013), Peter W. James (1930–2014), Jack R. Laundon (1934–2016), Otto L. Lange (1927–2017). Pictures taken from the original tributes (see text) and adjusted for greyscale and contrast. Photograph credits: see references cited in the text, with specific credits to J. Kocourková, T. Ahti, O. Blum, R. Honegger and H. Hertel. Reprinted with permission.
Several other esteemed colleagues passed away during this period, also recipients of the prestigious IAL Acharius Medal like most of those mentioned above. These included Elisabeth Tschermak-Woess (1917–2001), F. J. Georges A. Clauzade (1914–2002), Siegfried Huneck (1928–2011), Christian Leuckert (1930–2011), Margalith Galun (1927–2012), Erast Parmasto (1928–2012), Vernon Ahmadjian (1930–2012), Hildur Krog (1922–2014), David John Galloway (1942–2014), and Hans-Voldemar Trass (1928–2017). While some of these were prolific contributors to the journal, others rarely, if ever, authored papers in The Lichenologist. Both Huneck and Galloway published among their last papers in the journal (Hauck & Huneck Reference Hauck and Huneck2007; Galloway Reference Galloway2014). David Galloway was especially close to the journal, being author of a total of 44 papers, owing to his tenure in various positions, including Head of the Lichen/Bryophyte Division at the British Museum (Natural History) in London between 1973 and 1994, being an associate editor of The Lichenologist between 1987 and 1996, and vice president of the British Lichen Society between 1993 and 1994. It was Peter Crittenden who took over David's slot as associate editor in 1997, before becoming senior editor three years later.
Geographical focus of publications between 2000 and 2019
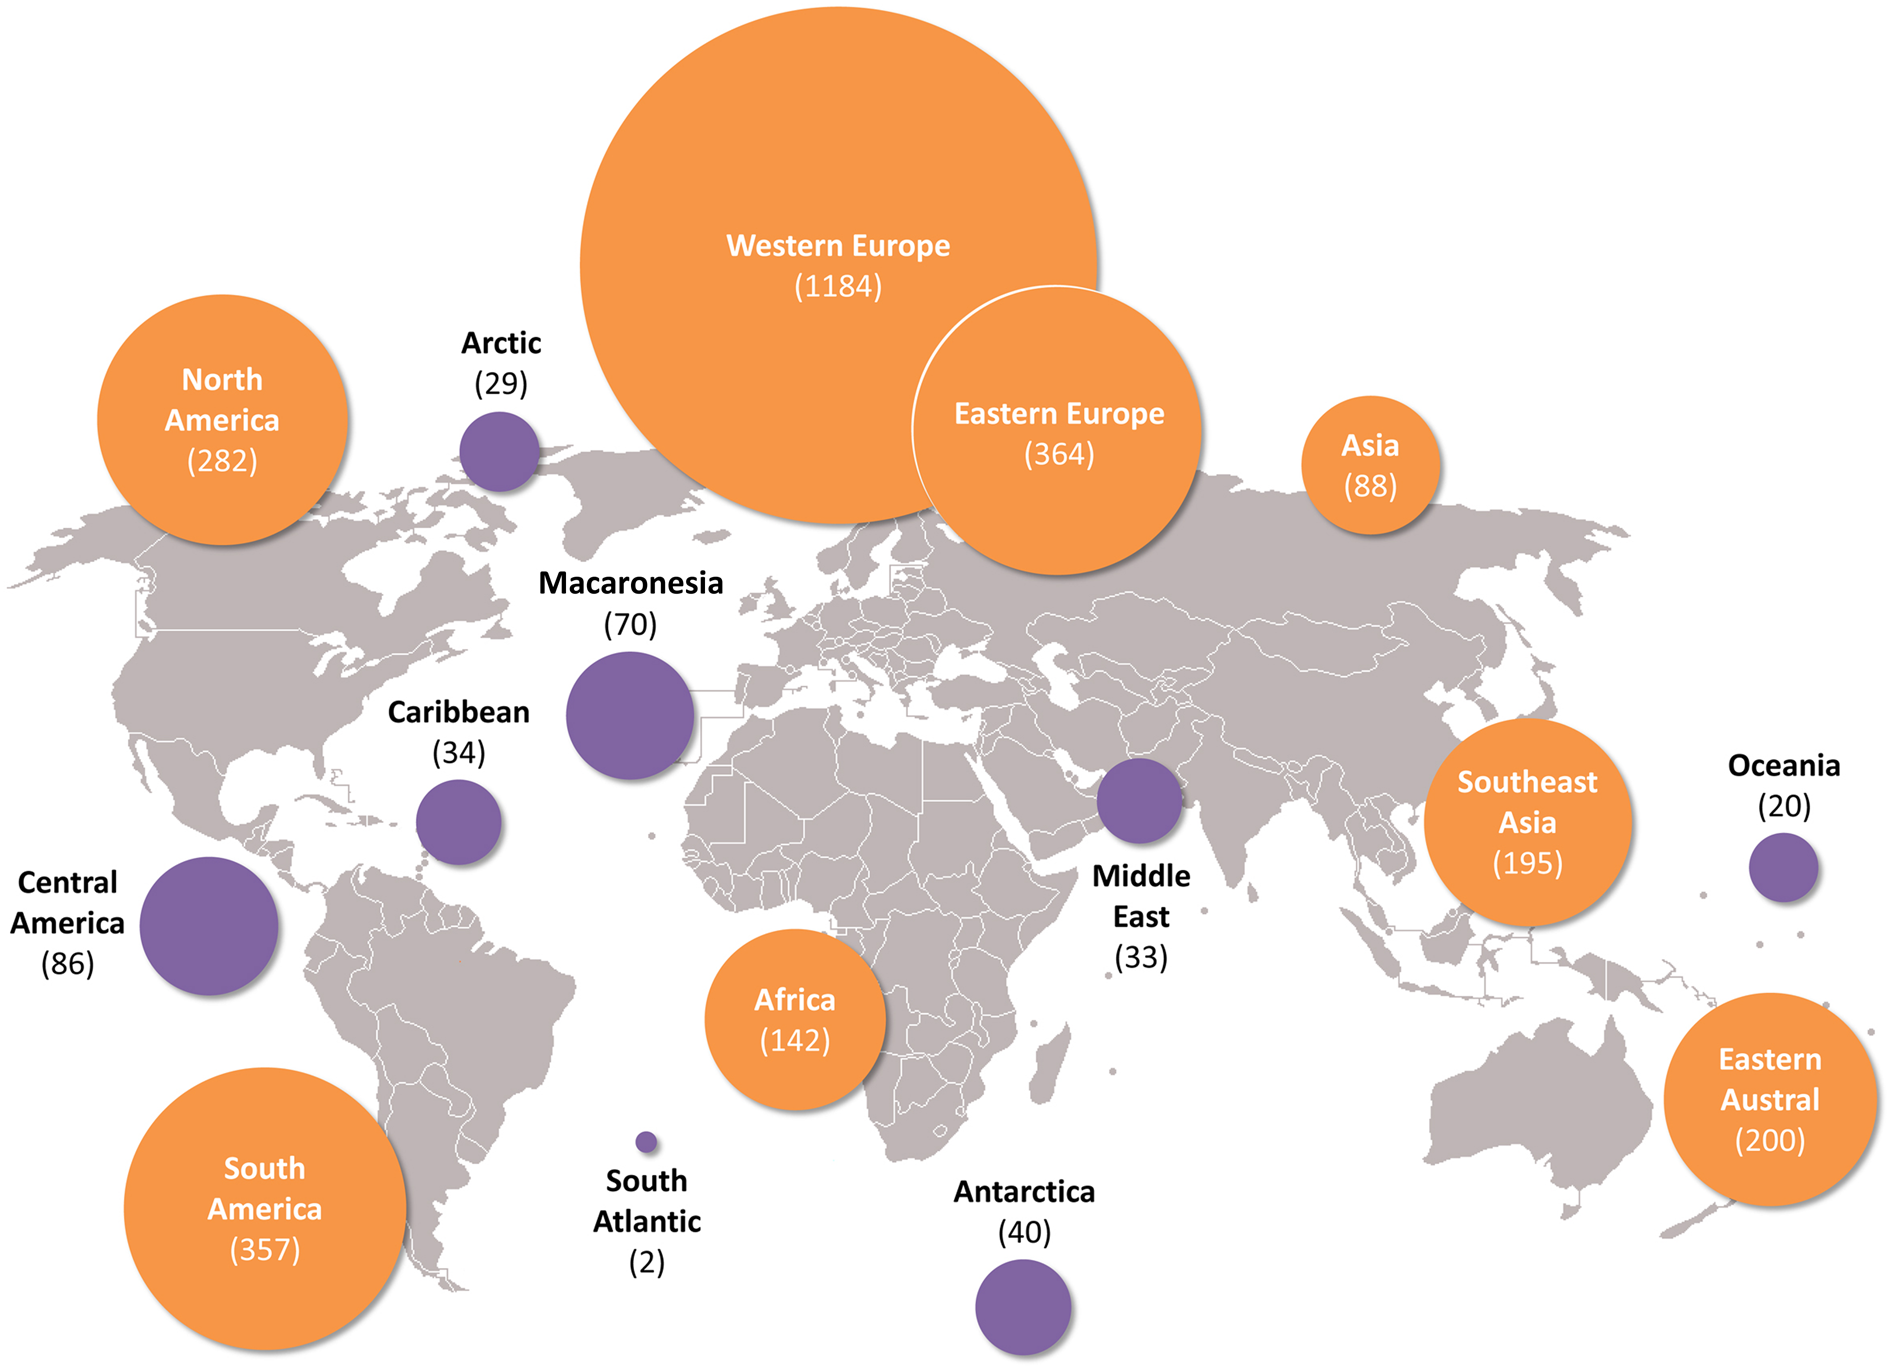
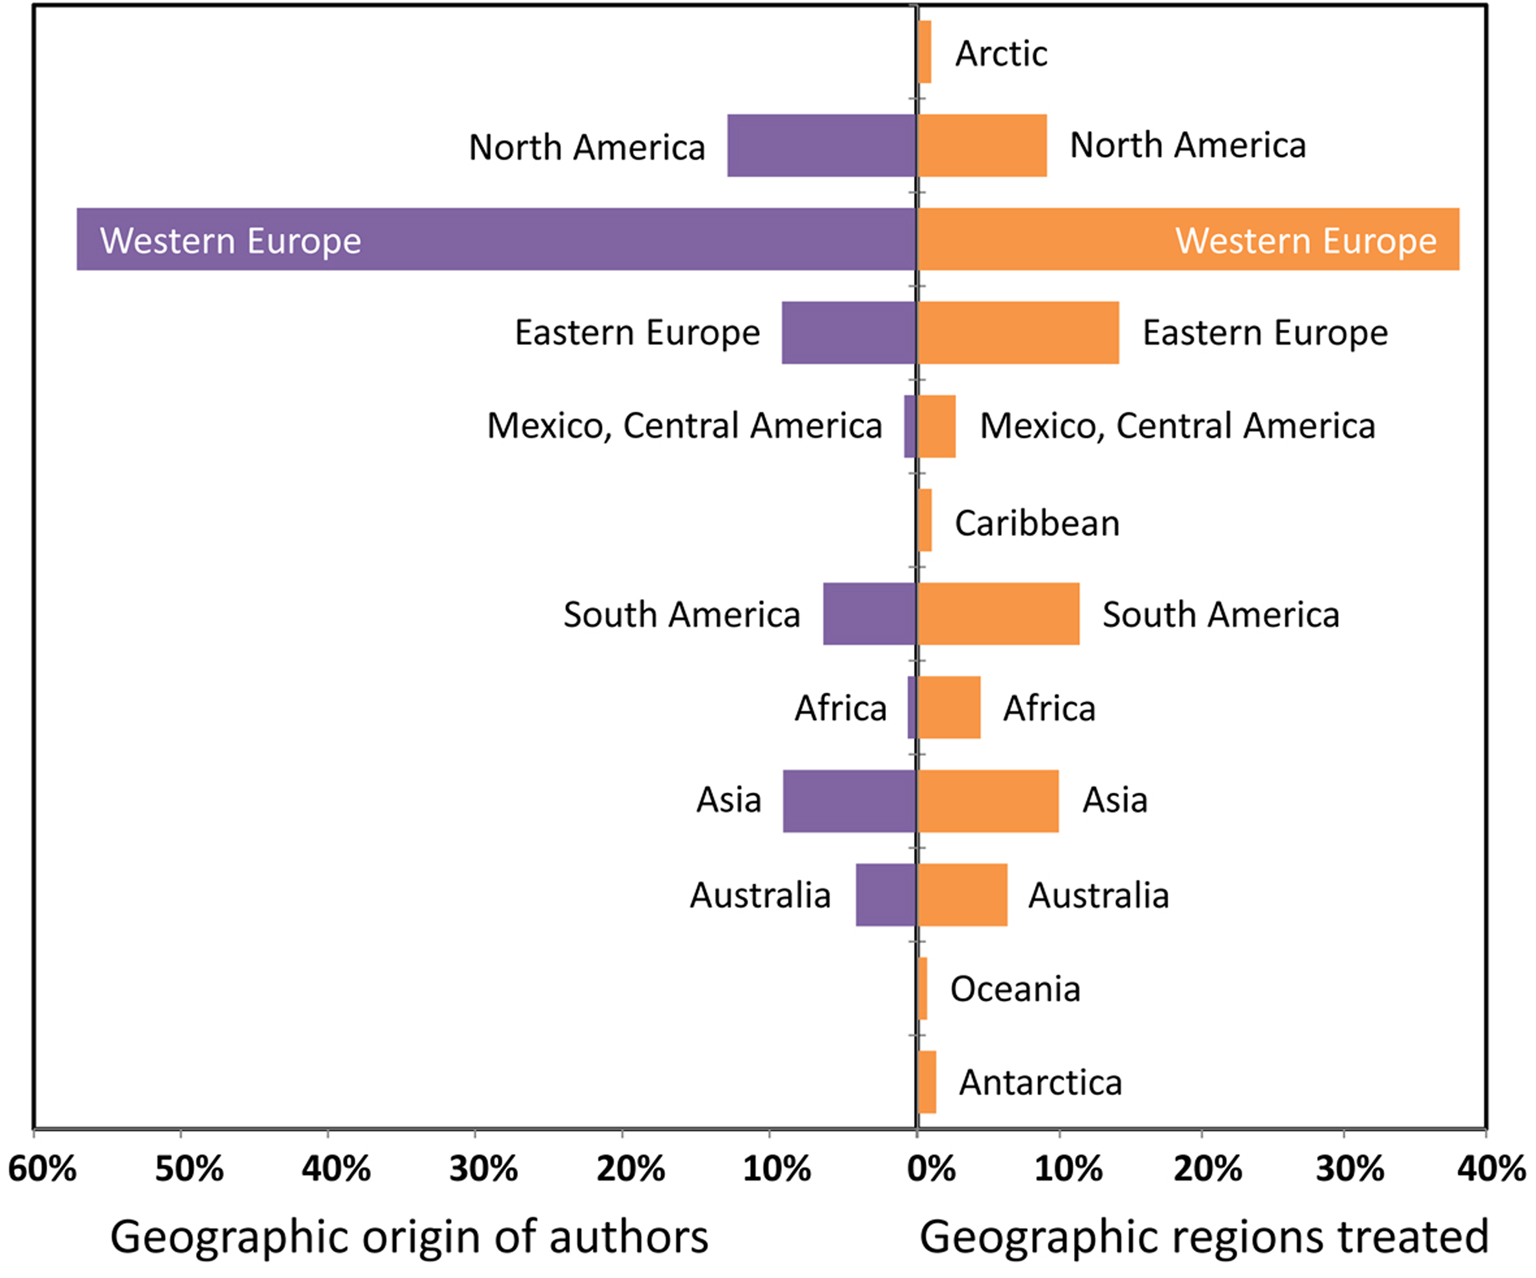
At a regional scale, the overwhelming majority of studies published in The Lichenologist between 2000 and 2019 were performed in Europe (49%), particularly in Western Europe (38%). Notably, the geographical region with the second highest number of studies was South America (11%), followed by North America and Asia (9% each). In the latter case, a higher proportion of studies related to South-East Asia (6%) compared to mostly temperate Asia (3%). The eastern austral region (Papua New Guinea, Solomon Islands, Australia, New Zealand) and Africa contributed 6.5% and 4.5% of the studies, respectively (Fig. 11). Other regions had a share of between 0.6% and 2.2%.
Geographical focus of studies published in The Lichenologist from 2000 to 2019. Regions with a higher number of contributions are in orange, others in purple. The total is substantially higher than the total number of papers, since many papers encompass more than one geographical region. Purple and orange are represented by darker and lighter shades, respectively. In colour online.
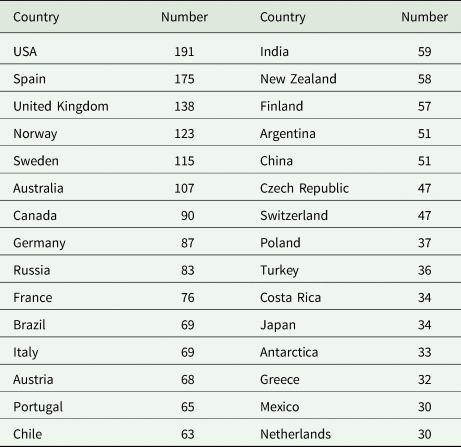
In terms of individual countries, most studies between 2000 and 2019 were performed in the continental United States, followed by Spain, the United Kingdom, Norway, Sweden, Australia, Canada, Germany, Russia and France (Table 1). Largely tropical, Asian or Southern Hemisphere countries with a comparatively high number of contributions included Brazil, Chile, India, China, Costa Rica, Japan and Mexico. This reflects a trend that commenced in the second half of the 20th century in the geographical diversification of mycological and lichenological expertise (Lücking Reference Lücking2020).
The 30 countries where the highest number of publications in The Lichenologist were focused, from 2000 to 2019.
Geographical origin of author contributions correlated rather well with geographical focus of the individual study areas (Fig. 12). However, a slight shift could be observed for North American and Western European authors showing more frequent involvement in studies outside these regions, whereas for most other geographical regions, corresponding authorships were under-represented. This was particularly obvious for Africa but to a certain extent also for Central and South America, and Australia (Fig. 12). Some studied regions had no contributing authors, which by default applied to the Artic and Antarctica, but was also notable for the Caribbean and Oceania. In particular cases, these gaps were caused by authors having their origin in a particular region but at the time of publication were affiliated elsewhere, for instance by doing a Ph.D. abroad, such as the Puerto Rican lichenologist Joel A. Mercado-Díaz who is currently affiliated with the University of Chicago and The Field Museum (Aptroot et al. Reference Aptroot, Ertz, Etayo, Gueidan, Mercado-Díaz, Schumm and Weerakoon2016, Reference Aptroot, Sipman, Mercado-Díaz, Mendonça, Feuerstein, Cunha-Dias, Pereira and Cáceres2018; Lücking et al. Reference Lücking, Nelsen, Aptroot, Barillas de Klee, Bawingan, Benatti, Binh, Bungartz, Cáceres and Canêz2016b; Moncada et al. Reference Moncada, Mercado-Díaz and Lücking2018).
Comparison of the geographical origin of author contributions based on affiliation at the time of publication with the geographical focus of studies published in The Lichenologist from 2000 to 2019, expressed as percentage of the total. The total is substantially higher than the total number of papers, since many papers encompass more than one geographical region, in terms of both authors and study areas. In colour online.
Topic orientation of publications between 2000 and 2019
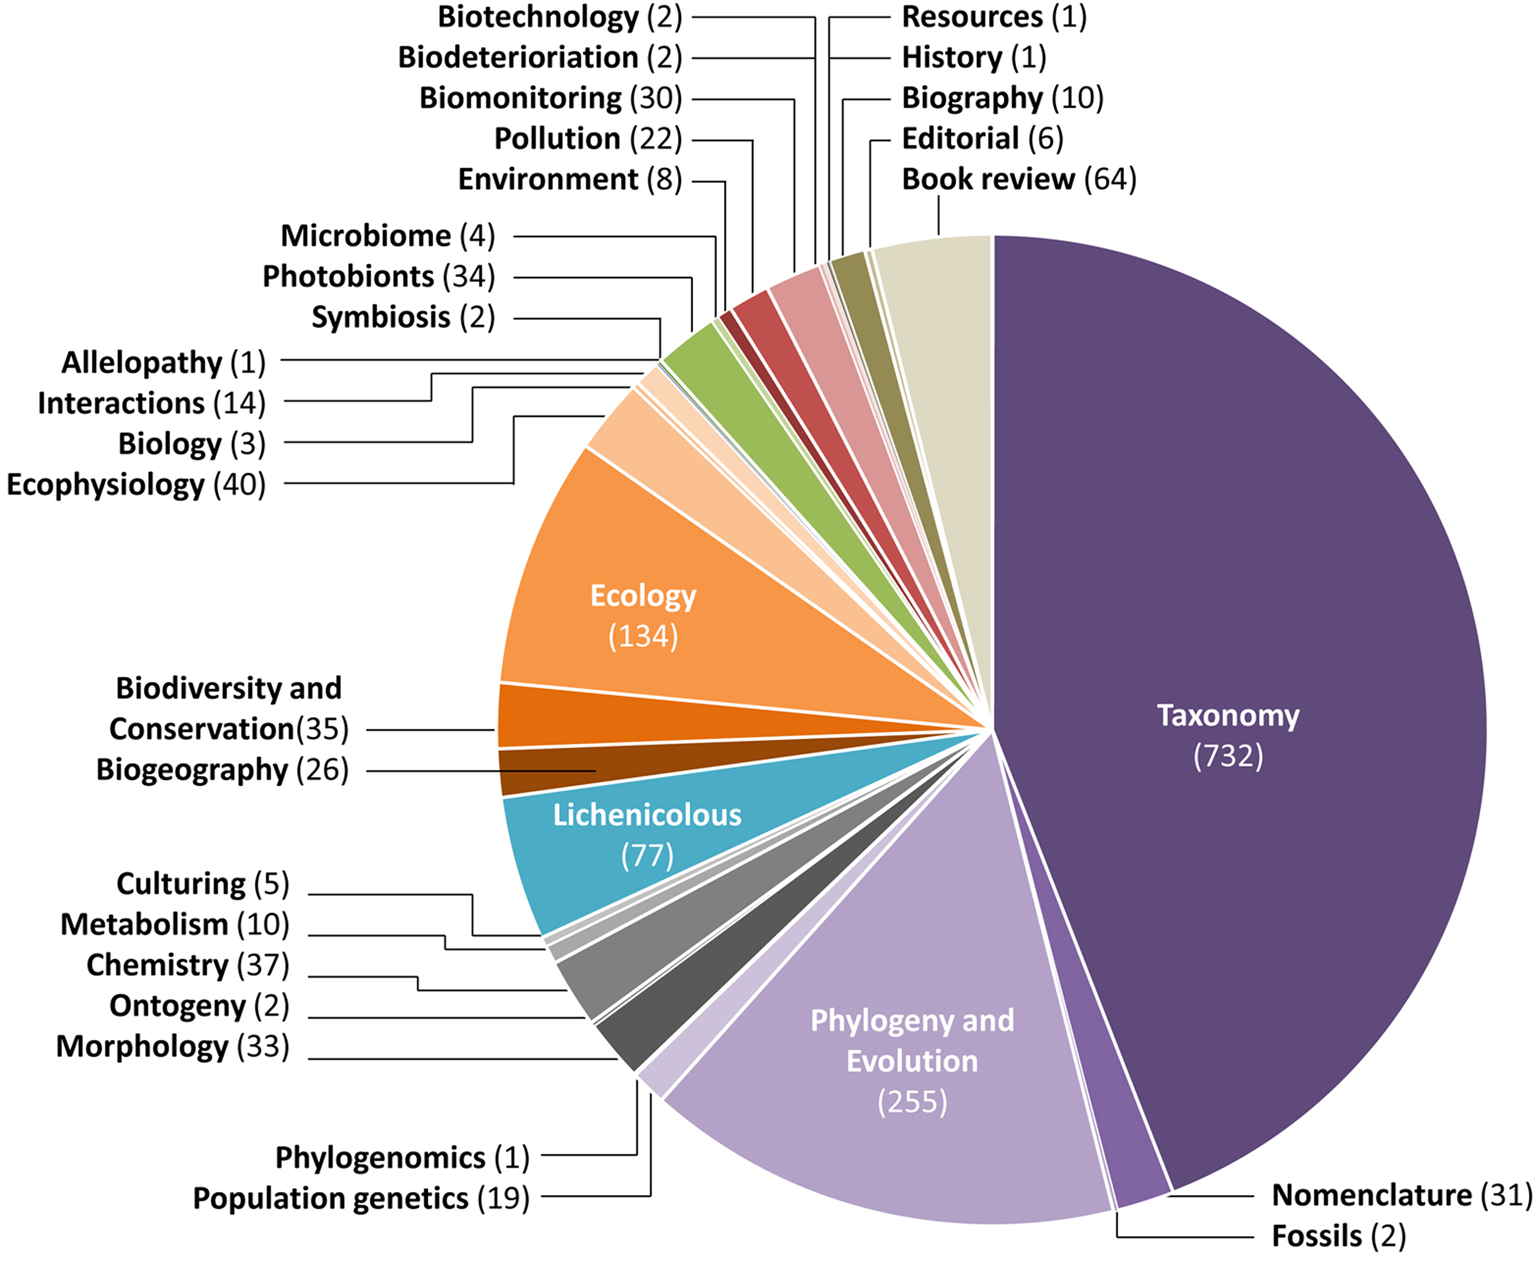
By far the most frequently covered topic in the 1197 papers published in The Lichenologist between 2000 and 2019 was taxonomy (44%), mostly alpha taxonomy but also new higher taxa and systematic rearrangements. Around 17% of the topics referred to a molecular phylogenetic component, mostly tree-based phylogenetics (15.5%), often accompanying taxonomic studies. The other two most frequent topics were lichenicolous fungi (4.7%) and ecology (8%). Overall, 32 topics could be distinguished, with many papers encompassing more than one (1.37 on average). Even with a dominance in taxonomy and systematics, the topics covered by the journal during the past two decades have been quite diverse (Fig. 13).
Diversity and relative proportion of topics covered by studies published in The Lichenologist between 2000 and 2019. The total is higher than the total number of papers, since many papers encompass more than one topic. In colour online.
Over the past two decades, individual papers have highlighted advances in molecular approaches. A study of Parmeliopsis ambigua and P. hyperopta was among the first to employ the fungal ITS for species delimitation and to demonstrate the applicability of chemotaxonomy (Tehler & Källersjö Reference Tehler and Källersjö2001). Orock et al. (Reference Orock, Leavitt, Fonge, St. Clair and Lumbsch2012) tested the performance of blast-based identifications on lichens from Cameroon, while Redchenko et al. (Reference Redchenko, Vondrák and Košnar2012) obtained ITS data from a 151-year-old herbarium specimen. In the same year, Bates et al. (Reference Bates, Donna, Lauber, Walters, Knight and Fierer2012) published the first study on the eukaryote lichen microbiome using 454 pyrosequencing. More recently, Ludwig et al. (Reference Ludwig, Summerfield and Singh2017) presented one of the few studies on mating-type loci in lichen fungi, in the enigmatic species Knightiella (Icmadophila) splachnirima, a temperate eastern austral endemic (Ludwig Reference Ludwig2016), and Dal Grande et al. (Reference Dal Grande, Meiser, Tzovaras, Otte, Ebersberger and Schmitt2018) sequenced the genome of Lasallia hispanica. Evidence for the formation of genetically identical, yet phenotypically discrete morphs was reported for the South American genus Endocena (Fryday et al. Reference Fryday, Schmitt and Pérez-Ortega2017).
A still largely neglected, yet apparently growing, field of study is integrative taxonomy, in which phenotypic features are analyzed using quantitative, often multivariate methods, ideally within a phylogenetic framework. During Peter Crittenden's tenure as senior editor, The Lichenologist published quite a number of papers using this approach, covering taxa in Parmeliaceae, Physciaceae and Teloschistaceae (Arup & Åkelius Reference Arup and Åkelius2009; Truong et al. Reference Truong, Naciri and Clerc2009; Lendemer & Hodkinson Reference Lendemer and Hodkinson2010; Arup & Berlin Reference Arup and Berlin2011; Resl et al. Reference Resl, Mayrhofer, Clayden, Spribille, Thor, Tønsberg and Sheard2016). Among the many monographic revisions appearing during this period, one on the genus Dirina (Tehler et al. Reference Tehler, Ertz and Irestedt2013) stands out. One of many highlights regarding lichenicolous fungi was a paper on the new species Tremella cetrariellae (Millanes et al. Reference Millanes, Diederich, Westberg, Pippola and Wedin2015). The only two papers on fossil lichens, encompassing lobarioid and parmeloid lichens, were published during the first year of Peter's tenure (Peterson Reference Peterson2000; Poinar et al. Reference Poinar, Peterson and Platt2000); these fossils play an important role in time-calibrating phylogenetic trees.
Among the numerous and diverse papers on biological aspects of lichens, notable contributions included a study on the discrimination of lichen taxa using element concentrations (Bennett Reference Bennett2008) and an essay on the evolutionary implications of asexual reproduction in lichens (Tripp Reference Tripp2016). Perhaps the most understated contribution was a laborious analysis of lichen microbionts in Lobaria retigera, Parmelia omphalodes and Umbilicaria esculenta (Jiang et al. Reference Jiang, Wang, Si, Zhao, Liu and Zhang2017), published as a Short Communication but easily amounting to a standard paper. In an extensive review on the ecology of soil crust lichens, Green et al. (Reference Green, Pintado, Raggio and Sancho2018) pointed out the remarkable convergence in so-called ‘window lichens’, beautifully elaborated in an earlier paper by Vogel (Reference Vogel1955).
A curious occurrence was the publication of two subsequent papers, with taxonomically different content but inadvertently exactly the same title, ‘New species and records of Lepraria (Stereocaulaceae, lichenized Ascomycota) from South America’ (Flakus & Kukwa Reference Flakus and Kukwa2007; Flakus et al. Reference Flakus, Rodríguez and Kukwa2011).
Taxonomic diversity recorded in publications between 2000 and 2019
Retroactively applying revised genus concepts, a total of 835 genera were treated in the 1197 papers published in The Lichenologist between 2000 and 2019. Of these, 749 corresponded to lichenized taxa and the remainder to lichenicolous (78) or non-lichenized taxa (8). Among the lichenized genera, 642 matched genera accepted in the most recent classification of lichenized fungi (Lücking et al. Reference Lücking, Hodkinson and Leavitt2017a, Reference Lücking, Hodkinson and Leavittb). Another 107 names represented either outdated genus names (97) or genera newly established since 2017 (10). Among the 78 lichenicolous genera, 69 corresponded to genera accepted in the most recent classification (Diederich et al. Reference Diederich, Lawrey and Ertz2018), whereas seven genus names were outdated and two have been newly established since that classification was published.
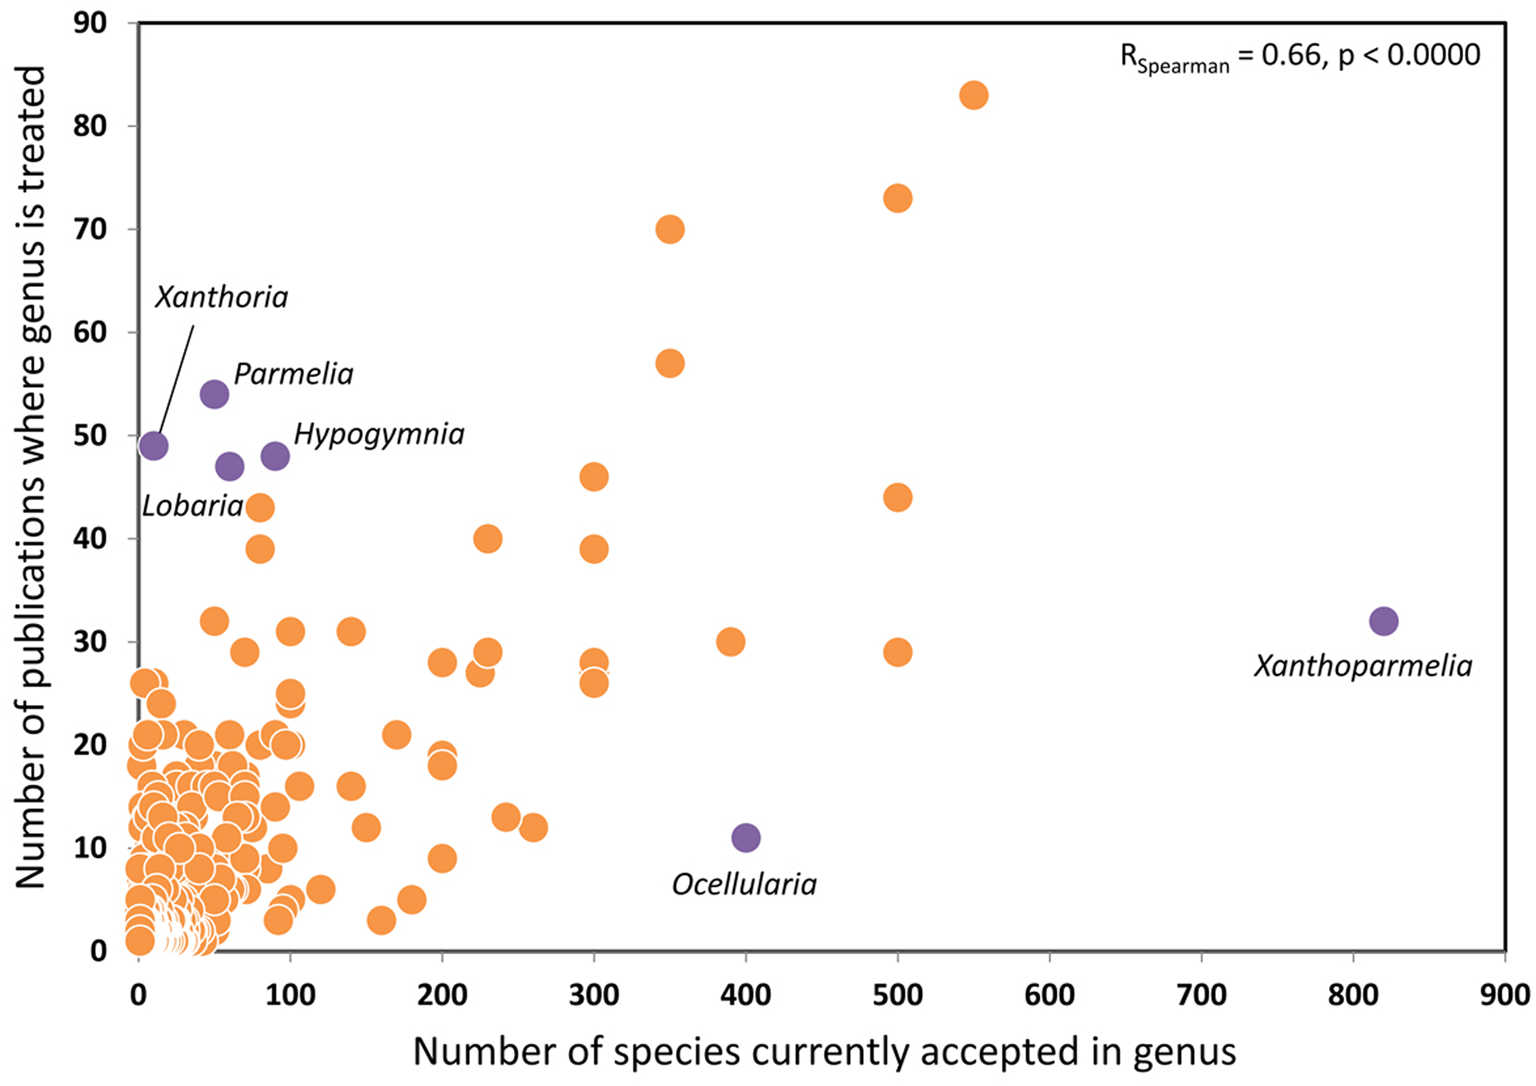
Therefore, the 1197 papers published under Peter's tenure as senior editor of the journal can be considered broadly representative of the diversity of lichen fungi, with over 60% of the currently accepted genera treated, whereas only 17% of the currently accepted genera of lichenicolous fungi were covered. The hypothesis that the known species richness per genus, with reference to Lücking et al. (Reference Lücking, Hodkinson and Leavitt2017a, Reference Lücking, Hodkinson and Leavittb), was a good predictor of the number of times a given genus was treated in a study was supported by the data (Fig. 14), giving a good and statistically highly significant non-parametric correlation (RSpearman = 0.66, P < 0.0000). However, a number of genera were treated more often than expected based on their species richness, including Xanthoria, Pseudevernia, Parmelia, Parmeliopsis, Platismatia, Evernia, Melanelia, Lobaria, Cetraria and Hypogymnia. Other genera appeared less often than expected: Ocellularia, Xanthoparmelia, Fissurina, Phaeographis, Cora, Polyblastia, Hypotrachyna, Phyllopsora, Rhabdodiscus and Thelidium. The latter includes predominantly tropical genera that are generally under-represented in publications.
Correlation between the number of species currently accepted in a genus and the number of publications where the genus was treated in The Lichenologist from 2000 to 2019. Selected genera more or less frequently treated than expected based on species richness are highlighted in purple. Purple and orange are represented by darker and lighter shades, respectively. In colour online.
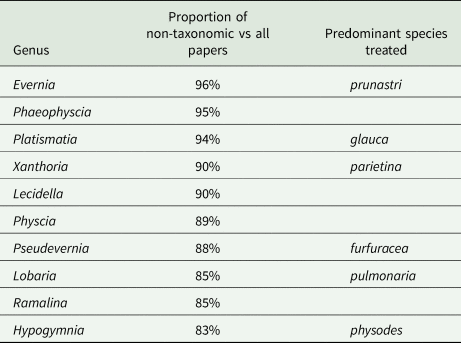
Papers with a taxonomic or systematic focus on lichenized fungi encompassed 647 genera, whereas studies with an emphasis on non-taxonomic topics, such as ecology, biogeography, and biomonitoring, included 428. Some genera appeared frequently and predominantly in non-taxonomic works based on single, common and widespread species (Table 2), which explains the over-representation of these genera in the published papers, even if some are not notably rich in species.
Genera treated in The Lichenologist between 2000 and 2019 occurring in 15 or more papers with a non-taxonomic focus, indicating the proportion relative to all publications treating the genus, as well as the corresponding predominant species if applicable.
Contribution of parameters to Impact Factor
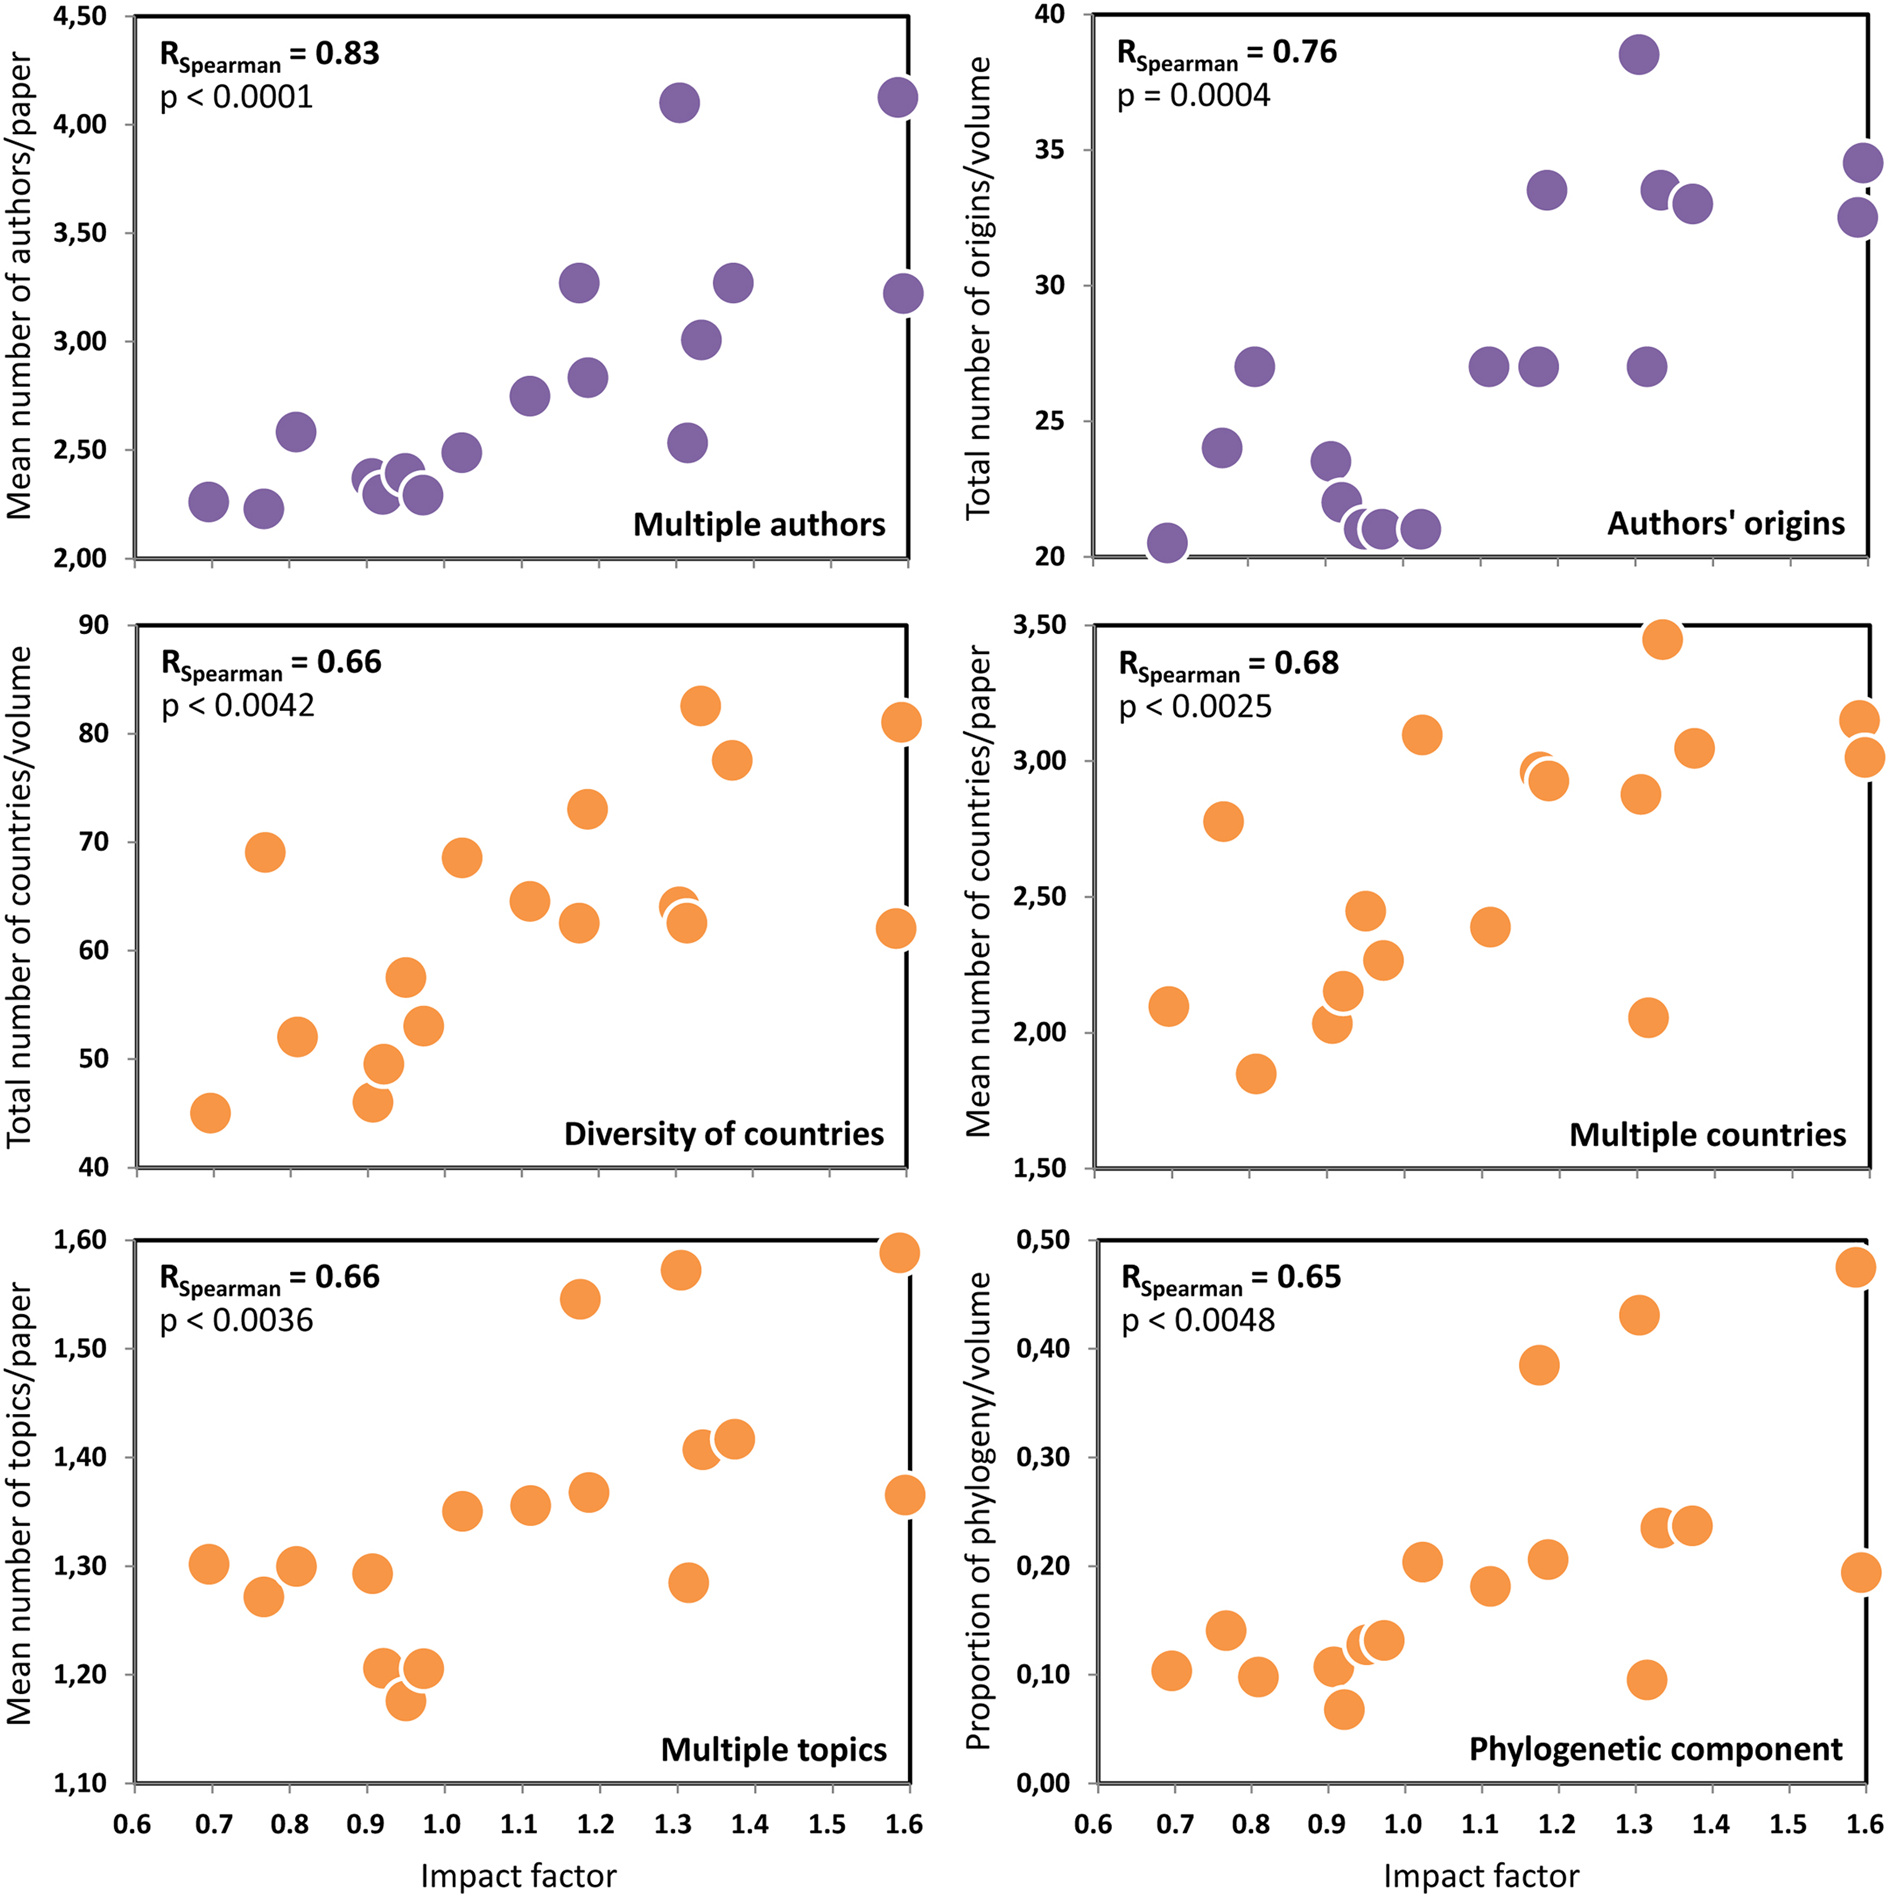
Six of the 11 tested parameters showed a statistically significant rank correlation with IF (Fig. 15). The strongest correlation was observed for mean number of authors per paper per volume, followed by total number of country origins of authors per volume, both highly significant (P < 0.001). Four further parameters exhibited a significant correlation (P < 0.05), namely diversity of study countries per volume, mean number of study countries per paper per volume, mean number of topics per paper per volume, and proportion of studies with phylogenetic components per volume (Fig. 15). The five remaining parameters, viz. diversity of topics per volume, proportion of non-taxonomic topics per volume, diversity of genera per volume, mean number of genera per paper per volume, inclusion of a thematic issue in volume, did not show statistically significant correlations with IF. In particular, taxonomic diversity did not affect the IF.
Correlation between the impact factor (IF) of The Lichenologist from 2000 to 2019 and six selected publication parameters (means of two years prior). Spearman rank correlations and corresponding P-values are indicated and parameters with highly significant correlations ae highlighted in purple. Purple and orange are represented by darker and lighter shades, respectively. In colour online.
Both forward stepwise and backward stepwise multiple regression revealed mean number of authors per paper per volume as the single, statistically significant component contributing to IF, with R = 0.93, beta = 2.43, P = 0.0072 for forward stepwise and R = 0.79, beta = 0.79, P = 0.0002 for backward stepwise multiple regression. Generalized non-linear multiple regression also resulted in mean number of authors per paper per volume being the most significant component (Wald statistic = 12.79, P = 0.0003), but further identified two additional parameters as statistically significant components: total number of country origins of authors per volume (Wald statistic = 7.42, P = 0.0064) and diversity of topics per volume (Wald statistic = 4.08, P = 0.0434).
Thus, mean number of authors per paper per volume and total number of country origins of authors per volume appear to be the most important parameters influencing the IF, suggesting that papers with multiple authors of diverse geographical origin have higher short-term citation rates, an observation also found in other studies (Tahamtan et al. Reference Tahamtan, Afshar and Ahamdzadeh2016). The multiple regression approach indicates that it is indeed authorship and not the underlying content that causes this effect. International teamwork has been shown to positively affect the IF (Didegah & Thelwall Reference Didegah and Thelwall2013), probably also because a diverse composition of authors increases immediate distribution of a paper through multiple networking.
The contribution of individual papers to the highest achieved impact factors in 2014 and 2017 was further investigated by recording the citation numbers for all papers between 2012 and 2013 and between 2015 and 2016 in Web of Science and Google Scholar. Among these, five papers were identified with high citation counts, translating into individual impact factors between 6.56 and 12.38 (Table 3). These included broad-scale revisions and global keys to species-rich groups (Aptroot Reference Aptroot2012; Aptroot & Lücking Reference Aptroot and Lücking2016), phylogenetic reclassifications of higher taxa including commonly studied genera and species, such as the former family Lobariaceae and the Trypetheliaceae (Moncada et al. Reference Moncada, Lücking and Betancourt-Macuase2013; Lücking et al. Reference Lücking, Nelsen, Aptroot, Barillas de Klee, Bawingan, Benatti, Binh, Bungartz, Cáceres and Canêz2016b), and implementation of novel methods (Bates et al. Reference Bates, Donna, Lauber, Walters, Knight and Fierer2012).
The 30 papers published in The Lichenologist from 2000 and 2019 with the highest individual impact factors (IFs) derived from citation counts in the Web of Science. Google Scholar citation counts and derived impact factors are added for comparison. Papers published between 2012 and 2013, and between 2015 and 2016, contributing to high IFs in 2014 and 2017, respectively, are marked with an asterisk. WoS = Web of Science; GS = Google Scholar.
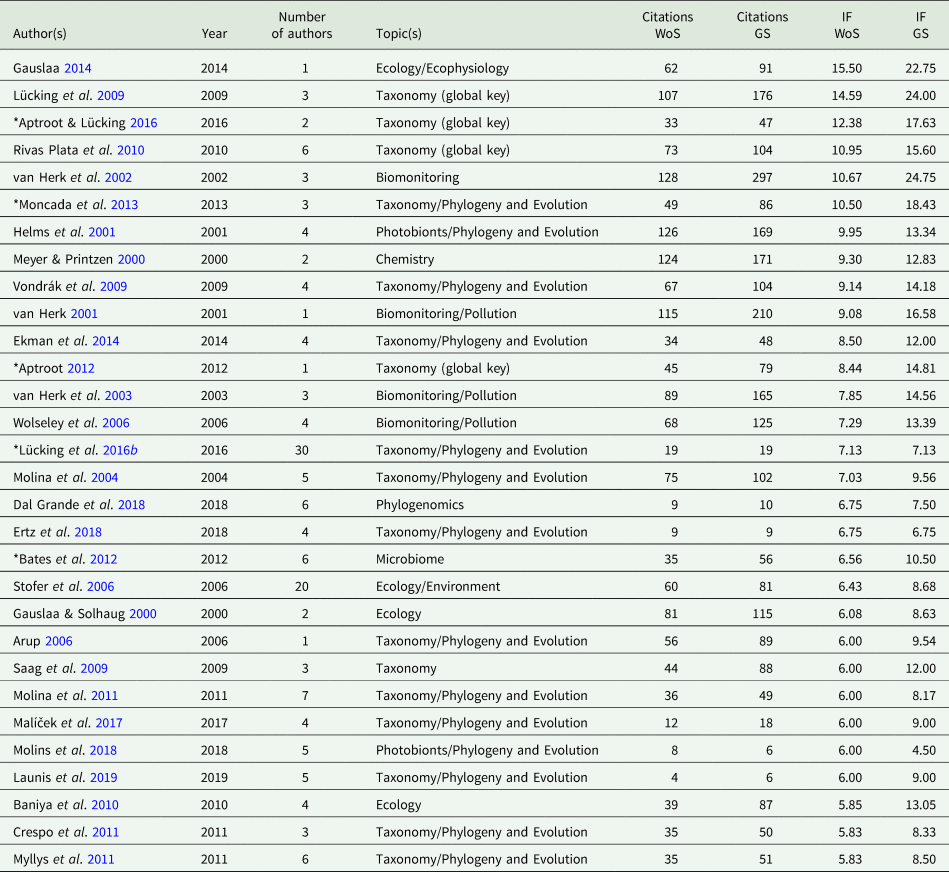
A survey of citation counts and corresponding individual impact factors among all papers published in The Lichenologist between 2000 and 2019 revealed a concentration on certain topics largely matching the above (i.e. large-scale revisionary works with keys, phylogenetic reclassifications, and novel methods including next-generation sequencing and phylogenomics), but also including papers on ecology and ecophysiology, photobionts, secondary chemistry, and particularly on environmental change and using lichens as biomonitors (Table 3). The paper with the highest individual impact factor based on Web of Science citation counts was an innovative study on the influence of different forms of precipitation on the ecomorphology and niche preferences of epiphytic lichens (Gauslaa Reference Gauslaa2014). Among the most frequently cited papers from Peter's early days as senior editor of the journal are three on air pollution and lichen biomonitoring focusing on Europe and the Netherlands, spearheaded by Kok van Herk (van Herk Reference van Herk2001; van Herk et al. Reference van Herk, Aptroot and van Dobben2002, Reference van Herk, Mathijssen-Spiekman and de Zwart2003), and one performed in the United Kingdom (Wolseley et al. Reference Wolseley, James, Theobald and Sutton2006). These included the work with the highest individual impact factor based on Google Scholar citation counts (van Herk et al. Reference van Herk, Aptroot and van Dobben2002). In a classic study, Helms et al. (Reference Helms, Friedl, Rambold and Mayrhofer2001) surveyed the phylogenetic diversity of photobionts in Physciaceae (including the subsequently separated Caliciaceae) using the ITS marker. Reference papers directed at a broad audience, such as the ‘Proposal for a standardized nomenclature and characterization of insoluble lichen pigments’ by Meyer & Printzen (Reference Meyer and Printzen2000) also received much attention, as did another ecological study on the elevation gradient of species richness of lichenized fungi in Nepal, and its variation depending on growth form, photobiont and substratum (Baniya et al. Reference Baniya, Solhøy, Gauslaa and Palmer2010).
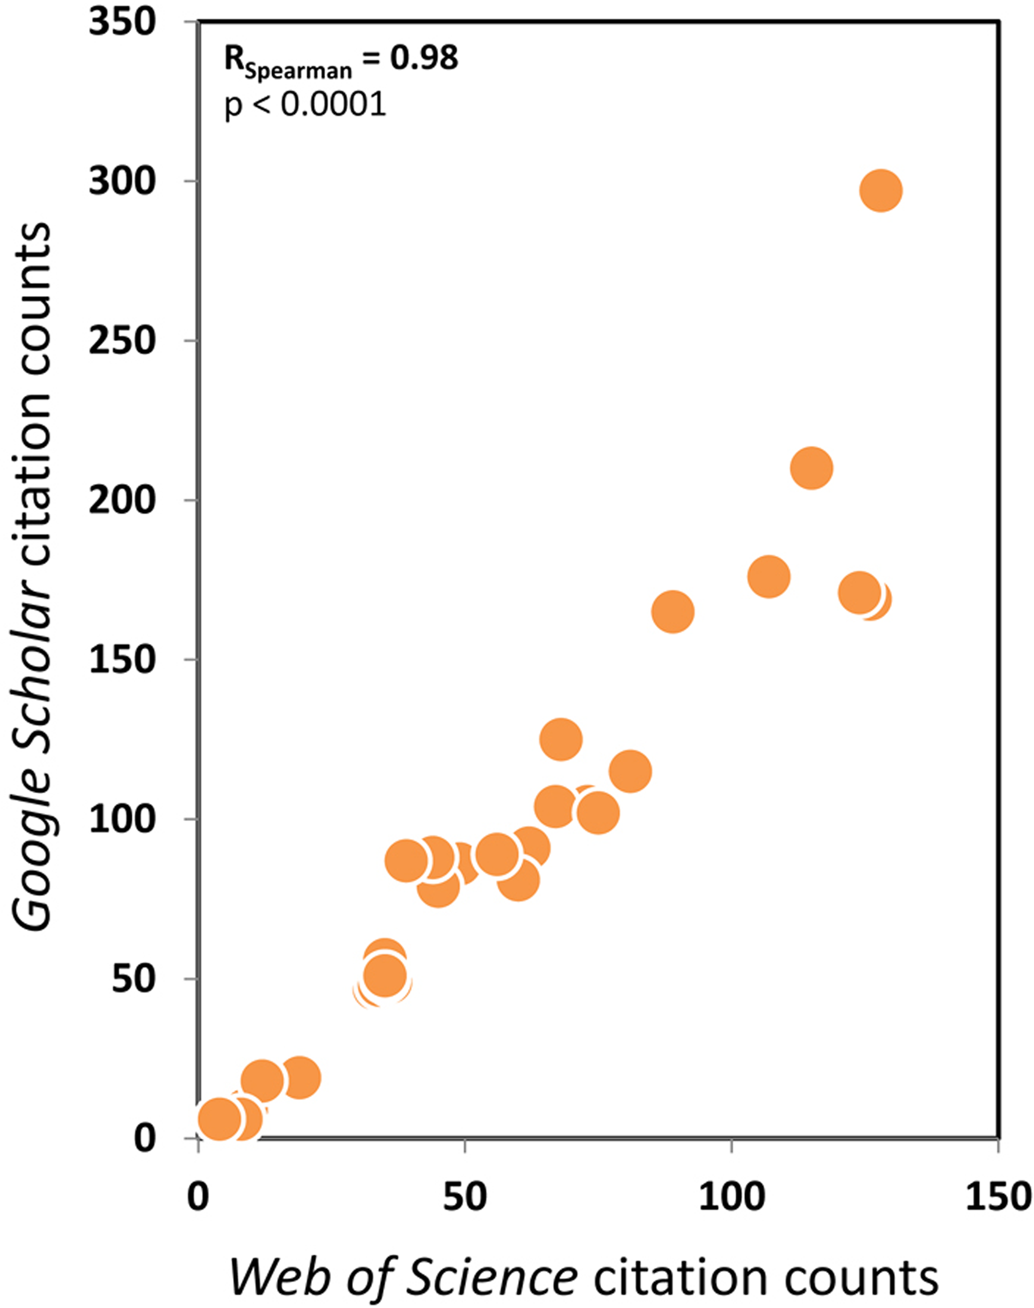
The mean number of authors of the 30 most frequently cited papers was 5.1, significantly above the overall average for the publication period, thus supporting the correlation between journal impact factor and mean number of authors per paper per year outlined above. The data also showed a strong and highly significant correlation between citation counts derived from Web of Science and Google Scholar, with the latter being consistently higher (Fig. 16). While Web of Science only counts indexed journals and hence underestimates real citations, Google Scholar probably overestimates citations due to inaccuracies in the algorithms that catalogue scientific publications and the references listed therein (Falagas et al. Reference Falagas, Pitsouni, Malietzis and Pappas2008; Fagan Reference Fagan2017). Thus, the true citation count is somewhere in between.
Correlation between Web of Science and Google Scholar citation counts for the 30 most frequently cited papers published in The Lichenologist between 2000 and 2019 (see also Table 3). In colour online.
Conclusions
The present meta-analysis is the first of its kind in terms of scope and detail performed for any scientific journal for a prolonged period of time, in this case documenting the scientific output and impact of lichenological research published in The Lichenologist during the past two decades. The data illustrate why The Lichenologist has become the flagship journal of lichenology, with this status reinforced under Peter D. Crittenden's tenure as senior editor. Peter has not only modernized the journal in both layout and content, but has also successfully implemented adjustments necessary in a changing publication landscape, with a shifted focus towards broader-impact papers, discouraging so-called ‘least publishable units’, in particular ‘single naked species descriptions’ (SNSD), in favour of publication models that incorporate individual findings into more inclusive studies. While Peter has paid attention to impact factor as one important measure to increase the prominence of the journal, he has never lost sight of the fact that The Lichenologist is first and foremost an outlet to publish high quality research in all fields of lichenology and that taxonomy remains the core of lichenological research. It is therefore no surprise that lichenologists across the world continue to consider The Lichenologist as their first choice for publishing.
Acknowledgements
Einar Timdal kindly assisted with downloading data from the Recent Literature on Lichens database, and Paul Kirk provided data on new species published in The Lichenologist, as a subset from Index Fungorum. Without knowing the underlying purpose, Peter Crittenden provided a high resolution cover for Volume 37. Christopher Ellis and Leena Myllys are thanked for providing the opportunity to perform this meta-analysis, on the occasion of this special issue dedicated to Peter, and Brian Coppins and Christopher Ellis provided valuable comments on an earlier version.
Author ORCID
Robert Lücking, 0000-0002-3431-4636.
Supplementary Material
To view Supplementary Material for this article, please visit https://doi.org/10.1017/S0024282920000560


 Open access