Introduction
Internationally, health service researchers and policy makers have been interested in preventing unplanned re-hospitalization from long-term care (LTC) homes since the 1970s (Ackerly & Grabowski, Reference Ackerly and Grabowski2014; Kane et al., Reference Kane, Huckfeldt, Tappen, Engstrom, Rojido and Newman2017). Estimates of annual hospitalizations rates vary widely between 9 and 59 per cent (Grabowski, Stewart, Broderick, & Coots, Reference Grabowski, Stewart, Broderick and Coots2008). High rates of hospitalization from LTC homes are concerning, given that hospitalization is often avoidable (McAndrew, Grabowski, Dangi, & Young, Reference McAndrew, Grabowski, Dangi and Young2016); can result in functional decline, iatrogenic illness, and an increased risk of mortality (Covinsky et al., Reference Covinsky, Palmer, Fortinsky, Counsell, Stewart and Kresevic2003; Creditor, Reference Creditor1993; Friedman, Mendelson, Bingham, & McCann, Reference Friedman, Mendelson, Bingham and McCann2008; Godden & Pollock, Reference Godden and Pollock2001; Hirsch, Sommers, Olsen, Mullen, & Winograd, Reference Hirsch, Sommers, Olsen, Mullen and Winograd1990; Lefevre et al., Reference Lefevre, Feinglass, Potts, Soglin, Yarnold and Martin1992; Wilson et al., Reference Wilson, Hebert, Scherr, Dong, Leurgens and Evans2012); and is not consistent with resident preferences (Cohen-Mansfield & Lipson, Reference Cohen-Mansfield and Lipson2006; Dobalian, Reference Dobalian2004).
Determining factors associated with hospitalization can help identify residents who are at risk and inform appropriate treatment planning accordingly. The most common reasons for emergency department visits from LTC homes and subsequent hospitalizations are hip fracture, pneumonia, urinary tract infections, and heart failure (McGregor et al., Reference McGregor, McGrail, Abu-Laban, Ronald, Baumbusch and Andrusiek2014; Ronald, McGregor, McGrail, Tate, & Broemling, Reference Ronald, McGregor, McGrail, Tate and Broemling2008). Residents who are younger, are more functionally impaired, and men are more likely to be hospitalized (Boyd et al., Reference Boyd, Landefeld, Counsell, Palmer, Fortinsky and Kresevic2008; Graverholt et al., Reference Graverholt, Riise, Jamtvedt, Ranhoff, Krüger and Nortvedt2011; Hoyer et al., Reference Hoyer, Needham, Miller, Deutschendorf, Friedman and Brotman2013; Mor, Wilcox, Rakowski, & Hiris, Reference Mor, Wilcox, Rakowski and Hiris1994). Additionally, the time to hospitalization is increased for residents with pressure ulcers and feeding tubes, and decreased for those with advance directives and who reside in a home with more nursing staff (O’Malley, Caudry, & Grabowski, 2011). Facility-level factors have also been found to be associated with hospitalization, and include for- or not-for-profit status, rurality, neighbourhood income, and staffing levels (O’Malley et al., 2011; Tanuseputro et al., 2015). There are also higher rates of hospitalization in smaller LTC homes and homes that have a higher proportion of short-stay beds (Graverholt, Riise, Jamtvedt, Husebo, & Nortvedt, Reference Graverholt, Riise, Jamtvedt, Husebo and Nortvedt2013).
Although previous literature has identified factors associated with hospitalization from LTC homes for long-stay residents (i.e., length of stay more than 90 days), few have examined newly admitted residents and none to date have been completed in Canada. An estimated 20–25 per cent of residents are re-hospitalized within 30 days of LTC admission in the United States (Mor, Intrator, Feng, & Grabowski, Reference Mor, Intrator, Feng and Grabowski2010). Another study observed that 72.9 per cent of residents with dementia were hospitalized within the first year of LTC admission (Lin et al., Reference Lin, Lin, Chou, Chen, Wang and Chen2017). Additionally, Boyd et al. (2016) found that hospitalizations rapidly increased in the 6 months prior to LTC admission, indicating health instability as a driver for LTC admission. Residents newly admitted to LTC often have complex medical and other issues (e.g., social isolation, behavioural issues), and have diverse needs (Doupe et al., Reference Doupe, St. John, Chateau, Strang, Smele and Bozat-Emre2012). As such, newly admitted residents may have different care planning needs than long-stay residents. Therefore, the objective of our study was to investigate the association between demographic and health information and hospitalization rate for newly admitted LTC residents.
Methods
Our study was a retrospective cohort study of new residents over the age of 65 entering LTC homes in six Canadian provinces (Alberta, British Columbia, Manitoba, Newfoundland, Nova Scotia, and Ontario) and the Yukon territory between January 1 and December 31, 2013. The other provinces and territories were not included because they did not use the Resident Assessment 2.0 (RAI 2.0) at the time of our study. Data were collected through two databases hosted by the Canadian Institute of Health Information (CIHI): the Continuing Care Reporting System (CCRS) and the Discharge Abstract Database (DAD). Data in the CCRS and DAD were linked based on a unique, randomly generated identification number. Residents were followed for at most 1 year after their entry into the LTC home. Data in the CCRS are collected through the RAI 2.0. The RAI 2.0 is a standardized assessment tool administered by trained assessors and is completed for every resident in Canadian LTC homes 14 days from admission, every 3 months, or if there is a significant change in health status. The RAI 2.0 has been shown to be highly reliable and valid (Poss et al., Reference Poss, Jutan, Hirdes, Fries, Morris and Teare2008). We included all residents with a new RAI 2.0 assessment between January 1 and December 31, 2013. The outcome of interest was the number of hospital admissions during the 1-year follow-up period, which were identified in the DAD. A hospital admission was defined as having a record in the hospital. Multiple records on 1 day or hospital admissions before previous hospital discharge were omitted. Only hospital admissions within the first year of entry in the LTC home were included in our final analyses. Resident-level variables that we hypothesized to have a relationship with hospitalization rates based on previous literature and were available in our data cut were included in the statistical analyses (Table 1). Our study was reviewed by a research ethics board at the University of Saskatchewan.
Description of resident-level explanatory variables included in the study
Statistical Analyses
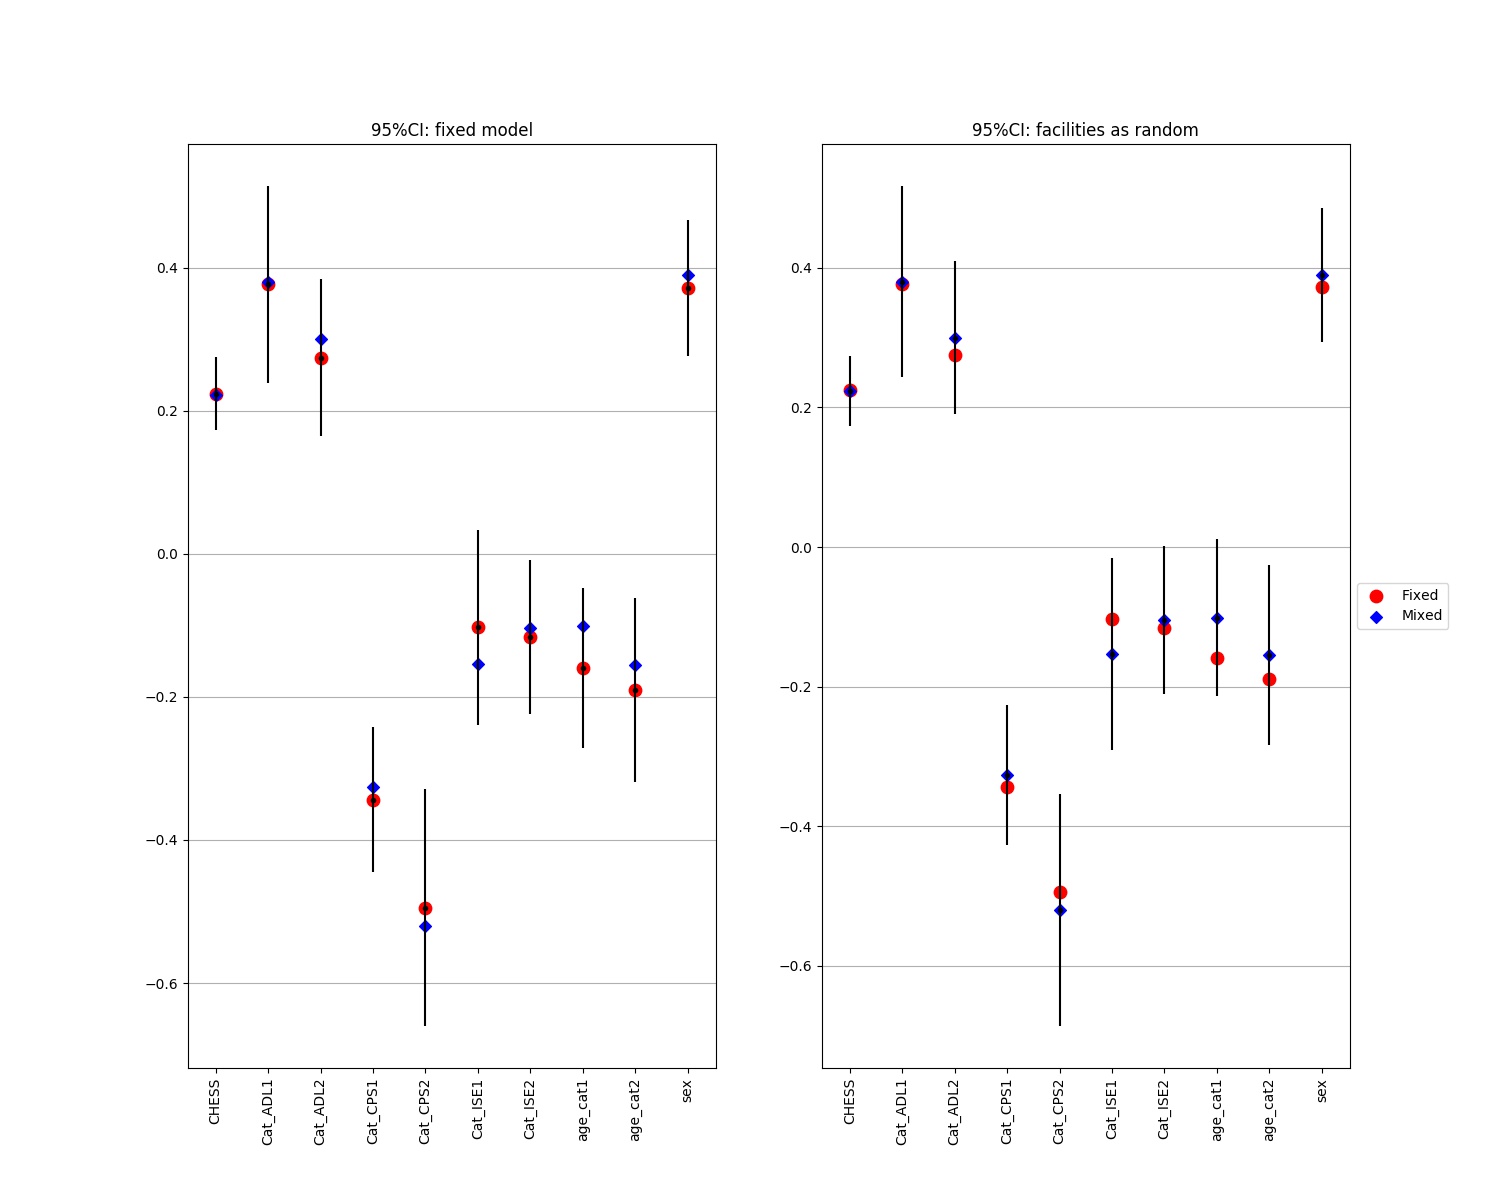
The data set was randomly split into three parts: training (40%), validation (20%), and test (40%). Backward elimination (including the two-way interactions) was performed on the training set to nominate significant factors. Variables that were also significant on the validation set and whose parameter estimates were consistent with the ones in the training set were chosen for the final model. The final model was a fixed-effect multivariate negative binomial regression applied on the test set to model the rate of hospitalization (Harrel, Reference Harrel2015). No significant correlations among residents of LTC homes were observed by comparing a random effect negative binomial model (Akaike information criterion [AIC] = 19,375.72) and fixed effect negative binomial model (AIC = 19,396.63) (See Supplementary File 1). To further validate the results, the final model was applied on another validation set, data from 2014 were utilized, and McFadden’s pseudo-adjusted R 2 were compared (McFadden, Reference McFadden and Hensher DA1978). The final model was also adjusted for the facility’s province and territory, urban–rural status, neighborhood income, and size, and the resident’s age category at admission (i.e., 65–79, 80–89, and ≥ 90). No serious misfit or influencing observation was detected by visualizing the standardized Pearson, and deviance residual (Agresti & Kateri, Reference Agresti and Kateri2011) and DFBETA (Belsley, Kuh, & Welsch, Reference Belsley, Kuh and Welsch2005) plots, respectively. The final predictive model is also provided, which can be used to predict hospitalization counts within the first year of entry to LTC homes. All statistical analyses and visualizations were performed in SAS version 9.4 (SAS Institute Inc., Cary, NC).
Results
There were 37,998 residents who were admitted to the 1,172 Canadian LTC homes between January 1 and December 31, 2013 (Table 2). Of these, 15,037 were included in the training set (40%), 7,482 were included in the validation set (20%), and 15,479 were included in the test set (40%). The median follow-up duration was 11.1 (95% confidence interval [CI]: 10.8–11.3) months. Among the residents, 18.5 per cent had at least one hospital admission during their first year within the home (Table 2). Table 2 provides summary statistics of the demographic and health characteristics of the residents.
Description of facility- and resident-level characteristics (after inclusion/exclusion criteria)
CHESS = Changes in Health and End-Stage Signs and Symptoms
Table 3 lists the rate ratios (RR), their 95 per cent CIs and p values for variables that remained in the final multivariable model. Keeping all other factors constant, hospital admission rates were higher for male residents (39%; 95% CI = 20–60%), for residents with one unit higher of Changes in Health, End-Stage Disease and Signs and Symptoms (CHESS) score (see Table 1 for definition) (25%, 95% CI:16–35%), and for residents with moderate (32%; 95% CI: 12–56%) and severe (53%; 95% CI: 25–89%) activity of daily living (ADL) impairment (see Table 1 for definition) compared with low or no ADL impairment. Hospitalization rates were lower for residents with high (28%; 95% CI:17–39%) and extremely high (36%; 95% CI:17–50%) cognitive impairment versus low or no cognitive impairment (see Table 1 for definition).
Rate ratios (RR), 95% confidence intervals (CI) and p values for final multivariable model
Note. Model was adjusted for resident age at admission categories (65–79, 80–89, and ≥90 years), and facility urban–rural status, province, facility size, and income.
CHESS = Changes in Health and End-Stage Signs and Symptoms.
The 1-year hospitalization count for a resident entering an LTC home can be predicted using the final model, by providing their individual level characteristics:
Expected hospitalization counts = t*e α, where t is the follow-up time since entrance (in years), and where I (condition) is 1, if the condition is satisfied, 0 otherwise.
 $$\eqalign{ & \alpha = - 1.7401 + 0.3352 \cr & *I\left( {male} \right) + 0.2295 \cr & *CHESS + 0.4519*I\left( {severe\,ADL\,impairment} \right) + 0.2879 \cr & *I\left( {moderate\,ADL\,impairment} \right) - 0.3127 \cr & *I\left( {moderate\,cognitive\,impairment} \right) - 0.3995 \cr & *I\left( {severe\,cognitive\,impairment} \right) - 0.0597 \cr & *I\left( {age\,80 - 89} \right) - 0.1761 \cr & *I\left( {age > = 90} \right) - 0.0937 \cr & *I\left( {rural} \right) + 0.7947 \cr & *I\left( {Alberta} \right) + 0.7350 \cr & *I\left( {British\,Columbia} \right) + 0.6204 \cr & *I\left( {Manitoba} \right) + 0.6173 \cr & *I\left( {Newfoundland} \right) - 1.0072 \cr & *I\left( {Nova\,Scotia} \right) + 0.2254 \cr & *I\left( {Ontario} \right) + 0.0682 \cr & *I\left( {large\,facility} \right) + 0.1460 \cr & *I\left( {medium\,facility} \right) + 0.0835 \cr & *I\left( {income\,average} \right) + 0.0608 \cr & *I\left( {income\,below\,average} \right) + 0.5753 \cr & *I\left( {income\,income\,missing} \right) \cr}$$
Discussion
Our study demonstrates that 18.5 per cent of newly admitted Canadian LTC residents were hospitalized in 2013. Being male, having greater health instability, and having moderate or severe ADL impairment are associated with increased rates of hospitalization. Conversely, having moderate or severe cognitive impairment is associated with decreased rates of hospitalization. The results of our study can be used to identify newly admitted residents who may be at risk for hospitalization and to appropriately target prevention interventions. Wide variation in the rate of hospitalization for LTC residents has been reported in the literature. For example, Grabowski et al. (Reference Grabowski, Stewart, Broderick and Coots2008) found hospitalization rates to range from 5 to 59 per cent. In the United States, Mor et al. (2010) found that approximately one quarter of residents were re-admitted to hospital within 30 days of admission into the LTC home. However, the authors also found large interstate variation (Mor et al., Reference Mor, Intrator, Feng and Grabowski2010). A study completed in Taiwan found that 72.9 per cent of residents with cognitive impairment were admitted to hospital within 1 year of admission (Lin et al., Reference Lin, Lin, Chou, Chen, Wang and Chen2017). In contrast, our results indicate that 18.5 per cent of newly admitted residents are hospitalized within 1 year. Differences for the observed variation in hospitalization rates and associated risk factors could be attributed to the definition of hospitalization (e.g., including emergency department visits), geographical differences in practice patterns and provider norms, types of LTC homes (e.g., do they include slow stream rehabilitation), patient population (e.g., long-stay versus short-stay residents), bed availability, and the presence of and willingness to use hospice care (Grabowski et al. Reference Grabowski, Stewart, Broderick and Coots2008; Mor et al., Reference Mor, Intrator, Feng and Grabowski2010).
Previous studies support our results that being male and having increased functional impairment are associated with an increased rate of hospitalization (Boyd et al., Reference Boyd, Landefeld, Counsell, Palmer, Fortinsky and Kresevic2008; Graverholt et al., Reference Graverholt, Riise, Jamtvedt, Husebo and Nortvedt2013; Hoyer et al., Reference Hoyer, Needham, Miller, Deutschendorf, Friedman and Brotman2013; Mor et al., Reference Mor, Wilcox, Rakowski and Hiris1994). Not only is ADL impairment associated with hospital use, hospitalization can further deteriorate ADL functioning for older adults (Boyd et al., Reference Boyd, Landefeld, Counsell, Palmer, Fortinsky and Kresevic2008). Therefore, addressing ADL impairment prior to and after hospitalization is essential for preventing not only hospital admission but also further deterioration in function following hospitalization. ADL impairment is amenable to rehabilitation (Crocker et al., Reference Crocker, Young, Forster, Brown, Ozer and Greenwood2013); therefore, rehabilitation should be considered as part of the care plan for newly admitted residents with functional impairment.
In our study, a one-unit increase in health instability was associated with a 25 per cent increase in rate of hospitalization. Our indicator of health instability, the MDS CHESS scale, is a composite measure of illness and disability (Hirdes, Frijters, & Teare, Reference Hirdes, Frijters and Teare2003). The CHESS includes signs and symptoms of declining health (e.g., dyspnea, vomiting, weight loss, and decreased fluid intake), cognition and physical function (e.g., change in decision making and activities of daily living) (Hirdes et al., Reference Hirdes, Frijters and Teare2003; Lee, Chau, Hui, Chan, & Woo, Reference Lee, Chau, Hui, Chan and Woo2009). CHESS scores have been shown to predict adverse events such as mortality for residents in LTC (Hirdes et al., Reference Hirdes, Frijters and Teare2003) and can be used as an indicator of potentially reversible instability requiring immediate attention (e.g., residents with heart failure) (Tjam et al., Reference Tjam, Heckman, Smith, Arai, Hirdes, Poss and McKelvie2012). Therefore, it is not surprising that a higher CHESS score is associated with an increased risk of hospitalization. Interventions that have been shown to reduce acute care admission are providing advance care planning, palliative care, care pathways for lower respiratory tract infections, and geriatric specialty services within the LTC home (Graverholt, Forsetlund, & Jamtvedt, Reference Graverholt, Forsetlund and Jamtvedt2014). These are interventions that should be provided to newly admitted residents to prevent hospitalization, especially those with more unstable health.
Our results indicate that residents with more severe cognitive impairment have lower hospitalization rates. Previous studies have also demonstrated that hospitalization rates decrease with increasing cognitive impairment (Stephens, Newcomer, Blegen, Miller, & Harrington, Reference Stephens, Newcomer, Blegen, Miller and Harrington2012). The observed negative relationship between cognitive impairment and hospitalization rates could occur for several reasons. First, clinicians, residents, and families in LTC could be more willing to aggressively treat acute illnesses or relapses of chronic disease for residents with less cognitive impairment. Cohen-Mansfield & Lipson (Reference Cohen-Mansfield and Lipson2006) found that quality of life was an important deciding factor for hospitalization from LTC homes, and this may be an even greater consideration for residents with more advanced cognitive impairment. Second, the relationship could be the result of under-recognition of acute illness with increasing cognitive impairment. Alternatively, the manifestation of undiagnosed cognitive impairment could present like an acute illness. For example, medical conditions, such as urinary tract infections, constipation, dehydration, pain, and delirium, can precipitate behavioural disturbances for people with dementia (Desai, Schwartz, & Grossberg, Reference Desai, Schwartz and Grossberg2012), and behavioural disturbances also increase the risk of hospital transfer (Chung, Lai, & Grimley Evans, Reference Chung, Lai and Grimley Evans2011). Therefore, residents with higher levels of cognitive impairment may have underlying undiagnosed medical conditions that influence their behaviour. However, their behaviour may be attributed to their higher levels of cognitive impairment. Conversely, the behaviour of residents with less or undiagnosed cognitive impairment may be attributed to acute illness (Lyketsos et al., Reference Lyketsos, Lopez, Jones, Fitzpatrick, Breitner and DeKosky2002). Subsequently, residents who have undiagnosed cognitive impairment and behavioural disturbances may be more likely to be admitted to hospital. Regardless of the reasons behind the negative relationship between cognitive impairment and hospitalizations, the LTC and acute care teams must carefully weigh the risks and benefits of hospital admission for residents with cognitive impairment.
The limitations of our study are that we were not able to include information regarding number of co-morbidities, pressure ulcers, feeding tubes, advance directives, body mass index, medications, and vitamin and mineral deficiencies, which may affect hospitalization rates, as we did not have access to these variables in our data set. As the RAI 2.0 was not fully implemented in all of the included provinces at the time of our study (Hirdes, Mitchell, Maxwell, & White, Reference Hirdes, Mitchell, Maxwell and White2011), the generalizability of these results is limited. For example, we were only able to include data from four LTC homes in the Yukon and Nova Scotia, so our data are not representative of all homes in these provinces. Additionally, we were not able to include the for-profit status of the homes, which has been shown to be related to hospitalization rates (Tanuseputro et al., Reference Tanuseputro, Chalifoux, Bennett, Gruneir, Bronskill and Walker2015). Finally, our study is observational, and as such, direct causal inferences cannot be described. However, our study identified important factors for identifying newly admitted LTC residents at risk for hospitalization who should receive appropriate preventive interventions.
Conclusions
Newly admitted residents who are male, have higher health instability, and have moderate or severe ADL impairment have higher rates of hospitalization. Conversely, residents with more severe cognitive impairment have lower rates of hospitalization. The results of our study can be used to identify newly admitted residents over the age of 65 who may be at risk for hospitalization, and appropriately target prevention interventions, including rehabilitation, advance care planning, palliative care, and geriatric specialty services.
Supplementary Material
To view supplementary material for this article, please visit https://doi.org/10.1017/S0714980818000715