


Introduction
It has long been argued that American politics is group centric, and that race is the defining cleavage separating groups of individuals (Achen and Bartels, Reference Achen and Bartels2016; Mendelberg, Reference Mendelberg2001; Nelson and Kinder, Reference Nelson and Kinder1996; Sidanius and Pratto, Reference Sidanius and Pratto2001). In turn, American scholarship has closely investigated racial attitudes and group-based identities in the United States, finding that racial resentment and white racial identity are intimately related to Republican voting, partisanship and policy attitudes (Craig and Richeson, Reference Craig and Richeson2014; Gilens, Reference Gilens1999; Hooghe and Dassonneville, Reference Hooghe and Dassonneville2018; Jardina, Reference Jardina2019; Mutz, Reference Mutz2018; Sides et al., Reference Sides, Tesler and Vavreck2018; Tesler, Reference Tesler2012). Scholarship has directly connected racial attitudes and identity politics to the rise of Donald Trump (Hooghe and Dassonneville, Reference Hooghe and Dassonneville2018; Mutz, Reference Mutz2018; Sides et al., Reference Sides, Tesler and Vavreck2018). Hutchings and Valentino (Reference Hutchings and Valentino2004: 401) conclude in their review of political research on race in the United States: “Racial divisions, racial resentments, and group loyalties influence the form and content of the political party system, the nature and distribution of public opinion, and the behavior of political elites in and out of office.”
By contrast, the traditional approach in Canadian political science has been to generally avoid much accounting for the importance of race in the country’s politics (Thompson, Reference Thompson2008). This is in part because Canada is a country with longstanding cleavages based primarily on language, religion and region (Johnston, Reference Johnston2017). It is also a country that formally supports an official policy of multiculturalism and inclusion (Kymlicka, Reference Kymlicka1998). Within this context, scholarship on the political importance of racial attitudes and racial identity in Canada was strikingly limited. Thompson (Reference Thompson2008: 525) provided a telling summary of the state of the literature at the time, arguing: “In spite of the increasing relevance of race in Canadian society, analyses concerning the relationship(s) between race and politics have been, at best, tangential in mainstream English Canadian political science.”
Since then, there have been increasing efforts to understand the ways in which race is important in Canadian politics. Among other work, scholarship has highlighted how ethnic minorities are increasingly reliable partisans for the Liberals (Gidengil et al., Reference Gidengil, Nevitte, Blais, Everitt and Fournier2012), that those who are resentful towards Indigenous peoples in Canada are more likely to vote Conservative (Beauvais and Stolle, Reference Beauvais and Stolle2022), and that colder feelings towards ethnic minorities are associated with lower support for the NDP (Hale, Reference Hale2023).
However, key questions remain. Jardina (Reference Jardina2019) theorizes that a racial hierarchy is perceived to exist in the United States with white people at the top. Yet, this has come under threat through immigration, the rising proportion of ethnic minorities in the population, Obama’s presidency, and that this has resulted in white Americans growing more attached to their racial identity (Jardina, Reference Jardina2019). In response to rising immigration, growing diversity and the presence of prominent nonwhite politicians like Jagmeet Singh, could white identity similarly be pertinent in Canadian electoral politics? Out-group resentment, symbolic forms of racism and the link to feelings of deservingness and hard work have been shown to be widely predictive of policy opinion and vote choice among Americans (Hooghe and Dassonneville, Reference Hooghe and Dassonneville2018; Kinder and Sander, Reference Kinder and Sanders1996). But could racial resentment similarly matter to the vote choice and partisanship of white Canadians?
Despite the inherent similarities of Americans and Canadians (Lipset, Reference Lipset1990), direct empirical comparisons of racial attitudes and identity between Americans and Canadians have largely been absent from the literature. This absence represents a missed opportunity for scholarship. By comparing the relative political importance of race between Canada and the United States, we may better learn about the politics of both countries (Krashinsky and Naylor Reference Krashinsky and Naylor2024; Lipset, Reference Lipset1990; Turgeon, Reference Turgeon, Turgeon, Papillon, Wallner and White2014; Vipond, Reference Vipond, Linda, Simeon, Vipond and Wallner2008).
This article poses the question of how white Americans and white Canadians compare in terms of white identity, racial resentment and racial attitudes, and how this might translate to electoral preferences and political partisanship. Theoretically, the enduring importance of linguistic and religious divides may continue to prevent the formation of a stronger white identity in Canada as compared to the United States. The principles of multiculturalism and inclusion in Canada, which are widely endorsed (Kymlicka, Reference Kymlicka2021), may also preclude widespread feelings of animosity towards other racial groups or the belief among white Canadians that other groups have received more than they have fairly earned. Canada’s multiculturalism policy has continued to be recognized as a defining moment in a country that has long been faced with the task of accommodating diverse groups of immigrants and recognizing the special status of large national minorities in French Canadians and Indigenous peoples (Kymlicka, Reference Kymlicka1998). Similar countervailing forces to the political importance of race arguably do not exist in the United States to the same degree, and the persisting political importance of race has been widely documented by American scholarship (Hutchings and Valentino, Reference Hutchings and Valentino2004).
Yet, it is not sufficient to assume that linguistic or religious divides, as well as the multiculturalism project, have entirely prevented racial attitudes and identity from pervading Canadian politics. Almost one in every four Canadians is nonwhite and the country is becoming more diverse every year (Stats Canada, 2016). Racial inequality exists in Canada in areas such as income, health outcomes and social integration (Banting and Thompson, Reference Banting and Thompson2021; Ramraj et al., Reference Ramraj, Faraz Vahid Shahidi, Kawachi, Zuberi and Siddiqi2016; Reitz and Banerjee, Reference Reitz and Banerjee2007; Satzewich and Liodakis, Reference Satzewich and Liodakis2010). Anti-Black racism is not just a problem in the United States (Calliste, Reference Calliste1995; Kymlicka, Reference Kymlicka1998; Lewis, Reference Lewis1992). There is evidence that the rate of employment discrimination on the basis of race in Canada is similar to the United States (Quillian et al., Reference Quillian, Anthony Heath, Midtbøen, Fleischmann and Hexel2019), racial inequality in Canada has continued to be largely unaddressed by public policy (Banting and Thompson, Reference Banting and Thompson2021), and nonwhite Canadians have reported feeling discriminated against in Canada (Satzewich and Liodakis, Reference Satzewich and Liodakis2010). These constructs of white identity and racial resentment may not travel across the American border, and we may theoretically expect that white Canadians are driven less by racial attitudes than white Americans, but if the questions are never posed and the empirical data is never gathered, we cannot be certain.
Utilizing original survey data and a novel candidate-choice conjoint experiment, this article attempts to address this gap. I directly compare white racial identity, racial resentment and racial affect between samples of white Americans and white Canadians. I examine the extent to which these variables are associated with vote choice and partisanship, as well as how the presence of nonwhite political candidates potentially impacts how white voters in either country select who to support during elections.
This article has several findings. First, there are considerable differences in white racial identity and racial attitudes between Canada and the United States. White Canadians consistently express lower levels of white identity and racial resentment than white Americans. But these differences evaporate on measures of racial affect with feeling thermometers (Winter and Berinsky, Reference Winter and Berinsky1999). Second, the presence of nonwhite political candidates triggers stronger electoral reactions from white Americans than white Canadians. Experimental evidence shows that political candidates randomly assigned to be nonwhite receive a lower average of vote shares among the sample of white American respondents. Yet for white Canadian respondents, there is no electoral penalty for nonwhite candidates. Candidates randomly assigned to be Asian, Black or Indigenous perform almost just as well as the average white candidate among the Canadian sample. Subgroup analysis shows how reactions to white and nonwhite candidates are conditioned by a respondent’s underlying racial attitudes or white identity. Third, utilizing regression analyses, I find that white racial identity and racial resentment are strongly correlated with voting for and identifying with right-wing parties in both Canada and the United States. However, the magnitude of the effects is consistently larger among the samples of white Americans. Finally, I also test the extent to which measures of nonwhite racial affect predict voting and partisanship but find little evidence that these are comparably strong measures to racial resentment and white identity.
This article argues that race continues to be of greater political importance in the United States than in Canada. White Americans are more racially resentful and identify more strongly with their racial group than white Canadians. But race is also far from an irrelevant factor in Canadian politics. White identity and racial resentment are meaningful constructs for white Canadians. Over 20 per cent of the sample of white Canadians strongly identified with their racial group. Over 35 per cent of the sample of white Canadians believe that Black Canadians do not deserve any special favours from government. While nonwhite political candidates did not receive electoral penalties from the total sample of white Canadians in the conjoint experiment, those with higher levels of racial resentment or white identity were more likely to favour white candidates, and both white identity and racial resentment were strongly correlated with Conservative voting and partisanship. Consequently, future Canadian political scholarship should pay more attention to how race influences political behaviour.
Canadian Behavioural Scholarship on Race
Behavioural scholarship in Canada has centred on several major factors to explain national voting patterns and political partisanship over time. This includes religion (Johnston, Reference Johnston2017), regional divides (Gidengil et al., Reference Gidengil, Nevitte, Blais, Everitt and Fournier2012) and language (Lijphart, Reference Lijphart1979). The political importance of racial identity and racial attitudes traditionally received only limited attention across Canadian research (Thompson, Reference Thompson2008), but more recent work has begun to investigate the topic more closely.
Older theoretical work conceived the difference between French and English Canadians as one based on race (Siegfried, Reference Siegfried1907). Throughout most of the nineteenth century, it was argued that English Canadians did not consider French Canadians to be white (Scott, Reference Scott2015). However, this changed as French Canadians came to be viewed as “white folks,” who are a distinct Western national group of people and “solidly lodged in whiteness” (Scott, Reference Scott2015: 1280).
Beyond the divide between English and French Canadians, it has been shown that visible minorities in Canada are more likely to support the Liberals (Blais, Reference Blais2005; Blais et al., Reference Blais, Gidengil, Nadeau and Nevitte2002; Gidengil et al., Reference Gidengil, Nevitte, Blais, Everitt and Fournier2012; Nevitte et al., Reference Nevitte, Blais, Gidengil and Nadeau2000). Throughout the 2000s, those who favoured doing less for minorities were more inclined to support right-wing parties, and those who favoured doing more for minorities were more supportive of the NDP (Blais, Reference Blais2005; Gidengil et al., Reference Gidengil, Nevitte, Blais, Everitt and Fournier2012). Work by Besco finds that nonwhite voters show a strong affinity for supporting their own ethnocultural group and seem to show stronger support for other minority candidates (Besco, Reference Besco2015; Reference Besco2019). Ethnic minority candidates in Canada experience electoral discrimination when they run as members of right-wing parties, but not when they run as members of left-wing parties (Besco, Reference Besco2020).
Recent work by Hale (Reference Hale2023) analyzes the effect of racial attitudes on electoral support for the federal NDP under the leadership of Jagmeet Singh, finding that colder feelings towards ethnic minorities are associated with a decreased likelihood of supporting the NDP in both the 2019 and 2021 federal elections. Bouchard (Reference Bouchard2022) finds that Singh’s candidacy was more negatively perceived in Quebec, but that it also led to an increase in affinity-voting for the NDP by Sikh Canadians. Using Canadian Election Study data and social group feeling thermometers, Lachance and Beauvais (Reference Lachance and Beauvais2024) show how feelings towards others, including ethnic minorities and groups associated with Quebec, have become more important determinants of voting for the Conservatives outside of Quebec over time. Yet, Bilodeau et al. (Reference Bilodeau, Turgeon and Karakoç2012) show that attitudes among white Canadians towards immigrants and racial minorities are a net positive in every province, and that these attitudes became more positive from 1988 to 2008. Relatedly, Gravelle (Reference Gravelle2018) shows that Liberal and NDP partisans express more positive feelings towards Muslims than do either Bloc Québécois (BQ) or Conservative Party partisans.
The only empirical study of white identity in Canada is by Beauvais and Stolle (Reference Beauvais and Stolle2022). These authors measure white Canadians’ attachment to their racial in-group as well as their resentment towards Indigenous peoples. They find that white identity among Canadians increases support for public pensions, and that anti-Indigenous resentment lowers support for welfare policies (Beauvais and Stolle, Reference Beauvais and Stolle2022). Furthermore, Beauvais and Stolle show that white identity and anti-Indigenous resentment are associated with voting for the Conservative Party (Beauvais and Stolle, Reference Beauvais and Stolle2022).
This important recent work has begun to focus more attention on the politics of racial identity and racial attitudes in Canada. This project builds on this scholarship in several ways. I directly compare racial identity, racial attitudes and their political effects between white Canadians and Americans by posing virtually identical questions on temporally aligned surveys and employing an original experimental design to capture the causal effect of a candidate’s race.Footnote 1 This analysis allows for the first direct empirical comparisons of white racial identity and racial attitudes between white Canadians and Americans.
Data
Almost thirty years ago, Nevitte (Reference Nevitte1996) argued that part of the reason for the lack of comparative scholarship on Canada and the United States was methodological difficulties. The same point can be made today. Past qualitative work is extensive and rich in context, but its generalizability is suspect (Nevitte, Reference Nevitte1996). On the quantitative side, there exist few publicly available surveys that pose identical questions to both Canadians and Americans. Surveys that ask similar questions are not always temporally aligned and are not always theoretically relevant. Both Canada and the United States have long-running national election studies, but these surveys are rarely conducted in the same year, contain different sets of questions or altered question wording, and are not always focused on the same theoretical avenues.Footnote 2
Correspondingly, original data is necessary to expand the scope of comparative analysis and the reliability of inference. On this front, this project leverages a cross-sectional public opinion survey of Americans and Canadians fielded from December 2022 to January 2023. Survey respondents were recruited by Leger, a Canadian-based marketing/polling firm hired to conduct the survey.Footnote 3 Leger is a well-regarded polling firm known for their accuracy. In both the 2019 and 2021 Canadian federal elections, Leger provided the most accurate polling relative to actual election results (Grenier, Reference Grenier2021). I used Leger for both the American and Canadian portions of the survey to avoid any potential bias from the use of different survey firms.
The survey was fielded to a nationally representative sample of 2,000 Americans and 2,000 Canadians, which are then subset in the analysis to only white individuals. Respondents were recruited to fill quotas and configured using American and Canadian census data, for age, gender and geographic region. Following data collection, national survey weights (for age, gender and region) were calculated and appended to the dataset.Footnote 4
To analyze the representativeness of the collected data on other important indicators, namely education and political leanings, in the Appendix, I present several tables comparing the collected survey samples to national election study surveys in Canada and the United States. In terms of education level, the collected samples contain almost the exact same percentage of respondents with bachelor’s degrees but a smaller proportion of graduate degrees and a slightly larger proportion of only high school graduates (Table 1A). In terms of ideological-lean, there are only marginal differences with the Canadian sample being 0.3 points (on a 0–10 scale) more left-leaning than the 2021 Canadian Election Study (CES) sample and the American sample being 0.07 points more right-leaning than the 2020 American National Election Study (ANES) sample (Table 2A). The collected Canadian sample contains a slightly larger proportion of Liberal voters than the 2021 CES (3%) but slightly fewer Liberal partisans (2%) (tables 3A and 4A). The collected American sample contains more Democratic partisans but almost the same number of Democratic and Republican voters as the 2020 ANES (tables 5A and 6A). Accordingly, the collected samples are slightly less educated and skew to the left compared to the samples in the most recent national election studies in Canada and the United States, but by only a marginal degree.
To maximize empirical comparability, the survey contains nearly identical questions for American and Canadian respondents. Question wording was only altered for country-specific contexts, such as the names of political parties. The survey contained a large number of questions to gauge respondents’ background demographics, their political preferences, and the social identities that are most important to them. This includes a number of variables measuring racial attitudes, resentment and white identity as described in the subsequent section.
The median survey completion time was just over 17 minutes for Canadians and 14 minutes for Americans. The survey included two attention checks to ensure data quality. The first was an easy attention check that almost all respondents passed. The respondents who did not pass this first attention check were removed from the survey and replaced with new respondents.Footnote 5 The harder attention check is the favourite colour question discussed in Berinsky et al. (Reference Berinsky, Margolis and Sances2014). A larger percentage of respondents failed this check (36%), similar to the results of Berinsky et al. (33%), but no respondents were removed based on answers to this question to avoid biasing the sample.Footnote 6 As a robustness check, the main regression models in the forthcoming analysis are also run amongst the sample that passed this harder attention check.Footnote 7
This project’s original quantitative design also included a paired-profile, candidate-choice conjoint experiment.Footnote 8 The advantage of a conjoint experiment is that it allows researchers to assess the effects of multiple experimental treatments simultaneously and identify respondents’ preferences within and across multiple tested dimensions (Bansak et al., Reference Bansak, Hainmueller, Hopkins, Yamamoto, Druckman and Green2021). The intent of the experimental design is to mirror the relevant background information about political candidates that might determine a respondent’s actual choice at the ballot box, and to then compare the relative effects on vote share of these different pieces of information between Americans and Canadians. The design of the conjoint experiment was pre-registered at Open Science Framework in November 2022, prior to it being fielded to respondents.Footnote 9 Respondents were shown two side-by-side profiles of hypothetical political candidates and were asked to choose which candidate they would support.Footnote 10 The experiment provided six pieces of information about each candidate. These six attributes were the hypothetical candidate’s party, race, gender, major endorsement received, occupation history and their number one policy priority.
Measuring Racial Attitudes, Identity and Resentment
Feeling thermometers were first employed in the 1964 ANES in the United States to measure survey respondents’ affect towards groups of people and prominent political figures (Winter and Berinsky, Reference Winter and Berinsky1999). Feeling thermometers have been employed in the CES, which has asked survey respondents to rate groups of people, provinces and prominent politicians on a 0–100 scale.Footnote 11 Because of their use in the CES, the most common empirical approach to assessing the importance of attitudes towards other social groups in Canadian politics has often been to utilize feeling thermometer scores (see Lachance and Beauvais (Reference Lachance and Beauvais2024) on the growing importance of group-based affect in the structure of the Canadian party system). The advantages of these measures are their conceptual clarity and logistical ease.
I utilized feeling thermometers in the Canadian and American surveys to capture general sentiments towards different racial groups. This set of questions is utilized in order to operationalize racial affect and to measure public attitudes towards nonwhite groups more generally (Winter and Berinsky, Reference Winter and Berinsky1999). I included a feeling thermometer measure for Indigenous peoples, which can helpfully capture sentiment towards this group among Canadians and Americans (see Appendix 1 for each question).
However, feeling thermometer scores only provide one piece of the puzzle. How individuals rate other groups of people on 0–100 scales, for example, says little about the extent to which their racial group is an important social attachment, or whether they believe other racial groups are undeserving of a hand-up from government. Feeling thermometers indicate the extent to which individuals have “warm” or “cold” feelings towards other groups of people. While this may be correlated with other attitudes, accurately measuring theoretical constructs such as white racial identity and racial resentment requires their own questions. And these types of questions have often not been included in the CES.Footnote 12 Moreover, as the forthcoming analyses will show, the comparative picture of the behavioural effects of racial attitudes are markedly different when researchers go beyond measures of racial affect.
Therefore, this study employs several other measures of racial attitudes and identity to estimate the political importance of race more comprehensively.Footnote 13 Jardina bases her measure of white racial identity on five questions across multiple survey sources, including the ANES (Jardina, Reference Jardina2019).Footnote 14 Each question targets a particular aspect of white racial identity construction: the centrality of the identity, evaluations of the group and the degree of white consciousness. The original survey launched as part of this project replicated Jardina’s (Reference Jardina2019) measure of white racial identity, fielding each of the five questions simultaneously to nationally representative samples of Americans and Canadians (see Appendix 1 for each question). This measurement of white racial identity differs from Beauvais and Stolle (Reference Beauvais and Stolle2022), who construct their index measure of white identity using three of the survey questions originally operationalized by Jardina (Reference Jardina2019).
I also measure racial resentment using the traditional set of four survey questions used in the ANES (Kinder and Sanders, Reference Kinder and Sanders1996), recoded for appropriate attitudinal direction, and combined into an index measure for both the Canadian and American samples (see Appendix 1 for each question). This index, born out of American scholarship, captures anti-Black sentiment, moral traditionalism and is said to be a measure of symbolic or more subtle racism as opposed to older forms of explicit racism and bigotry that were based on claims of biological inferiority (Agadjanian et al., Reference Agadjanian, Michael Carey, Horiuchi and Ryan2023; Carmines et al., Reference Carmines, Sniderman and Easter2011; Kinder and Sanders, Reference Kinder and Sanders1996). Respondents who express high levels of racial resentment hold that Black people lack moral values of hard work, self-sufficiency and discipline; that they have received more than they have earned; and that they do not try hard enough to overcome difficulties (Carmines, et al. Reference Carmines, Sniderman and Easter2011; Kinder and Sanders, Reference Kinder and Sanders1996). Some critics argue that the racial resentment index, as it is commonly operationalized, is flawed because it can be conflated with attitudes towards racial policies and that it measures what some argue it predicts (Carmines et al., Reference Carmines, Sniderman and Easter2011; Schuman, Reference Schuman2000). Yet, others have shown the wide predictive power of varying scores on the racial resentment index for other racial attitudes, policy attitudes and voting behaviour in the United States (Agadjanian et al., Reference Agadjanian, Michael Carey, Horiuchi and Ryan2023; Hooghe and Dassonneville, Reference Hooghe and Dassonneville2018; Kinder and Sanders, Reference Kinder and Sanders1996).
But is racial resentment relevant in Canada? Beauvais and Stolle (Reference Beauvais and Stolle2022) have assessed the importance of racial resentment in Canada, tying evaluations of a nonwhite group to questions of deservingness and effort, but do not measure resentment towards Black people. Instead, these authors argue that the more appropriate out-group which white Canadians are more likely to express resentment towards are Indigenous peoples. While this is theoretically possible, this project departs from Beauvais and Stolle (Reference Beauvais and Stolle2022) and opts to measure racial resentment in the same way for Canadians and Americans for several reasons.
First, this is for the sake of comparison: unless identical constructions of racial resentment are utilized, comparisons between Canadians and Americans cannot be meaningfully conducted. Second, simply stated, anti-Black racism exists in Canada too (Calliste, Reference Calliste1995; Lewis, Reference Lewis1992; Thompson, Reference Thompson2008). The number of Black Canadians as a percentage of the population is not insignificant, totalling over 1.2 million as measured by the 2016 census. Given that empirical scholarship in Canada has not posed survey questions measuring resentment towards Black people in Canada, we cannot say with certainty whether some Canadians express out-group resentment towards Black people or how this compares to the United States. Third, it is not clear why the link between anti-Black attitudes and moral traditionalism, feelings of deservingness and the broader ideal of the Protestant Ethic should only exist in the United States (Kinder and Sander, Reference Kinder and Sanders1996). This set of moral attitudes, arguably based in part on religious doctrine, and its link to attitudes on work and capitalism are explicitly not limited to the United States and are said to have originated in Northern Europe (Weber, Reference Weber1930).Footnote 15 Furthermore, if we have yet to pose these questions to respondents in Canada, we cannot be certain whether these connections do not exist in the minds of some Canadians who may be drawn to more subtle forms of racial prejudice. Finally, consistent with literature on racial resentment in the United States, the index is strongly correlated with other measures of racial attitudes, policy preferences, derogatory racial stereotypes and opinion towards other minority groups (Kinder and Sanders, Reference Kinder and Sanders1996). The racial resentment index is an important measure of racial attitudes and worthy of investigation in the Canadian context.
Moreover, in the Appendix (section 8), I present the results of a principal component factor (PCF) analysis of the measures for racial resentment. I do this to analyze the statistical relevance of each item used in the index and to show whether the construct means the same thing between the American and Canadian samples of white respondents. In short, the PCF analysis shows that among white respondents the racial resentment index is quite comparable between the Canadian and American samples.
Public Attitudes in North America: The Weaker Racial Cleavage in Canada
How do white Canadians and white Americans compare in terms of white racial identity and racial attitudes? This section reports descriptive statistics and difference-in-means tests among white respondents from the nationally representative survey samples. Beginning with white racial identity, Figure 1 plots the raw percentages of Canadian and American survey respondents to the question “How important is being white to your identity?” which is the first and, arguably, most crucial question for the white identity index measure (Jardina, Reference Jardina2019).

Figure 1. White Identity in Canada and the United States.
Source: Original survey data (2023). National samples are nationally representative samples from the United States and Canada, white respondents only. X-axis is percentage of the respective sample. Y-axis indicates answer to question. Colour indicates which country sample.
Figure 1 shows that there are significant differences in the extent to which white Americans and Canadians identify with their racial group. Starkly, only 7 per cent of white Canadian respondents stated that being white was “extremely” important to their identity compared to almost 19 per cent of American respondents. Over 37 per cent of the sample of white Americans stated that being white was either “very” or “extremely” important to their identity, while only 20 per cent of the sample of white Canadians did the same. A much greater percentage of white Canadians (almost 52%) stated that being white was “a little” or “not at all” important compared to the sample of white Americans (36%).
Figure 2 repeats the comparison across the national samples for a survey question measuring racial resentment. It displays the frequencies corresponding to how white respondents answered the first question of the racial resentment scale. Figure 2 shows how there are again significant differences between white respondents across the border. Only 15 per cent of white Canadians stated that they strongly agree with the prompt that Black people should not receive any special favours, compared to almost 33 per cent of white Americans. Over 32 per cent of white Canadians disagree either “strongly” or “somewhat” that Black people should not receive any special favours, compared to less than 20 per cent of white Americans. A majority of white Americans (over 57%) “strongly” or “somewhat” agreed with the prompt, compared to 37 per cent of white Canadians. However, it is notable that more white Canadians agreed with the racially resentful prompt than disagreed, suggesting that resentment towards Black people in Canada, as measured with this survey question, is not insignificant. In the Appendix (figures 11A–17A), I present the relative frequencies of the samples of white Canadians and Americans to the other survey questions measuring white identity and racial resentment, which show a similar empirical pattern.

Figure 2. Racial Resentment in Canada and the United States.
Source: Original survey data (2023). National samples are nationally representative samples from the United States and Canada, white respondents only. X-axis is percentage of the respective sample. Y-axis indicates answer to question. Colour indicates which country sample.
Table 1 displays the results of a difference-in-means analysis of nine measures of white identity and racial attitudes between the national samples of white respondents. Each variable has been recoded between 0 and 1 to increase comparability. These variables include: the full white racial identity index, the single variable measure of white identity (“How important is being white to your identity?”), the full index measure of racial resentment, as well as feeling thermometer scores for different racial groups.Footnote 16 The feeling thermometer for nonwhites was calculated by averaging the scores respondents provided on each of the thermometers for nonwhite groups (Black people, Indigenous/Native peoples, Asian people, and Hispanic/Latino people).
Table 1. Difference-in-Means National Samples of White Respondents

Source: Original survey data (2023). Nationally representative samples from the United States and Canada. White respondents only. Each variable has been recoded between 0–1 to improve comparability. Means are calculated and rounded to four decimal points. Standard errors are reported in brackets. *Mean for nonwhites feeling thermometer is the average across each nonwhite group thermometer.
On average, white Americans display a greater degree of attachment to their racial identity than the average Canadian. On the full index measure, this difference is equal to 0.09 on a 0–1 scale. On the single-item measure of white identity, this difference is equal to 0.14 on the same scale. Evidently, there is also a considerable difference between the national samples in terms of racial resentment. On average, the national sample of white Americans express higher levels of racial resentment than the corresponding Canadian sample. This difference on the index measure of racial resentment is equal to 0.11 on a 0–1 scale.
However, the differences between the national samples are more modest when comparing scores on feeling thermometers. The average feeling thermometer score for white people and nonwhite people is virtually identical between the national samples of Americans and Canadians. These differences are small and not statistically significant. Yet, there are larger differences when the feeling thermometers are broken down by specific nonwhite racial groups. The American national sample had colder feelings towards Latinos and Black people relative to the Canadian national sample, while the Canadian national sample expressed colder feelings towards Indigenous peoples than the American sample. Feeling thermometers provide important pieces of information, especially as it pertains to the specific dimensions of racial affect. But it also shows the importance of not only using feeling thermometer scores to evaluate the political importance of race.
Going further, in the Appendix, I present three violin plots that display the distribution, the median, and the interquartile range of the respective samples of white Canadians and white Americans on the measures of white identity (Figure 8A), racial resentment (Figure 9A) and nonwhite feeling thermometer scores (Figure 10A). These figures confirm the key findings of the difference-in-means analysis and provide additional context on the attitudinal differences between Canadians and Americans. Consistent with Table 1, the median points on the white identity index and racial resentment index are considerably lower for white Canadians compared to white Americans, but the median point for nonwhite feeling thermometer scores is virtually identical between the two samples. The violin plots do not evidence highly polarized distributions on these measures among either the Canadian or American sample. Yet, they do show how the bulk of white Canadian respondents express lower levels of racial resentment and less attachment to their racial identity than most white American respondents, underscoring how the base level attitudes of these populations are different.
Experimental Evidence: The Comparative Effects of a Candidate’s Race
What do differences in white identity and racial resentment potentially signify for political behaviour and electoral outcomes? This section turns to experimental evidence to assess how the presence of nonwhite political candidates affects vote choice between white Americans and white Canadians. Examining socially sensitive topics, such as how the race of candidates influences vote choice, can be difficult because people may not want to admit how this affects their decisions. However, one inherent advantage to conjoint experiments is that they have been shown to reduce social desirability bias (Bansak et al., Reference Bansak, Hainmueller, Hopkins, Yamamoto, Druckman and Green2021; Horiuchi et al., Reference Horiuchi, Markovich and Yamamoto2019). By posing several varied pieces of information about candidates, respondents may be less concerned that researchers will connect their choices to a specific attribute (Bansak et al., Reference Bansak, Hainmueller, Hopkins, Yamamoto, Druckman and Green2021).
The setup of the experiment was identical for respondents from either country, but with some of the levels of the attributes adjusted for country context. For instance, the party attribute could be Liberal, NDP, or Conservative for Canadians, and Democrat or Republican for Americans. The race attribute could be white, Black, Asian, or Indigenous for Canadians, and white, Black, Asian, or Hispanic/Latino for Americans.Footnote 17 The gender attribute, major endorsement attribute, occupation attribute and policy priority attribute had the exact same possible levels for both Americans and Canadians.Footnote 18
The levels of each attribute that respondents saw in the experiment were determined randomly with one important exception. To better replicate political conditions in each country, the levels of the policy priority attribute were constrained to certain political parties. For example, it would make little sense for respondents to encounter a candidate from either the NDP or the Democrats campaigning primarily on a policy platform of reducing immigration and refugee settlement. Thus, to enhance realism and external validity, the levels of the policy priority attribute that had a clear ideological-lean were constrained to the corresponding political party on that end of the left-right spectrum.Footnote 19 Given the randomization constraint between a candidate’s policy priorities and their political party, I created an interaction variable (Party_Policy) that combined each possible pairing of the two attributes and estimated an AMCE for each level.
To first analyze the results of the conjoint experiment, I estimated Average Marginal Component Effects (AMCEs) for each possible level of the attributes with a given baseline category among a subset of only white respondents from each country.Footnote 20 The AMCE represents the causal effect of an attribute level (that is, candidate race = Black) against another baseline value of the same attribute (that is, candidate race = White), while holding equal the joint distribution of the rest of the attributes in the design (Bansak et al., Reference Bansak, Hainmueller, Hopkins, Yamamoto, Druckman and Green2021). In this experiment, the AMCEs represents the average effect of an experimental treatment on a candidate’s vote share, given all the information that respondents have seen about a candidate. This experimental approach models how individuals make a single choice within a multidimensional information environment, like voting in an election (Bansak et al., Reference Bansak, Hainmueller, Hopkins, Yamamoto, Druckman and Green2021).
Figure 3 plots the AMCEs of each candidate attribute with confidence intervals from the conjoint experiment among white respondents, both French and English, from the national sample of Canadians.Footnote 21 There are numerous findings from this experiment, yet in this article I will focus on the estimated effects of a candidate’s race.Footnote 22 Among white Canadians, Figure 3 shows resoundingly that the race of a political candidate has no discernible negative effect on their vote share. Relative to white candidates, the baseline category, candidates randomly assigned to be Asian received a slightly lower average vote share (−1.3%), yet this effect was not statistically significant. Candidates randomly assigned to be Black (+2%) or Indigenous (+1.5%) received slightly higher average vote shares than white candidates, although these effects were also not statistically significant.

Figure 3. Canadian Conjoint Results.
Average marginal component effects (AMCEs) of candidate attributes. Outcome is a binary forced choice variable of which candidate you would vote for. Lines represent confidence intervals. Respondents are nationally representative sample of Canadians, whites only. N = 1,549. Effect sizes for race treatments: Asian = −0.013 (0.012); Black = 0.020 (0.012); Indigenous = 0.015 (0.013).
Figure 4 plots the corresponding results from the candidate-choice conjoint experiment among white respondents from the national sample of Americans. By contrast to the Canadian results, nonwhite political candidates do receive an electoral penalty from white Americans. Political candidates randomly assigned to be Asian (−2.9%), Black (−2.1%), and Hispanic/Latino (−3.6%) all received lower average vote shares relative to white candidates in the experiment. The negative effect corresponding to Black candidates is just below the conventional level of statistical significance, but the negative effects corresponding to both Asian and Hispanic/Latino candidates are statistically significant.

Figure 4. American Conjoint Results.
Average marginal component effects (AMCEs) of candidate attributes. Outcome is a binary forced choice variable of which candidate you would vote for. Lines represent confidence intervals. Respondents are nationally representative sample of Americans, whites only. N = 1,399. Effect sizes for race treatments: Asian = −0.029 (0.013); Black = −0.021 (0.013); Hispanic/Latino = −0.036 (0.013).
These comparative results are especially noteworthy given the consistency of the direction of effects. For the sample of white Americans, all nonwhite racial candidates received lower average vote shares than white candidates. For the sample of white Canadians, only Asian candidates received a lower average vote share than white candidates, but this penalty was both marginal in magnitude and smaller than the penalty that Asian candidates received from white Americans.
Following the approach advocated by Leeper et al. (Reference Leeper, Hobolt and Tilley2020), the Appendix presents the results of a subgroup analysis of the conjoint experiment. I investigate the marginal means of each candidate attribute among white Americans and Canadians conditioned by a respondent’s levels of racial resentment or white identity. First, I split each of the American and Canadian samples of white respondents into those who were above or below the mean of the racial resentment index and estimate the marginal means of each attribute level (see figures 4A and Figure 6A in the Appendix). Next, I do the same for white identity, splitting the American and Canadian samples of white respondents into those above or below the mean of the white identity index measure and estimating the marginal means of each candidate attribute (see Figure 5A and 7A in the Appendix). This subgroup analysis shows how the effects of a candidate’s race are highly responsive to the degree to which a respondent is racially resentful or identifies as white. White candidates perform markedly better among those who are high in racial resentment or high in white identity. Nonwhite candidates perform better among those who are lower in racial resentment or white identity. Accordingly, the lower average levels of racial resentment and white identity among white Canadians relative to white Americans uncovered in the previous section of this article is a key reason why nonwhite candidates perform better in the aggregate among white Canadian voters.
Importantly, while this subgroup analysis shows how the effects of a candidate’s race are conditioned by the underlying racial attitudes and identities of American and Canadian respondents, there are also differences between the populations. For white Americans with low levels of racial resentment or white identity, candidates randomly assigned to be white fare about the same as nonwhite candidates. Among the sample of white Americans with high levels of racial resentment or white identity, white candidates perform much better than nonwhite candidates. However, for white Canadians with low levels of racial resentment or white identity, nonwhite candidates outperform white candidates in the conjoint experiment. For instance, among the sample of white Canadians with below average levels of racial resentment, white candidates (marginal mean = 0.4403) performed more than 5 percentage points worse than Asian candidates (marginal mean = 0.4948), almost 9 percentage points worse than Indigenous candidates (marginal mean = 0.5289) and almost 10 percentage points worse than Black candidates (marginal mean = 0.5363). Among the sample of white Canadians with below average levels of white identity, white candidates (marginal mean = 0.4546) performed 2.4 percentage points worse than Asian candidates (marginal mean = 0.4786), more than 6 percentage points worse than Indigenous candidates (marginal mean = 0.5193) and 9 percentage points worse than Black candidates (marginal mean = 0.5470).
This provides some necessary intuition behind the results of the experiment among the total samples of white Americans and Canadians. For white Americans, nonwhite candidates perform worse than white candidates in part because respondents with higher levels of racial resentment and white identity strongly favour white candidates. For white Canadians, there is no net-negative effect for nonwhite candidates due in part to respondents with lower levels of racial resentment and white identity favouring nonwhite candidates, as well as the lower prevalence of racial resentment and white identity among white Canadians uncovered in the previous section.
Electoral Behaviour: White ID, Racial Resentment and Nonwhite Feeling Thermometers
To further investigate the comparative electoral importance of race among white Americans and Canadians, this section reports the results of multiple regression analyses estimating the political effects of white racial identity, racial resentment and feelings towards nonwhite people. While measures of white identity, racial resentment and feeling thermometer scores are complimentary and often correlated, I analyze these independent variables separately because they are distinct theoretical constructs and to better pinpoint differences between white Canadians and Americans across these measures. The key outcome variables for this set of analyses are past vote choice, future vote intention and a scaled index measure of right-wing partisan identity (five-point intensity scale).
A large selection of control variables is included in the analysis to limit any concern of omitted variable bias, yet for conciseness, only the estimates associated with white racial identity, racial resentment and feelings towards nonwhite people are shown below. The full regression models with the corresponding estimates for each control variable are shown in Appendix 2. These include standard demographic variables, such as age, income, gender, union membership and religious importance, as well as variables measuring a respondent’s level of national identity and their level of support for free market principles versus government intervention in the economy and society (termed “laissez-faire attitudes”).Footnote 23 For the purpose of comparability, I merge the Canadian and American survey data and estimate regression models with identical specifications and identically constructed variables.Footnote 24 The key difference in the models is an indicator variable conditioning whether respondents are American or Canadian. There are, of course, important limitations to cross-sectional observational analysis (Lenz, Reference Lenz2012). Hence, while the variables included in the regression analyses theoretically precede vote choice and partisanship (Miller and Shanks Reference Miller and Shanks1996), I avoid making causal claims or inferences pertaining to causal order.
Beginning with the effects of white identity, I estimate logit models for past vote choice in either the 2021 Canadian federal election or the 2020 American presidential election, as well as vote intention for the next Canadian federal election or American presidential election. These outcome variables are coded 0–1, where 0 indicates a past vote or future vote intention for a non-right-wing party and 1 indicates a past vote or future vote intention for a right-wing party (Republicans for Americans, Conservatives or People’s Party of Canada for Canadians). I also estimate ordinary least squares (OLS) models for right-wing party identity (Republican ID for Americans, Conservative ID for Canadians), which is measured on a five-point intensity scale and recoded between 0–1 for ease of analysis. Robust standard errors are employed to protect against heteroskedasticity. Figure 5 displays the average marginal effects of the white racial identity index derived from each of the six models among white Americans or white Canadians.

Figure 5. White ID and Electoral Behaviour.
Average marginal effects for White Racial Identity index derived from six regression models (full controls included, reported in the Appendix); confidence intervals denoted with lines. Nationally representative samples of white Canadians and white Americans. Size of estimated effects, with sample size from each population in brackets: 1) Right-Wing Vote 2020, US Sample = 0.188 (n = 1,092); 2) Right-Wing Vote 2021, Canadian Sample = 0.094 (n = 1,277); 3) Right-Wing Vote Intention, US Sample = 0.240 (n = 1,144); 4) Right-Wing Vote Intention, Canadian Sample = 0.171 (n = 1,390); 5) Right-Wing Party ID, US Sample = 0.198 (n = 1,357); 6) Right-Wing Party ID, Canadian Sample = 0.095 (n = 1,282).
Figure 5 shows that white racial identity is positively correlated with vote choice and party identity in each of the models. For white Canadians, white identity is statistically significant in the right-wing vote intention model and the right-wing party ID model. A one-unit increase in white racial identity translates to a 17 per cent increase in the likelihood a respondent intends to vote for the Conservative Party or the People’s Party (PPC) in the next federal election, and a 9.5 per cent increase in Conservative Party ID. For white American respondents, there is a consistently large, statistically significant effect of white racial identity across each model. A one unit increase on the white racial identity scale corresponds to a respondent being 19 per cent more likely to have voted for Trump in 2020 and 24 per cent more likely to state they would vote for a Republican for president in 2024. A one-unit increase in white racial identity translates to a respondent being almost 20 per cent higher in Republican Party ID.
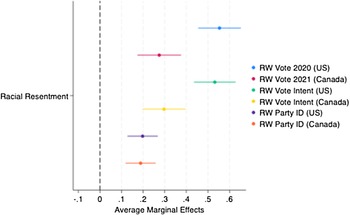
Figure 6 moves to the regression models for the effects of racial resentment. The design of these models is identical to Figure 5, but with racial resentment as the main independent variable instead of white identity. An indicator variable is again used in the models to distinguish between Canadian and American respondents. I derived average marginal effects from each of the regression models for ease of interpretation.

Figure 6. Racial Resentment and Electoral Behaviour.
Average marginal effects for Racial Resentment index derived from six regression models (full controls included, reported in the Appendix); confidence intervals denoted with lines. Nationally representative sample of white Canadians and white Americans. Size of estimated effects, with sample size from each population in brackets: 1) Right-Wing Vote 2020, US Sample = 0.554 (n = 1,090); 2) Right-Wing Vote 2021, Canadian Sample = 0.275 (n = 1,280); 3) Right-Wing Vote Intention, US Sample = 0.532 (n = 1,143); 4) Right-Wing Vote Intention, Canadian Sample = 0.297 (n = 1,393); 5) Right-Wing Party ID, US Sample = 0.198 (n = 1,357); 6) Right-Wing Party ID, Canadian Sample = 0.188 (n = 1,285).
Figure 6 shows that racial resentment has a consistently stronger effect across each of the models relative to white identity and is statistically significant in each of the models of vote choice and party identity. Specifically, a one-unit increase on the racial resentment scale translates to white Canadians being 27 per cent more likely to have voted for the Conservatives or the PPC in the 2021 Canadian Federal Election, 30 per cent more likely to intend to vote Conservative or PPC in the next election and a 19 per cent increase in Conservative Party ID. The effect sizes for the American portion of the merged data are even greater in magnitude. For white Americans, a one-unit increase on the racial resentment scale translates to respondents being over 55 per cent more likely to have voted for Trump in 2020, 53 per cent more likely to state that they would vote for a Republican for President in 2024, and an almost 20 per cent increase in Republican Party ID.
Evidently, racial resentment and white racial identity are strong correlates of right-wing voting and party identity in both Canada and the United States. Crucially, however, the two preceding figures show that the magnitude of the average marginal effects of white racial identity and racial resentment are lower in each model for the Canadian sample compared to the American sample. The effect size of white racial identity, across each of the models for past vote, future vote intention and right-wing party identity, is at least 7 percentage points higher among white Americans relative to white Canadians. For racial resentment, the differences in effect size between the cross-national samples are even greater on the first two regression models for voting behaviour (over 23 percentage points higher for white Americans). The exception is the models for party identity, where racial resentment has only a slightly greater effect size among white Americans relative to white Canadians. Consequently, white racial identity and racial resentment have larger effects for white Americans, but both variables are important correlates of right-wing voting and partisanship among white Canadians.
To conclude this section, I also estimate regression models with feelings towards nonwhite people as the key independent variable. As stated above, this variable is measured as the average feeling thermometer score provided by respondents for each nonwhite racial group that the survey included. The setup of the regression models is otherwise the same as the prior models, but with the variables for average feelings towards nonwhite people in place of racial resentment or white identity. The cross-national samples again consist only of white respondents.
Figure 7 plots the average marginal effects derived from the regression models among the samples of white Canadians and Americans. As above, the models for past vote choice and future vote intention are estimated with logistic regression. The models for right-wing party ID are estimated with OLS. We expect to find that the warmer individuals feel towards nonwhite people is negatively associated with voting for and identifying with right-wing parties. Figure 7 shows that this is the direction of the relationship. However, unlike the models for racial resentment or white identity, these effects are almost entirely not statistically significant for both American and Canadian respondents. Only the models for right-wing vote intention reach the conventional level of statistical significance and the size of the coefficients are modest. Therefore, while racial affect is an important attitudinal measure, it has a weaker correlation with electoral behaviour compared to racial resentment and white identity. These results suggest how important it is for researchers to go beyond feeling thermometer scores and extend their analysis of racial attitudes to include other measures.

Figure 7. Nonwhite Feeling Thermometer and Electoral Behaviour.
Average marginal effects for Nonwhite Racial Feeling Thermometer derived from six regression models (full controls included, reported in the Appendix); confidence intervals denoted with lines. Nationally representative samples of white Canadians and white Americans. Size of estimated effects, with sample size of each population in brackets: 1) Right-Wing Vote 2020, US Sample = -0.057 (n = 1,085); 2) Right-Wing Vote 2021, Canadian Sample = −0.097 (n = 1,253); 3) Right-Wing Vote Intention, US Sample = −0.118 (n = 1,138); 4) Right-Wing Vote Intention, Canadian Sample = −0.128 (n = 1,364); 5) Right-Wing Party ID, US Sample = −0.020 (n = 1,353); 6) Right-Wing Party ID, Canadian Sample = −0.054 (n = 1,259).
Conclusion
To the south, race has long been a central unit of political analysis. From affective polarization (Iyengar et al., Reference Iyengar, Lelkes, Levendusky, Malhotra and Westwood2019) to policy attitudes (Gilens, Reference Gilens1999), voting behaviour (Dawson, Reference Dawson1994; Mendelberg, Reference Mendelberg2001) and the rise of Donald Trump (Mutz, Reference Mutz2018; Sides et al., Reference Sides, Tesler and Vavreck2018), scholars have shown that there is an array of areas in American politics where race is of fundamental importance. But to the north, in the words of Thompson (Reference Thompson2008), scholarship on the politics of race was traditionally “tangential” at best. Recent Canadian studies have begun to look at racial politics more closely. Important work has shown how nonwhite voters have an affinity for supporting their own ethnocultural group (Besco, Reference Besco2015; Reference Besco2019), colder feelings towards ethnic minorities were associated with decreased likelihood of supporting the NDP in 2019 and 2021 federal elections (Hale, Reference Hale2023), and white identity and anti-Indigenous resentment are associated with voting for the Conservative Party (Beauvais and Stolle, Reference Beauvais and Stolle2022). This article builds on past work by examining the importance of white racial identity, racial resentment and nonwhite racial affect in Canada from a comparative perspective. I do so by utilizing temporally aligned survey and experimental data among white respondents from large, nationally representative samples of Americans and Canadians.
This article shows how there remain significant differences between white Canadians and Americans on measures of white racial identity and racial attitudes. White Canadians display considerably lower levels of white identity and racial resentment relative to white Americans. Being white is more important to Americans, and white Americans are more racially resentful than white Canadians. But these differences decline when considering measures of racial affect with feeling thermometers. Americans express colder feelings towards Black people and Hispanics/Latinos, but warmer feelings towards Indigenous peoples. On average, white Canadians and Americans express similarly warm feelings towards white people as a group.
There are important differences between Americans and Canadians in terms of racial attitudes and white identity, but to find them requires extending the comparison beyond racial group feeling thermometers. It is possible that feeling thermometer scores are more prone to social desirability bias, and hence skew the comparison between the populations. But it may be the case that the crucial dimensions of the differences in racial attitudes between Canadians and Americans are the greater salience of anti-Black attitudes, the link to welfare politics and the unique construction of whiteness as a pervasive identity in the United States and not general feelings of affect towards white or nonwhite groups. Future research could investigate this point and expand the comparison to also include other racial attitudinal measures, such as the degree of agreement with racial stereotypes, to further theorize the points of difference between Canadians and Americans.
How do these differences matter for electoral behaviour? Leveraging this project’s original candidate-choice conjoint experiment, which has been shown to reduce social desirability bias and generate more accurate analysis of socially sensitive topics (Bansak et al., Reference Bansak, Hainmueller, Hopkins, Yamamoto, Druckman and Green2021; Horiuchi et al., Reference Horiuchi, Markovich and Yamamoto2019), I show that nonwhite political candidates trigger stronger electoral backlash from white Americans. The political candidates randomly assigned to be nonwhite receive consistently lower average vote shares among the sample of white American respondents. By contrast, for the total sample of white Canadian respondents, there was no electoral penalty for nonwhite candidates. Candidates randomly assigned to be either Black or Indigenous even performed slightly better than the average white candidate. Subgroup analysis shows how the results of the experiment are conditioned by underlying racial attitudes and how white Canadians with lower levels of racial resentment or white identity are more likely to favour nonwhite candidates. However, white Canadians who are more racially resentful or who more strongly identify as white are similar to their American counterparts in their electoral preference for white candidates.
Utilizing regression analyses, I show that white racial identity and racial resentment are strongly associated with voting for and identifying with right-wing parties in both Canada and the United States. While the magnitude of these effects is larger among the samples of white Americans, it would be a mistake to conclude that white identity and racial resentment are unimportant for right-wing voting and partisanship in Canada. Measures of white identity and racial resentment are meaningful in the Canadian context. Some white Canadians identify strongly with their racial group. Some white Canadians do not believe that Black people are deserving of special favours, and that Black people could be just as well off as white people if they simply tried harder. These white Canadians are more likely to identify with and vote for right-wing political parties.
In sum, this article argues that race continues to be of greater political importance in the United States than Canada. But that it is far from an irrelevant factor in Canada and in how white Canadians decide which party to support. Accordingly, these findings suggest, above all, that race should continue to be given greater attention by scholars of Canadian political behaviour.
Supplementary material
To view supplementary material for this article, please visit https://doi.org/10.1017/S000842392500006X.
Competing interests
The author declares no competing interests. There are no conflicts of interest which could influence the interpretation of the findings in this research article.


 Open access