


Introduction
One of the biggest challenges in the year 2020 was to develop as fast as possible a vaccine in response to the global COVID-19 pandemic. On 9 November 2020, Pfizer and BioNTech presented preliminary results, indicating that their vaccine was 90% effective in preventing coronavirus infection.Footnote 1 Further positive news followed on 16 November from ModernaFootnote 2 and on 24 November from Oxford University and AstraZeneca.Footnote 3 However, despite the good news, we already witness obstacles for vaccinating a sufficient portion of the population. This seems to have been the challenge of the year 2021 and persists in the year 2022.Footnote 4 Vaccine hesitancy has long been a problem (Dubé et al., Reference Dubé, Laberge, Guay, Bramadat, Roy and Bettinger2013), and in the case of COVID-19, this hesitancy may be prevalent due to the way clinical testing was expedited.Footnote 5
The problem is that for a vaccine to be effective on a population level, a significant majority of people need to receive it. For this reason, the possibility of mandatory vaccination (either direct or indirect) has been discussed in several countries.Footnote 6 But such a policy meets with controversy everywhere. A recent working paper from Germany (Graeber et al., Reference Graeber, Christoph and Carsten2020) suggests that people would be opposed for different reasons: either because they reject the vaccine itself, or because they reject the mandate. One way to resolve the problem for both types of opposition is to encourage voluntary uptake of the vaccine through public persuasion campaigns.
The social and behavioural sciences may be able to support policy initiatives to overcome vaccine hesitancy (Bavel et al., 2020). Knowledge of the cognitive biases, emotional responses and social norms and networks which affect threat and risk perception may assist us in choosing tools to persuade the public of the safety of vaccines. Examples include the insight that source credibility may affect the credibility of risk communications (Brinol & Petty, Reference Brinol and Petty2009), and that the framing of messages can affect public acceptance (Grant & Hofmann, Reference Grant and Hofmann2011). It may also be that these insights can help us in combatting misinformation and conspiracy theories (Jolley & Douglas, Reference Jolley and Douglas2014).
In this article, we focus on nudging (Thaler & Sunstein, Reference Thaler and Sunstein2008). Nudging calls for the architecture in which choices are made to be designed in a way which promotes certain welfare-enhancing behaviours, and it has been considered or used before in the case of vaccines (see, e.g., Korn et al., Reference Korn, Betsch, Böhm and Meier2018), although not without controversy (Dubov & Phung, Reference Dubov and Phung2015; Navin, Reference Navin2017). Nudges can be pro-self, i.e., aimed at improving the welfare of the decision makers themselves (e.g., promoting healthy lifestyle, increasing savings). On the other hand, there are pro-social nudges, with the main aim to benefit society (e.g., tax compliance). Vaccinations constitute an interesting case from this perspective. Nudges that aim to enhance vaccination rates are both pro-self and pro-social. By vaccinating, the person protects him or herself, but at the same time also contributes to building ‘herd immunity’ in their society, thus protecting others.
In this article, we are testing experimentally two types of nudges: descriptive social norms and saliency. The first is examined on a representative sample of the Israeli population and the second type of nudges is examined using a representative sample of the UK population. Those two countries were pioneers in vaccinating against COVID-19, and it is interesting to examine whether different nudges can increase people's intention to voluntarily vaccinate against the virus. The advantage of nudges is that they are considered as freedom-preserving interventions. Thus, they may avoid resistance from the public.
Social norm nudges are based on the insight that people are responsive to information on the normative convictions and actions of others (Cialdini et al., Reference Cialdini, Kallgren and Reno1991). In this context, we examined whether information on the intention of the majority of the country population to vaccinate against COVID-19, would increase participants’ intention to receive a vaccine against COVID-19 if available. In addition, given the sensitivity of the topic, and in order to increase the legitimacy of the public policy which exploits behavioural biases, we examined whether meaningful transparency regarding the used method would impede the effectiveness of the nudge.
The second type of nudges is saliency. Studies from behavioural sciences have demonstrated that vivid negative information may have an effect on people's choices. It might be due to the availability heuristic, which leads to a perception that a salient event is also more probable (Tversky & Kahneman, Reference Tversky and Kahneman1974). It might also be effective because people become less responsive to changes in probabilities when they face affective descriptions of a negative event (Loewenstein et al., Reference Loewenstein, Weber, Hsee and Welch2001). For the purposes of our study, we have examined whether providing a vivid description of the death experience from the coronavirus, or of its hard symptoms, would enhance people's intention to vaccinate. Likewise, we have investigated whether presenting such nudges in a transparent way (how they work and why they are used) would have an impact on the effectiveness of the nudges.
In our studies, a descriptive social norm nudge, and a saliency nudge, did not significantly change people's intentions to vaccinate against COVID-19. Despite being effective in other contexts (Wisdom et al., Reference J., Downs and Loewenstein2010; Allcott, Reference Allcott2011; Hallsworth et al., Reference Hallsworth, List, Metcalfe and Vlaev2017), and despite the potential for constituting a ‘soft’ public approach to promote vaccination, it does not seem to change people's mind. Being transparent with respect to the psychological channel through which the nudges are potentially effective, and their goal, also seems not to affect people's reported intentions.Footnote 7
Recent studies have examined different behaviourally informed interventions to increase vaccination intentions or uptake of vaccines against COVID-19. Some studies find that such messages can be effective, e.g., Dai et al. (Reference Dai, Saccardo, Han, Roh, Raja, Vangala, Modi, Pandya, Sloyan and Croymans2021) found in a large-scale study in the US that ‘ownership’ messages which emphasize that vaccines are available for the particular person or stress the effectiveness of the vaccine, increased the uptake of vaccine among the elderly population. Similarly, Jensen et al. (Reference Jensen, Ayers and Koskan2022) found that short video messages about the effectiveness and safety of the vaccine increased vaccination intentions. Pfattheicher et al. (Reference Pfattheicher, Petersen and Böhm2022) demonstrated that emphasizing the herd immunity effect of vaccination, or priming empathy, may increase vaccination intentions. Similarly, James et al. (Reference James, Bokemper, Gerber, Omer and Huber2021) found that ‘community’ nudges (emphasizing the benefits of vaccinating oneself to own family and community) increased people's intentions to vaccinate against COVID-19. Nevertheless, there are also studies which did not find behavioural interventions to be effective. For example, Rabb et al. (Reference Rabb, Swindal, Glick, Bowers, Tomasulo, Oyelami, Wilson and Yokum2022), in a large-scale study on US participants (Rhode Island), examined the effectiveness of different messages, including ‘ownership’, social norms, effectiveness, and safety, on the uptake of vaccinations against COVID-19. Generally, they did not find those messages to change people's behaviour. Chang et al. (Reference Chang, Jacobson, Shah, Pramanik and Shah2021) demonstrated that safety messages have the ability to increase vaccination intentions, but not actual uptake.
Even though the majority of studies deal with American participants, some studies have also examined the question of nudges’ effectiveness in the context of COVID-19 in other countries. For example, Sasaki et al. (Reference Sasaki, Saito and Ohtake2021) conducted an experiment in Japan and found that the effect of a descriptive social norm was restricted to the older population which already had such intention. Another study using descriptive social norm, by Moehring et al. (Reference Moehring, Collis, Garimella, Amin Rahimian, Aral and Eckles2021), found an average effect of enhancing that intention in the more hesitant group in an experiment which was conducted in 23 countries. However, looking closely at the results, it is clear that the effect was driven by just a subset of the countries. In most of the countries, the descriptive social norm did not change people's intentions. Sinclair and Agerström (Reference Sinclair and Agerström2021) examined the effectiveness of descriptive social norm among young adults in the UK and did not find any effect on vaccination intentions.
To the best of our knowledge, the only study which examined the effectiveness of descriptive social norm in Israel is by Berliner Senderey et al. (Reference Berliner Senderey, Ohana, Perchik, Erev and Balicer2021). However, the clear results of that study refer to the effectiveness of a descriptive social norm message as compared to personal benefits nudge. It is less clear whether a descriptive social norm may be in general effective.Footnote 8 Therefore, our first contribution is to examine the independent effect of a social norm nudge on vaccination intentions against COVID-19 on a representative sample in Israel. In addition, to the best of our knowledge, this is also the first study to examine the effect of a saliency nudge, which tries to utilize affective reactions to the experience of death and symptoms of COVID-19 to enhance vaccination intentions.
Nudging vaccination is a timely topic, which has not only scientific value, but is also important for policy makers. To build a sufficiently reliable body of knowledge, which can inform governments in the important question of how to enhance vaccination intentions, different methods should be examined on representative samples of different countries. It is essential to provide evidence-based recommendations about what works, but also what does not work, to assist governments to decide on the right course of action for them, especially given the mixed results. Therefore, this article is an important contribution to the studies investigating the application of behavioural insights to promote vaccination, also beyond COVID-19 context (e.g., Milkman et al., Reference Milkman, Beshears, Choi, Laibson and Madrian2011; Korn et al., Reference Korn, Betsch, Böhm and Meier2018; Li & Chapman, Reference Li and Chapman2020; Maltz & Sarid, Reference Maltz and Sarid2020).
In addition, this article contributes to the literature on the impact of transparency on the effectiveness of nudges (Loewenstein et al., Reference Loewenstein, Cindy, David and Sachin2015; Steffel et al., Reference Steffel, Williams and Pogacar2016; Bruns et al., Reference Bruns, Elena, Katharina, Luistro and Bilel2018; Paunov et al., Reference Paunov, Wänke and Vogel2018; Hallez et al., Reference Hallez, Van Roy, Zaman and Smits2021; Kantorowicz-Reznichenko & Kantorowicz, Reference Kantorowicz-Reznichenko and Kantorowicz2021). The empirical research on transparent nudges is scarce outside the default nudge literature. Furthermore, to the best of our knowledge, these are the first studies to investigate the effectiveness of transparent nudges in the context of increasing vaccination intentions, which is particularly sensitive context where people strongly value their autonomy of choice. Furthermore, even though the previous studies are important to inform about the influence of transparency, it should be kept in mind that there are different underlying psychological mechanisms of different nudges. For example, transparency might not matter with defaults, or even have positive effect because they work as recommendations or reference points (Dinner et al., Reference Dinner, Johnson, Goldstein and Liu2011). On the other hand, social norms work through people's tendency to conform. Transparency with respect to the latter mechanism might backfire, if people do not want to be perceived as conformists (Kantorowicz-Reznichenko & Kantorowicz, Reference Kantorowicz-Reznichenko and Kantorowicz2021). Increasing the saliency of affective information, has yet another psychological mechanism, thus requiring an independent investigation of the effectiveness of such transparent nudges, rather than inferring from studies on other nudges. Therefore, expanding our understanding with respect to how transparency influences the effectiveness of different nudges is another important scientific contribution of the current study. Moreover, such understanding is also important from policy perspective. Opaque nudges might be viewed as manipulative, especially given the fact people are often unaware of being nudged, or that some psychological mechanisms are used to drive their behaviour (e.g., Hansen & Jespersen, Reference Hansen and Jespersen2013). Therefore, investigating how transparent nudges operate may increase their legitimacy in public policy implementation.
The article is structured as follows. We first discuss the study in Israel, presenting the theoretical predictions, experimental design and results of the descriptive social norm experiment. Next, we present the second study: the saliency nudges in the UK. For this study as well, we put forward the theoretical predictions, explain the design and present the results. Those two sections are followed by a general discussion of the findings and policy implications.
Study 1: descriptive social norms
Theoretical framework and predictions
The phenomenon of people being influenced by what other people are doing (descriptive social norms) or what people think should be done (injunctive social norms) is well established. The reason people follow the actions of others is that such actions serve as an informational cue to effective and adaptive behaviour. In other words, people believe in the wisdom of the crowd (Cialdini et al., Reference Cialdini, Kallgren and Reno1991). The effectiveness of descriptive social norms as nudges has already been demonstrated in the context of socially beneficial policies (e.g., Allcott, Reference Allcott2011; Hallsworth et al., Reference Hallsworth, List, Metcalfe and Vlaev2017). Given the uncertainty surrounding the COVID-19 pandemic, the behaviour of others might seem as a useful guide for people to make decisions. Moreover, vaccination in particular might be viewed as a large-scale public good game. Only if a sufficient number of people are vaccinated, can the spread of the disease be halted. If, on the other hand, a majority of people decide not to vaccinate, then the vaccination decision of a single individual has less of an effect on the general state of the pandemic, even though it provided him or her with somewhat better protection. Therefore, using social norms might be a potential method to encourage people to vaccinate (assuming many people have such intention). We decided to use a descriptive social norm (what people are doing), as opposed to injunctive social norms (what people think should be done) due to the findings that such a nudge is more effective (Hallsworth et al., Reference Hallsworth, List, Metcalfe and Vlaev2017).
Following the theoretical underpinnings and the empirical evidence, we predict that
informing participants about an intention of the majority of people to get the COVID-19 vaccine when available will increase their individual willingness to declare such intention (H1).
However, descriptive norms may also backfire. The norm is usually meant to provide information on the prevalence of certain behaviour to correct for misperception, and influence people's actions. This strategy exploits people's desire not to deviate from the common behaviour. When the given behaviour is negative (e.g., drinking), using descriptive social norms might backfire for the group of people who was engaging in the negative behaviour to a lesser extent than the ‘norm’. Those people might have previously underestimated the prevalence of certain behaviour and will now adjust their activity upwards. Conversely, in the context of positive behaviour (e.g., tax compliance), the nudge might backfire among the group of people who contribute more than the ‘norm’. Those people might have over-estimated the prevalence of contribution and now change their behaviour downwards. This type of boomerang effect was theorized as well as examined empirically (e.g., Schultz et al., Reference Schultz, Nolan, Cialdini, Goldstein and Griskevicius2007).Footnote 9
In the case of public good provision, the descriptive social norm may backfire for any group, irrespective of their initial intentions. To understand why, we can look at the context of vaccination. In this case, there is a negative correlation between the number of people receiving vaccination and the likelihood to be infected with the given disease. Therefore, while collectively it is rational to vaccinate to contain the spread of the disease, individually it is more beneficial to free ride on the desirable actions of others (Bauch & Earn, Reference Bauch and Earn2004). Looking at the extreme example, if the entire country is vaccinated, then it is rational for the last person not to vaccinate. This way he or she is not exposed to the potential side effects of the vaccine, but at the same time, this person is no longer at risk of contracting the virus since all other people are vaccinated. Given this logic, and despite the evidence that descriptive social norms are effective in promoting socially desirable behaviour, there is a possibility that a descriptive social norm will backfire. A participant, who sees that the vast majority of people in their country intend to vaccinate, might decide they will not vaccinate because under such circumstances the risk of infection will be lower.
Next, we are interested to examine whether making the behavioural mechanism, which is used in this method and the goal for which it is done, transparent would decrease the effectiveness of the nudge. The issue of vaccines is particularly a sensitive topic. It concerns people's well-being as well as their freedom to decide which medical interventions to undergo. Using behavioural insights in general, but nudges in particular, might involve exploitation of people's biases without their awareness. It is believed that this lack of awareness is the exact source of the effectiveness of the nudge (Bovens, Reference Bovens, Grüne-Yanoff and Hansson2009). Therefore, in order to increase the legitimacy of such tools when used by public authorities, one needs to examine the nudge's effectiveness when it is made transparent.
Bruns and Paunov (Reference Bruns and Paunov2021) have identified different types of transparency which have been implemented in past studies. The most prominent type of transparency relies on informing participants how the nudge affects or is expected to affect them. The second most used type of transparency emphasizes the goal of the nudge. Transparency was also implemented with respect to the mechanism behind the nudge; underlying research; the fact people are often unaware of nudges, etc. The authors find that transparency with respect to the mechanism underlying the nudge has a significant positive effect on the effectiveness of the nudge. However, they also find that default nudges are those that benefit the most from transparency. It is less clear how transparency would affect other types of nudges.
In this study, we have decided to introduce transparency with respect to the goal of the nudge and the mechanism of its expected effectiveness. This can be considered a meaningful transparency (Hansen & Jespersen, Reference Hansen and Jespersen2013) since people are being fully informed why and how certain information is presented to them. Since people appreciate their individual decision making, it can be expected that informing them that the descriptive norm is used because we know people are influenced by the actions of others might make them follow the nudge to a lesser extent, or not to follow it at all (e.g., due to psychological reactance, Brehm, Reference Brehm1966). On the other hand, disclosing the benevolent goal of increasing their and others’ protection from the virus might partially restore their willingness to follow the nudge.
Consequently, we predict that
informing participants about the intention of a majority of people to get the COVID-19 vaccine, and disclosing to them the reason and the goal behind this information, will reduce the willingness to declare such intention as compared to a nudge without transparency, but increase the willingness as compared to no information (H2).
Furthermore, we examined several moderating effects, i.e., we checked if the effects of nudges vary in different subgroups of the population. These subgroups comparisons include: female vs male; conspiracy theory believers vs non-believers; people who comply with and support anti-COVID 19 policies vs those who do not; people who perceive the risk of infection as high vs those who perceive it as low and people trustful of their government and its ability to manage the pandemic vs those with low trust. We have also examined whether a person's political ideology matters for the intention to vaccinate and responsiveness to the nudge. The theoretical framework for the potential moderating effects can be found in the Supplementary Material.
Experimental design and procedure
The experiment
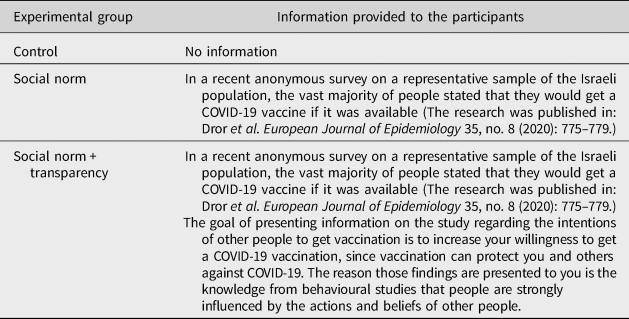
Our experiment was part of a larger survey examining people's attitudes and behaviours during the COVID-19 pandemic. After answering those questions, participants were randomly divided into three groups (control, nudge and nudge + transparency). All participants received the same statement, but the additional information varied (the experimental treatment). The nudge group received (true) information on a previous study in Israel about the intention of people to vaccinate against COVID-19. The transparency group received the same information, and in addition an explanation about the goal of using this nudge, and the reasons (i.e., the psychological mechanism behind it). For the experimental groups, see Table 1.
Experimental groups.
Our outcome variable was people's level of agreement with a statement regarding vaccination intention – ‘If a vaccine for COVID-19 was available, I would get vaccine against the virus (5 = strongly agree; 4 = agree; 3 = neither agree nor disagree; 2 = disagree; 1 = strongly disagree)’. Furthermore, to better understand people's unwillingness to vaccinate, those who declared they disagreed with the statement (who chose 1 or 2 in the previous question) were further asked for their reason(s). Finally, all participants were asked to answer several demographic questions and questions for the subgroup analysis. The consent form and the full details of the experiment can be found in the Supplementary Material (Study 1).
To control for people's attention to the experimental intervention, we have included a manipulation check for the treatment groups. This question asked the participants to indicate the portion of people who announced their intention to vaccinate in the previous study which was presented to them (and constituted the descriptive social norm nudge). The answers included three options (half of the people; the vast majority of people and less than half of the people). Following Aronow et al. (Reference Aronow, Baron and Pinson2019), we conducted the analysis on the full sample. It is important especially since the control group did not receive any manipulation check. However, as a robustness check, we also report the results for the sample where only the participants who passed the manipulation check are included. It should be further mentioned that all participants performed an attention check and could take part in the experiment only if they passed it.Footnote 10 Therefore, the study guaranteed a high quality of responses.
Procedure
The experiment was conducted on a representative sample of the population in Israel on gender and age, provided by the survey firm Midgam panel. The total sample amounted to 1121 participants.Footnote 11 It took place on 11–18 October 2020. First, the participants answered general questions related to the additional analyses we have performed (e.g., conspiracy theories, ideological stance, compliance with COVID-19 related rules, etc.). Next, the participants took part in the experiment, where respondents were randomly assigned to the different experimental groups. Demographics information was collected at the end. The exact text and structure of the study can be found in Supplementary Material, Study 1– ‘The text of the full study’. The study was pre-registeredFootnote 12 and approved by the Erasmus School of Law Research Ethics Review Committee (no. 20-08). Based on a power analysis, we needed N = 1012 participants to detect a relatively small effect size (d = 0.25) in the subgroup analysis. We were able to estimate the main effects of experimental treatments (control and one treatment group) at two levels of another variable (e.g., belief in conspiracy theories as reported in the Supplementary Material).
Results
Our final sample for the analysis included 1121 participants.Footnote 13 Average age in the sample is 43.2 and 49.1% of respondents are females. The experimental groups are balanced, and details can be found in Supplementary Table S1-1. Next, we examined the results following the hypotheses we have put forward in the theory section. The analysis presented here relies on t-tests, but in the Supplementary Material we provide a battery of alternative tests. Our main question concerned the effectiveness of the nudge in increasing the intention to vaccinate. We predicted that informing people about the intention of majority of people in their country to vaccinate, would increase their willingness to vaccinate themselves (H1). It is evident in Figure 1 that the nudge did not affect people's intention whether to vaccinate or not (|t| = 0.051, p-value = 0.9592). Given the already high intention to vaccinate in the control group, this might not come as a surprise. Therefore, we find no support for H1. In Supplementary Figure S1-1, we present the distribution of choices. As a robustness check, we have performed the same analysis on the restricted sample – excluding those who failed the attention check. Also, in that sample, we find no differences between the experimental groups. For the results, see Supplementary Figure S1-2.
Willingness to vaccinate oneself against COVID-19. Note: Box plots convey information about the medians (thick horizontal line), interquartile range (distance between thinner horizontal lines), minimum and maximum or outlying observations (not present in this analysis). Solid dots denote point estimates of the mean for each of experimental groups along with 95% confidence intervals displayed as whiskers around point estimates. Grey dots display jittered individual observations. ns denotes ‘not significant’ differences, at any conventional level up to 0.1, across indicated experimental groups.
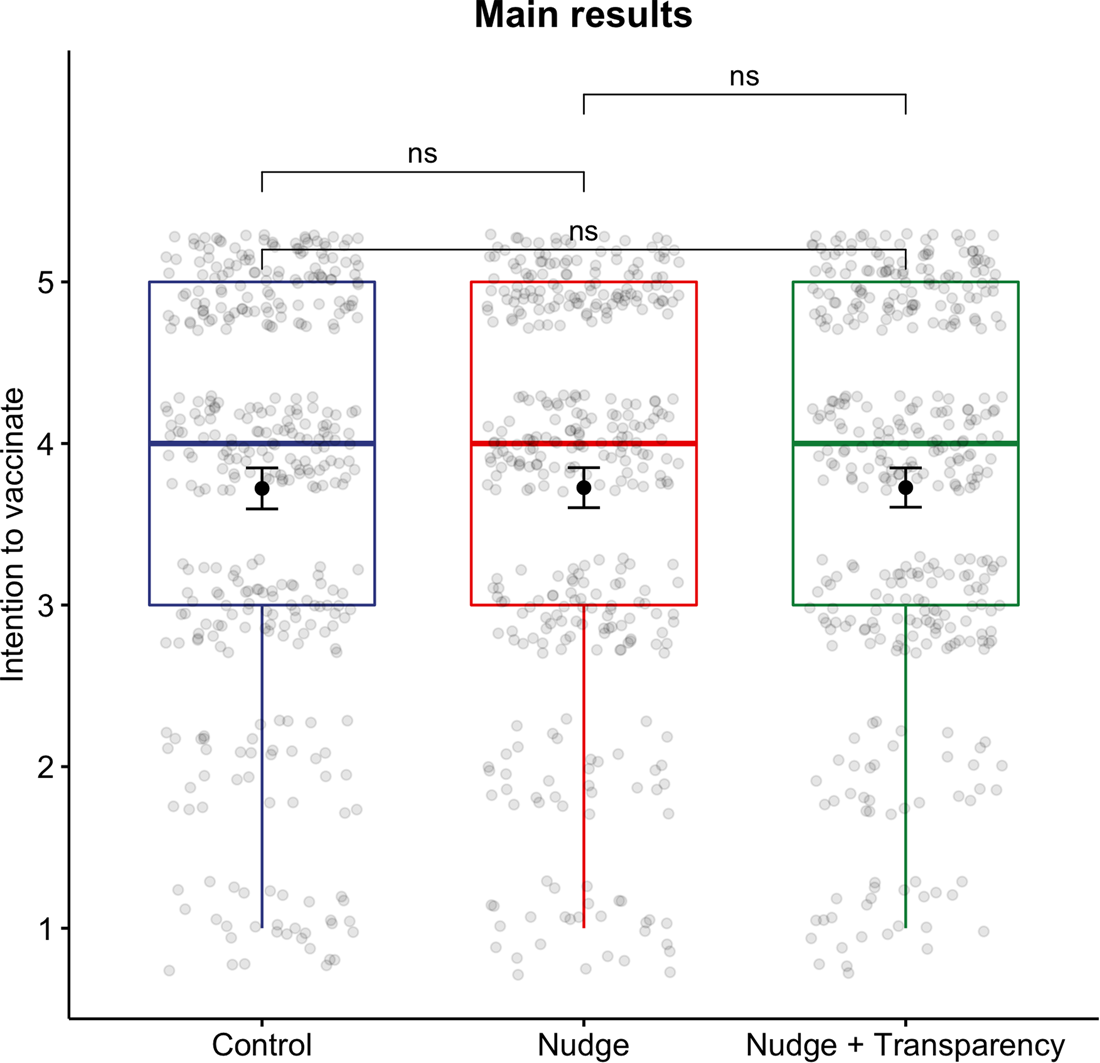
Besides the effectiveness of the nudge, we were also interested in examining whether using nudges in a transparent way has an impact on its effectiveness (H2). Making the nudge transparent has the potential to increase its legitimacy. But it also has the risk of backfiring – in the sense of triggering in people resistance against the nudge. As explained in the theory section, we hypothesized that a transparent nudge would lead to increased reported intention to vaccinate as compared to the control group but decreased as compared to the nudge without additional information. As it is clear from Figure 1, we find evidence for neither the difference between the nudge and the nudge + transparency groups (|t| = 0.008, p-value = 0.993), nor for the difference between the control and the nudge + transparency groups (|t| = 0.060, p-value = 0.952). The nudge itself did not change reported intentions, but also the transparent nudge did not affect people's choices. These results hold for a battery of alternative models, including Mann–Whitney–Wilcoxon and Fisher's Exact tests (Supplementary Table S1-2) as well as multiple OLS regressions and cumulative link models (Supplementary Table S1-3) suitable for tackling ordinal outcome variables. Lastly, following procedures for equivalence testing devised by Lakens et al. (Reference Lakens, Scheel and Isager2018), we show that our null results indicate no treatment effects as we can reject the presence of small effect sizes of interest (d = 0.25, the pre-registered standardized effect size; see Supplementary Figures S1-3 to S1-5).
Additional results with respect to conditional treatment effects are presented in Supplementary Figure S1-6. Broadly speaking, even though different groups often vary in their intentions to vaccinate, we do not find that subgroups in the sample respond differently to the treatments.
To have a better understanding of people's unwillingness to vaccinate, we also asked participants who indicated they do not intend to vaccinate (1 or 2 on the Likert scale of the main outcome variable) for their reasons for this choice. Figure 2 presents the results. The numbers indicate how many times each reason was chosen (since participants had the option to choose more than one reason). It is clear that the most prominent reason for people not to want to vaccinate is the concern about side effects. However, scepticism in the effectiveness of the vaccine, as well as a more general negative approach against vaccines, were not negligible among this group. On the other hand, free riding (choosing not to vaccinate because a large number of people already have such an intention) seems to be marginal, thus suggesting that there is no backfiring effect of the nudge.
Reasons for unwillingness to vaccinate (Israeli sample).
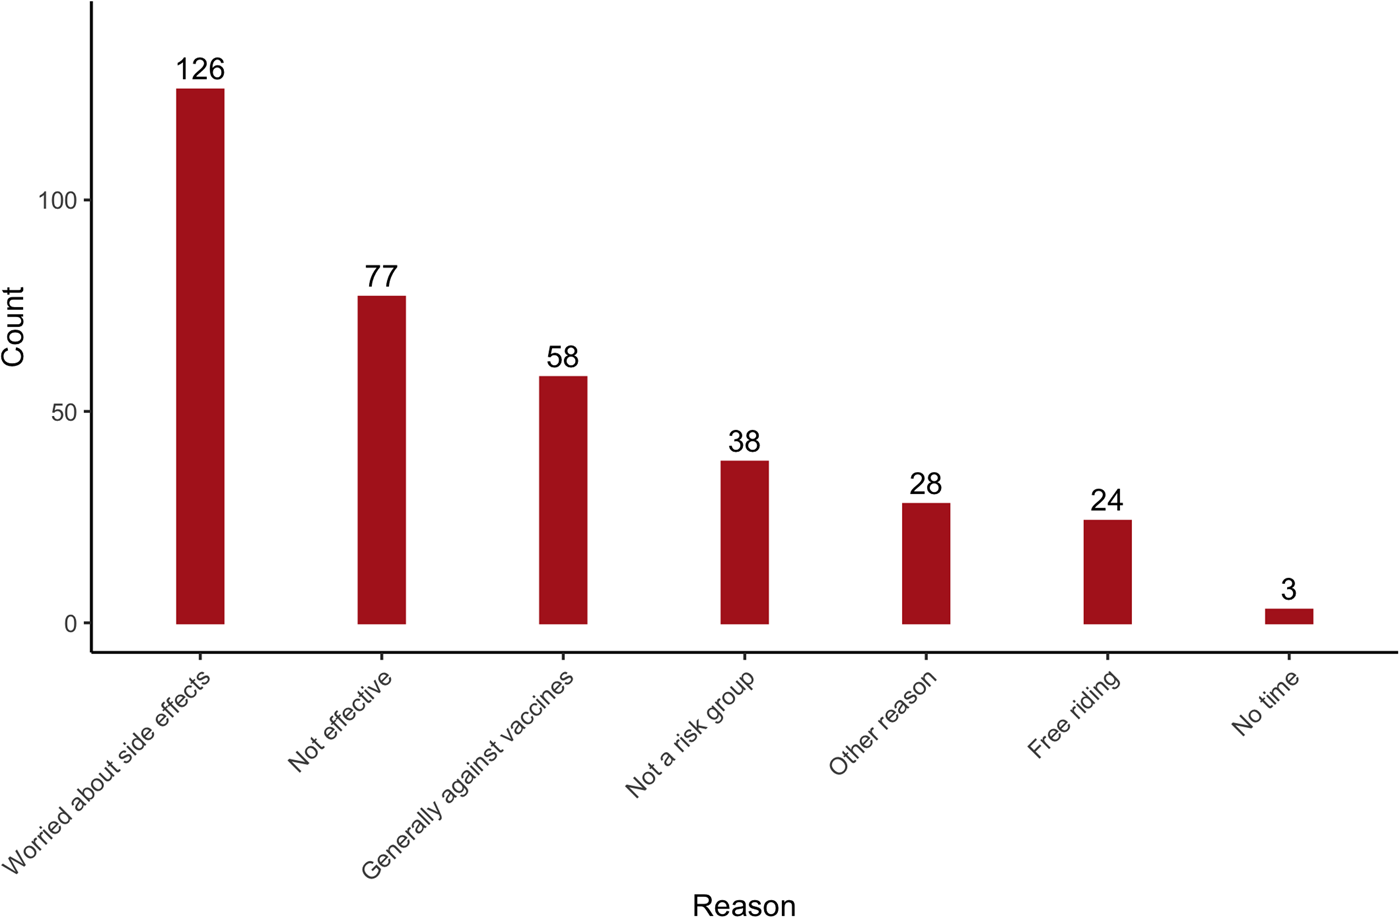
Participants also received an option to indicate additional reasons in an open text. This gave us some indication of potential drivers which we have not covered in the proposed options. In the open questions, the most common reasons were a belief that the vaccine is a cover up to insert a tracking chip; having been already infected with corona; distrust in a vaccine which is approved in such a short period; and a feeling that the civil population in Israel is treated as guinea pigs.Footnote 14
Study 2: saliency
Theoretical framework and predictions
Making certain information more salient is also a powerful instrument to affect people's behaviour. Especially when it concerns vivid and harmful events: people tend to make errors in their estimation and reaction to probabilities. Therefore, interventions which would emphasize the suffering of the people dying from COVID-19, or the symptoms of the disease, might increase people's willingness to vaccinate against this virus. The reasons behind its expected effect are: the risk-as-feeling hypothesis (Loewenstein et al., Reference Loewenstein, Weber, Hsee and Welch2001) and the availability heuristic (Tversky & Kahneman, Reference Tversky and Kahneman1974). In particular, it has been found that when people are facing affective description of risks, they become less sensitive to the probabilities and more responsive to the outcome. The reasons being that under such circumstances they imagine the situation in a dichotomous way (occurring or not) rather than in a probabilistic manner (Loewenstein & Elster, Reference Loewenstein, Elster, George and Jon1992: 227; Loewenstein et al., Reference Loewenstein, Weber, Hsee and Welch2001; Rottenstreich & Hsee, Reference Rottenstreich and Hsee2001; Sunstein, Reference Sunstein2003). Therefore, the vivid description of how people die from COVID-19 is expected to enhance the willingness to vaccinate against COVID-19. Similarly, the presentation of symptoms will make this aspect more vivid, and might make people focus more on the negative outcome of the disease rather than on its relatively low probability. Given people's concerns regarding the potential side effects of the vaccine, focusing the attention on the negative outcomes of COVID-19 is important to balance out those concerns. In these interventions, the fear appeal might be perceived as strong, and the offered response (vaccines) has the potential to be perceived as highly effective, unless people's reason not to vaccinate is the belief that those vaccines are ineffective rather than being concerned about the side effects.
We put forward two hypotheses with respect to our main effects. Following the theoretical underpinnings and the empirical evidence of the affect heuristic or the effects of salient negative outcomes, we predict that:
Exposing participants to a vivid description of how people die from COVID-19, or the symptoms people experience when getting sick as a result of COVID-19, will increase their willingness to vaccinate against COVID-19 (H3).
Similar to Study 1, and for comparable reasons, we also put forward hypotheses with respect to people's intentions to vaccinate when presented with a transparent saliency nudge (revealing the goal of the nudge and the reasons to rely on it in terms of expected effectiveness). Also, in this case, people might feel their freedom of decision is being limited by presenting to them specific information to exert influence on their behaviour. In particular, we predict that:
Exposing participants to a vivid description of how people die from COVID-19, or the symptoms people experience when getting sick as a result of COVID-19, and disclosing to them the reason and the goal behind this information will reduce the willingness to declare such intention as compared to a nudge without transparency, but increase the willingness as compared to no information (H4).
As for study 1, we also investigate a set of moderating effects to check whether the effectiveness of nudges differs per subgroups of population. These moderating effects are performed for the following groups: female vs male; conspiracy theory believers vs non-believers; people who perceive the risk of infection as high vs those who perceive it low and conservatives vs liberals.
Experimental design and procedure
The experiment
To examine the effectiveness of the saliency nudge, we have conducted an experiment with two different types of saliency. Similarly to Study 1, our outcome variable was people's level of agreement with a statement regarding vaccination intention – ‘When a vaccine against COVID-19 is offered in my country, I will get vaccinated’ (5 = strongly agree; 4 = agree; 3 = neither agree or disagree; 2 = disagree; 1 = strongly disagree)’. Also as in Study 1, to better understand people's unwillingness to vaccinate, those who indicated they disagreed with the statement, were asked for their reason(s). For the materials of the experiment, see Supplementary Material, Study 2 – ‘The text of the full study’. Tables 2 and 3 present the experimental treatments in the experiment (death saliency nudge and COVID-19 related symptoms saliency nudge, respectively).
Death description saliency nudge.
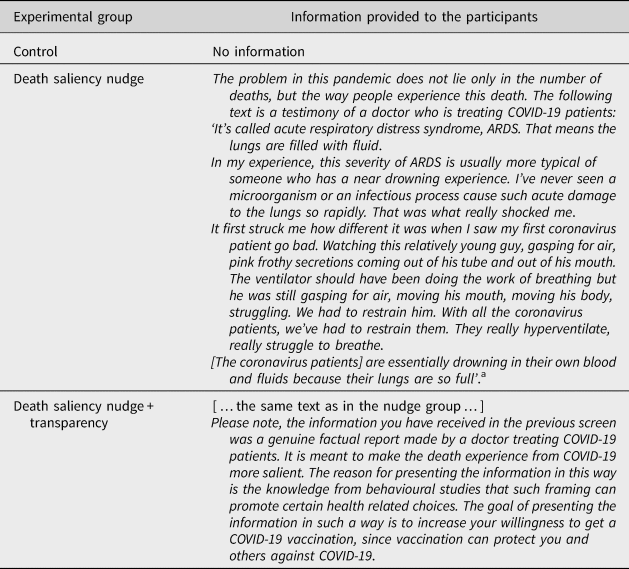
a The text was extracted from https://www.propublica.org/article/a-medical-worker-describes--terrifying-lung-failure-from-covid19-even-in-his-young-patients (accessed April 2022).
Symptoms saliency nudge.
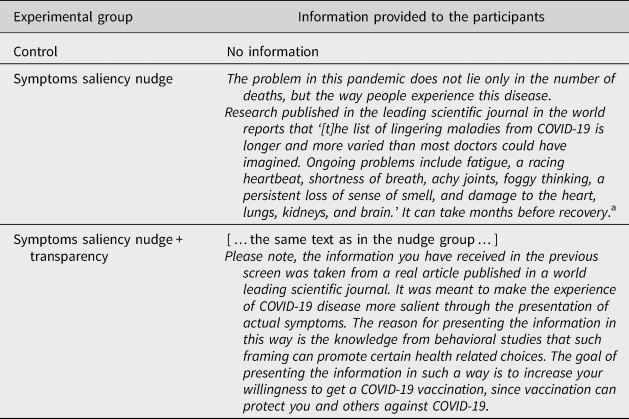
a Jennifer Couzin-Frankel, Science, Jul. 31, 2020.
To control for people's attention to the experimental intervention, we have included a manipulation check for the treatment groups. This question asked the participants to indicate the source of the description in the death description nudge (the options being between a testimony of a patient, a doctor and relatives) and the subject of the text in the symptoms description nudge (the options being infection rates, symptoms and vaccinations). Nonetheless, following guidelines by Aronow et al. (Reference Aronow, Baron and Pinson2019), our primary analysis is performed on the full sample. It is important especially since the control group did not receive any manipulation check. However, as a robustness check we also report the results for the sample where only the participants who passed the manipulation check are included. All participants also received an attention check question and could take part in the experiment only if they passed it. Therefore, the study guaranteed a high quality of responses.
Procedure
The study was conducted on a representative sample of the UK population on gender and age during the period 8–16 January 2021. Participants were recruited using the survey firm Dynata. Similarly to Study 1, the participants first answered questions related to the additional analyses (e.g., political ideology, risk perception, etc.). The phrasing of those questions was identical in both studies. Next, the participants took part in the experiment, where they were randomly assigned to the different experimental groups. Finally, all participants answered demographic questions. Full text and information about the experiment can be found in Supplementary Material, ‘Study 2 – The text of the full study’. Based on a power analysis, we needed N = 1012 participants to detect a small size effect (d = 0.25) in the interaction model. Our combined sample is N = 1308.Footnote 15 The study was pre-registeredFootnote 16 and approved by the Erasmus School of Law Research Ethics Review Committee (no. 20-08).
Results
The results of the experiment are presented together for both nudges. The combined sample for the analysis was N = 1308.Footnote 17 The median age category is 39–48 years of age, 51.4% of respondents self-identify themselves as females. The experimental groups are balanced, and details can be found in Supplementary Table S2-1.
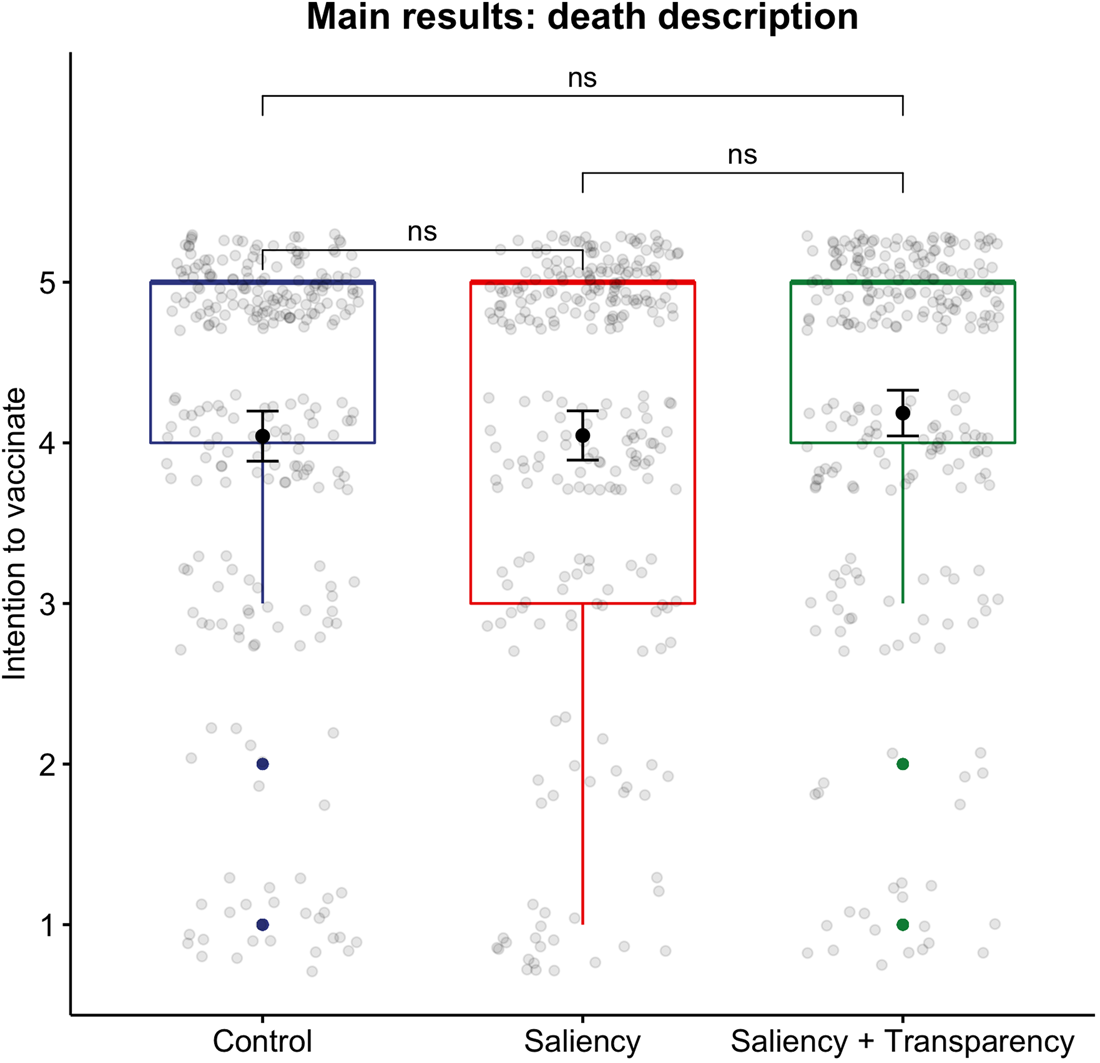
As in Study 1, we first examine the main effects of the implemented saliency nudges. For the entire analysis presented here, we rely on t-tests. We see in Figure 3, that the average intention score for the control group was just a bit above 4, and that score did not change for the saliency death description nudge (|t| = 0.037, p-value = 0.970). Therefore, we find no support for H3 with respect to the first nudge. The same is true when the saliency nudge is made transparent in a meaningful way. The average intention is not different from the control group (|t| = 1.338, p-value = 0.182) nor from the nudge group (|t| = 1.312, p-value = 0.190). Therefore, we also do not find support for H4 with respect to the death saliency nudge. For the distribution of choices, see Supplementary Figure S2-1.
Death saliency nudge. Note: Box plots convey information about the medians (thick horizontal line), interquartile range (distance between upper and lower horizontal lines of boxes), minimum and maximum or outlying observations (defined as an observation which is more than 1.5*interquartile range above the third or below the first quartile). Solid dots denote point estimates of the mean for each of experimental groups along with 95% confidence intervals displayed as whiskers around point estimates. Grey dots display jittered individual observations. ns denotes ‘not significant’ differences, at any conventional level up to 0.1, across indicated experimental groups.
As a robustness check, we have also performed the analysis on a restricted sample of participants who passed the manipulation check. In this sample, participants with a transparent nudge had a higher intention score than the control group (4.10 vs. 4.26, respectively). This difference was statistically significant (5%). However, the size of the effect is economically insignificant. The results can be found in Supplementary Figure S2-2 (Study 2). Furthermore, these results hold for a set of alternative models and specifications, including Mann–Whitney–Wilcoxon and Fisher's Exact (Supplementary Table S2-2) tests as well as multiple OLS regressions and cumulative link models (Supplementary Table S2-3) suitable for tackling ordinal outcome variable. Lastly, we demonstrate that our null results indicate no meaningful treatment effect of the nudge as we can reject the presence of small effect sizes of interest (d = 0.25, the pre-registered standardized effect size). Yet, we cannot reject these small effect sizes for the comparisons with transparency treatment (see Supplementary Figures S2-3 to S2-5).
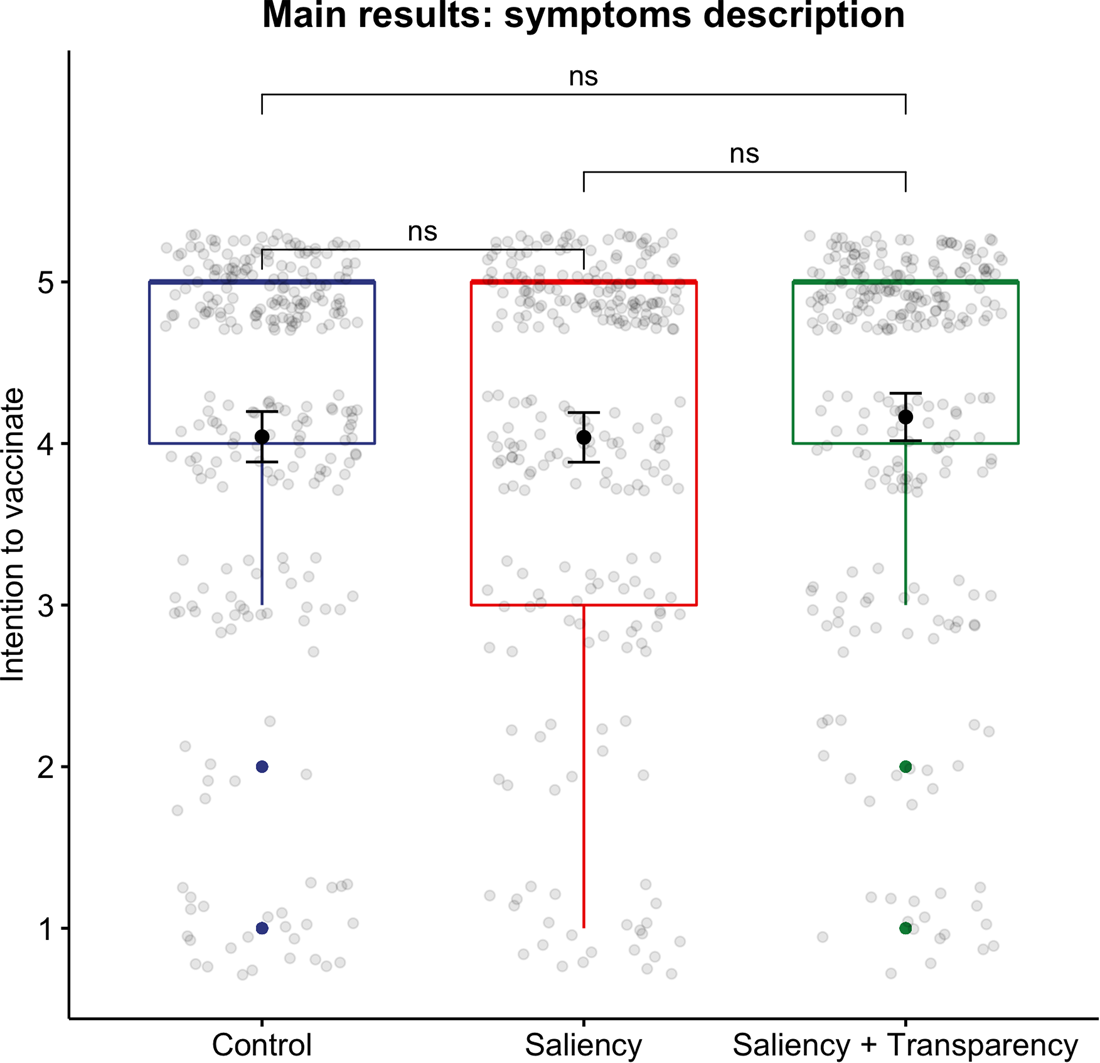
The same analysis was performed for the saliency nudge focused on the symptoms of COVID-19. A similar average intention score was found among the control group and the participants who were nudged. As clear from Figure 4, the nudge did not change people's intentions (|t| = 0.034, p-value = 0.973). Also, the transparent nudge did not affect people's choices (|t| = 1.124, p-value = 0.261 for comparison for the control group and |t| = 1.169, p-value = 0.243 for comparison with the saliency group without transparency). Therefore, also with respect to the symptoms saliency nudge, we did not find support for H3 and H4. As a robustness check, we have performed the same analysis for the restricted sample (passed manipulation check). The results did not change for that sample, and no statistically significant differences were found between the groups. See Supplementary Figure S2-6 (Study 2). The additional analyses, i.e., Mann–Whitney–Wilcoxon and Fisher's Exact tests as well as multiple OLS regressions and cumulative link models, are displayed in Supplementary Tables S2-4 and S2-5, respectively). They all indicate the null results of treatments. Finally, the equivalence test suggests that we can credibly reject small effect sizes (d = 0.25) for the comparison between the control group and the saliency treatment, but not for the comparisons with the saliency treatment combined with transparency (see Supplementary Figures S2-7 to S2-9).
Symptoms salience nudge. Note: Box plots convey information about the medians (thick horizontal line), interquartile range (distance between upper and lower horizontal lines of boxes), minimum and maximum or outlying observations (defined as an observation which is more than 1.5*interquartile range above the third or below the first quartile). Solid dots denote point estimates of the mean for each of experimental groups along with 95% confidence intervals displayed as whiskers around point estimates. Grey dots display jittered individual observations. ns denotes ‘not significant’ differences, at any conventional level up to 0.1, across indicated experimental groups.
Additional results with respect to moderating effects of gender, belief in conspiracy theories, risk perception and political views, are presented in the combined Supplementary Figure S2-10. Broadly speaking, and similarly to the pattern we have identified in Study 1, even though different groups often vary in their intentions to vaccinate, we do not find that subgroups in the sample respond differently to the treatments.
As in Study 1, we were interested to understand better the reasons of participants from the UK not to be willing to vaccinate. Therefore, we asked participants who indicated they do not intend to vaccinate (1 or 2 on the Likert scale of the main outcome variable) for their reasons for this choice. From Figure 5, we see that the most dominant reasons not to vaccinate are the same as for the Israeli sample – concerns with respect to side effects, and doubt in the effectiveness of the vaccine.
Reasons for unwillingness to vaccinate (UK sample).
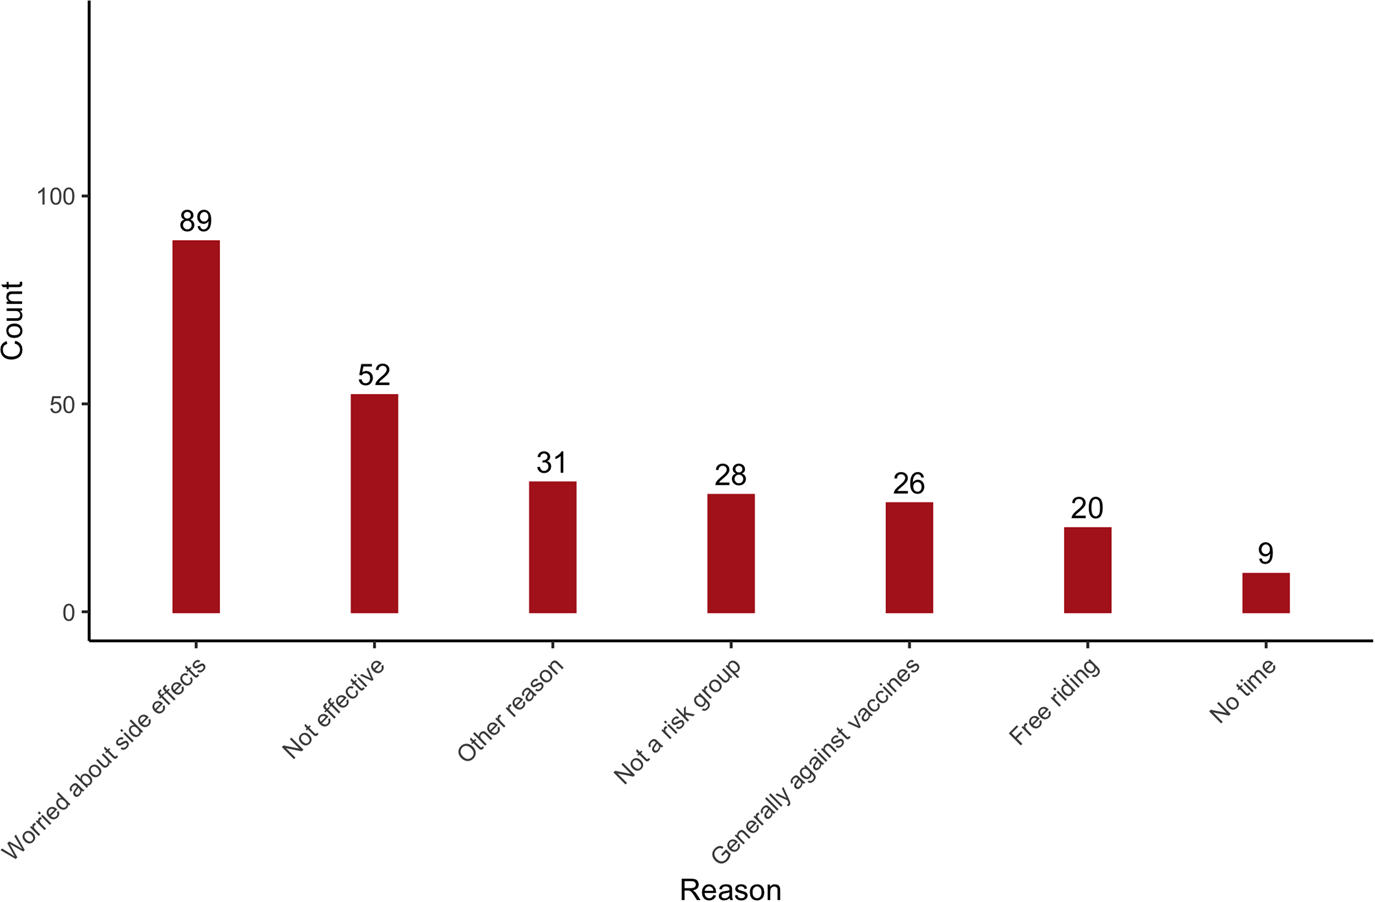
We have also provided participants with an opportunity to give their own reasons not to vaccinate which were not offered by us. The most prominent reason was the lack of trust in a vaccine which is developed and approved so quickly.
Discussion and conclusion
In this article, we aimed to examine a number of soft interventions to increase people's intention to vaccinate. Vaccination is currently considered the main solution to the global pandemic and vaccinating the majority of the population is a key public policy goal. At least in democratic countries, governments do not wish to force people to vaccinate, respecting their freedoms and rights over their bodies. Therefore, other methods to encourage vaccination are necessary. Nudging is one popular method, which has been used in many countries around the world for different public policies (e.g., increasing tax compliance, organ donation, savings). Therefore, it has been also discussed and considered in the context of vaccination against COVID-19.
We have experimentally examined three nudges, in two countries, which at the initial period of vaccination availability appeared to be leading in rates of vaccination. Those countries are also similar in terms of their public being generally supportive of different nudges (Reisch & Sunstein, Reference Reisch and Sunstein2016; Pe'er et al., Reference Pe'er, Feldman, Gamliel, Sahar, Tikotsky, Hod and Schupak2019). General support of nudges was also found in many other countries (e.g., Jung & Mellers, Reference Jung and Mellers2016; Sunstein et al., Reference Sunstein, Reisch and Rauber2018, Reference Sunstein, Reisch and Kaiser2019), thus constituting an instrument that has a potential to direct people's behaviour across different countries. First, we examined the effectiveness of a descriptive social norm on a representative sample of the Israeli (Jewish)Footnote 18 population. In particular, we have utilized findings from psychology indicating that people follow the behaviour of others, in order to encourage vaccination intentions. Overall, the average intention of people to vaccinate was high, which is a promising result. However, the nudge itself did not make a difference. Also, a more ‘legitimate’ nudge which was transparent about its method and goal did not change people's choices.
We have also run an experiment to examine two additional nudges on a representative sample of the population in the UK. This experiment used the saliency nudge, utilizing findings from psychology that making certain factors more salient might affect how people treat probabilities, and in turn, which choices they make. The experiments made either the death experience very vivid and alarming or stressed the symptoms of COVID-19. Also, in the UK already in the baseline people had high intentions to vaccinate on average. The saliency nudges had very limited effect to none at all. In particular, when considering the full sample, none of the nudges changed the choices. Looking at the restricted sample (those participants who passed the manipulation check) showed a very small effect of the transparent death saliency nudge. Even though statistically significant, the small effect does not seem to be promising. In addition, we have examined the choices of different subgroups in the two countries but found no differences in the effectiveness of the nudge.
Our studies were well powered as we have based our sample sizes on a power analysis. Therefore, the null results are unlikely to be the result of lack of statistical power. One explanation might be that nudges are effective when people do not have strong preferences either way. In that case, it is not costly to follow a certain nudge. Some studies suggested that the inability of the nudge to change the behaviour of some people might be derived from a stronger preference of those people against the direction of the nudge (Bronchetti et al., Reference Bronchetti, Dee, Huffman and Magenheim2013; Beshears et al., Reference Beshears, Choi, Laibson, Madrian and Milkman2015; Jachimowicz et al., Reference Jachimowicz, Duncan, Weber and Johnson2019). For example, Bronchetti et al. (Reference Bronchetti, Dee, Huffman and Magenheim2013) raised the possibility that people with lower income are more resistant to default nudges that direct them to allocate money for savings because they already have plans how to use this money.
The context of the new vaccination is sensitive. On the one hand, there is an ongoing (threatening) pandemic with many uncertainties in respect of its long-term effects. On the other hand, the developed vaccine (which at the time of the study was not approved yet) is novel and entails many uncertainties with respect to the long-term effects. People are either more afraid of the former, or more of the latter. Therefore, it is difficult to affect their choices with nudges that target their intuitive system of decision making, instead of the deliberative process of decision making. In other words, it might be necessary to first address people's concerns, before having an effect on their behaviour. Our results seem to support the recently expressed opinion of one of the ‘founders’ of the concept of nudges himself, that nudges might not be a sufficient instrument to enhance vaccination to end the current pandemic,Footnote 19 even though there is evidence that at least using reminders and simplifying the process of vaccination has a positive effect (Dai et al., Reference Dai, Saccardo, Han, Roh, Raja, Vangala, Modi, Pandya, Sloyan and Croymans2021).
Our results demonstrate that many people are willing to vaccinate. But there is also a smaller group which is hesitant. From our investigation of the reasons for this hesitation, it seems that the primary reason is the concern about the side effects. Even at the stage of our experiments it was clear that once the vaccine will be available, there will not be sufficient evidence of their long-term effects. This is due to the urgency in approving this vaccine and saving the world from the pandemic. Therefore, this concern is understandable.
Consequently, to encourage vaccination, governments should invest more in understanding people's concerns and trying to address them. For example, by investing in campaigns where people receive more information on the trade-offs between the uncertain long-term effects of the vaccine, and the uncertain (probably worse) long-term effects of contracting COVID-19. Relying solely on soft interventions such as nudges seems not to be sufficient.
One limitation of this study is that we focus on people's intentions rather than vaccination uptake, thus potentially facing the problem of intention-behaviour gap (Sheeran, Reference Sheeran2002). In the specific context of vaccinations for example, several studies have found that even when people intend to vaccinate, they do not always follow through (e.g., Bronchetti et al., Reference Bronchetti, Dee, Huffman and Magenheim2013; Chang et al., Reference Chang, Jacobson, Shah, Pramanik and Shah2021). Nevertheless, there are many studies demonstrating that an intention to vaccinate is generally a strong predictor of an actual uptake of vaccines (daCosta DiBonaventura & Chapman, Reference daCosta DiBonaventura and Chapman2005; Lehmann et al., Reference Lehmann, Ruiter, Chapman and Kok2014; Fall et al., Reference Fall, Izaute and Chakroun-Baggioni2018; Jensen et al., Reference Jensen, Ayers and Koskan2022). In the specific context of this article, at the time of the study we have found that 63.6% of the Israeli participants and 75.3% of the UK participants (control groups), respectively, either ‘strongly agreed’ or ‘agreed’ that they would vaccinate themselves against COVID-19. Looking at the most recent data to date of vaccination uptake we see that nearly 77 persons per 100 population have taken the first dose and around 69 per 100 are fully vaccinated in Israel. In the UK, almost 78 persons per 100 population have taken the first dose, and nearly 73 in 100 are fully vaccinated.Footnote 20 Therefore, the baseline intentions in our studies (which were expressed before the vaccine became available) seem to be overall aligned with the actual rate of vaccination as reported by WHO for the beginning of the year 2022.
Furthermore, even though we do not have a way to directly translate our results from intentions to behaviour, our findings seem to be conservative in this respect. From the studies of the intention-behaviour gap, it seems that the gap is mostly driven by people who intend to act but eventually fail to do so (Sheeran, Reference Sheeran2002).Footnote 21 Therefore, it is reasonable to expect that if the investigated nudges in this article did not change people's intention, it probably would not change people's behaviour.
A related potential concern is that currently there is more knowledge about the effectiveness of the vaccine and its short-term safety.Footnote 22 The fact that uncertainty regarding those two factors were the main reasons for some of our subjects not to intend to vaccinate, might suggest our results would change at this stage. However, the level of uncertainty was similar for all participants in our studies. And yet many indicated an intention to vaccinate. Those who were hesitant or reluctant did not seem on average to change their minds in response to the employed nudges. Whereas the new information may have on itself encouraged people to vaccinate, there is no immediate reason to believe it would influence the level of effectiveness of the nudge. For example, in Israel, even after the vaccines against COVID-19 were made available, and evidence of its efficacy and short-term safety had emerged, the two main concerns of the people who were still hesitant about vaccination remained its effectiveness and safety (e.g., Heller et al., Reference Heller, Chun, Shlomo, Gewirtz-Meydan, Acri, Kulkarni and Grinstein-Weiss2022). Also in the UK, the long-term safety was still a major concern for people who were choosing not to vaccinate themselves (Majeed et al., Reference Majeed, Papaluca and Molokhia2021). However, Majeed et al. (Reference Majeed, Papaluca and Molokhia2021) stated that the emerging data on the benefits of the vaccine also reduce vaccine hesitancy. Therefore, it might be reasonable to assume, that those who are still hesitating at this stage, more than a year after vaccines were introduced and with the current reliable information on the effectiveness and short-term safety of vaccines, are those who hold stronger preference against vaccinating. Consequently, our results might again be viewed as conservative, and suggest that other strategies, which are addressing the persisting concerns are needed, rather than simply using ‘system 1’ nudges to enhance vaccination.
Data availability statement
The data that support the findings of this study are available from the corresponding author upon request.
Financial support
We are grateful for the funding support from the EUR Fellowship, Erasmus University Rotterdam. The funding authority played no role in the design, execution, analysis and interpretation of data or writing of the article.
Competing interests
The authors declare none.
Supplementary material
To view supplementary material for this article, please visit https://doi.org/10.1017/bpp.2022.20.


 Open access