
The history of commercial fishing in the twentieth century is not generally taken to be a happy one. Narratives inevitably centre around general decline punctuated with severe and sudden collapse. Scarcity of resources have also brought about social and economic hardship familiar to many coastal communities reliant to any extent on fishing. The 1992 closure of the Newfoundland cod fishery is perhaps the best-known and most graphic example of economic crisis and disrupted ways of life owing to fisheries collapse. Not only of local economic importance, the collapse of wild fish stocks have frequently functioned as a metaphor and leading indicator for human overexploitation of natural resources, and the inability of modern society to find a sustainable equilibrium with nature. Furthermore, the image of the independent, self-sufficient fisherman and his loss, not only of an occupation but also of a traditional way of life surrendered to the forces of modernity has been a potent source of wistful, memory and nostalgia.Footnote 1
The notion of a fisheries ‘collapse’ is, however, of relatively recent vintage. In one of the premier journals of international fisheries science, the International Council for the Exploration of the Sea (ICES)’s Journal du Conseil International pour l’Exploration de la Mer (since renamed the ICES Journal of Marine Science), the term only entered regular usage in the 1970s (Figure 1). In no way was this because declining yields of fish was a new phenomenon.Footnote 2 In any fishery the world over, fluctuations in yearly yields were and are endemic. However widespread and frequent, fluctuations and declining yields only occasionally and, for the most part, only in the decades following the Second World War turned into ‘collapses’. Even after the concept gained wide currency in both scientific and popular analysis, its meaning and usage remained notably flexible. It was frequently unclear when a decrease in fishing yields or observed fish populations was just part of a ‘normal’ fluctuating pattern, or a more serious occurrence that might create unusual hardship in fishing communities and industry, perhaps requiring state response. Indeed, the definition of collapse in scientific publications was recognized to be a matter of interpretation. In a 1984 glossary of technical terms compiled by the fisheries biologist J. G. Cooke, the entry read:
COLLAPSE – Reduction of a fish stock by fishing or other causes to levels at which the production is only a negligible proportion of its former levels. The word is normally used when the process is sudden compared with the likely time scale of recovery, if any, but is sometimes used melodramatically for any case of overfishing.Footnote 3
Yearly number of articles in ICES flagship journal containing the word ‘collapse’. Source: tabulated from the Journal du Conseil International pour l’Exploration de la Mer and its successor, the ICES Journal of Marine Science.

Collapse has thus been as much an argument about the conduct of fishing as a description of observed population dynamics of fish stocks. It does not come ready-made; it must be identified and distinguished from ‘normal’ fluctuations, labelled, and given meaning.
The concept of ‘collapse’, to say nothing of ‘crisis’, is not limited to fishing, of course, and has figured as a contentious category of historical analysis, so some reflexivity is in order. In his bestseller boldly entitled Collapse, Jared Diamond sought to show over numerous historical case studies that environmental degradation was often the main cause, or at least catalyst, for the collapse of societies and civilizations.Footnote 4 In response, an interdisciplinary group of historians, anthropologists, archaeologists, and others argued strongly against Diamond’s use of the term ‘collapse’. Among other things, they noted that, if one takes collapse to entail ‘the complete end of those political systems and their accompanying civilizational framework’, societies never actually collapse, but instead exhibit persistence and adaptability. Footnote 5 Diamond’s use of the term, in fact, approximates that in fisheries, wherein a collapse by no means entails the end of a species, but instead the significant contraction to a ‘negligible proportion of its former levels’. Given that Diamond was trained as a biologist, this is perhaps not surprising. Thus, while this article does not directly engage in this debate, it provides some background to it.
‘Crisis’ as a category of analysis has been subject of more extensive research. Reinhart Koselleck has warned that its widespread use ‘to describe vaguely disturbing moods or situations’ might be itself the ‘symptom of a historical crisis that cannot as yet be fully gauged’, making it ‘all the more important for scholars to weigh the concept carefully before adopting it in their own terminology’.Footnote 6 In fisheries the word has been widely used to mark situations in which the continued functioning of a system of some sort was uncertain, be it a socioeconomic system threatened by mass unemployment in the fishing sector, or a biological system of fish population dynamics. It was as much a descriptor as it was an argument and call to action.Footnote 7 Use of both ‘collapse’ and ‘crisis’ are subsequently limited to these actors’ categories.
This article analyses three instances of collapse in the post-war world: the Far East Asian Kamchatka salmon in the late 1950s, the north Atlantic Atlanto-Scandian herring of the late 1960s, and the Peruvian anchoveta of the early 1970s. It asks how each instance came to be understood as a collapse, and investigates the similarities and differences in how the notion was conceptualized and interpreted in widely differing contexts and institutional settings. This analysis is by no means comprehensive of fisheries collapses and crises in the post-war period. Nor are these cases chronologically prior to all other instances; this is not an origins story. Instead, it is representative of a variety of geographical and ideological settings, as well as politico-economic institutional configurations. The comparison shows how material and physical evidence such as yields of fish was interpreted in vastly different ways in these different places. The type of events that they became was contingent and dependent on local factors and contexts.
The analysis builds on the idea of ‘eventful history’, based largely on the work of William Sewell, who has forcefully argued that ‘symbolic interpretation is part and parcel of the historical event’.Footnote 8 Events are under-determined and can be read semiotically, as Sewell showed in his masterful reading of the storming of the Bastille and the ‘revolution’ that ensued. The events of 14 July 1789 in Paris acquired a certain type of meaning only in the days that followed and might well have been interpreted differently.Footnote 9 This run contrary to Fernand Braudel, who famously downplayed events as the ‘crests of foam that the tides of history carry on their strong backs’.Footnote 10 Instead, Sewell posited that events are both determined by and determinate of deeper historical structures.Footnote 11 Sewell’s theorization of the event forms the basis for the method employed in this article, which investigates the dynamic relationship between structures, both local and global, and the interpretation of the events that came to be understood as collapse. Notions of collapse, nominally similar events that appear easily comparable, differed in various parts of the political and natural world, and this had consequences, pace Sewell, for deeper structures, both semantic and politico-economic, in which the events were embedded.
At the same time, there were also broad commonalities in how collapses were experienced the world over. To capture both similarity and difference, I employ an analytical framework similar to what Charles Tilly has called an encompassing comparison. With this approach the historically minded scholar aims to find both multiplicity and unity in a comparison by first identifying a system for analysis, and then selecting various locations in the system and analysing them with respect to their place in that framework.Footnote 12 If Tilly’s encompassing comparison begins with the system within which locations are identified and analysed, a more historical method might begin with historical cases or instances roughly representative of a larger whole.Footnote 13 The analyst could then compare and contrast between these individual cases with interest in what this elucidates about the cases themselves, but also with attention to questions of whether and how actions and interactions of actors between the discrete cases under study created the larger structures or systems that Tilly was interested in. Thus, the framework that connects the cases is not taken as an a priori, but as a historical product to be explained by the comparison itself. The larger ‘global’ phenomenon, be it a structure, network, trend, or event, emerges from the local comparison of actions of people or groups of people on the ground, created but under-determined by its comparative, component parts. This method, which we might call ‘emergent encompassing comparison’, forms the methodological approach and narrative structure of this article.
The following analysis is organized around the three semantic frameworks within which collapse in these cases was understood and articulated: as scientific failure, socioeconomic crisis, and geopolitical argument. The frames were not exclusive; individual collapses were sometimes interpreted in more than one framework. These three interpretive frames are generalizable to fisheries worldwide, but not necessarily exhaustive. Organization by interpretive framework gives greater analytic power and narrative clarity than isolated case studies. The broad similarities revealed in this comparative analysis of individual cases show how fish stocks and the responsibility to administer their exploitation increasingly came to be associated with and claimed by individual states. Fishery collapses were understood as state failures, thus becoming events critical in the remaking of management regimes. Finally, collapse did not remain a local concept. The last section of the article shows that, by the 1970s, scientists, policy-makers, and observers projected the notion on a planetary scale denoting the future possibility of depletion and collapse as a global phenomenon and worldwide interconnected threat. What was originally a local occurrence was reconceived as a possible, and feared, global event.
Collapse as scientific failure
The fact that a fishery could collapse even while under supervision of the most up-to-date technocratic and scientifically informed management was a major blow to scientific establishments, which would later provoke a reaction against top-down, expert-led resource administration based exclusively on abstract mathematical calculation. Collapse, in these cases, was a crisis of scientific modelling with major implications for how managers would conceive of risk, crisis, and uncertainty.
In Norway, fisheries science, itself a foundational and highly influential piece of the Norwegian scientific establishment as a whole, had been closely allied with fishers and the fishing industry ever since its genesis in the mid nineteenth century.Footnote 14 The Institute of Marine Research in Bergen, the main fisheries science research organization in the country, was led in the 1960s by the well-known herring researcher Finn Devold, who was recognized by fishers as an expert in locating and mapping herring shoals and their migration paths. He was close to, and extremely popular with, fishers.Footnote 15 Until well into the 1960s Devold rejected the notion that human fishing had a significant impact on herring populations, stating in 1964 that ‘exploitation of herring stocks will not have a major impact on the population [of fish]. The fishery regulates itself.’Footnote 16
In April 1969, with a sharp decline in herring yields plain to see and in need of explaining, the Working Group on Atlanto-Scandian Herring, under the auspices of the International Council for the Exploration of the Sea (ICES), the international organization that coordinated research and formulated scientific advice on fisheries management, met in Denmark. Devold, who had chaired the previous meeting several years earlier, was not in attendance. Norway was instead represented by a younger fisheries scientist, Olav Dragesund. The working group concluded that there was plenty of evidence that fishing effort had risen significantly over the 1960s at the same time as recruitment rates had fallen dramatically. It was possible that the two phenomena were connected.Footnote 17 In the end, the scientists of the working group suggested that a further increase in fishing ‘should probably be avoided and even some reduction of fishing might be considered’. The caution amid uncertainty speaks for itself. A later meeting of the working group in 1971 firmed up many of these statements and emphasized that declining yields had continued. The herring population was in a ‘critical state’. The group still hedged, but seemed more confident in writing that ‘it would be admirable to keep exploitation rates of fat- and small-herring at a much lower level than in recent years’.Footnote 18 By 1972, Dragesund and his colleague from the Institute of Marine Research Øyvind Ulltang gave a paper at an ICES meeting stating that the depressed state of the herring persisted and constituted a ‘collapse’ of the fishery. The consensus was still that fishing alone could not have been the sole cause.Footnote 19
Not only had low yields in the fishery become a collapse by 1972 but, from this period on, Norwegian scientists and representatives began referring to the fishery as the ‘Norwegian spring-spawning herring’ (norsk vårgytende sild), rather than the ‘Atlanto-Scandian herring’ (atlanto-skandisk sild) as previously. The distinction between the populations was not new. The Norwegian spring-spawners had long been recognized as the most important part of a larger Atlanto-Scandian herring stock, which was also made up of Icelandic summer-spawners and Icelandic spring-spawners. As per the name, the local populations spawned separately in the coastal regions of Norway and Iceland respectively, but spent much of the year in common feeding grounds. While the summer-spawners had noticeably different morphological and physiological traits, the spring-spawners from Iceland and Norway were more similar.Footnote 20 After 1972, Norwegian scientists writing in English referred to the Norwegian spring-spawners separately. This group had collapsed, not the Atlanto-Scandian herring. Nevertheless, the ICES Working Group on the Atlanto-Scandian Herring retained its title until the 1990s, and reports in Norwegian frequently continued to refer to atlanto-skandisk sild where English references would have been to norsk vårgytende sild. This was, no doubt, the result of tensions and a need for precision with respect to greatly changed population dynamics, but it was also a bid to claim authority over the stock. Furthermore, it described a new reality. With populations much reduced, the coastal feeding grounds produced enough food to sustain the entire population, causing a change in migration patterns. The herring now stayed in inland fjords and nearby coastal waters within Norway’s three-mile territorial sea, and no longer mixed with Icelandic-spawning herring on distant feeding grounds.Footnote 21 The collapse made the herring Norwegian, both nominally and physically.
It was not until the late 1970s that researchers concluded that the collapse had been caused by overfishing alone. In an appendix to the 1977 Outlook on resources (Ressursoversikt) published in Norwegian yearly by the Institute for Marine Research, two Institute scientists presented, for the first time in this publication, a detailed argument that the collapse could only have been caused by human fishing. The stock had been overfished (utfisket, literally ‘fished-out’). This was especially the case for juvenile fat and small herring which had been overexploited (overbeskattet) at rates as high as 90%. Older explanations of natural causes for the fall in fish yields were simply not borne out by the data, which showed strong recruitment in 1963, 1964, and 1966. This was particularly visible due to the total prohibition on fishing in 1972, when recruitment had been reliably high, around 50%, for several years. Thus, the conclusion had to be that fishing was responsible for the disappearance.
With consensus having coalesced around the view that a collapse had occurred in the Norwegian spring-spawning herring largely or exclusively as the result of human activity, views were trained on the failure not only of the fishery, but also of science and state-sponsored scientific management.Footnote 22 As Gunnar Sætersdal, then head of the Institute of Marine Science, stated in a 1987 retrospective, ‘it seems a fair judgment to claim that the system failed in its main objective of safe-guarding the resources and ensuring sound development of their use’.Footnote 23 While he also highlighted the fundamentally uncontrollable aspects of fisheries and natural ecosystems, he noted that science tended to lag behind fishing capabilities and that some of the scientific advice given in the 1960s now appeared to be distinctly wrong. Not only did science have to catch up, but new ways of thinking about pelagic fisheries came to Norwegian fisheries science as a generational change at the Institute of Marine Science in the wake of the collapse. If previous generations of scientists such as Devold had been fundamentally on the side of the fishers, a new generation of researchers came to leadership at the Institute with protection of fish as their ultimate priority. Norwegian fisheries science and state administrative policy, as has been argued by Vera Schwach at length, went ‘from hunting dog to guard dog’ (fra jakthund til vakthund).Footnote 24
The Peruvian anchoveta was also under the watchful eye of state-of-the-art fisheries science and, in fact, was under some of the same eyes as the Norwegian spring-spawning herring had been. Marine science in Peru had begun under the national Compañía Administradora de Guano in the first half of the twentieth century, as the study of marine life for the purposes of guano production. Thus, in 1954, the Consejo de Investigaciones Hidrobiológicas was formed by government ministries and a consortium of industrial fishing enterprises, known as the Sociedad Nacional de Pesquería, as a move by the commercial fishing industry to advance their interests against those of guano producers.Footnote 25 In 1960, the Instituto de Investigación de los Recursos Marineros was jointly launched by the Peruvian government and a special fund of the United Nations. The UN Food and Agriculture Organization (FAO) administered the organization and partially staffed it with foreign scientists, as well as local scientific and general personnel until 1964, when the Peruvian government assumed responsibility and renamed it the Instituto del Mar del Perú (IMARPE).Footnote 26 Throughout the 1960s and 1970s, growing capacity and confidence in local Peruvian scientists was coupled with the presence of foreign scientists either based in Peru or making frequent visits to study the fishery, frequently through the auspices of the FAO. Studies and management recommendations of foreign biologists frequently appeared in IMARPE publications in English original and Spanish translation. The process was typified by the meetings of the ‘Council of Experts’ of the late 1960s and early 1970s, in which North American and European experts flew to Peru to lead and take part in meetings reviewing data and making recommendations on anchoveta administration.
One of the foreign scientists was the American biologist Milner Schaefer, who had worked on the famous collapse of the California sardine, also a pelagic fishery, in the 1940s and 1950s, and later headed the Inter-American Tropical Tuna Commission from San Diego, where he was involved in modelling and administration of pelagic bait fisheries for the tuna industry. In 1967, IMARPE published Schaefer’s ‘Dynamics of the fishery for anchoveta’, in which he estimated a maximum sustainable yield for the Peruvian littoral of roughly 7.7 million tons. Beyond all the assumptions made in collecting and standardizing the data, a laborious and contentious process, he assumed that all the historical data points in his linear regression model were equilibrium points and, thus, that fishing levels in all previous years were sustainable. Schaefer further observed that the guano birds consumed an estimated 2.5 million tons of anchoveta yearly, so that the total yield to be split between humans and birds was roughly 10 million tons per year.Footnote 27 The balance between bird and human yield, he noted, had been subject to some controversy, which he suggested could be solved only through ‘objective cost–benefits analysis’ pitting the value of guano versus that of fishmeal and fish oil.Footnote 28 The maximum sustainable yield was an average of total catches and environmental factors, and Schaefer readily admitted that it required a ‘certain degree of flexibility’.Footnote 29 Nevertheless, the quotas enacted by the Peruvian government followed Schaefer’s recommendation, being fixed at 10 million tons per year until the onset of the crisis. Schaefer returned to Peru in 1970, updated his data, and experimented with other models but did not seriously reconsider his recommended limits.Footnote 30
Trouble quickly arose. In early 1973, Peruvian scientists wrote in an IMARPE informe that the previous year ‘can be considered very abnormal for the anchoveta fishery’.Footnote 31 As recounted by the document, the first two months of 1972 had been a closed season, during which only experimental fishing was conducted. The first signs of an El Niño event became visible by March. Fishing began that month but yields soon decreased, leading to the fishing fleet travelling further and further south in search of anchoveta shoals that were thought to have migrated to cooler waters. By May, 73% of fishing boats were returning to port without any catch.Footnote 32
In July, with concern growing, the third session of the Council of Experts convened at IMARPE in Callao, the port city contiguous with Lima. The panel, made up of some twenty representatives of Peruvian and foreign scientific organizations, the Ministry of Fisheries and Peruvian fisheries interests, was more than two-thirds Peruvian. It was chaired, however, by the Canadian fisheries scientists William Ricker. The panel noted the poor yields and extremely worrying data on recruits and recommended that a veda (closed season) be declared immediately for an indefinite period of time. Following the meeting the situation went from bad to worse. The fishery was opened for short periods of time in certain places only to be quickly closed again. In some places few anchoveta were caught, but instead sardine showed up in nets.Footnote 33
In April 1973, the fourth session of the Council of Experts gathered to survey the fishery. Not only did the group conclude that it had collapsed, but they noted that the situation coincided in ‘many, and in some cases in all, of the elements associated with the decline and complete disappearance of formerly great fisheries’, including the Atlanto-Scandian herring, Hokkaido herring, Japanese sardine, California sardine, and North Sea herring. This, then, was a collapse that verged on total extinction of the commercial fishery, and was the latest act in a series of occurrences repeated the world over.Footnote 34 On the basis of virtual population analysis, the panel suggested an ‘allowable catch’ of 2 million tons for the upcoming fishing year. On this issue disagreement arose between the Council of Experts and its IMARPE hosts. IMARPE scientists, in an informe released in March 1973, before the meeting of the Council of Experts, noted that the method of maximum sustainable yield was only applicable during normal environmental conditions and normal recruitment. IMARPE had conducted intensive weekly investigations to study the fishery. On the basis of these extensive data-collecting operations and comparison with previous years, Peruvian scientists had come to the conclusion that 4 million tons could be caught in the upcoming fishing season, a recommended limit double that suggested by the Council of Experts.Footnote 35 Neither IMARPE nor the Council referred to the other, though the trade journal Pesca noted the discrepancy under the headline: ‘How much anchoveta can be fished in 1973/4? The Experts: 2 million. IMARPE: Up to 4 million.’Footnote 36
How could a fishery under the careful watch of cutting-edge science go so badly wrong? While the weakness of Peruvian institutions and ability to enforce the quota has been noted, total fishing yields are now thought to have exceeded the official limits by several million tons in the early 1970s, and the Peruvian anchoveta collapse remains a serious example of the failure of scientific management. In 1984, J. A. Gulland of the FAO, formerly one of the ‘experts’ in Peru, called the failure of fisheries management in the Peruvian anchoveta fishery ‘spectacular’. The single-species models that were used in Peru, and which dominated fisheries science in the three post-war decades, simply could not predict collapses such as the anchoveta, because an accurate model of the anchoveta fishery would have had to incorporate the El Niño/Southern Oscillation. Thus, the kind of information that a model in this situation could provide ‘is that collapses and other signs of instability (e.g. abrupt changes in species composition) can take place, not that they will take place, or when they will take place, if they occur’.Footnote 37
Sætersdal, another anchoveta veteran, recalled well over a decade after the fact that, while human activity could and should be controlled, environmental factors could not be. Thus communication of risk and rapid policy response was the best that scientific management could do.Footnote 38 Sætersdal and the other ‘experts’, chastened by such clear failure, would continue to rework and refine not only their models but the ways in which they interpreted the models and made policy recommendations based on them. How to measure, reduce, and manage risk given the non-linear relationships governing population dynamics would become major topics of debate in scientific and policy discussions of the following decades. Not only had fisheries collapsed, but so too had post-war biological models. This was failure of scientific management at the national and, more importantly, international level.
Collapse as socioeconomic failure
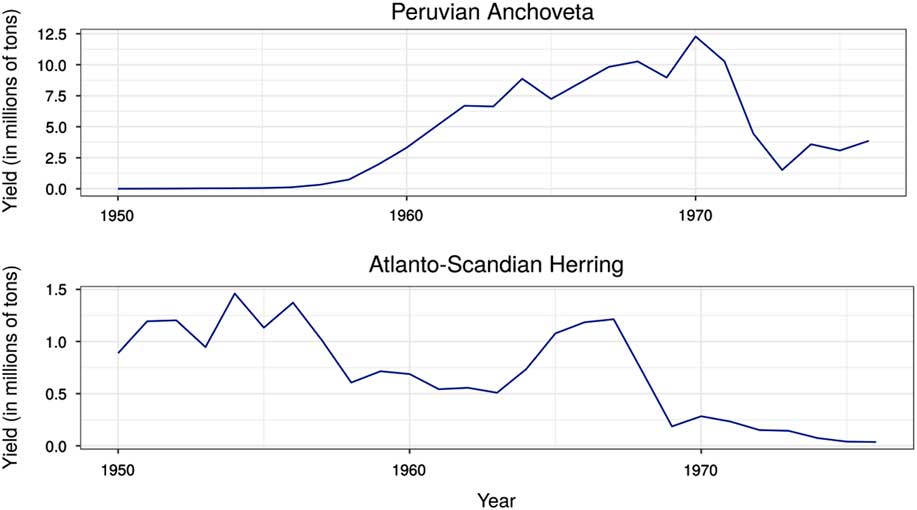
The Peruvian anchoveta and Atlanto-Scandian herring are both pelagic fisheries, where industrial production was mainly geared to the reduction of raw material into fishmeal and fish oil. These products, intended for livestock rather than human consumption, were sold globally; thus these two fisheries were directly connected and competed with each other on global commodities markets. Indeed, while the scales of the collapses differed, on paper the abrupt decline in yields look somewhat similar (see Figure 2). However, varying local politico-economic contexts and environmental conditions led to vastly different social and economic experiences of collapse.
Comparative collapses of the Peruvian anchoveta and the Atlanto-Scandian herring. Note, however, the difference in scale. Source: FAO Fishery Statistical Collections, Global Production Statistics, available at http://www.fao.org/fishery/statistics/global-production/en (consulted 14 June 2018). For reconstructed yield data that include estimates of unreported yields, see the Sea Around Us project, http://www.seaaroundus.org/data/#/eez (consulted 14 June 2018). Fishing yield data for these and all other charts, unless otherwise noted, are from the FAO database.
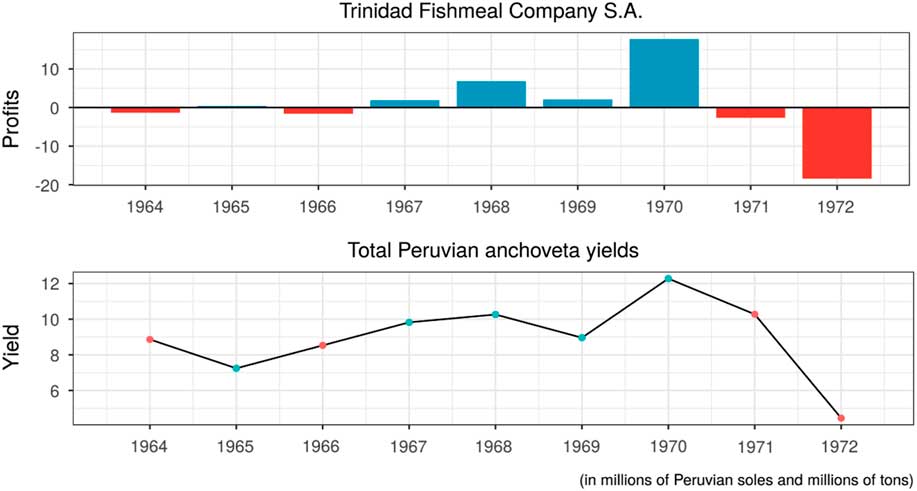
From its rise in the 1950s through its brief history up to 1973, the Peruvian fishing industry was in a state of almost constant crisis of one form or another. The sector’s rise was nothing short of fantastic, transforming from almost nothing in 1950 (1,000 tons) to the most productive fishery in the world in the late 1960s (more than 13 million tons by 1970 if estimates of unreported catches are included).Footnote 39 The boom and bust, as so often, were intimately connected, as officials and observers of the fishery throughout the 1960s were well aware. Potential fishers were lured to the coast by the chance of huge profits and enabled by low start-up costs and easily available credit. Thus, by the early 1960s it was already clear to many that the industry had far too much capacity to be profitable for all. Figure 3 gives one example of the fluctuating nature of profits and losses. A common estimate was that the industry was 50% over capacity.Footnote 40 A yearly fishing limit set by IMARPE and instituted in the mid 1960s made the situation worse. Given that the quota was aggregate, each fishing boat had an incentive to fish as intensively as possible before the fishery was closed upon reaching the cumulative limit. This was commonly referred to as ‘derby’ or ‘Olympic’ fishing.Footnote 41 By 1970, estimates suggested that the fleet and land-based factories possessed the capacity to catch and process 10 million tons of anchoveta (the yearly quota at the time) in just 100 days.Footnote 42 In 1972 the season was closed after only fifty-eight days of fishing.Footnote 43 This, in turn, meant that the industry was chronically in debt. Characterized by Pesca as ‘A fishery afloat in a sea of debt’, the phenomenon was as well known as it seemed intractable.Footnote 44
Comparison of profits for one private Peruvian fishmeal enterprise and total Peruvian anchoveta yields. Source: Archivo de la Nación, Archivo Intermedio, Lima, Peru, ‘Archivo: Pesca Perú’, ‘Organo: historico’, caja 34, file 1, pp. 156, 164, 168, 172, 176, 180, 188, 192. Figures for 1964–1970 are for the fiscal year ending on 30 June, and for 1971 and 1972 relate to the calendar year.
The sector had grown so quickly that by the 1960s it was both a large source of employment and a key contribution to Peru’s balance of trade in a country that had always depended on exports for internal financing. In 1970, roughly one-third of the country’s foreign export earnings came from fish products. Almost all of this was in the form of fishmeal and fish oil produced from anchoveta. For comparison, in 1945 the figure had been less than 1% and derived from canned fish for human consumption.Footnote 45 The decline in fishmeal and fish-oil earnings, from either lower prices on foreign commodity markets or decreased production, put serious pressure on the country’s current account and hindered capacity for local capital accumulation for investment projects. As many commentators on fishmeal in particular, and Peruvian economic and political history more broadly, have noted, the country had come to significantly depend on the income and foreign exchange generated by fishmeal export. Decreased catch put the country’s economic development plans under serious threat.Footnote 46
In 1968 General Juan Velasco seized power in a bloodless military coup, heralded by its leaders as the ‘Peruvian Revolution’. The generals were deeply influenced by Latin American structuralism and, particularly, by dependency theory.Footnote 47 The military government sought to walk a Cold War tightrope of ‘neither capitalist nor communist’ development by introducing a structuralist economic model in which capital would be retained inside the country, as opposed to being dedicated to foreign exports, and freed from the inertia of the local oligarchy.Footnote 48 Nationalization of oil as well as land reform to break the local oligarchy were among the first actions of the government. The generals did not initially seem to plan on widespread nationalization of export sectors such as mining and, even more so, fishing. The Peruvian fishing industry had traditionally been in the hands of local Peruvian non-elites, many of whom were first- or second-generation immigrants from southern Europe, symbolized by Banchero, the son of Italian immigrants.Footnote 49 At the same time, however, some observers complained, very much in line with dependency theory, of the growing predominance of foreign capital in the industry.Footnote 50
In 1973, after months of closed seasons, seriously depressed fishing yields, and social unrest, the government announced the nationalization of the fishmeal and fish-oil industry and the creation of a state-owned company, Pesca Perú, to absorb expropriated property and take over production. The preamble to the nationalization decree established the grounds for the action. They included the fact that
the anchoveta is a natural and contingent (aleatorio) resource that belongs to the entire Peruvian people … the poor structure of the fishmeal and fish-oil industry combined with the cyclical absence of the anchoveta has created a constant financial disequilibrium which the state, out of social necessity, has found itself obliged to provide loans for and, due to the worsening of this equilibrium, [these] have become difficult to collect on, thus significantly affecting the national economy.Footnote 51
Ecological, economic, and social uncertainty, combined with a development theory doubting the capacity of the private sector to organize itself, gave the state cause to take full control of the fishery as a national resource, belonging to all Peruvians.
In contrast, a collapse that might have looked similar on paper was experienced quite differently in Norway. There the politico-economic structures of the welfare state that had been erected over the course of the twentieth century dampened the shock, while expansion to other previously little-exploited fisheries allowed parts of the industry to almost seamlessly move on to other stocks. Thus, Norway is remarkable to the extent that there was little socioeconomic crisis attached to what scientifically was a major event. The Norwegian case is illustrative of how decreased yields, even when acknowledged by fisheries science to be a collapse, might be socioeconomically experienced and remembered in widely varying ways.
The Norwegian fishing industry was caught between two models of development in the 1950s.Footnote 52 The rural development model was pursued by politically powerful fishing communities seeking state support to retain traditional rural lifestyles and settlement patterns, while Labour Party technocrats and rationalizers looked to industrial infrastructure development as a means to increase productivity and move excess labour in fishing to other more productive sectors of the economy.Footnote 53 In 1964, the opposition between the two came to a head when the Main Agreement (Hovedavtalen) for fishing was signed between the state and the Norwegian Fishermen’s Union (Norges Fiskarlag). While the agreement was an attempt to increase financing, build up infrastructure, and improve efficiency in the fishing industry, it effectively became an income guarantee for fishers and, thus, a shock absorber of natural and economic fluctuations. The state-owned Fishers’ Bank (Statens Fiskarbank) provided retail banking, mortgages for houses, and loans for fishing equipment, while state subsidies for landing of fish, all combined with a minimum weekly wage guarantee, had the effect, according to many, of turning fishers into state pensioners.Footnote 54
In April 1967, amid what would be the highest yield in herring for Norwegian fishers in over a decade, the sales organization for fat herring (Feitsildfiskernes Salgslag) addressed the Bank of Norway regarding loans to the fishmeal and fish-oil industry. ‘We want to underline the serious economic crisis the herring fishery stands before if the necessary capital is not provided to the industry’, wrote the representatives.Footnote 55 Total catches per boat and prices for finished products were lower than in previous years. But the biggest problem was that factories had so much raw material on their hands, and inventory piling up in their warehouses, that they owed some 32 million kroner to the fishers, from whom they were required to buy raw product at mandated price levels.Footnote 56 The letter stated that fishers, if remaining unpaid, might stop fishing, which would cripple not just the fishers themselves and the herring industry, but also the ‘country as a whole’. The letter was written in support of the request from the Norwegian Fishmeal and Fish-oil Producers’ Association for state loans, and was also accompanied by a letter of support from the Norwegian Herring Sales Organization (Noregs Sildesalgslag). All argued that the crisis threatened the country ‘as a whole’.Footnote 57 This crisis, just a year or two before the collapse, was a crisis of abundance.
Two years later the situation had changed, and again applications flooded the state for assistance. In the yearly negotiated agreement between the state and Norges Fiskarlag, the sides had, in addition to usual subsidies, agreed to ‘extraordinary financing’ for both fishers and producers to provide credits for equipment and cash flow needed in the wake of weak herring catches in 1968.Footnote 58 However, there was significant pushback from state representatives on how the loans would be awarded and, most importantly, on what they were to be used for. In meetings between the Ministry of Fisheries, the Bank of Norway, and the producers, the last urged the sector to be seen as an interconnected whole (fishers → producers → exporters) rather than separate units. Weakness in one link could bring down the whole edifice. This raised the question of how stability and economic security would be attained through state-guaranteed loans. Producers sought credits that could be used to pay down debts, while representatives of the Bank of Norway, which would be expected to administer and back the loans, noted that such financing would be especially risky, and that the state would have to plan to take losses on them. The bank preferred loans that could only be used for paying for raw materials to mandated sales organizations, and thus only wanted to fund servicing for debts owed to fishers.Footnote 59 Furthermore, an October letter from the Bank of Norway to the Ministry of Fisheries argued strongly against the ministry’s position that credit had been too tight. In fact, the Bank wrote, ‘if “credit difficulties” should be the criteria for receiving a loan, it must be recognized that on this point policy has perhaps become rather too liberal’. The bank instead found the ‘credit difficulties’ of firms to be ‘somewhat exaggerated’ in regard to the failure of the fishing industry. Nonetheless, the bank continued, it had up to this point proceeded on the understanding that ‘it had been reasonable to give a bit on this as a sign of goodwill toward the herring industry in its current situation’.Footnote 60 Thus, while the decline in yields was recognized, the idea that it represented a crisis was clearly not shared by all.
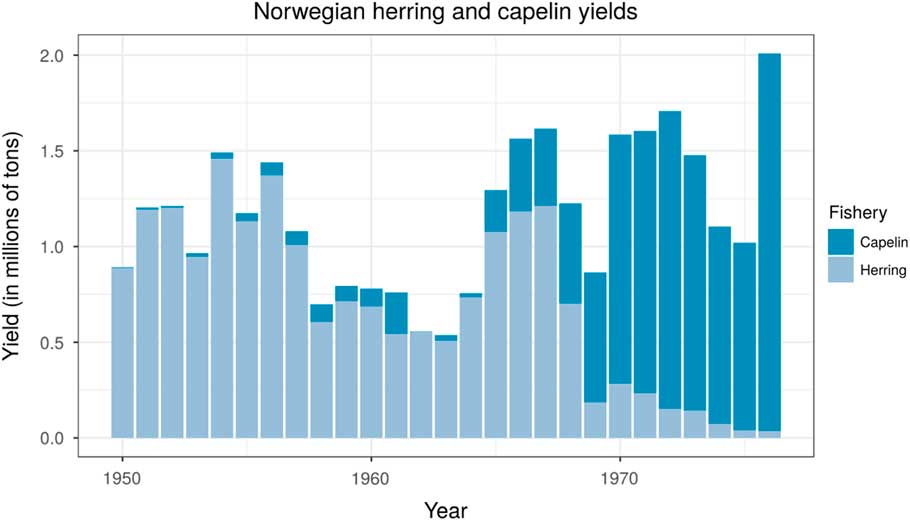
Indeed, it is surprising just how scant a trace of the 1968 herring crash can now be found in the archives of the Norwegian Ministry of Fisheries. As suggested, this was, in no small part, due to state guarantees for fishers, and subsidies and other measures for producers. That was, however, only part of the story. Much more significant for the producers and exporters was the fact that when herring no longer showed up on fishers’ sonar and in fishing nets it was simply replaced by another pelagic species: capelin (lodde). Capelin, like herring, was a pelagic species and could likewise be used as raw material for production of fishmeal and fish oil. Fishing for capelin had started during the downturn in herring yields of the mid 1960s as a replacement for herring. With the second downturn in the late 1960s, fishers were able to switch almost seamlessly, as illustrated in Figure 4.Footnote 61 For many fishmeal factories, called ‘herring meal factories’ in Norwegian, the shift from the mid 1960s of processing herring to processing almost exclusively capelin by 1969 was nearly imperceptible from the outside. By 1970 several fishmeal and fish-oil factories in north Norway had approached the Bank of Norway for an extraordinary loan because they had too much raw material.Footnote 62
The switch from herring to capelin in Norway. Source: Norwegian Statistical Bureau, http://www.ssb.no/a/histstat/statbank-histu.html.
Collapse as geopolitical argument
Finally, the concept of collapse could also be seen as an element of a zero-sum game of international relations, wherein it functioned as a geopolitical argument vis-à-vis other fishing countries. The spectre of despoliation could be mobilized in service to geopolitical arguments and goals. Indeed, the notion of quotas to control fishing arose initially in international contexts, and fisheries science was frequently a tool of hard-headed realist geopolitics. Guarding and preserving fish stocks implied protecting and preserving the territorial integrity of the state, while also raising the sensitive question of where the state’s sovereignty ended. Regulation of fisheries has not simply come about in a world of nation-states, but has been fundamentally moulded by the national organization of world order, with significant consequences for the subsequent institutions and practices of regulation. Nowhere was this more evident than in the Far East in the early days of the Cold War.
In 1952, the USSR Council of Ministers issued a decree ordering the federal Academy of Sciences and the Ministry of Fisheries to conduct joint research to better understand the causes of fluctuating salmon yields in the Soviet Far East. Representatives of these two organs in 1954 found primarily climatic factors and Soviet fishing and forestry (owing to timber floats in salmon spawning grounds) responsible for variations and declines. Just two years later, however, the focus of Soviet opprobrium for poor salmon yields had shifted dramatically from the Soviet timber industry to ‘predatory’ Japanese fishing. Following the San Francisco Peace Treaty and their subsequent exclusion from North American salmon fisheries, Japanese fishers had looked increasingly to Soviet waters, where Japanese fishing had a long history.Footnote 63 The return of Japanese fishing vessels to the waters off Kamchatka, home to the large majority of Far Eastern salmon, was viewed by Soviet fisheries officials with extreme trepidation.Footnote 64 This was a difficult period in Soviet–Japanese relations in general, particularly because of the issue of the Kuril Islands, which the Japanese government considered, and still considers, Japanese territory.Footnote 65
The Soviet fisheries inspectorate reported dutifully on Japanese fishing and became increasingly alarmist. In 1955, Glavkamchatrybprom, the fishing corporation comprising the entire Kamchatka fishing industry aside from collectivized fishing units, organized a commercial ‘surveillance’ (promyslovaia razvedka) expedition to report on Japanese fishing presence in the area. Commercial surveillance was a frequent activity of fishing industries around the world, organized with the intent of determining size and identifying locations of fish stocks. Here, however, it was Japanese fishers that were surveilled rather than fish. The report issued by the surveillance expedition detailed the scale of Japanese fishing presence off the Kamchatka coast, together with ominous, unsourced quotations of Japanese fishers and government officials stating that Japan had a ‘priority in the area due to their historical rights’.Footnote 66 The Soviet expedition concluded that Japanese fishing, expected to be even bigger in 1956, ‘could lead to the total exhaustion of stocks of salmon in Kamchatka’.Footnote 67 In similar terms, a report of the Kamchatka fisheries inspectorate, Kamchatrybvod, added that Japanese fishing had developed quickly in recent years and had already begun to have ‘material effects’ on the state of fish stocks.Footnote 68
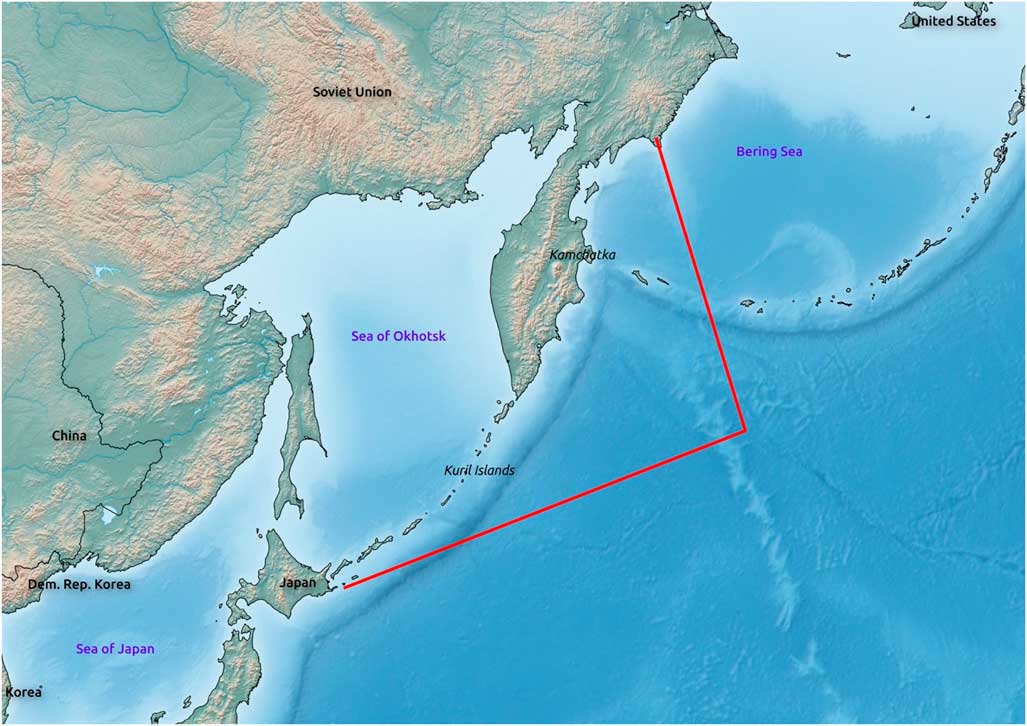
In February 1956, as peace talks were ongoing between Soviet and Japanese diplomats in London, the Soviet government announced in a front-page article in Pravda that it had tasked its fisheries organs to draw up regulations to stop ‘predatory fishing’ for salmon in the Far East. Soviet authorities, the article stated, ‘could only view the current situation as a threat to the economy of neighbouring Soviet regions and the result of unwillingness of certain Japanese fishing industrialists to consider the economic interests of the USSR’.Footnote 69 It announced that measures were so acutely needed that they would be taken without the conclusion of an international agreement on conservation of resources, and thus unilaterally. Even this threat could not force a resolution, and talks dissolved for good on 20 March. The next day the Soviet state published, again on the front page of Pravda, the hitherto secret February order of the USSR Council of Ministers. This unilaterally regulated the salmon fishery out to what has since been called the ‘Bulganin Line’ (Figure 5), extending hundreds of miles into the Pacific Ocean off the coast of Kamchatka, and limited Japanese fishing vessels to a fraction of their previous catch. The power play succeeded in bringing Japan back to the negotiating table. The two sides subsequently reached a separate fisheries agreement and partial renewal of ties without full diplomatic normalization. The result was the Soviet–Japanese Fisheries Convention of the Northwest Pacific Ocean, which established a framework within which Soviet and Japanese negotiators were to gather yearly to make regulations to conserve the salmon of the Far East on a ‘scientific basis’.Footnote 70 The convention was signed in Moscow on 14 May. The next day, the salmon fishing season opened in the Far East.
The Bulganin Line.
The sessions were rancorous and sometimes barely civil.Footnote 71 With the two sides now squaring off against each other yearly, and for months on end, Soviet vocabulary to describe the falling yields quickly became more pointed. What in Soviet documents had previously been described generally as ‘exhaustion’ or ‘decreasing stocks’ was now widely characterized as a ‘collapse’. The Russian word used here (podryv) is difficult to translate exactly. It is literally best rendered as ‘undermining’, while ‘detriment’ and even ‘blowing up’ are possibilities, given the right context. Morphologically it comes from the verb rvat’ (‘to tear’) with the prefix pod- indicating that the action takes place underneath something. Thus, a podryv is a noun derived from the transitive verb (podryvat’/podorvat’). More than the English ‘collapse’, from an intransitive verb, podryv implies an agent. The idea of podryv was very much in line with the Bolshevik mindset of wreckers and spies in their midst, capitalist encirclement, and ubiquitous suspicion of treasonous conspiracy undermining the communist experiment.Footnote 72
While the word was used in isolated instances prior to 1956, it became nearly ubiquitous in documents about the Far Eastern salmon fishery thereafter to describe what had happened: an ‘undercutting’ of the salmon stocks had taken place, or the salmon stock had been podorvan, the past participle, thus begging the logical question podorvan kem? (undercut by whom?). The answer was never far to find. Thus, in a resolution written ostensibly by Soviet workers in the Far Eastern salmon fishery, and approved by the Ministry of Fisheries and the Foreign Ministry, to appeal to Japanese official and public opinion, the workers noted that, despite the great effort they put into conserving the salmon runs, Japanese cooperation was needed. ‘We ask you, comrade Minister, to take effective measures to limit the catch of salmon on the high seas … we ask you to not forget the interests of collective fishers of the Far East and establish a minimal quota for high seas salmon yields, in order to not undermine (podorvat’) salmon stocks.’ The construction was used overwhelmingly to describe and implicate Japanese fishers, but also on occasion with regard to Soviet land-based poachers, undercutting not just fish stocks but the plan as well.Footnote 73
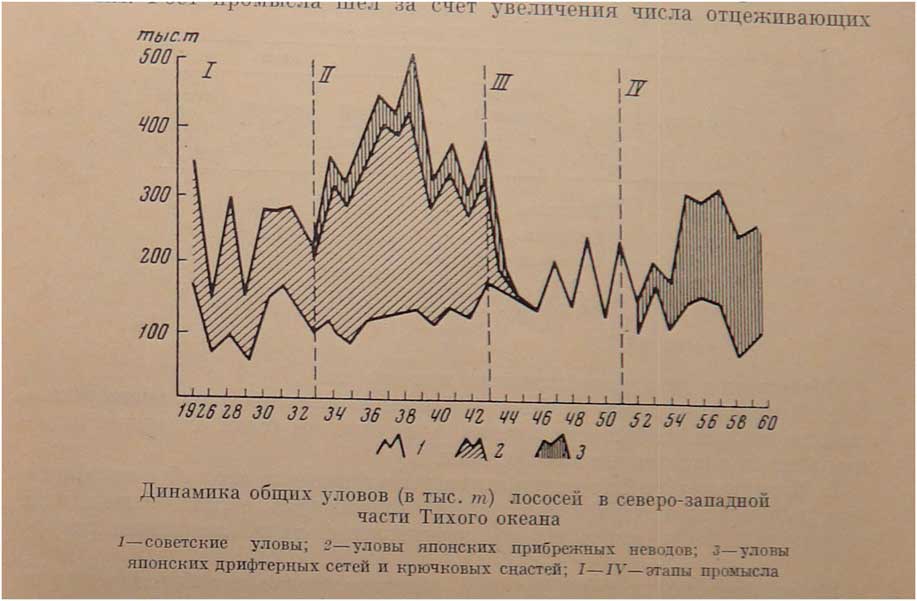
Largely owing to this complex and fraught geopolitical situation, the podryv of the Kamchatka salmon had coalesced in the writings of Soviet scientists, representatives of the Soviet fishing industry, and inspectors before major decreases in yield took place. Figures compiled by Soviet fisheries scientists as late as 1960 showed yields to be roughly steady, and Soviet yields only slightly decreased (Figure 6).Footnote 74 Reading this data as a podryv was an interpretation that Japanese scientists, unsurprisingly, did not share. The Soviet case included other evidence. Soviet assessments of salmon returning to spawn showed ‘catastrophic decline in returns to spawning grounds’.Footnote 75 Such evidence, in the Soviet view, painted a dark picture for the future. Further assessments of fish caught in Soviet waters showed that a large portion had been injured by Japanese long lines, which to Soviet researchers showed that Japanese fishing had negatively affected an unacceptably large portion of the total fish population. It also proved that Japanese deep-sea fishing was ‘irrational in character’, as it involved capture of salmon that had not attained their full growth and fat content and, as luck would have it, would not do so until the fish had migrated to Soviet coastal waters and rivers outside the reach of Japanese fishing boats.Footnote 76 The data, however, were partial. Soviet researchers could only track populations of salmon returning to more accessible rivers in the south and west of the Kamchatka peninsula, as Japanese scientists never tired of repeating. Indeed, for the next few decades the driving goal of Soviet and Russian fisheries diplomacy was not just to reduce, but also to end Japanese fishing of Kamchatka-spawning salmon completely.Footnote 77
Fish yields in the north-western Pacific. The unshaded area under the curve denotes Soviet catches; the diagonal-striped area is Japanese near-shore catch; the vertical-striped area is Japanese drift-net and long-line catches. Source: Semko, ‘Sovremennoe sostoianie zapasov’, p. 13.
Events local and global
The shape and form of individual events in the three discrete cases discussed in this article underlie Sewell’s argument for merging the Braudelian timescales. Context and local structures mattered a great deal for determining how the events would be understood. Equally, the events as experienced were of critical importance to the underlying organization of fisheries industries, political economies, state organization, and even global trade networks – as the Peruvian and Norwegian examples in comparison show. Thus, rather than Braudel’s foam on the waves of conjunctural time carried by the tides of structural time, perhaps a better metaphor for events is sandbars both constituted by and constitutive of waves and tides.
One of the most salient and far-reaching similarities between the collapses discussed above was the degree to which the occurrence of collapse strengthened claims made by states to sovereignty over adjacent fisheries. The collapse of the Atlanto-Scandian herring actually changed the geographical distribution of the resource itself. With new migration patterns resulting from decreased fish populations, the herring (temporarily, it turns out) no longer left Norway’s territorial sea. Similarly, the rebranding of the stock in international English to the Norwegian spring-spawning herring reinforced the connection of the fish to the state. In the Far East, the entire Soviet–Japanese salmon dispute was premised on the claims of the Soviet state to management authority well beyond even the most audacious territorial claims, by dint of the fact that salmon spawned in Soviet rivers. In Peru, while the fishery was exploited nearly exclusively by Peruvians, not only did nationalization give the state direct control over the resource, but the goal was to nationalize foreign capital in the industry as well. Coastal states had, of course, been involved in management of fisheries before but the experience of depletion and collapse led states to take fundamental responsibility for the fisheries, establishing or re-enforcing the national claim to a wild fish.
Central to this was not only how past occurrences were moulded into the event of collapse, but the ways in which these experiences then structured thinking about the future. Pierre Bourdieu highlighted this aspect of ‘eventful history’ in his analysis of the 1968 protests in France, where he proposed the term ‘critical event’, which is a break in expectations, a time ‘when all futures appear possible’.Footnote 78 Such events not only change the way in which people interpret the past and present but shape thinking about the future.Footnote 79 Local and discrete experiences of collapse reshaped expectations that led to the reconfiguration in the 1970s of collapse as a global issue, represented, in particular, by the spectre of impending depletion of the oceans at the planetary level. Articulations of local collapses re-projected at a global level then provided the conceptual structure for the foundation for the new international Law of the Sea, that de facto in 1977, and de jure in 1982, recognized 200-mile exclusive economic zones of coastal states, effectively defining administrative authority over more than 95% of total fish yields.
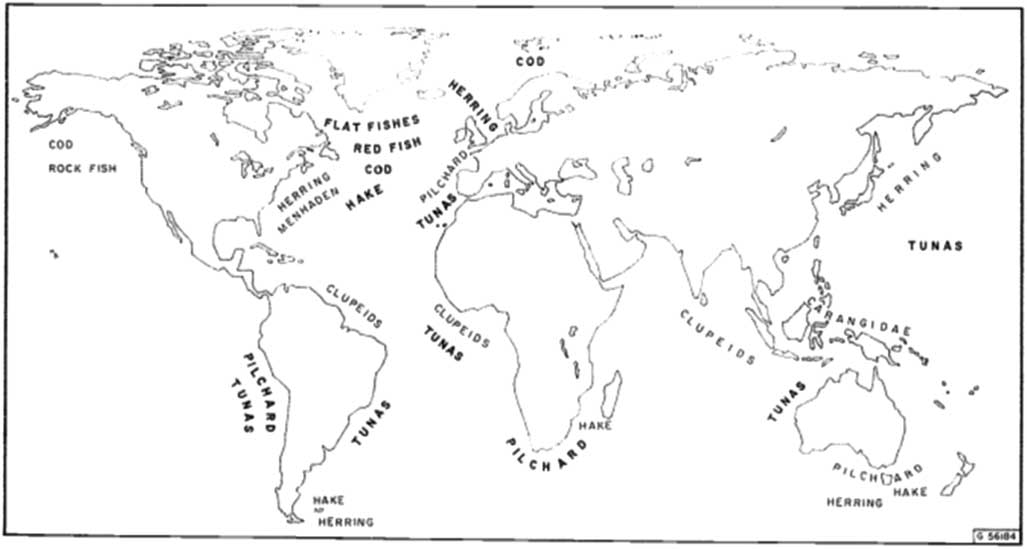
In 1967, less than twenty years after a UN conference had published a map of numerous ‘latent’, under-exploited fisheries worldwide, the FAO published the same map indicating that roughly half of these stocks should now be considered overexploited and ‘certainly or probably in need of management’ (Figure 7).Footnote 80 This was a global view. As the FAO noted, ‘the traditional response to overfishing of one stock has been to move to other usually more distant stocks, but it is clear that this process cannot continue much longer’.Footnote 81 In the FAO’s estimation, few stocks anywhere would remain unexploited in two more decades, thus implying that, without management, overfishing would be endemic the world over by the mid 1980s. Similarly, the Organisation for European Economic Co-operation had issued a report in 1957 suggesting that some fisheries ‘here and there’ were beginning to show signs of depletion. By 1970, the same organization, now called the Organisation for Economic Co-operation and Development (OECD), found it ‘generally accepted that the fishing power in certain areas has reached the stage where it could hardly be supported by the catchable fish stocks in those areas’.Footnote 82
The fisheries (in bold) that were held to be underexploited in 1949 that, by 1967, experts at the FAO believed were in need of management. Source: FAO, State of food and agriculture, p. 120.
J. A. Gulland, a prominent fisheries biologist, tried his hand at global forecasting in 1975, estimating that total fish landings of that year could be expanded by another 20–30 million tons per year before hitting the biological limits of the world’s salt- and freshwater capacity.Footnote 83 Similarly, in 1972 the FAO published a report breaking world fisheries down by region and estimating the total amount of bioresources that could optimally be caught compared with yields recorded in 1972. The findings showed traditionally heavily exploited regions nearing or surpassing available resources, while several regions, particularly the Indian Ocean, had potential for much increased yields. These figures then yielded a total, global estimate of fish available for harvesting of some 100 million tons.Footnote 84 After several decades of collapses worldwide, it was now quite natural to talk about fishing limits globally.
Commenting on this work in the 1974 Norwegian government study entitled ‘Norway’s resource situation in global perspective’, a state working group tasked with the report noted that a more realistic estimate than that determined by the FAO was 80 million tons, which, if fishing growth expanded at the same rate as through the 1960s, would be achieved by the mid 1970s. Even at half that rate of growth, expansion would be exhausted by the early 1980s.
In an ever growing number of the world’s fishing areas, the problem is not to develop fishing as it was in the mid century, but to limit fishing effort … it is beyond doubt that in a decade or two we will have fully taken advantage of the ocean’s capacities for production of fish and marine animals that we today exploit.Footnote 85
The language used here for global fisheries was strikingly similar to that used to describe the Norwegian state’s response to the local collapse of herring off the Norwegian coast. Indeed, the document was drafted by a committee of state representatives, including Gunnar Sætersdal, who probably drafted the fisheries portions of the report. Soviet researchers, too, spoke in the 1970s of a turning point. One Soviet economist summarized that ‘contemporary world fishing has entered a qualitatively new and difficult stage in its further development … general understanding has recognized the need for a reform (perestroika) of research in and practice of fishing to enable transition of fishing away from the principle of “hunting” (okhota) to “rational” fishing’.Footnote 86 Both Soviet and Norwegian writers spoke of these now-imaginable global limits in terms taken directly from discussions about local collapses. Fisheries collapse and overexploitation on a global scale was also very much part of the major environmental concerns of the late 1960s and 1970s and debates about environmental ‘limits to growth’. Indeed, global yields seemed to plateau over the decade (Figure 8). Concerns about fisheries became a prominent example of these limits, even if the FAO and other experts insisted at the same time that the limits had yet to be reached.Footnote 87
Global capture fisheries up to 1980. Hauls were roughly steady through the 1970s before another upswing in the early 1980s.

In 1977 a wave of coastal states the world over unilaterally announced sovereignty in fisheries management up to 200 miles off their coasts. The change in the international maritime regime was codified in 1982 in the UN Convention on the Law of the Sea (UNCLOS). The shift could be viewed as simply the extension of the logic of ocean management, from the 3-mile territorial seas of the age of sail to 200-mile exclusive economic zones of the industrialized late twentieth century. It was a uniquely postcolonial moment; developing states, particularly articulated by the New International Economic Order (NIEO), had a deep influence on the ultimate shape of the UN Convention.Footnote 88 As this article has shown, however, it was also a moment when collapses had pushed states to the centre of regulatory regimes and made it increasingly logical to look to individual coastal states as the natural management authority. The tension between globalization and ecological limits was visible at times even in the words used to describe the ecological crisis. In Norwegian and several other Germanic languages, for instance, the word for ‘limits’ (Norwegian grenser) in the phrase ‘limits to growth’ denoted abstract limits as well as geographical, administrative, or geopolitical borders. It is, of course, no small irony that increasingly treating state-based regulation as the obvious solution to issues of resource management exactly coincided with the rise of the new common-sense ideology that management of the economy should precisely not be state-based.
The time period from the late 1950s to 1990s was critical, both because fisheries collapses occurred with ever greater frequency, and also because of the transfer of concerns about collapse from the local to the global level. The language of global collapse, both actually existing and projected into the future, represented a different way of thinking both about fisheries and about time. Conceptions of cyclical timescales, downturns and recoveries, booms and busts, abundance and scarcity, had long been dominant in fisheries. Indeed, awareness of fluctuations in fisheries was as old as fishing itself. Johan Hjort’s classic 1914 paper scientifically formulated an explanation for yield instabilities, establishing fluctuation as a function of strong and weak class-years.Footnote 89 Similarly, the strengthening and weakening of the anchoveta fishery in the course of El Niño events, and the bi-yearly fluctuations in the Far Eastern salmon due to the periodicity of the humpback salmon life cycle, portrayed decline in yield and crisis as cyclical. However, the possibility of collapse at both global and local level, and the idea of a limit to fishing that could result in irreversible ruin if exceeded, implied a fundamentally different historicity in the sense used by François Hartog in his recent book Regimes of historicity.Footnote 90 With collapse as an increasingly dominant concept in interpreting fisheries population dynamics, ways of thinking about fish and natural processes could not but change from the cyclical nature of fluctuations to a more linear conception, in which fisheries might be so depleted as to cause long-term and perhaps even permanent damage. The Anthropocene as a whole, therefore, might be seen as fundamentally a change in regimes of historicity. The hockey-stick time-series graph of average global temperatures is nothing if not a clear illustration of a dramatic break with cyclical fluctuations.Footnote 91
Conclusion
A number of practitioners have recently noted that global history challenges the methodological and metaphysical convictions of historians as traditionally conceived and practised.Footnote 92 How can the macro scale, large trends, and big processes be investigated through archives that are inevitably narrow and usually quite local? How can a discipline primed to see contingency and complexity, while frequently suspicious of generalization or parsimonious simplification, engage in macro-level analysis and narratives? More prosaically, what makes global history ‘history’, in its narrow academic disciplinary sense? Historians have traditionally responded to ambitious historical sociologists or political scientists by underlining the need for expertise in the historiography of particular geographical areas and time periods of the world. At the same time, growing numbers of historians and historically inclined social scientists have challenged what they see as history’s penchant for narrative to the exclusion of analysis, preference for uniqueness and individuality rather than synthesis, and focus on complexity rather than explanation.Footnote 93 In the inaugural issue of the Journal of Global History, Patrick O’Brien argued forcefully for a return to big narratives. Macro-categories, according to O’Brien, do not necessarily serve existing power structures or traditional constellations of knowledge; so too can they have emancipatory effects. He urged that historians should be ‘constructing general and persuasive narratives that hold together without the fishy glue of Eurocentrism’.Footnote 94
The comparison in this article has shown how fisheries’ collapse as an event was experienced and interpreted in different contexts across the world in the post-war decades. By framing the analysis as an emergent encompassing comparison, building on Tilly, the article has looked at how the concept of ‘collapse’ of a fishery was globalized by extending its original local meaning. Thus, the nature of the global concept was deeply determined both by local experiences and by the ways in which these experiences were shared and mapped over increasingly large spatial scales. An emergent encompassing comparison is in many ways similar to the method developed by Christopher Bayly in The making of the modern world, but builds its global events from the ground up, and is more symmetrically interested in similarity and difference.Footnote 95 As Jürgen Osterhammel noted, Bayly did not add to nor deeply analyse individual interpretations of the French, American, or Haitian revolutions; he synthesized.Footnote 96 This is the sort of bird’s-eye synthesis that Jan de Vries recently suggested could not become the bread and butter of global historians, remaining instead, along with comparative history in his view, ‘largely the domain of non-historians … and senior historians who can permit themselves indulgences of this sort’.Footnote 97 The comparative framework used in this article has shown how intensely local occurrences, events, and processes formed the conditions and provided a vocabulary for conceptualizing a ‘collapse’ on a global scale. Adapting Tilly’s analytical methodology allows us to address the methodological difficulties highlighted by Osterhammel and de Vries. Emergent encompassing comparisons offer a method that cuts across micro and macro scales, making it possible, if not necessary, for global historians to explore global trends and phenomena from the ground up.
Gregory Ferguson-Cradler is a postdoctoral fellow at the Max Planck Institute for the Study of Societies in Cologne, Germany. He is currently completing a manuscript on tradable quotas in global fisheries administration from the post-war period to the present.


