High-quality diets are associated with a significant reduction in the risk of all-cause mortality, CVD, cancer, type 2 diabetes and neurodegenerative diseases(Reference Schwingshackl, Bogensberger and Hoffmann1). Conversely, ultra-processed foods (UPF) are recognised as markers of unhealthful diets(Reference Monteiro, Cannon and Lawrence2), and their consumption is associated with an increased risk of CVD, cerebrovascular diseases, depression and all-cause mortality(Reference Pagliai, Dinu and Madarena3).
In Brazil, the share of UPF to total energy intake has increased over the past decade, most notably among adolescents(Reference Louzada, Cruz and Silva4). Studies have described the diet of children and adolescents as containing a high share of UPF(Reference Lacerda, Carmo and Sousa5–Reference Karnopp, dos Santos Vaz and Schafer7), particularly at between-meal snacks(Reference Cezimbra, Assis and De Oliveira8). A comparative analysis among Brazilian regions showed that the share of in natura or minimally processed foods (MPF) in total caloric food availability was higher in the Northern and Northeastern regions, intermediate in the Central-Western region and lower in the Southern and Southeastern regions(9). Accordingly, the share of UPF was higher in the Southern and Southeastern regions, intermediate in the Central-Western region and lower in the Northern and Northeastern regions(9).
The Dietary Guidelines for the Brazilian Population recommends that in natura or MPF, and their culinary preparations should form the basis of the diet, while advising that UPF should be avoided. Additional recommendations include guidance on selecting and combining foods during meals. For example, Dietary Guidelines for the Brazilian Population suggests including milk/yoghurt, fruits and/or nuts as snacks. Rice and beans form the basis of lunch and dinner(10).
Adopting a meal-based approach may be a key step in developing strategies to encourage more healthful food choices(Reference Guan, Probst and Neale11). By identifying and analysing meal patterns, it is possible to understand how different food combinations at each meal occasion influence overall diet quality and health outcomes(Reference Leech, Worsley and Timperio12). Lemke et al. (Reference Lemke, de Andrade and de Fragas Hinnig13) used item response theory to develop and validate the Meal and Snack Assessment Quality (MESA) scale, which measures meal quality based on the degree of food processing. No previous research has yet evaluated meal quality using the MESA scale. Studies exploring the relationship between meal quality, as assessed by the MESA scale, and health variables could promote the use of this instrument and provide evidence of its measurement quality.
Therefore, this study aimed to use the MESA scale to measure meal quality in representative samples of schoolchildren residing in three cities in different Brazilian regions and assess associations with weight status, socio-demographic characteristics and behavioural variables.
Methods
Study design
This cross-sectional study analysed data from surveys conducted from 2017 to 2019 using the validated questionnaire WebCAAFE(Reference Davies, Kupek and Assis14–Reference Jesus, Assis and Kupek17).
Study sample and data collection
The study included a representative sample of 5612 schoolchildren aged 7–12 years, enrolled in public schools in Florianópolis, Santa Catarina (Southern Brazil) (n 703), in São Paulo, São Paulo (Southeastern Brazil) (n 2503) and in Feira de Santana, Bahia (Northeastern Brazil) (n 2406). All participating schools had computer rooms with internet access. The design and sampling procedures adopted at each location are described elsewhere(Reference Segura18–Reference Pereira, Vieira and Belchor20).
This study was conducted according to the guidelines laid down in the Declaration of Helsinki and all procedures involving human subjects were approved by the Human Research Ethics Committee at the Federal University of Santa Catarina (protocol No. 87539718.1.0000.0121), Human Research Ethics Committee at the Faculty of Public Health of the University of São Paulo (protocol No. 60724216.9.0000.542) and Research Ethics Committee at the State University of Feira de Santana (protocol No. 3.116.495). All parents/caregivers were informed and provided written consent. Assent was obtained from all children included in the surveys.
WebCAAFE surveys
WebCAAFE is an online questionnaire designed to monitor measures of dietary intake, physical activity and sedentary behaviour in second- to fifth-grade students enrolled in public elementary schools. The instrument collects previous-day (24-h recall) data and comprises three sections (personal information, dietary intake and physical and sedentary activities). A demonstration version is available at https://caafe.ufsc.br.
The dietary intake section includes six eating occasions (breakfast, morning snack, lunch, afternoon snack, dinner and evening snack), each of which is illustrated with up to thirty-two food icons (rice, vegetables, greens leaves, vegetable soup, beans, cassava flour, maize/potatoes/mashed potatoes/couscous, pasta, instant pasta, French fries, beef/poultry, sausages, eggs, fish/seafood, fruits, bread, cheese bread, cream cookies, breakfast cereal, porridge, cheese, coffee with milk, milk, yoghurt, chocolate milk, fresh juices, artificial juices, sodas, sweets, packaged snacks, pizza/hamburger/hot dog, nuggets, plain cake, margarine, requeijão (similar to cream cheese) and jam). The schoolchildren were instructed to select which foods they consumed at each meal of the previous day. The instrument does not allow identifying food amounts or portions and, therefore, does not provide information on total energy or nutrient intake. The objective is to investigate the consumption of healthy and unhealthy foods. Additionally, schoolchildren answered questions about school meals, including the frequency of school meal consumption (0–1, 2–3 or 4–5 times/week).
For the purposes of the current study, WebCAAFE food items were classified into three groups according to the NOVA system(Reference Monteiro, Cannon and Moubarac21): (1) in natura or MPF, including rice, vegetables, green leaves, vegetable soup, beans, cassava flour, maize/potatoes/mashed potatoes/couscous, pasta, beef/poultry, eggs, fish/seafood, fruits, porridge, coffee with milk, milk, fresh juice and plain cake; (2) processed foods (PF), including bread and cheese and (3) UPF, including instant pasta, French fries, sausages, cheese bread, cream cookies, breakfast cereal, yoghurt, chocolate milk, artificial juices, sodas, sweets, packaged snacks, pizza/hamburger/hot dog, nuggets, margarine, requeijão (similar to cream cheese) and jam. Dietary data collected using the WebCAAFE questionnaire were used to determine the consumption or non-consumption of MPF, PF and UPF at each of the six daily meals.
The physical activity section of the questionnaire presents the three periods of the day (morning, afternoon and evening) and up to thirty-two options of leisure activities, sports, household chores and sedentary activities (basketball/volleyball, catch one, soccer, running, martial arts, tennis, dancing, table tennis, marbles, hopscotch, jumping rope, gymnastics, swimming, cycling, rollerblading/skateboarding, surfing, kite flying, dodgeball, hide-and-seek, playing with the dog, studying/reading/drawing, board games, playing with dolls, playing with toy cars, watching TV, listening to music, using smartphone/tablet, using the computer, playing videogames, washing the dishes, sweeping and playing a musical instrument). These activities were assigned metabolic equivalent values based on the Compendium of Energy Expenditures for Youth(Reference Ridley, Ainsworth and Olds22). A score was calculated for each activity by multiplying the metabolic equivalent value by the reported daily frequency (0–3 times a day). The subject’s physical activity score was determined as the sum of all activity scores. Subsequently, physical activity scores were categorised into tertiles. The daily frequency of screen-based sedentary activities (television, video games, computer, tablet, smartphone) was also determined for each individual and categorised into tertiles.
The instrument was administered once to each participant. Surveys were conducted in school computer rooms in the presence of trained researchers. The day of questionnaire administration differed among the sample.
Anthropometric measurements
Body weight and height were measured by trained anthropometrists according to standard procedures(Reference Lohman, Roche and Martorell23). During anthropometric assessments, schoolchildren were barefoot and wearing light clothes. Body weight measurements were taken using the equipment available at each research institution. All instruments were previously tested and calibrated. An Ultra Slim W801 Wiso® digital scale (100 g accuracy, 180 kg maximum capacity) was used in Feira de Santana. In Florianópolis, body weight was measured to the nearest 0·1 kg using a PP Marte® portable digital scale (São Paulo, Brazil). In São Paulo, measurements were taken using a Tanita TFB-521® digital scale (0·1 kg accuracy, 150 kg maximum capacity). In the three cities, height was measured using an AlturExata® portable stadiometer (1 mm accuracy).
BMI was calculated as weight (kg) divided by height squared (m2). Age- and sex-specific BMI Z-scores were calculated according to the WHO(24). Weight status was categorised as non-overweight (underweight and normal weight, BMI-for-age Z-score < 1) and overweight including obesity (BMI-for-age Z-score ≥ 1). Anthropometric data were collected on the same day as WebCAAFE data.
Other variables
Information on sex, date of birth and school shift was provided by the school administration. Age was calculated from the date of birth and date of data collection and categorised as 7–9 years and 10–12 years.
MESA
Meal quality was measured using the MESA scale. The scale was developed by applying the unidimensional generalised graded unfolding model from item response theory, taking into account the discrimination and localisation parameters of the items calibrated in a previous study(Reference Lemke, de Andrade and de Fragas Hinnig13). The initial stages of MESA development are described by Lemke et al. (Reference Lemke, de Andrade and de Fragas Hinnig13)
Meal quality was defined considering current recommendations(10,25) for choosing and combining foods in the form of healthful meals. Healthy meals are based on a great variety of MPF, balanced across food groups while restricting UPF(10,25) . Small quantities of PF can be consumed as ingredients in culinary preparations or as part of meals based on MPF(10).
For scale development, three items (MPF, PF and UPF consumption) were proposed to classify foods eaten on each of the six eating occasions, totalling eighteen items. Eleven items showed adequate factor loading parameters (≥ 0·3) and/or communality (≥ 0·2) and discrimination (≥ 0·7), with no differential behaviour in terms of sex and age. These items were retained in the final scale as follows: MPF and UPF consumption at breakfast; MPF, PF and UPF consumption at morning snack; UPF consumption at lunch; MPF and UPF consumption at afternoon snack; UPF consumption at dinner and MPF and UPF consumption at evening snack.
Meal quality scores generated on a (0,1) scale, that is, with a mean of 0 and a standard deviation of 1, were linearly transformed to a (100,10) scale (mean = 100, standard deviation = 10). Scores were continuous, and meal quality was categorised into three levels: healthy (score < 95), mixed (95 ≤ score ≤ 101) and unhealthy (score > 101). The lower the score, the greater the frequency of MPF and the lower the frequency of UPF in daily meals, indicating higher quality meals.
The healthy level is based on MPF consumption; there is a greater probability of consuming MPF at breakfast and afternoon snack and not consuming UPF at other daily meals. The mixed level is based on MPF and UPF consumption, there is a greater probability of consuming MPF at breakfast and afternoon snack and of consuming UPF at breakfast, morning snack, lunch, afternoon snack, dinner and evening snack. Individuals with medium scores have both healthy and unhealthy eating practices. The unhealthy level is based on UPF consumption, there is a greater probability of consuming UPF and not consuming MPF at all daily meals. The probability of consumption and non-consumption of each item in the six daily meals was calculated using the item characteristic curve. The analyses were carried out using the MIRT package of RStudio software version 1.2.5033 (RStudio Team, 2020).
Association of meal quality with weight status, socio-demographic characteristics and behavioural variables
Multinomial regression analysis was used to assess the association of meal quality with weight status, socio-demographic characteristics and behavioural variables. Meal quality, expressed in categorised scores, was the dependent variable. The marginal distributions of each meal pattern were expressed as predicted probabilities with the corresponding 95 % CI using the ‘margins’ command in Stata software. Statistically significant differences were observed by the non-overlapping of CI. The analyses were carried out using Stata version 16.1 (StataCorp, 2020).
Results
Sample characterisation
Among the study sample, 45 % of the students were from São Paulo, 43 % from Feira de Santana and 13 % from Florianópolis. The majority (52 %) were girls, and 69 % were aged between 7 and 9 years. The prevalence of overweight was 34 %. Furthermore, 87 % reported meal consumption data referring to weekdays, and 46 % reported eating school meals 4–5 times a week (data not shown).
Characteristics of eating occasions
In all cities, the most common meals were lunch, dinner and breakfast. In Florianópolis, 96 % of schoolchildren reported having lunch, followed by dinner (90 %) and breakfast (81 %). Among snacks, the afternoon snack was the most frequent (83 %), followed by morning (53 %) and evening (53 %) snacks. Overall, 83 % of schoolchildren consumed four or more meals/snacks per day.
In São Paulo, lunch (93 %), dinner (92 %) and breakfast (89 %) were the most consumed meals. The afternoon snack was the most frequent (78 %), while morning (66 %) and evening (69 %) snacks were consumed less frequently. In this city, 88 % of schoolchildren consumed four or more meals/snacks per day.
In Feira de Santana, lunch (98 %), dinner (93 %), and breakfast (91 %) were the most consumed meals. Afternoon snacks were also common (86 %), while morning (74 %) and evening (69 %) snacks occurred less often. In total, 92 % of schoolchildren consumed four or more meals/snacks daily.
Meal quality
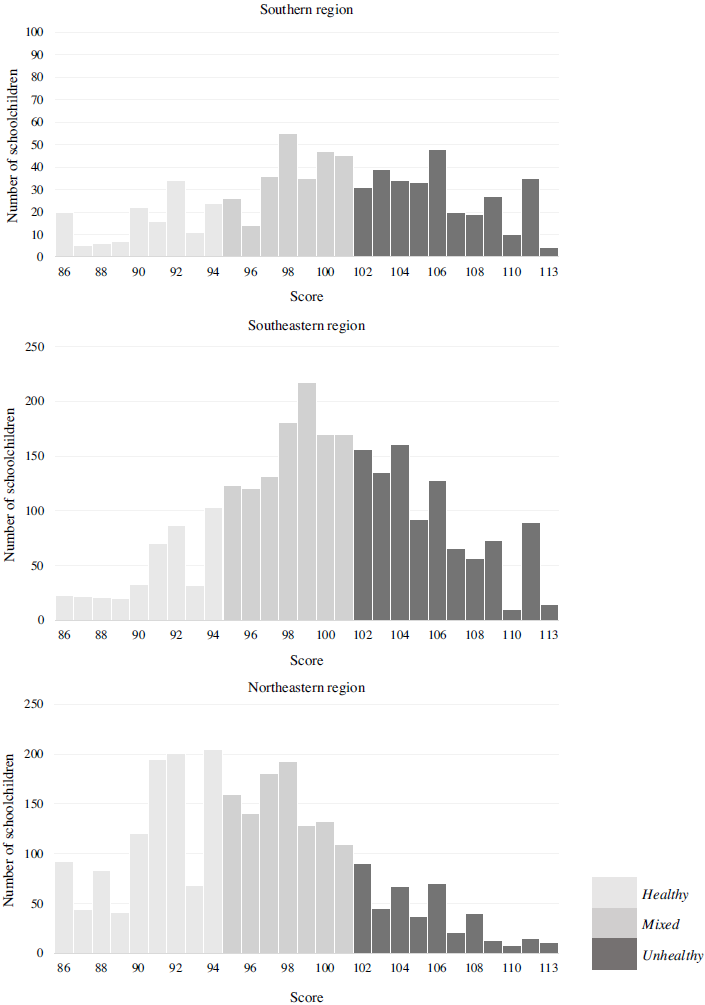
The latent trait of schoolchildren ranged from 86 to 113 (scale 100,10). Schoolchildren in Feira de Santana, São Paulo and Florianópolis had a predominance of healthy (41·8 %), mixed (44·4 %) and unhealthy (42·7 %) meal quality, respectively (Table 1). Figure 1 shows the distribution of schoolchildren according to MESA score in each of the study locations. Individuals with scores close to the item’s location parameter are more likely to agree with the item (have a positive answer).
Estimates (proportions and 95 % CI) of schoolchildren by levels of the Meal and Snack Assessment Quality (MESA) scale

n, number of subjects.
* Significant differences between the locations were identified using non-overlapping 95 % CI.
Distribution of schoolchildren by score on the Meal and Snack Assessment Quality Scale (MESA) (scale 100,10). Note: Items related to MPF (i01, b = 91) and UPF (i03, b = 108) consumption at breakfast; MPF (i04, b = 95), PF (i05, b = 98) and UPF (i06, b = 101) consumption at the morning snack; UPF (i09, b = 104) consumption at lunch; MPF (i10, b = 93) and UPF (i12, b = 106) consumption at the afternoon snack; UPF (i15, b = 104) consumption at dinner and MPF (i16, b = 95) and UPF (i18, b = 104) consumption at the evening snack. b, item location parameter.

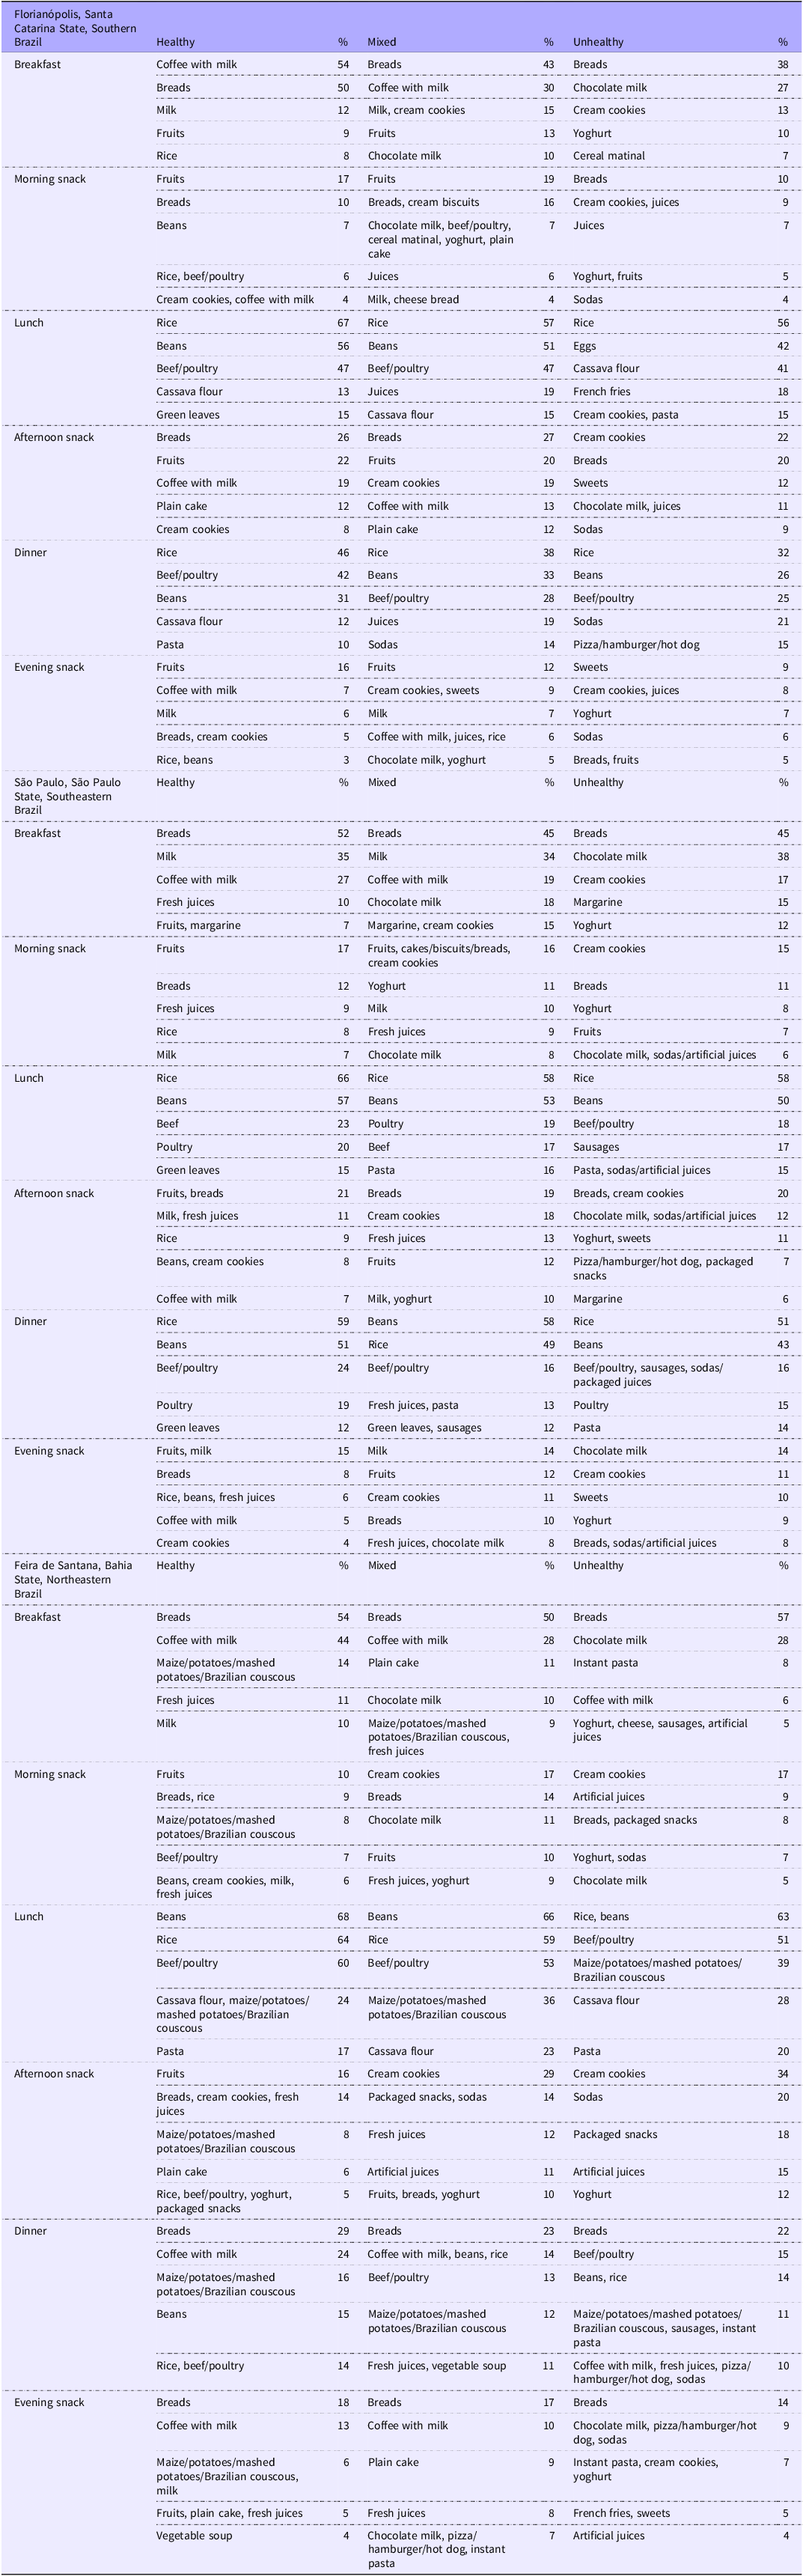
Interestingly, a large part of schoolchildren in Feira de Santana were associated with the consumption of MPF at breakfast. The most frequent MPF eaten at breakfast by this group were coffee with milk, maize/potato/mashed potatoes/couscous, fruit juice, milk and plain cake. By contrast, schoolchildren in Florianópolis and São Paulo were more associated with the consumption of UPF at the morning snack. The most frequent UPF consumed on this occasion by children in Florianópolis were cream cookies, juices, yoghurt, chocolate milk and breakfast cereals. Among children in São Paulo, the most frequent UPF eaten at the morning snack were cream cookies, yoghurt, chocolate milk, sodas and packaged snacks. At morning, afternoon and evening snacks, there was a higher frequency of UPF consumption, whereas at lunch and dinner, there was a predominance of MPF (rice, beans and beef/poultry). Table 2 shows the five most frequent food items consumed by schoolchildren with healthy, mixed and unhealthy meal quality at each meal.
Description of the five food items most frequently consumed by schoolchildren with healthy, mixed or unhealthy meal quality per eating occasion

Meal quality was assessed using the Meal and Snack Assessment Quality (MESA) scale.
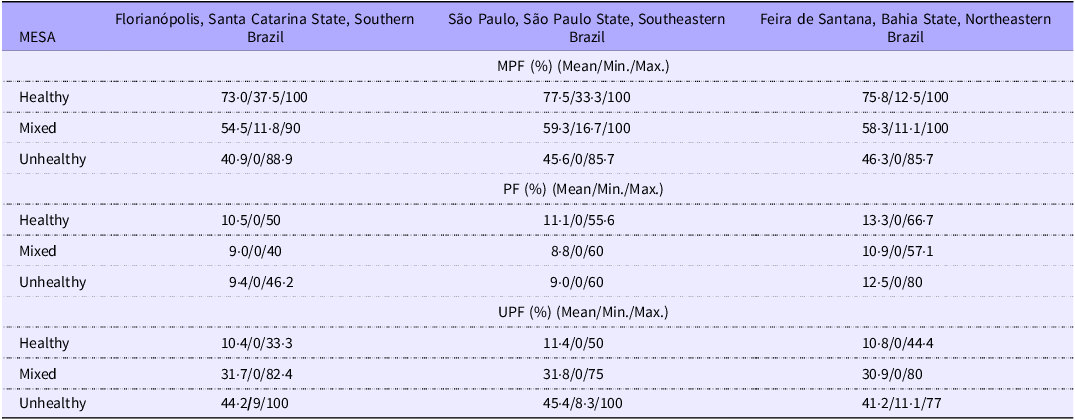
Furthermore, to better characterise the meal quality levels, the mean, minimum and maximum proportions of MPF, PF and UPF, by MESA level and location are presented (Table 3).
Mean, minimum and maximum proportions (%) of in natura or minimally processed foods, processed foods and ultra-processed foods by level of the Meal and Snack Assessment Quality (MESA) scale and location

Min., minimum; Max., maximum; MPF, in natura or minimally processed foods; PF, processed foods; UPF, ultra-processed foods.
Relationship of meal quality with weight status, socio-demographic characteristics and behavioural variables
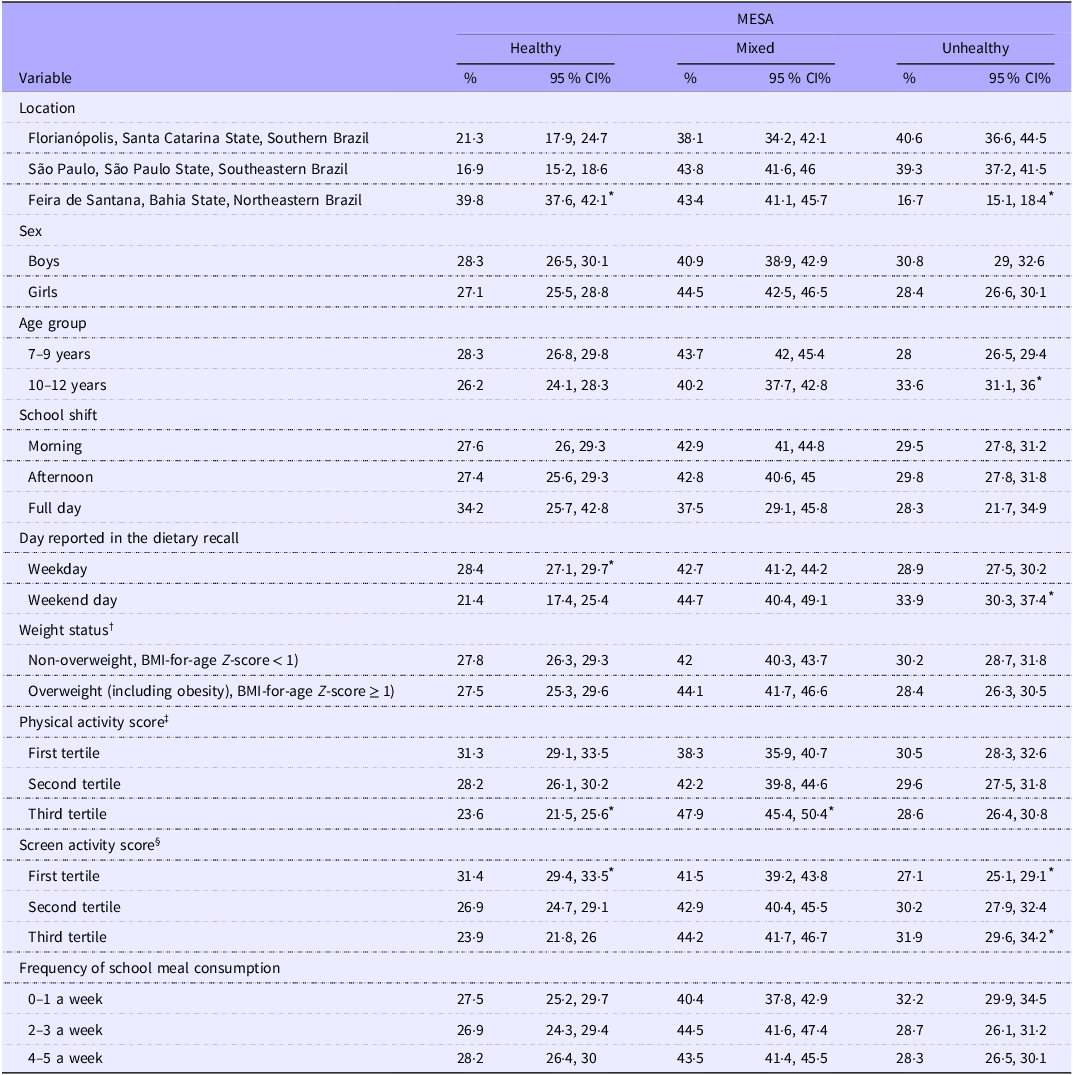
The percentage of schoolchildren with a healthy meal quality was similar between sexes, age groups, school shifts, weight groups and school meal consumption frequencies. Higher meal quality was observed among students from Feira de Santana (39·8 %, 95 % CI = 37·6 %, 42·1 %), those who reported data for weekdays (28·4 %, 95 % CI = 27·1 %, 29·7 %) and those with a lower screen activity score (31·4 %, 95 % CI = 29·4 %, 33·5 %). Schoolchildren with a higher physical activity score were less likely to have a healthy meal quality (23·6 %, 95 % CI = 21·5 %, 25·6 %) (Table 4).
Probability (%) of schoolchildren belonging to a meal quality level of the Meal and Snack Assessment Quality (MESA) scale (Percentages and 95 % CI)

* Significant differences were identified using non-overlapping 95 % CI.
† BMI was calculated as body weight (kg) divided by height squared (m2). Age- and sex-specific BMI Z-scores were calculated according to the WHO(24).
‡ Physical activity scores were calculated by multiplying the metabolic equivalent of each physical activity by the reported daily frequency(Reference Ridley, Ainsworth and Olds22). The individual’s score was the sum of all activity scores. The first tercile was defined as the lowest, the second tercile as intermediate and the third tercile as the highest.
§ Daily frequency of sedentary behaviours based on screen activities (television, video games, laptop, tablet and mobile phone). The first tercile was defined as the lowest, the second tercile as intermediate and the third tercile as the highest.
The percentage of schoolchildren with a mixed meal quality did not differ between locations, sexes, age groups, school shifts, day of dietary intake reporting, weight groups, screen activity score and school meal consumption frequencies.
The mixed level was higher among schoolchildren with a higher physical activity score (47·9 %, 95 % CI = 45·4 %, 50·4 %) (Table 4).
The percentage of schoolchildren with an unhealthy meal quality was similar between sexes, school shifts, weight groups, physical activity scores and school meal consumption frequencies. A greater likelihood of having an unhealthy meal level was observed among schoolchildren aged 10–12 years old (33·6 %, 95 % CI = 31·1 %, 36 %), those who reported data for the weekend (33·9 %, 95 % CI = 30·3 %, 37·4 %) and those with a higher screen activity score (31·9 %, 95 % CI = 29·6 %, 34·2 %). Schoolchildren from Feira de Santana were less likely to have an unhealthy meal quality (16·7 %, 95 % CI = 15·1 %, 18·4 %) (Table 4).
Discussion
This study measured the meal quality of 6067 schoolchildren residing in three cities in different regions of Brazil using the MESA scale and analysed its association with weight status, socio-demographic characteristics and behavioural variables. Schoolchildren in Feira de Santana, São Paulo and Florianópolis were more likely to have healthful, mixed, and unhealthful meal quality, respectively. The meal patterns of schoolchildren living in Feira de Santana were the healthiest, particularly with regard to breakfast. Feira de Santana follows the trend observed in the Northeast region, which shows a lower share of UPF in the diet(9). As observed in previous studies(Reference Louzada, Cruz and Silva4,Reference dos Santos Costa, Steele and de Faria26) , different regions of the country have different food consumption behaviours. It can be hypothesised that cultural factors related to the consumption of natural foods are influencing the results. The consumption of maizemeal couscous, beans, maize, cassava, sweet potatoes and yam is very common in the Northeast and Feira de Santana.
The likelihood of children having a given meal quality level differed according to their socio-economic and behavioural characteristics. Schoolchildren in Feira de Santana, who reported food consumption data for weekdays, who were less physically active and who had a lower screen activity score were more likely to have a healthy meal quality. Those who were more physically active were more likely to have a mixed meal quality. Schoolchildren aged 10–12 years, those who reported data for the weekend and those with a higher score for screen activity were more likely to have unhealthy meal quality.
The associations identified in our study are consistent with previous research. Socio-demographic factors such as age have been associated with diet quality. In general, children have a healthier eating patterns than adolescents(Reference Corrêa, Vencato and Rockett27,Reference Golley, Hendrie and McNaughton28) . External influences and greater autonomy in food choices likely influence diet quality in adolescence(Reference Golley, Hendrie and McNaughton28). Regarding sex, some studies reported similar eating patterns between boys and girls(Reference Corrêa, Vencato and Rockett27,Reference Golley, Hendrie and McNaughton28) , while others suggested that girls tend to have healthier eating behaviours than boys(Reference Pereira, Hinnig and Pietro29,Reference Elinder, Heinemans and Zeebari30) .
Research has shown that diet quality tends to be lower during the weekends, characterised by a higher intake of foods with low nutritional value, such as sugary foods and drinks(Reference Svensson, Larsson and Eiben31) and increased fat and energy intake(Reference McCarthy32). Changes to daily routines during the weekend may contribute to changes in eating patterns.
In our study, there was no association with the frequency of school meal consumption. In Brazil, regular consumption of school meals has been positively associated with increased intake of healthful foods, reduced intake of unhealthful foods(Reference Locatelli, Canella and Bandoni33,Reference Horta, Do Carmo and Junior34) , reduced intake of UPF and greater frequency of MPF in students’ diets(Reference Bento, Moreira and Carmo35).
Screen time is inversely associated with healthful eating patterns(Reference LeBlanc, Katzmarzyk and Barreira36,Reference Matias, Silva and Silva37) . More screen time is thus related to increased consumption of energy-dense foods and drinks(Reference Guerra, de Farias Júnior and Florindo38), possibly associated with users’ exposure to advertisements for UPF. A previous study assessed the obesogenic quality of the home environment and its association with diet, physical activity, television viewing and BMI in preschool children using data from a cohort of British twins. The research concluded that children in high-risk obesogenic food environments consumed fewer fruits and vegetables and more energy-dense snacks and sugary drinks than children in low-risk food environments. Furthermore, in high-risk environments, children watched more television and were less physically active(Reference Schrempft, van Jaarsveld and Fisher39).
In our study, schoolchildren who were less physically active had better meal quality. According to Leech et al. (Reference Leech, McNaughton and Timperio40), it cannot be assumed that high levels of healthful behaviours are indicative of an overall healthful lifestyle. Diet, physical activity and sedentary behaviours can interact in complex ways, producing both beneficial and detrimental effects on health. Furthermore, the relationship of physical activity with dietary intake may be driven by a compensatory mechanism, in which an increase in daily energy expenditure in physically active individuals leads to an increase in food consumption, whether of healthful or unhealthful foods(Reference Barros, de Jesus and Vieira41).
Our study found no association between MESA score and weight status. Reporting bias and/or the cross-sectional design of the study (reverse causality) might have influenced this result. The Adolescent Nutritional Assessment Longitudinal Study (ELANA), conducted with adolescents from public and private schools in the metropolitan region of Rio de Janeiro, Brazil, found an inverse association between UPF consumption and BMI at both baseline and the 3-year follow-up. The cited study confirmed that increased UPF intake is a marker of unhealthful diets but did not support the hypothesis that high UPF intake is associated with greater weight gain in adolescents, even after adjusting for physical activity(Reference Cunha, Costa and Veiga42).
The current study has limitations. In addition to the inherent limitation of this study’s cross-sectional design, which does not allow causal relationships to be identified or established, other issues should be discussed. First, the self-reported dietary assessment is subject to under-reporting. However, data from the validation study of the dietary intake section of WebCAAFE showed a high rate of correspondence and low percentage of omission between self-reported and directly observed data(Reference Jesus, Assis and Kupek17). Food intake was assessed using a single 24 h recall, which may not be representative of the individual’s usual intake. Nevertheless, this method is widely accepted for assessing food intake at a population level(Reference Thompson, Kirkpatrick and Subar43). Of note, the day on which WebCAAFE was applied varied between children. This strategy was used to cover the daily variability of food intake and physical activity over the course of school days (Monday to Thursday) and non-school days (Sunday and holidays), allowing these behaviours to be analysed at the group level.
WebCAAFE was not designed to evaluate foods according to their degree of processing. Thus, some foods may be classified into more than one group according to the NOVA system. The decision-making procedure for classifying WebCAAFE foods according to their degree of processing was based on expert opinions, with the most conservative or common classification being adopted.
As a strength, the study provides evidence of the external validity of an innovative metric instrument. The MESA scale makes it possible to assess the quality of six daily meals according to the degree of food processing, using probabilistic item response theory modelling. The results of the associations showed that the scale measures the latent trait of interest as expected. Additionally, this is the first study to use the MESA scale to assess samples from three regions of Brazil, which differ culturally and socio-economically.
The findings of this study reveal the need for strategies aimed at increasing adherence to Dietary Guidelines for the Brazilian Population recommendations, particularly regarding how to choose and combine foods to compose healthful meals, as preventive and health promotion measures. The information obtained from assessing meal quality through the MESA scale can be used for specific dietary recommendations and interventions aimed at between-meal snacks.
Conclusion
According to the MESA scale, schoolchildren in Feira de Santana, those who reported food data for the weekdays, and those with lower scores for physical activity and screen activity had better quality meals. Schoolchildren aged 10–12 years, those who reported meal data for the weekend, and those with a higher screen activity score had poorer quality meals. The mixed level was higher among schoolchildren with a higher physical activity score.
Acknowledgements
The authors gratefully acknowledge the children, parents and school authorities who participated in the study. This article is based on a doctoral thesis from the Nutrition Postgraduate Program at the Federal University of Santa Catarina, for whose support we are also grateful.
This work was supported by the Brazilian National Council for Scientific and Technological Development - CNPq (MAAA, grant number 305148/2011-7 and 308352/2016-5; PFP, 306209/2022-5 - Call Nº 09/2022 - research Productivity scholarship - level 2); Foundation for Research and Innovation of the State of Santa Catarina - FAPESC (PFH, Grant/Award Number: 2017TR1759). CNPq and FAPESC had no role in the design, analysis or writing of this article.
Conceptualisation: S. L., D. F. A., P. F. H., M. A. A. A. and P. F. P.; formal analysis: S. L., D. F. A., P. F. H. and S. A. S.; writing–original draft preparation: S. L., M. A. A. A. and P. F. P.; writing–review and editing: S. L., D. F. A., P. F. H., S. A. S., F. G. K. V., G. M.J., I. E. S., B. S.V., M. A. A. A. and P. F. P.; funding acquisition: P. F. H., M. A. A. A. and P. F. P. All authors read and critically reviewed the manuscript.
There are no conflicts of interest.