




1. Introduction
Brazilian economic history has long been marked by persistent inflation. Over the past two centuries, few economies have experienced such sustained and intensifying price instability.Footnote 1 Underlying this record, Brazilian economic policy had oscillated between two competing imperatives: sustaining high growth to overcome underdevelopment and maintaining macroeconomic stability.Footnote 2 The pursuit of modernization and social transformation has frequently clashed with the constraints of monetary and fiscal discipline. The tensions between these conflicting goals have reflected not only technical disagreements among policymakers but also deeper political divisions over the nation’s economic priorities and development trajectory. The banking system, as Calomiris and Haber (Reference Calomiris and Haber2014) have argued, was at the heart of this longstanding historical challenge.Footnote 3
The Military Regime (1964–1985) experienced an acute manifestation of Brazil’s enduring tension between price stability and economic growth. On the one hand, despite the regime’s strong anti-inflationary rhetoric and repeated currency reforms, during its 21 years in power, inflation more than doubled the average rate of the decade preceding the coup, reaching a historic peak of nearly 250 percent per year in 1985. On the other hand, the economy experienced extreme fluctuations, encompassing both the extraordinary economic expansion of the so-called Brazilian Economic Miracle and the subsequent collapse into the “lost decade” of the 1980s. The dictatorship period also marked the heyday of Brazilian developmentalism and state capitalism, as the government assumed unprecedented levels of participation in the economy through the creation of hundreds of state-owned companies, and implemented import-substitution and massive industrialization programs.Footnote 4 Finance and banking were central to these transformations and, in particular, Banco do Brasil (BB)—a mixed public-private institution controlled by the federal government—played a crucial role in the policymaking process of the state’s financial activism and the achievement of national objectives.Footnote 5
Given BB’s unique institutional standing, this article examines how its financial operations enabled successive military governments to pursue their economic objectives and shape macroeconomic outcomes. As Brazil’s leading financial institution and financial agent of the federal government, BB occupied a dominant position within the domestic banking system and played a central role in fiscal policy, development finance, and monetary management.Footnote 6 By the early 1980s, its deposits accounted for roughly half of the banking system and were three to four times larger than those of its closest competitor.Footnote 7 Its assets were approximately two and a half times bigger than those of the Banco Nacional de Desenvolvimento Econômico (BNDE), and its balance sheet was comparable in size to that of the Brazilian Central Bank (BCB). This scale also positioned BB as a major actor beyond Brazil’s borders, ranking among the world’s largest banks and standing out as one of the most prominent financial institutions in Latin America. Its assets far exceeded the combined balance sheets of Banco de la Nación Argentina, Banco de Comercio (Mexico), Banco del Estado de Chile, Banco de la Nación (Peru), and Banco de Venezuela, the largest banks in their respective countries.Footnote 8
Moreover, BB’s functions far surpassed those of its Latin American counterparts, making it indispensable to the Military Regime, which largely relied on it to advance both developmental and political goals. In this sense, BB operated as a key policymaking actor, capable of mediating between the competing imperatives of stabilization and development in ways no other regional financial institution could.Footnote 9 The article offers a novel empirical and analytical perspective on its roles by digitizing and systematically analyzing BB’s balance sheets published in Revista Bancária Brasileira. We construct a new database, used here for the first time, and classify BB’s asset and liability accounts into its five historically recognized areas of activity: commercial banking, development finance, foreign exchange management, fiscal agency, and monetary operations.Footnote 10 This methodological framework establishes a structured and quantifiable foundation for assessing BB’s multiple functions and their relative influence on macroeconomic performance and broader financial developments. It further illustrates how BB adapted to the shifting landscape of economic and political governance under military rule, while showing that its influence on inflation and growth dynamics was significantly more complex and much less linear than commonly portrayed.
Existing interpretations of Brazil’s macroeconomic instability during the Military Regime have generally emphasized weak institutions and a political economy in which financial arrangements undermined fiscal and monetary discipline.Footnote 11 Soon after the coup in December 1964, the military enacted a financial reform that created the BCB after over thirty years of unsuccessful attempts by previous administrations. However, BCB’s lack of autonomy and independence has been widely regarded as a major impediment to achieving monetary stability. In particular, BB’s reliance on funding from the BCB through the conta de movimento—an internal BB–BCB account that served to transfer funds between them—has been largely seen as a primary source of inflationary pressure and an indirect mechanism for monetizing fiscal deficits.Footnote 12 Yet some authors have highlighted BB’s broader macroeconomic policy functions, suggesting that its activities did not merely fuel instability but also shaped the government’s capacity to manage key macroeconomic challenges. Recent work has shown that, through its network of foreign branches and agencies in international financial markets, BB played a crucial role in enabling the Brazilian government to navigate external imbalances after the 1973 Oil Shock, averting both a currency crisis and reliance on the International Monetary Fund (IMF) along with its adjustment plans and associated austerity measures.Footnote 13
This article builds on and complements Brazilian historiography by showing that BB’s role during the Military Regime was far more extensive than previously recognized. Rather than engaging with the theoretical or empirical debates in the financial history literature on banking and macroeconomic stability, it focuses on uncovering the mechanisms that shaped the bank’s specific functions, making three main contributions. First, by widening the perspective to encompass the whole spectrum of BB’s macroeconomic activities—beyond alleged fiscal financing and balance-of-payments management—, we assess its central involvement in executing and funding the dictatorship’s development ambitions and trace its evolution toward commercial banking. Second, this broader analysis reveals that resources under the conta de movimento did not always serve to finance the Treasury. Rather, the account’s dynamics were nuanced, with periods—most notably during the Economic Miracle (1967–1973)—when the Treasury supplied liquidity to BB instead of drawing from it. We also show a close association between the behavior of the conta de movimento and BB’s foreign currency positions prior to 1973, suggesting that liquidity from the Central Bank was sometimes deployed to absorb dollar inflows as foreign capital entered the country. In this article, we contend that BB’s operations could contribute to, but also mitigate, macroeconomic instability.
Finally, although scholars have long recognized that competing technical and political visions of stability and growth were embedded across Brazil’s institutional apparatus—not only in the executive, but also in Congress, state-owned enterprises, and financial and monetary bodies—much less is known about the translation of these tensions into actual policy, and how this varied across administrations after 1964.Footnote 14 Placed at the intersection of fiscal policy, credit allocation, monetary management, and external finance, BB offers a unique window onto the shifting priorities, constraints, and governing strategies under military rule. Tracing the evolution of its functions and financial mechanisms over time shows that the dictatorship cannot be understood as a single, internally coherent project. Instead, the analysis highlights the different ways in which governments combined stabilization and development goals, and the means through which these priorities were implemented within the state-led financial system. In this respect, BB serves not only as a case study of policy implementation within a single institution, but also as a vantage point for observing the changing architecture of military rule. Owing to its nationwide reach, scale, and presence across multiple financial sectors, it operated as the central conduit through which governments mobilized resources, recalibrated policy instruments, and pursued their respective economic objectives.
The article begins by situating BB within the political economy of the Military Regime, exploring how its operations were integrated into the governance framework shaping the ambitions and dynamics of growth and stability. The third section analyzes BB’s reconfiguration under President Castelo Branco (1964–1967), examining the impact of the newly created BCB on its functions and relationship with the Treasury. Section four assesses BB’s financial intermediation during the Economic Miracle under the successive administrations of Costa e Silva (1967–1969) and Medici (1969–1974). Section five traces the evolution of BB’s lending and monetary operations during the Geisel administration (1974–1979), amid global turbulence, oil shocks, and rising external borrowing. Section six considers BB’s adaptation under President Figueiredo (1979–1985), when tightening financial constraints and external pressures forced a policy shift toward stability. The concluding section reflects on the implications of the article’s main findings and new avenues of research for understanding monetary and financial governance under Brazil’s Military Regime.
2. The politics and institutions of financial governance
The debates around stabilization and development in Brazil were never a purely technical matter but a profoundly political one.Footnote 15 They cut across the state, not only structuring disputes in Congress but also dividing policymakers within the executive branch, generating friction among ministries and government agencies. These rival approaches circulated within every state institution, including key financial and monetary bodies like the BB itself, creating a dense web of inter- and intra-institutional tensions. The military dictatorship that governed between 1964 and 1985 was not immune to these dynamics. Despite the severe curtailment of political and civil liberties, economic policy was fiercely debated in Congress, which remained a platform for regional representatives to demand credit expansion in favor of local agriculture and industry.Footnote 16 These positions also permeated the armed forces and the regime’s civilian officials, sustaining disputes over stabilization and development throughout the state apparatus and policymaking, even under authoritarian rule.
At the macroeconomic level, the tensions between stabilization and development often played out between the Ministério da Fazenda and the Ministério do Planejamento, the two key institutions responsible for Brazil’s economic and fiscal management. The Ministry of Finance was charged with formulating and executing national economic policy, managing the Union’s public finances through its National Treasury Secretariat, and supervising the federal fiscal structure. By contrast, the Ministry of Planning—re-established in 1964 under Castelo Branco after a brief existence following its creation during the Goulart administration in 1962—emerged as a central actor in the developmental state, responsible for designing and implementing long-term economic programs such as the Programa de Ação Econômica do Governo (PAEG) or the Plano Nacional de Desenvolvimento (PNDs).Footnote 17 While the former was generally associated with relatively more orthodox approaches and the latter with more heterodox ones, the degree of divergence between them varied according to the profile of the ministers in office. In practice, ministers often served in both entities and circulated across related institutions and secretaries, reflecting the different presidential strategies and political designations, as will become evident in the following sections.
As Brazil's major financial powerhouse, BB was not only embedded within, but also integral to, these political and economic dynamics. On the one hand, although it was formally organized as a joint-stock company with shares publicly traded, the majority of its capital was held by the Brazilian state, which gave the federal government decisive control over its strategies and decisions. The presidency of BB was a highly political position: its occupant was directly nominated by the President of the Republic and, more often than not, drawn from the ranks of active political life rather than from technocratic circles.Footnote 18 On the other hand, BB was also the financial agent of the Union and the largest and most influential financial entity in the country, making it central to the formulation and execution of economic strategies. Moreover, its president held a seat on the board of the Conselho Monetário Nacional (CMN) alongside the Ministers of Finance and Planning, and thus participated directly in discussions and decisions over monetary policy, credit allocation, and development programs. For all these reasons, BB was a key arena where the tensions between stabilization and growth were expressed, negotiated, and ultimately transmitted into the economy.
BB’s involvement in these issues was both distinctive and historic, occupying a longstanding role at the center of Brazil’s economic and political struggles. For much of the twentieth century, BB simultaneously served as Brazil’s main currency issuer, largest commercial bank, and principal development financier. Even after the creation of the Central Bank in 1964, BB retained residual central banking powers, such as operating the conta de movimento and managing the bulk of the country’s foreign exchange interventions.Footnote 19 Its multifaceted institutional nature, combining commercial, development, and central banking functions, made it uniquely suited to Brazil’s political economy. This hybridity set it apart not only from other local private and public commercial banks but also from other major financial institutions such as the Central Bank, conceived as a technocratic authority dedicated to currency stabilization, and from BNDE, established to specialize in long-term project financing.Footnote 20 While the Central Bank assumed formal monetary responsibilities and BNDE spearheaded industrialization, BB straddled both domains, often blurring the lines between fiscal, monetary, and industrial policy. Its extensive nationwide branch network further reinforced this position, giving it a reach unmatched by either institution and enabling it to serve as the executive arm of monetary and credit policy under a legal framework that subordinated monetary governance to political discretion. In its multiple capacities, BB’s role extended far beyond a conventional commercial or development bank, becoming central to mediating between the competing goals of stabilization and development in ways not seen in any other Latin American financial institution.Footnote 21
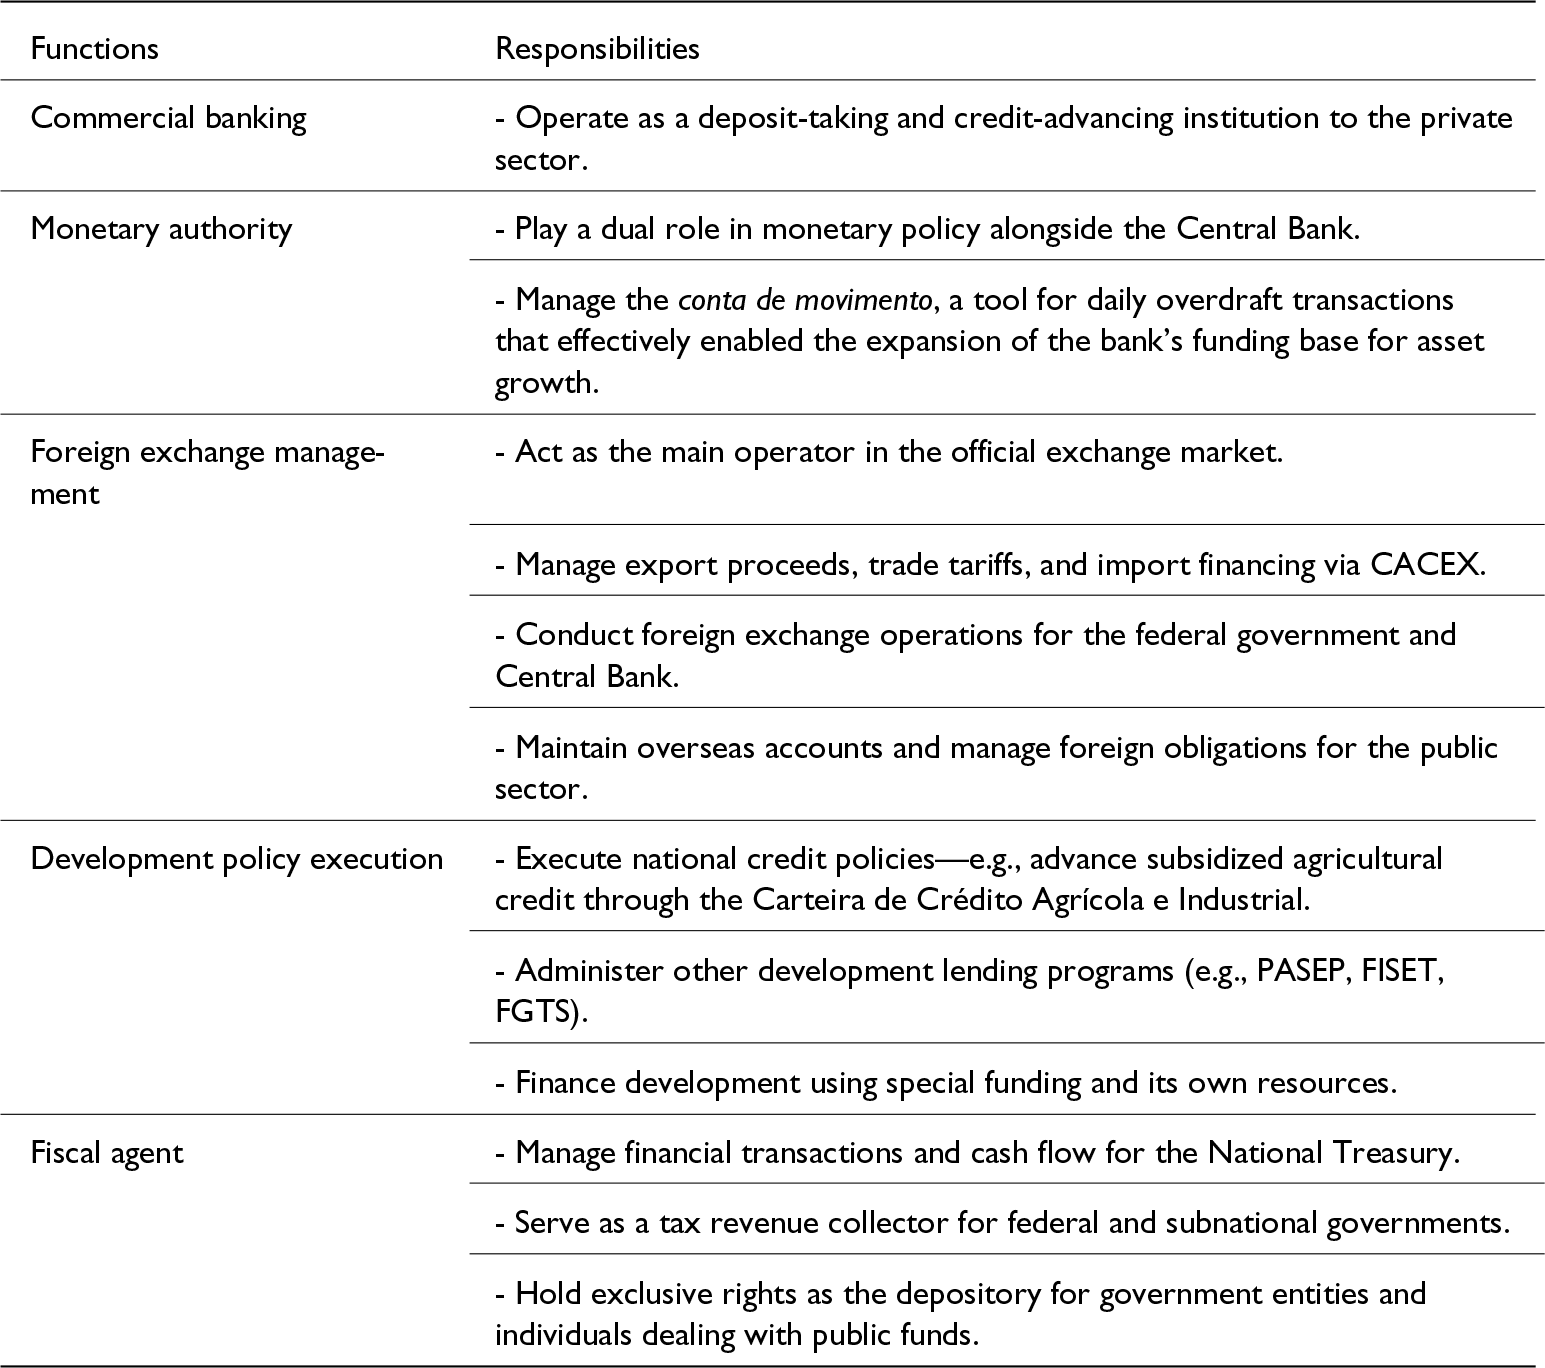
Table 1 presents the main functions and financial responsibilities undertaken by BB between 1964 and 1985. For the purposes of this article and building on the economic and historical literature on the macroeconomic role of financial institutions, the activities of BB have been organized into five broad categories: commercial banking, development finance, foreign exchange management, fiscal agency, and monetary responsibilities. The table outlines the operations performed by BB under these categories, drawing on both the bank’s statutes and assessments in Brazilian historiography regarding its activities during this period. Our analysis seeks to gauge the extent of BB’s involvement in each category by examining its balance sheets and regrouping accounts into these five functional clusters for the entire period. As the bank’s business and financial activities evolved, some accounts changed names, others were discontinued, and new ones were created, making the classification a significant—though not insurmountable—task (see the methodological note in the appendix). Taken together, the accounts included in these five categories represent, on average, about 90 percent of the bank’s balance sheet between 1965 and 1985.
Banco do Brasil (BB)’s main functions and responsibilities

Table 1 Long description
The table outlines the main functions and responsibilities of Banco do Brasil, highlighting its diverse roles in the financial sector. As a commercial bank, it provides deposit and credit services to the private sector. In its monetary authority role, it collaborates with the Central Bank on monetary policy and manages daily overdraft transactions. Banco do Brasil is pivotal in foreign exchange management, handling official exchange market operations and managing export proceeds and foreign obligations. It also executes development policies by advancing subsidized agricultural credit and administering development lending programs. As a fiscal agent, it manages financial transactions for the National Treasury and collects tax revenue for government entities. Each function is associated with specific responsibilities, emphasizing the bank's comprehensive involvement in Brazil's financial system.
Source: See Methodological note (Appendix).
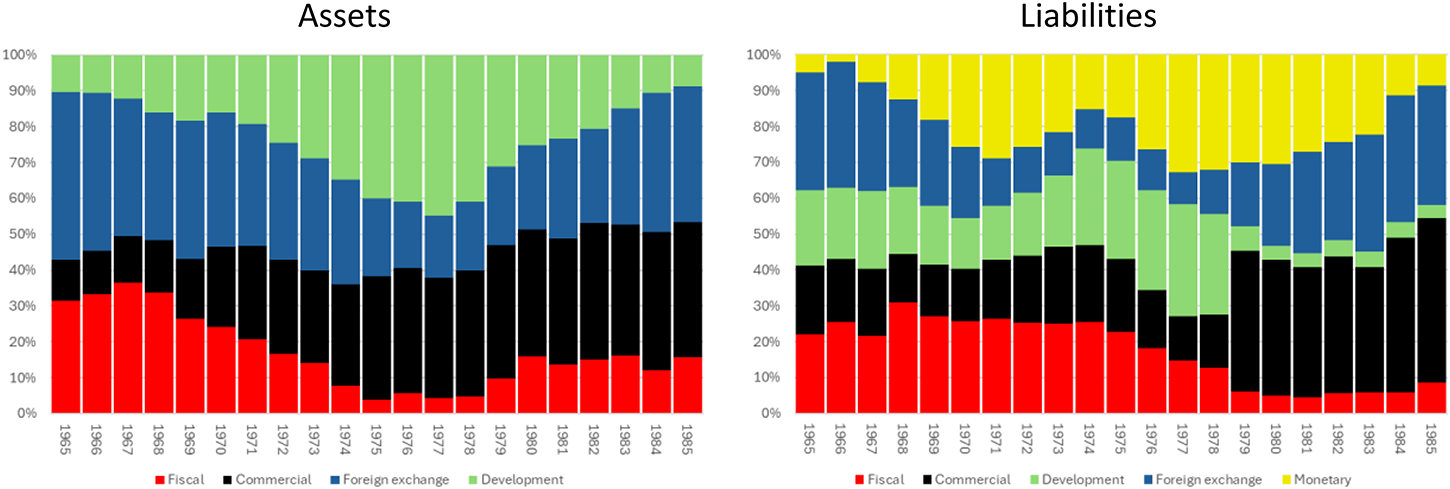
In this article, we apply this functional grouping of accounts to both sides of BB’s balance sheet for the entire period under study, tracing how shifts in these categories reflected—and responded to—the evolving economic policy goals and macroeconomic outcomes of successive administrations. Figure 1 shows the breakdown and evolution of BB’s assets and liabilities according to this classification, expressed as shares of its annual balance sheet. The figure highlights important shifts in the bank’s sources of funding and in the allocation of its resources over time. It reveals, for instance, that despite BB’s formal legal status as a commercial bank, the activities normally associated with commercial banking never constituted its core business, as reflected in their modest weight on the balance sheet: neither savings and time deposits from the public, nor loans, advances, and credit lines to the private sector, nor other standard banking services accounted for its predominant liabilities or assets. Instead, fiscal, development, foreign exchange, and monetary operations were dominant, though their relative importance shifted considerably across the period. Yet, BB remained the country’s largest commercial bank, holding between 40 and 70 percent of the entire system’s deposit base and private-sector credit portfolio between 1964 and 1985.Footnote 22
Evolution of Banco do Brasil (BB)’s assets and liabilities by function (share), 1965–85.

Figure 1 Long description
The image contains two stacked bar charts. The left chart represents assets and the right chart represents liabilities of Banco do Brasil from 1965 to 1985. Each chart is divided into categories: fiscal, commercial, foreign exchange, development and monetary. The x-axis shows the years from 1965 to 1985, while the y-axis represents the percentage share from 0 percent to 100 percent. The charts illustrate the changing proportions of each category over the years, with visible shifts in the dominance of different categories in both assets and liabilities.
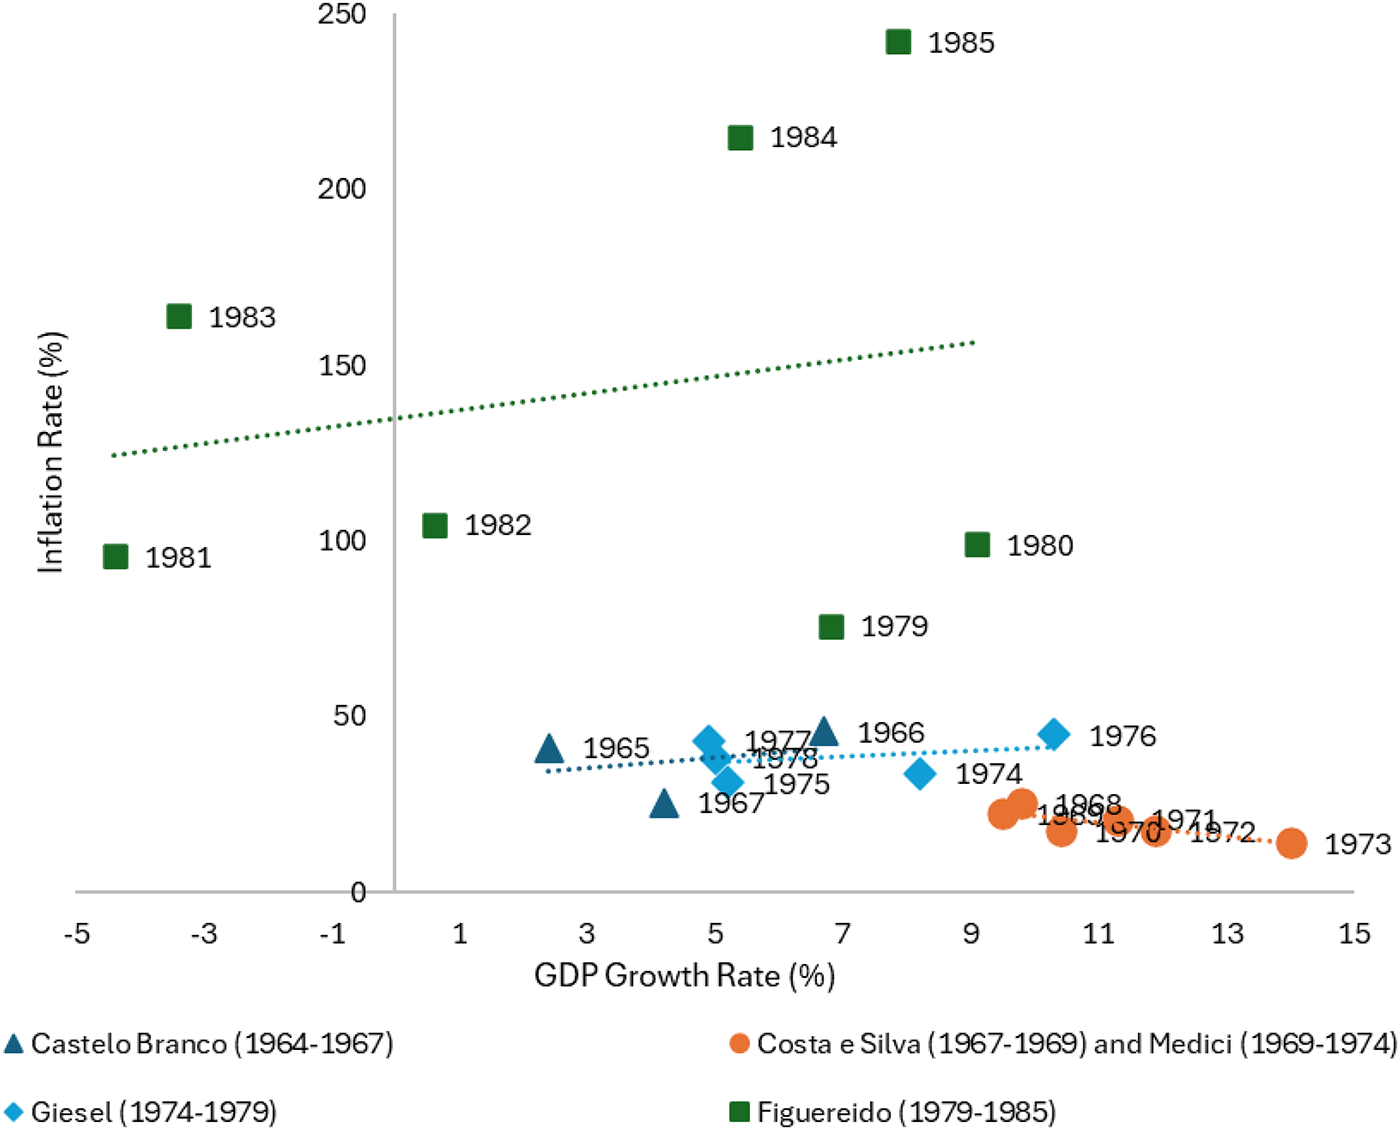
An additional analytical advantage of this approach is that it allows for examining how BB allocated and reallocated significant amounts of funds across the different financial sectors in which it operated. Looking at both sides of the balance sheet makes it evident that the accounting principle of strictly matching lending with its corresponding funding source was rarely observed. The gap between assets and liabilities within any given functional category, therefore, produces a net position—positive or negative, a distinction that is central to our analysis because it reveals where BB generated surplus resources and where it required cross-subsidization from other functions. For example, when liabilities associated with commercial banking exceed the bank’s commercial claims, a negative net position emerges, meaning that commercial operations generated surplus funds that could be deployed in other areas—such as fiscal, development, foreign exchange, or monetary functions. Conversely, when claims within a category exceed its liabilities, a positive net position indicates that the bank was a net supplier of funds in that sphere, which it financed by drawing on surpluses generated elsewhere. The remainder of the article examines how BB used this cross-functional capacity and policy toolkit, and the implications this had for Brazil’s broader macroeconomic performance and the shifting trade-off between stability and growth across different periods and administrations, as illustrated in Figure 2.
Relationship between inflation and growth rates, 1965–1985.

Figure 2 Long description
The scatter plot displays the relationship between inflation rate (percent) on the y-axis and GDP growth rate (percent) on the x-axis, covering the years 1965 to 1985. Data points are marked for different presidential terms in Brazil: Castelo Branco (1964-1967) represented by triangles, Costa e Silva (1967-1969) and Medici (1969-1974) represented by circles, Geisel (1974-1979) represented by diamonds and Figueiredo (1979-1985) represented by squares. The plot includes specific years labeled: 1965, 1966, 1967, 1973, 1974, 1975, 1976, 1979, 1980, 1981, 1982, 1983, 1984 and 1985. A dotted line indicates a trend across the years. The data points show varying inflation and GDP growth rates, with notable high inflation rates in the early 1980s and lower rates in the late 1960s and early 1970s.
3. A new architecture for stability and growth
In the first three years following the April 1964 coup, the military government of Castelo Branco introduced a series of adjustment measures and institutional reforms as part of a broad economic stabilization program.Footnote 23 Roberto Campos, appointed Minister of Planning, and Otávio Gouveia de Bulhões, Minister of Finance, led the administration’s economic team and became the main architects of the Government Economic Action Program, or PAEG. Reducing inflation—which had reached triple digits—was a main goal of the PAEG, adopting an approach that prioritized monetary restraint and fiscal discipline.Footnote 24 Its strategy centered on a gradual narrowing of the public-sector deficit, tighter control over private credit, and the stabilization of wages. The absence of a Central Bank was identified as a major institutional weakness in pursuing these goals, leading to the financial reform of December 1964, which created the BCB from the former Superintendency of Money and Credit (SUMOC). The same law also established the CMN as the governing body for monetary and credit policy, chaired by Bulhões as Minister of Finance along with Minister of Planning Campos, BB President Luiz de Moraes Barros (1964–1967), and six other members on the Board of Directors.Footnote 25
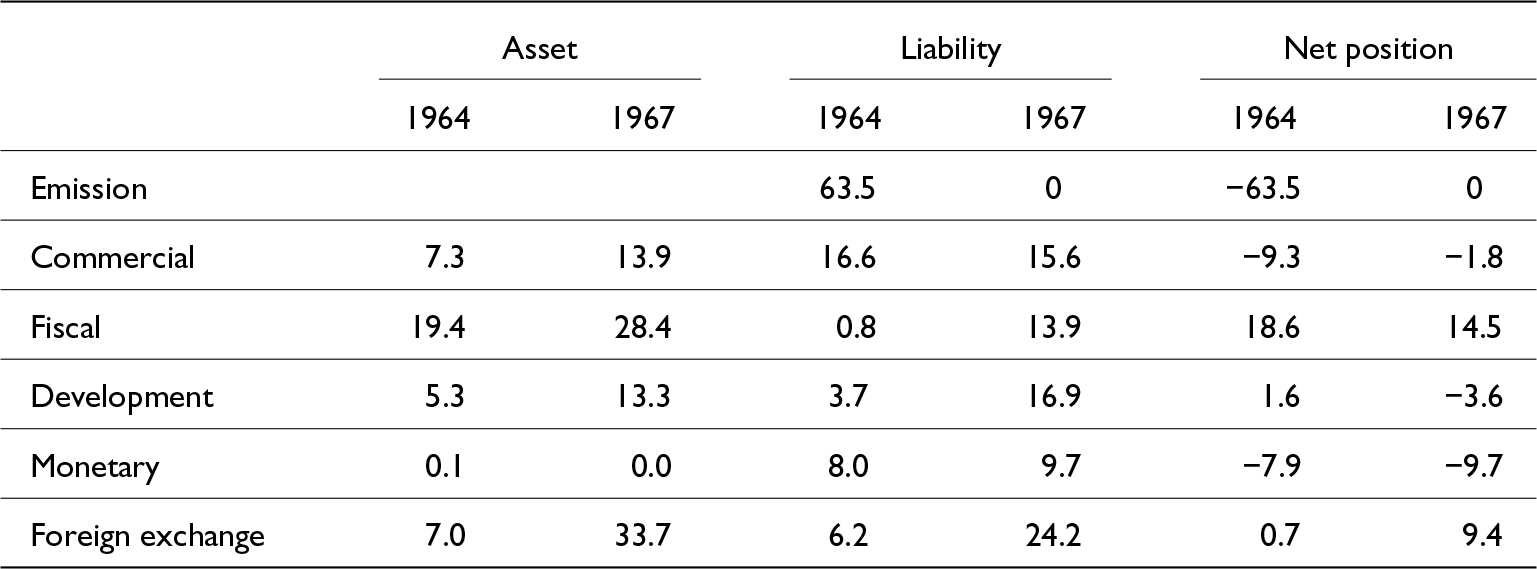
These reforms brought significant changes to BB, which, until then, had functioned as a de facto Central Bank along with SUMOC.Footnote 26 With the creation of the BCB, BB relinquished key functions such as currency issuance and lender-of-last-resort operations, yet it retained important responsibilities in monetary management, foreign exchange, fiscal transactions, and development finance.Footnote 27 The impact of these adjustments is clearly visible in its balance sheet, as shown in Table 2. In 1964, before the Central Bank’s establishment, the issuance of paper money accounted for 63.5 percent of BB’s total liabilities—equivalent to 12.6 percent of Gross Domestic Product (GDP)—, but this figure fell to zero by 1967, meaning the loss of its main funding source. Raising fiscal accounts, development programs, and hard-currency-related accounts partially compensated this fall, while commercial banking resources—mainly public deposits—represented 12–15 percent of BB’s funding base. Additionally, the BB–BCB internal account conta de movimento, initially created as an administrative mechanism to reconcile their daily transactions, evolved into a crucial fundraising instrument. By the end of 1965, it represented less than 4 percent of BB’s liabilities, but after a brief decline, it rose steadily in the last quarter of 1966, reaching 10 percent by the end of 1967 (approximately 1.8 percent of GDP).
BB’s balance sheet structure (percentage of total assets) in 1964 and 1967

Table 2 Long description
The table compares the balance sheet structure of BB in terms of percentage of total assets for the years 1964 and 1967, focusing on assets, liabilities, and net positions. Notably, foreign exchange assets increased dramatically from 7.0% in 1964 to 33.7% in 1967. Emission liabilities, which were 63.5% in 1964, fell to 0% by 1967, indicating a significant shift in financial strategy. Commercial assets and fiscal assets also saw increases, with commercial assets rising from 7.3% to 13.9% and fiscal assets from 19.4% to 28.4%. The net position for development changed from a positive 1.6% to a negative 3.6%, suggesting a potential area of concern. These changes reflect a strategic reallocation of resources and liabilities over the three-year period.
Source: See Methodological note (Appendix).
Significant changes also occurred in the bank’s asset composition and lending practices. Alongside the PAEG and the establishment of the BCB and CMN, the military government implemented a comprehensive set of financial reforms designed to boost domestic savings and expand credit on the basis of real financial intermediation rather than monetary issuance.Footnote 28 Within this framework, BB increased both commercial and development credit portfolios, notably through the Carteira de Crédito Agrícola e Industrial (CREAI), which continued to finance agriculture and industry while supporting the government’s stabilization efforts. By the end of 1967, commercial and development loans had grown from 1.5 and 1.1 percent of GDP in 1964 to 2.6 and 2.5 percent, respectively, also gaining weight within BB’s balance sheet. Importantly, the expansion of these lending lines was fully covered by corresponding commercial and development funding sources, and BB even maintained a negative net position in both categories. This outcome aligns with the principle of savings-based credit advanced by the Administration in pursuing price stability without entirely sacrificing growth.
Fiscal issues, and in particular the financial relationship between BB and the Treasury, were central to stabilization strategies. While reducing the fiscal deficit from 5.2 percent of GDP in 1963 to 3.2 percent in 1964 and further to 1.1 percent in 1966, the government introduced a series of additional changes that also redefined its financing mechanisms. Up to 1964, BB’s monetary issuance had been the main instrument for covering fiscal shortfalls, a pattern visible in the bank’s strong net position vis-à-vis the Treasury and the prominence of currency emission in its balance sheet (see Table 2). The introduction of Readjustable Obligations of the National Treasury (ORTNs) with the financial reform of 1964—an inflation-indexed medium-term domestic Treasury bondFootnote 29—opened a new funding channel by allowing the government to sell securities to the public that financed 55 percent of the fiscal deficit in 1965 and its entirety by 1966 (Lara Resende, Reference Lara Resende and de Paiva Abreu1990). The responsibility for managing the domestic public debt was transferred to the Central Bank, and BB was prohibited from lending directly to the Treasury to avoid further monetization of fiscal imbalances.
Nevertheless, BB continued to act as the government’s principal financial agent, and its exposure to the Treasury was not entirely eliminated. Fiscal claims remained the second-largest asset category on its balance sheet—amounting to roughly one-third of total assets—and did not show a meaningful decline during this period. The bank’s fiscal net position remained positive, albeit gradually declining by the end of 1967, and represented a form of floating Treasury debt amounting to roughly 2.7 percent of GDP. Moreover, despite the formal constraints on direct lending, an indirect mechanism for financing the fiscal deficit persisted through the conta de movimento. As contemporaries, officials and scholars emphasized, this account effectively functioned as an overdraft facility, permitting BB to freely and cheaply borrow from the Central Bank at its own discretion to meet its lending needs, thereby allowing for sustaining fiscal deficits while indirectly expanding the monetary base.Footnote 30 As shown in Table 2, the balance of the conta de movimento was equivalent to about two-thirds of BB’s net claims on the Treasury, and the remaining third was covered from the bank’s surplus in commercial and development activities, as discussed above.
Addressing balance of payments deficits was another key objective of the PAEG, and several measures, such as Instruction 289 (1965) and Resolution 63 (1967), were introduced to encourage foreign capital inflows and further develop foreign exchange transactions.Footnote 31 Foreign currency operations became indeed the most important activity of the BB during this period, representing a major shift in its balance sheet. The foreign currency portfolio increased from 7 to 33.7 percent of total assets between 1964 and 1967, becoming the largest asset category. Following the financial reform, the Central Bank assumed the responsibility for foreign exchange policy, capital controls, and the management of international reserves, but BB remained the key player in the foreign exchange markets.Footnote 32 Not only was it responsible for financing foreign trade through the Carteira de Comercio Exterior and managing foreign transactions for major exporters like Petrobras, Vale do Rio Doce, and the Coffee Institute, but it also continued to handle the government’s foreign exchange operations. Hard-currency assets were larger than their liability counterpart, meaning that the BB held net claims, although dropping from about 20 percent to less than 10 percent of its balance sheet between 1964 and 1967.
The outcome of the Castelo Branco administration’s stabilization program and the quasi-orthodox Campos–Bulhões approach was a sharp reduction in inflation with economic expansion. During their tenure, annual inflation declined from 84 percent in 1964 to around 41–45 percent in 1965–66, and further to 25.7 percent in 1967, while economic growth fluctuated between 2.7 and 6.7 percent (see Figure 2). The financial reforms and the reshaping of BB’s mandate were essential to these dynamics, as its operations both alleviated and sustained elements of the inflation–growth tension. On one hand, the loss of its money-issuing powers and the new restrictions on lending to the government reduced BB’s net claims on the Treasury, thereby easing—though not entirely eliminating—a major source of inflationary pressure linked to deficit monetization. On the other hand, the expansion of real-term commercial and development lending, coupled with increased reliance on the conta de movimento, sustained demand and monetary expansion, thereby fueling further inflationary tendencies. Overall, these financial reforms curtailed BB’s weight in the national economy: its assets fell from roughly 30.7 percent of GDP in 1964 to 18.9 percent in 1967, contributing to a broader reduction in inflationary pressures compared with previous years.
4. Inflation buffers in a high-growth economy
In March 1967, a new military administration came to power under President Marshal Costa e Silva, bringing with it a completely renewed cabinet and a distinct orientation on economic policy. After three years of unpopular stabilization measures and over half a decade of stagnated GDP per capita, the incoming government placed primary emphasis on economic growth. Antônio Delfim Netto was appointed Minister of Finance and advanced a more expansionary stance, claiming that the country could sustain “rapid development without increasing inflation.”Footnote 33 Hélio Beltrão, named Minister of Planning, launched the Programa Estratégico de Desenvolvimento (PED) in July 1967, which explicitly overturned the PAEG’s hierarchy of goals by placing accelerated development ahead of inflation control.Footnote 34 The new economic team’s more heterodox approach to stabilization was also evident in the introduction of price controls and the establishment of the Conselho Interministerial de Preços (Interministerial Price Council), rather than implementing tight monetary policies.Footnote 35
Delfim Netto remained a dominant figure at the Ministry of Finance throughout the subsequent administrations of Medici and Geisel, holding office until 1974.Footnote 36 Under his stewardship, the country experienced the so-called “Brazilian miracle,” a period of extraordinary economic expansion during which output grew at average annual rates exceeding 10 percent.Footnote 37 Following the conclusion of the PED in 1970, a new three-year economic plan, the Plano Nacional de Desenvolvimento, was launched in 1972 by the Ministry of Planning under João Paulo dos Reis Velloso, in office since 1969. The PND prioritized infrastructure development as a foundation for continued economic expansion, with a goal of keeping inflation below 20 percent. Credit expansion was a central piece of the economic program, growing at roughly twice the pace of output during these years, rising from about 20 percent of GDP in 1967 to 36 percent in 1970 and 48 percent in 1973.Footnote 38 Within this rapidly expanding financial and economic environment, BB was directed by Nestor Jost, who, like Delfim, had been appointed by Costa e Silva in 1967 and remained in his position as President of BB through the Médici and Geisel administrations. During his tenure, BB became not only central to credit policy,Footnote 39 but also to the broader monetary and fiscal management of the economic miracle years.
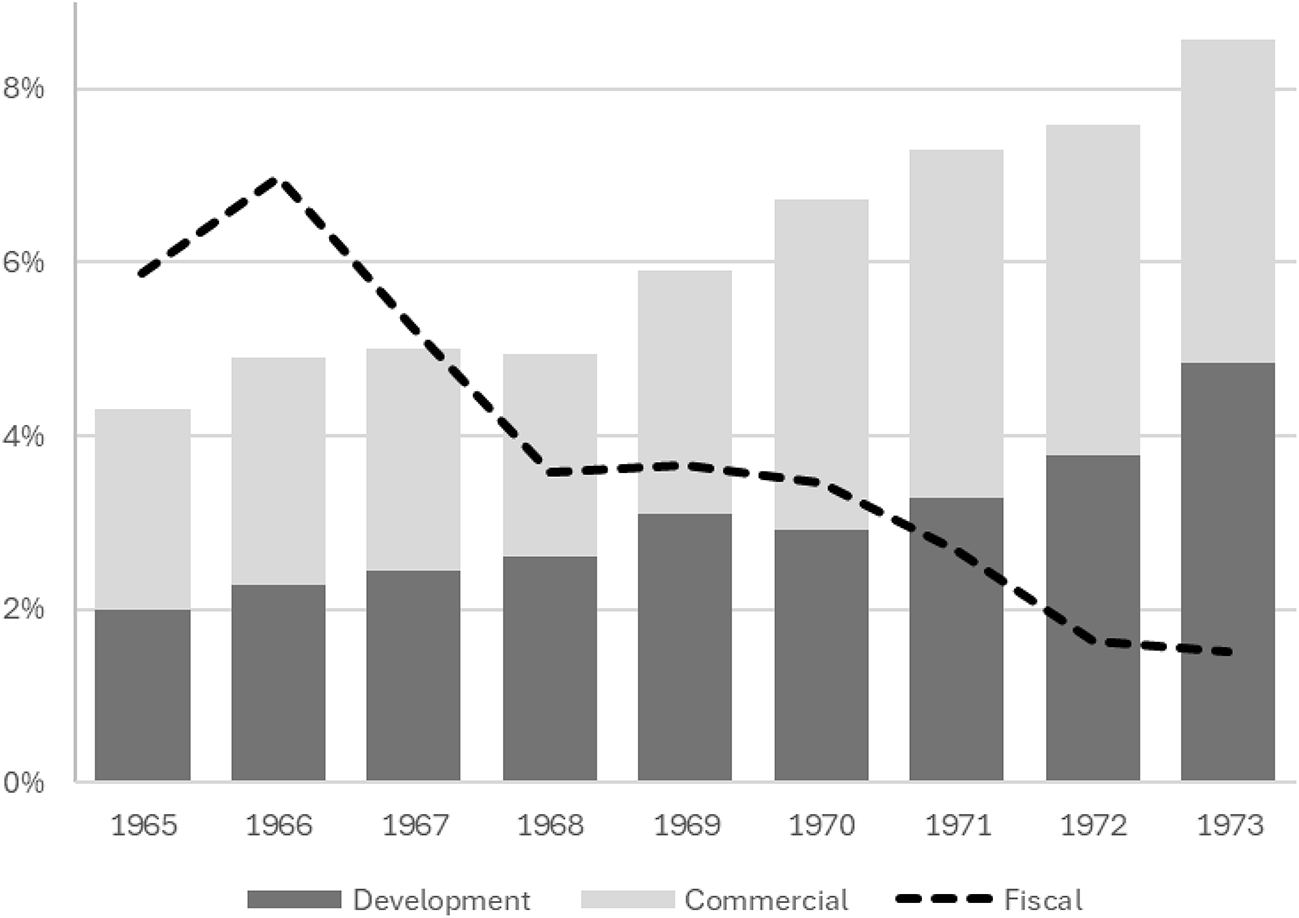
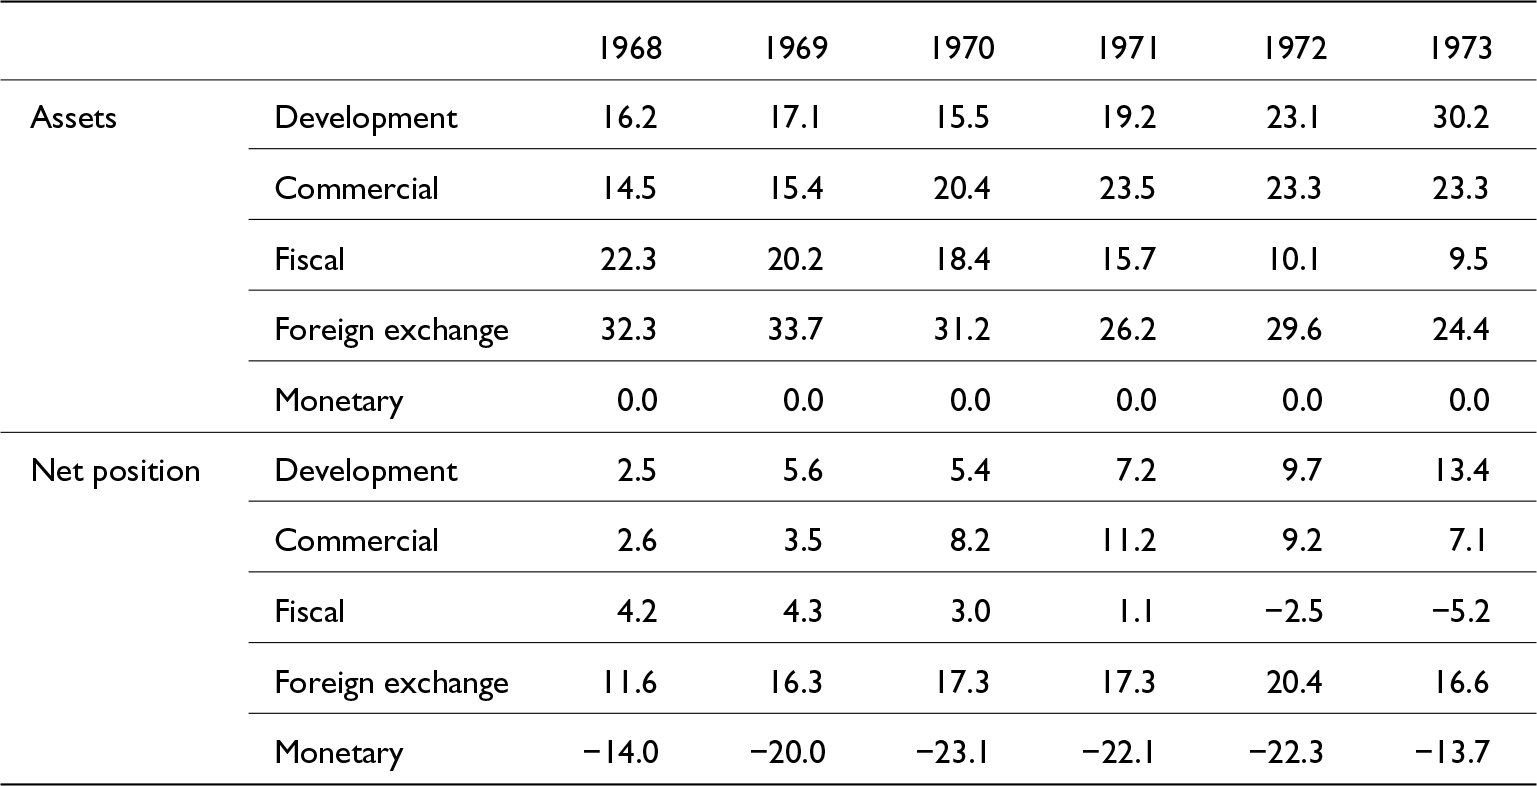
An examination of BB’s evolving lending portfolio underscores its alignment with Brazil’s national development strategy and rapid economic expansion. While the development and commercial lending portfolio as a share of GDP had oscillated 4–5 percent between 1965 and 1968, it steadily grew up to 8.6 percent by 1973 (see Figure 3). BB’s growing engagement in financing the economic miracle is reflected in a reorientation of its intermediation activities and a significant transformation in its balance sheet structure. Between 1967 and 1973, commercial and development lending doubled to 27.7 percent of total assets and then tripled to 53.5 percent by 1973. From 1968 onward, BB’s net position in both categories turned negative, indicating that its corresponding funding sources no longer fully covered its lending, and part of this expansion was financed through other internal resources. By the end of 1973, development loans had become the bank’s largest asset category, followed by commercial and foreign exchange operations (see Table 3). The rising prominence of development lending within BB’s portfolio mirrored the industrialization priorities embedded in the PND and in Delfim Netto’s broader economic agenda.Footnote 40
BB development, commercial, and fiscal portfolio as a share of GDP, 1965–73.

Figure 3 Long description
The graph shows a combination of bar and line graphs depicting the development, commercial and fiscal portfolio as a share of GDP from 1965 to 1973. The x-axis represents the years from 1965 to 1973, while the y-axis represents the percentage share of GDP, ranging from 0 percent to 8 percent. The bars are divided into two segments: development and commercial. The development segment is shown in a darker shade, while the commercial segment is in a lighter shade. A dashed line represents the fiscal portfolio. In 1965, the total share is around 4 percent, with a slight increase in 1966. The fiscal line peaks in 1966 and then declines steadily until 1973. The development and commercial segments show a gradual increase over the years, with the total share reaching its highest in 1973 at over 8 percent.
BB’s balance sheet structure (percentage of total assets) in 1968 and 1973

Table 3 Long description
The table measures BB's balance sheet structure as a percentage of total assets from 1968 to 1973. Development assets increased significantly from 16.2% in 1968 to 30.2% in 1973, indicating a shift towards development-focused investments. Commercial assets also grew, peaking at 23.5% in 1971, while fiscal assets saw a notable decline from 22.3% in 1968 to 9.5% in 1973. Foreign exchange assets fluctuated, peaking at 33.7% in 1969 before settling at 24.4% in 1973. Monetary assets remained at zero throughout the period. The net position shows development assets increasing from 2.5% to 13.4%, while fiscal assets turned negative by 1973, indicating potential financial challenges. These trends suggest a strategic shift in asset allocation over the years.
Source: See Methodological note (Appendix).
Notably, assets allocated to Treasury operations significantly declined during this period. The weight of fiscal-related claims dropped from 5.2 percent of the GDP in 1967 to 1.5 percent in 1973 (see Figure 3). In terms of BB’s overall business volume, these operations dropped from 33 percent of total assets at the end of 1967 to 10 percent in 1973—equivalent to a real decline of 41.3 percent. Moreover, as shown in Table 3, from the early 1970s, the BB’s financial relation with the Treasury shifted from being a net lender to a net borrower. By 1973, the bank’s liabilities to the Treasury exceeded its claims by about 10 percentage points of total assets. This reversal indicates not only that the Treasury reduced and eventually eliminated the floating debt it had previously owed to BB, but that it also came to maintain a positive balance, which the bank could then draw upon to support the expansion of its assets in other categories.Footnote 41 It is worth noting that the government had by then relaxed its fiscal stance, allowing the public deficit to rise from around 1.5 percent of GDP in 1968–1971 to 3.7 and 4.8 percent in 1972 and 1973, respectively. This does not imply, however, that BB was financing the Treasury or monetizing the public deficit through indirect mechanisms—particularly the conta de movimento as discussed below—as it is acting as a net lender to the bank.Footnote 42
Foreign borrowing in international capital markets was another defining feature of Brazil’s development strategy during the milagre econômico, and BB also played a significant part in this process. Between 1968 and 1973, when a considerable amount of capital flew into Brazil and the country’s international reserves soared, BB’s net hard-currency claims rose from less than 10 percent of its balance sheet to nearly 20 percent in 1971, fluctuating slightly below that level in the following years. Although both foreign exchange assets and liabilities declined as shares of the bank’s balance sheet over the period, liabilities contracted more sharply, thereby widening the bank’s net creditor position. Given BB’s relatively limited net claims on the Treasury and its increasing deficits in commercial and development funding sources toward the end of the period, the question arises as to how it sustained this position and expanded its foreign currency assets. The answer lies in its operations through the conta de movimento with the Central Bank.
Table 3 traces the evolution of the conta de movimento and BB’s net claim position on foreign exchange transactions as shares of its balance sheet. The data reveal a marked increase in BB’s reliance on liquidity through the conta, whose share of total liabilities rose from about 10 percent at the outset of the period to roughly 21–22 percent between 1970 and 1972. This expansion indicates that BB gained increasing access to these additional monetary resources from the Central Bank. Yet, contrary to the widespread interpretation in the historiography, this mechanism does not appear to have primarily served the purpose of financing the Treasury or monetizing fiscal deficits. Instead, the evidence suggests that, during the years of the economic miracle, the resources drawn from the conta were largely directed toward expanding BB’s foreign exchange portfolio and managing the inflow of hard currency associated with external borrowing and capital inflows. Given BB’s role in administering Brazil’s foreign exchange market, the conta appears to have operated as a buffer instrument, absorbing liquidity when needed and providing resources to smooth currency operations. Any remaining resources beyond those required for foreign exchange management may have been channeled into the expansion of commercial and development lending.
A striking outcome of the Brazilian economic miracle is that, during a seven-year period of double-digit growth with the money supply expanding at more than 30 percent annually and a more expansionary wage and fiscal policy operating within an indexed economy, inflation did not spiral out of control. Instead, it declined steadily, reaching its lowest levels in over two decades (see Figure 2). Wage controls and the alleged manipulation of price indexes may, of course, have contributed to this result. Yet, in a context marked by an incipient secondary market for Treasury bills and the Central Bank’s limited capacity to conduct open-market operations, the use of funds from the conta de movimento to absorb the massive inflow of foreign exchange associated with external indebtedness appears to have served as an effective mechanism to mitigate inflationary pressures, a mechanism that deserves further investigation. Additionally, the sharp reduction in BB’s claims on the Treasury and the channeling of public sector deposits and fiscal resources toward commercial and development lending—rather than direct public spending—may also have contributed to easing inflationary pressures, allowing inflation to stabilize, or even decline, amid strong economic growth.
5. Anchor strains and the limits of developmentalism
On March 15, 1974, following his appointment by the Military Command and approval by Congress, Ernesto Geisel assumed the presidency. Delfim Netto was replaced by Mário Henrique Simonsen at the Ministry of Finance, while João Paulo dos Reis Velloso continued to lead the Ministry of Planning. At BB, Ângelo Calmon de Sá had taken office two weeks earlier and would remain until 1977, when he was succeeded by Karlos Rischbieter for the final phase of the Geisel administration. The incoming government faced a new international and domestic macroeconomic and financial environment, shaped by global oil shocks and sovereign lending, which heightened the risk of inflationary expansion.Footnote 43 The tensions between stabilization and development reemerged, influencing the economic agenda and differing policymaking approaches within the economic team.
The stability–growth trade-off crystallized into a divide between the Ministers of Finance and Planning. In particular, this rift widened after the government’s defeat in the 1974 legislative elections, held amid Geisel’s abertura, as legitimacy increasingly hinged on economic outcomes.Footnote 44 While Simonsen adopted a more conservative stance, favoring fiscal restraint and tighter monetary control, Velloso represented continuity with the expansionary policies of the milagre econômico. Ultimately, Velloso’s approach prevailed: rather than pursuing austerity, the government reaffirmed its growth ambitions under his leadership with the launch of the Second National Development Plan (PND II) in 1975, the last and most comprehensive economic plan of the developmentalist cycle, with a target growth rate of 10 percent per year.Footnote 45 Yet as inflation, which had fallen to a period low of 14 percent in 1973, rose to 33.8 percent in 1974 and remained elevated thereafter, internal debates within the government underscored a deepening dilemma: how to finance large-scale investment without reigniting inflationary pressures or undermining external stability? BB once again embodied this duality, and its intervention raised the possibility of acting both as a channel for directed credit to strategic sectors and as a potential source of monetary expansion through its operations.
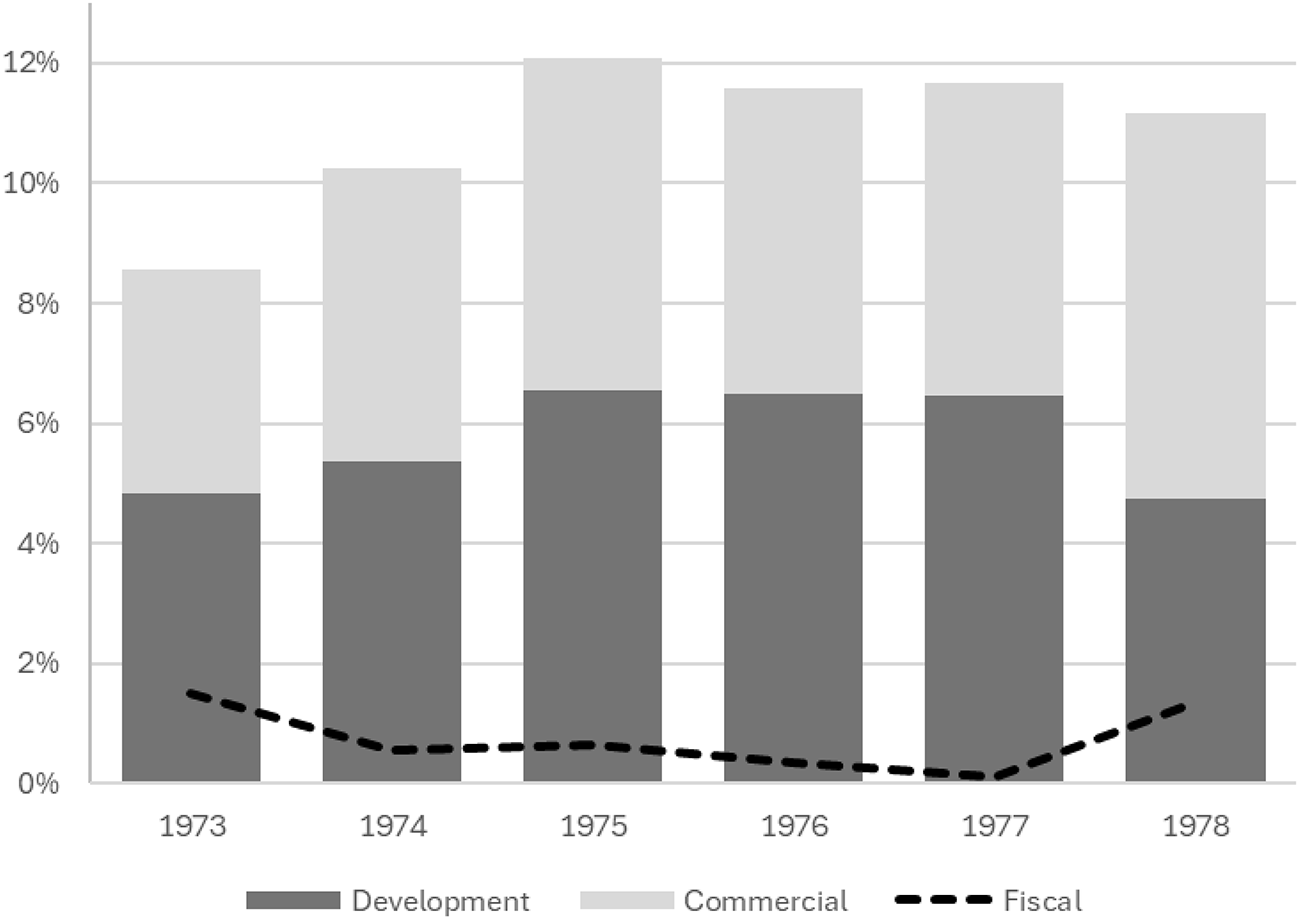
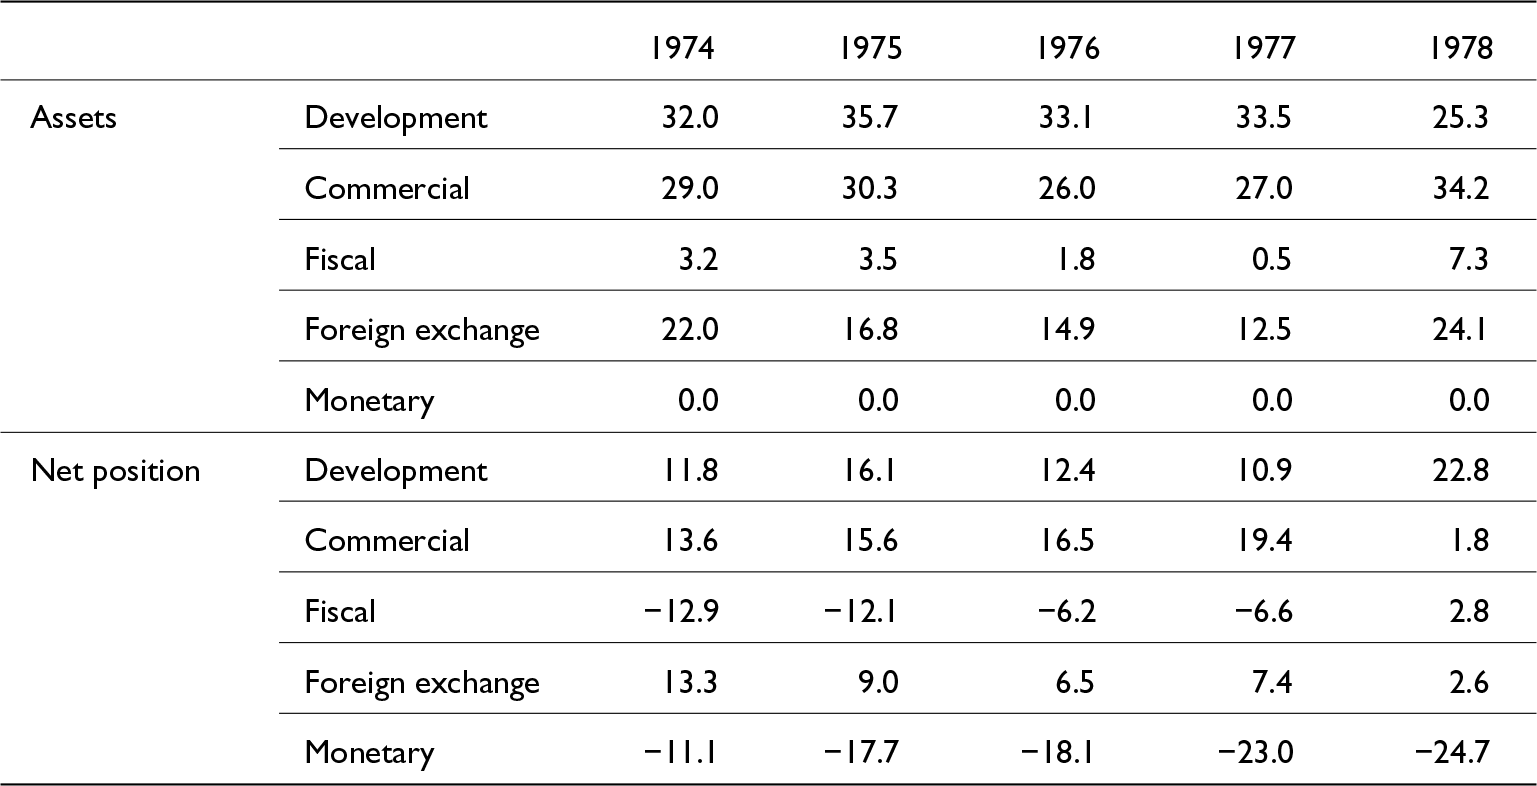
Figure 4 highlights the growing importance of BB’s credit during this period. The bank’s development and commercial lending portfolios, which had already expanded during the economic miracle, continued to rise, reaching 12 percent of GDP in 1975 and remaining slightly below that level in subsequent years. On BB’s balance sheet, these two categories together accounted for roughly two-thirds of total assets, declining somewhat thereafter but still representing about 60 percent by the end of 1978.Footnote 46 Since development and commercial funding sources did not expand at the same pace as their corresponding assets, BB’s net position in both categories not only remained positive but actually widened. As the bank’s net liabilities to the Treasury declined, the additional resources sustaining this expansion in lending came primarily from the conta de movimento. Indeed, as Table 4 shows, BB’s reliance on the conta as a source of funding steadily increased throughout the period, rising from around 11 percent of total liabilities in 1974 to as much as 25 percent in 1978.
BB development, commercial, and fiscal portfolio as a share of GDP, 1973–78.

Figure 4 Long description
A stacked bar chart displays the development, commercial and fiscal shares of GDP from 1973 to 1978. The y-axis represents the percentage of GDP, ranging from 0 percent to 12 percent. Each year from 1973 to 1978 is represented on the x-axis. The bars are divided into three segments: development, commercial and fiscal. Development and commercial segments are shown as solid sections, while the fiscal segment is represented by a dashed line. The chart illustrates changes in the proportions of these categories over the years, with development and commercial segments generally occupying larger portions of the bars compared to the fiscal segment.
BB’s balance sheet structure (percentage of total assets) in 1974 and 1978

Table 4 Long description
The table measures the percentage of total assets and net position for various asset categories from 1974 to 1978. Development assets decreased from 32% in 1974 to 25.3% in 1978, while commercial assets increased from 29% to 34.2% over the same period. Fiscal assets showed a significant increase in 1978, reaching 7.3% from a low of 0.5% in 1977. Foreign exchange assets fluctuated, peaking at 24.1% in 1978. The net position for development assets improved significantly in 1978, reaching 22.8%, while the monetary net position consistently showed negative values, worsening to -24.7% in 1978. These trends indicate a shift in asset allocation and net positions over the years, with notable changes in commercial and fiscal categories.
Source: See Methodological note (Appendix).
Foreign-currency activities continued to feature prominently in BB’s balance sheet, albeit under significant managerial changes. Most notably, the positive net position the bank had built in foreign-exchange-related transactions during the previous period began to reverse, declining from 16.6 percent of the balance sheet in 1973 to 6.5 percent in 1976 and 2.6 percent in 1978. This contraction stemmed primarily from the fall in hard-currency claims, which dropped from about one-quarter of the balance sheet in 1973 to less than one-tenth by the third quarter of 1978. But also the opposite movement occurred on the liabilities side, which rose from 2 to 8 percent in 1973 onwards. In a context where Brazil’s external accounts and balance of payments sharply deteriorated following the 1973 oil shock, these developments suggest that the bank actively liquidated its hard-currency assets to meet rising demand for foreign exchange. The rise in the corresponding liabilities indicates greater hard-currency borrowing, which likewise points to efforts to support the balance of payments. Indeed, as recent research has shown, through its intermediation in Brazil’s intense external borrowing during the petrodollar lending boom, BB played a crucial role in managing the country’s mid-1970s external imbalances, helping to avoid a currency crisis or IMF assistance.Footnote 47
Regarding its fiscal function, BB continued to act as a net borrower from the Treasury throughout most of this period. After peaking at 14–15 percent at the end of 1974 and early 1975, the bank’s reliance on Treasury funding declined and remained below 10 percent until the end of 1978, driven by a shrinking share of liabilities rather than an increase in credit, shifting to a negative balance for the first time in more than seven years. Overall, the bank’s assets with the Treasury continued their long-term downward trend up to 1977, when they reached just 0.1 percent of GDP (see Figure 4). On the balance sheet, these assets had fallen from 35 percent in 1967 to 10 percent in 1973, and continued to decline to 3.2 percent in early 1975, fluctuating between 0.5 and 6 percent in subsequent years. On the other hand, liabilities to the Treasury, which had made up 15 to 20 percent of the balance sheet since 1970, dropped to 10 percent in 1976 and stabilized at that level thereafter. At the government level, the fiscal deficit significantly increased during this period, rising from 4.8 percent of GDP in 1974 to a peak of 11.6 percent in 1976, before declining to 3.3 percent in 1978. Yet the Federal deficit does not appear to have been financed through BB, as Table 4 shows that the Treasury maintained a persistent, though shrinking, positive balance with the bank, which eventually turned negative in 1978 as fiscal assets began to rise again.
The conta de movimento underwent significant changes in its performance and use during this period. Following the peak of 22–23 percent of total liabilities in 1972, its contribution as a funding source began to decline, reaching a low of 7.7 percent in mid-1975, before sharply reversing and growing to become the bank’s largest liability category by the end of 1978, accounting for a quarter of its resources (see Figure 1 and Table 4). Unlike the previous period, when the bulk of funding from the conta was directed towards improving BB’s net position in foreign-currency operations, it was now primarily allocated to commercial and development lending, which became the major net recipients of bank resources. On the other hand, the bank’s net fiscal and foreign-exchange positions, each accounting for about 6–8 percent of the balance sheet between 1976 and 1978, were generally balanced against each other. The shift in the use of the conta towards increasing lending, especially commercial credit, rather than absorbing the renewed inflow of foreign exchange since 1976, may have contributed to inflationary pressures. In terms of GDP, the amount of money created through the conta rose from 1–1.5 percent between 1971 and 1974 to 4 percent in 1977.
Under Geisel, the economic trajectory departed from that of previous administrations, as continued growth gave way to a surge in inflation. The price level, which had been declining since 1966 throughout the economic miracle years, reverted to its trend (see Figure 2). In 1974, the inflation rate more than doubled with respect to 1973, closing at 33.8 percent per year and oscillating in the range of 30 and 45 percent between 1975 and 1978, its highest levels since the stabilization program of Castelo Branco. With an economy still growing at high rates of 7 percent per year on average and increasing fiscal deficits, the policy tools and financial intermediating activities performed by BB were most likely exacerbating the tension between growth and monetary stability. In relative terms, while the monetary supply expanded at rates ranging between 33.5 and 43.5 percent between 1974 and 1978, the balance of the conta de movimento grew 149.7 percent annually in 1975, over 80 percent in 1976 and 1977, and 58.5 percent in 1978. Moreover, from 1973 through the end of 1978, the real value of the conta increased 3.5 times and was 20 percent larger than the monetary base. Unlike in its previous height of 1972, when its volume was about half the monetary base, BB was now creating more money than the Central Bank and becoming a significant driver of inflation.
6. Financial crash and reform
In March 1979, João Baptista Figueiredo assumed the presidency of Brazil, becoming the last military leader to govern the country since the 1964 coup. His administration marked a decisive break from the preceding years of rapid expansion, as Brazil entered a period defined by severe international shocks and mounting domestic difficulties, ending more than a decade of high growth. The second oil shock of 1979, which doubled global petroleum prices, together with the sharp rise in international interest rates following the Volcker shock in the United States, dealt a heavy blow to Brazil’s economy and external accounts. By 1981, Brazil faced its first recession in over twenty years, just as the world slid into the first postwar global debt crisis. When international capital markets closed to developing countries after Mexico’s default in August 1982, Brazil was unable to service its external debt and turned to the IMF for financial assistance for the first time in a decade. The ensuing currency crisis of 1983 and incipient “lost decade” of the 1980s set the stage for the return of democracy, along with a monetary reform that redefined BB and BCB financial roles.
Figueiredo’s cabinet and policymaking approach shifted in response to the turbulence the country faced. Simonsen, initially appointed Minister of Planning, resigned after only five months amid resistance to his adjustment program and was succeeded by Delfim Netto, who first pursued an expansionary strategy reminiscent of his earlier tenure, before later adopting contractionary measures.Footnote 48 Karlos Rischbieter, who had been heading BB, was appointed Minister of Finance and, in 1979, was temporarily replaced by Márcio Fontes until the nomination of Ernane Galveas later in 1980. The Galveas–Delfim Netto duo remained in charge of the Finance and Planning ministries until the end of the Figueiredo government. Meanwhile, Oswaldo Roberto Collin succeeded Rischbieter as President of BB and remained in office until the transition to José Sarney’s democratically elected administration in March 1985. During this period of abertura and deepening economic and financial crisis, BB embodied the contradictions and difficulties of economic policymaking in the government, serving both as a source of instability and as a key political instrument to contain discontent.Footnote 49
Under Figueiredo, BB’s balance sheet once again became a mirror of the government’s goals and changing priorities along with the differing views within its economic team. As the prospects of a crisis loomed, a series of adjustment measures were introduced—first by Simonsen in 1979 and later also by Delfim Netto—including lending ceilings designed to curb domestic credit expansion in 1980 and 1981. Within this context, BB’s lending to the private sector, which had grown by 51.7 percent in real terms during the years of the PND II (1975–1979), contracted by 12.4 percent in 1980 and by 20.6 percent in 1981. The expiration of PND II and the subsequent policy shifts prompted a reassessment of agricultural development lending, leading to the termination of subsidized credit programs and the closure of BB’s CREAI (Vidotto, Reference Vidotto1995).Footnote 50 Indeed, BB’s development and commercial loan portfolio, which had expanded steadily during the previous decade, contracted sharply from 10 percent of GDP in 1980 to 7.7 percent in 1982.
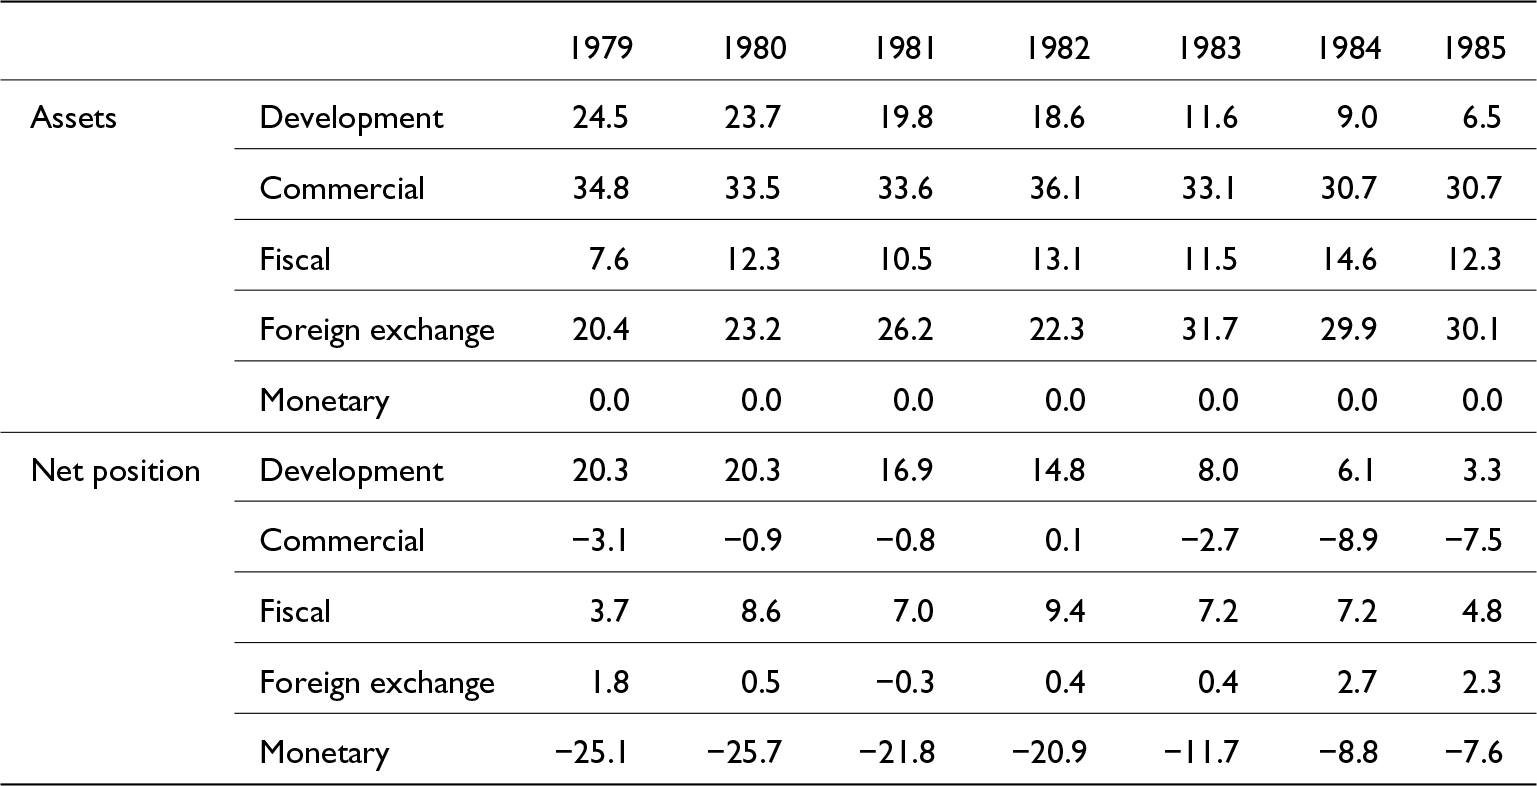
As with Geisel administration, BB had a key role in foreign exchange markets and the management of external imbalances. Between 1979 and 1982, when Brazil’s international reserves plummeted from US$ 11.9 to US$ 3.9 billion and BB interceded with balance-of-payments financing,Footnote 51 its balance sheet underwent significant transformations. The net positive position in hard-currency operations, which had been around 8 percent of the balance sheet from 1976 to 1978, dropped to zero by 1980 and turned negative by 1981. Notably, this shift was not due to a reduction in the bank’s foreign currency assets, which had already declined to just 12.9 percent of the balance sheet by 1977 because of the previous crisis, leaving little room for further liquidation to meet foreign exchange demands. Instead, BB responded by increasing its external borrowing, with foreign exchange-related liabilities rising from about 8 percent of the balance sheet in 1971–1977 to 21 percent in 1978–1980, and reaching 26.6 percent in 1981. These changes in the balance sheet structure, with foreign exchange transactions also increasing its share of assets, as shown in Table 5, underscore the bank’s deepening involvement in the foreign exchange markets during this period of crisis.
BB’s balance sheet structure (percentage of total assets) in 1979 and 1985

Table 5 Long description
The table presents the percentage of total assets for different categories in 1979 and 1985. Development assets saw a notable decline from 24.5% in 1979 to 6.5% in 1985, while foreign exchange assets increased from 20.4% to 30.1% over the same period. Commercial assets remained relatively stable, fluctuating slightly around 30%. The net position for development assets also decreased significantly, while the monetary net position was consistently negative, indicating a persistent deficit. Fiscal assets and net positions showed moderate fluctuations, with fiscal assets peaking in 1983. The data suggests a shift in asset allocation, with a growing emphasis on foreign exchange and a reduction in development assets.
Source: See Methodological note (Appendix).
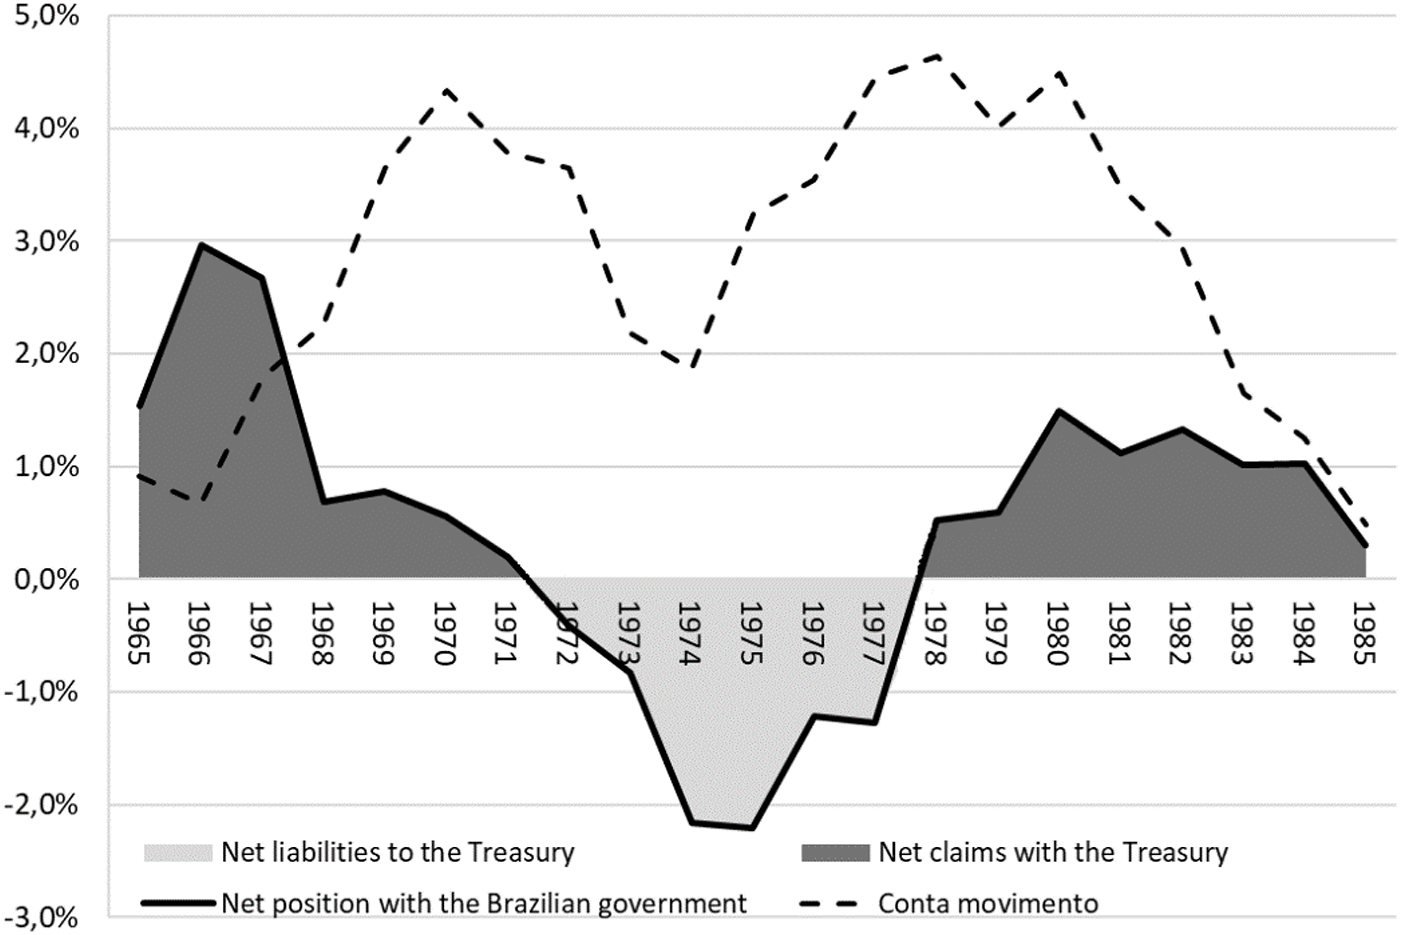
Another significant macroeconomic change involved the fiscal position and BB’s financial relationship with the Treasury. With worsening external debt pressures and public finances, BB’s financial position with the Treasury switched. As shown in Figure 5, after six years of negative balance, where the Treasury had deposited more funds into the bank than it withdrew, the situation reversed in 1978, and the government became a net borrower. By the end of 1982, the Treasury’s floating debt with BB reached US$ 380 million, equivalent to an additional 15 percent on top of the Federal government’s fiscal deficit of about US$ 26.478 billion.Footnote 52 From 1979 to 1985, the bank held a net positive position with the public sector, an amount ranging between 0.3 and 1.5 percent of GDP, decreasing toward the end of the period. On the bank’s balance sheet, fiscal assets grew from 5 percent in early 1979 to 15 percent by late 1980, stabilizing between 10 and 15 percent thereafter, while obligations to the Treasury remained at around 5 percent of liabilities.
Evolution of BB net position with the Brazilian government as a share of GDP, 1965–85.

Figure 5 Long description
A line graph showing the net position with the Brazilian government from 1965 to 1985. The x-axis represents the years from 1965 to 1985 and the y-axis represents the percentage of GDP, ranging from negative 3.0 percent to positive 4.0 percent. The graph includes four lines: net liabilities to the Treasury, net claims with the Treasury, net position with the Brazilian government and Conta movimento. The net position line shows a decline from 1965, reaching a low around 1973, then rising again until 1985. The Conta movimento line fluctuates throughout the period. The shaded area represents the net claims with the Treasury, which increases after 1978.
The uses of the conta de movimento also altered significantly to accommodate the new macroeconomic context and the evolving role of the bank. In 1978, the conta represented approximately 4.6 percent of GDP, or a quarter of BB’s funding base. It then grew to nearly 30 percent of the balance sheet in 1979 and remained just below that level through 1980, before beginning a downward trend, reaching 20 percent in 1982 and 1983 before its progressive elimination with the monetary reform of the mid-1980s. Fiscal claims accounted for just 15 percent of BB’s total assets, but they became the primary destination for BB’s net funding. Figure 5 illustrates how the expansion of the conta moved along with the Treasury’s deteriorating fiscal position with the bank. Meanwhile, development lending steadily declined, falling from 35 percent of total assets in 1977 to 20 percent in 1981 and just 7 percent in 1985, a drop that was not offset by increased commercial credit, which remained stable at 30–35 percent and was largely financed through commercial liabilities. With hard-currency transactions balanced on both sides of the balance sheet, the conta was to primarily finance fiscal activities, and to a lesser extent, commercial lending.
These transformations of BB’s activities contributed to intensifying inflationary pressures. Unlike during the economic miracle, when the bank played a key role in supporting high growth with decreasing inflation, it has now become an autonomous driver of monetary instability, distorting the balance between growth and inflation. Despite contractionary measures introduced since 1979 and the sharp 1981 recession, which saw the worst industrial contraction in the post-war era,Footnote 53 annual inflation rates escalated to a new baseline, reaching triple-digit levels throughout the 1980s (see Figure 2). The conta de movimento, which by 1978 was already larger than the monetary base, expanded rapidly in the lead-up to the debt crisis, doubling the monetary base by the end of 1982, and remained elevated until mid-1984. By this time, the BCB was effectively providing BB with an overdraft facility far exceeding the total national volume of cash in circulation, equivalent to about half of national cash plus bank deposits. Moreover, as money from the conta was increasingly channeled to the Treasury, BB was effectively monetizing a portion of the fiscal deficit as many scholars have argued, thereby further fueling inflation through indirect money creation.
As the crisis deepened and renegotiations with the IMF and international creditors progressed, attention turned to controlling inflation, sparking debates over monetary and banking reforms. BB came under scrutiny, particularly the conta de movimento, which many called for eliminating as early as 1983.Footnote 54 With monetary reforms implemented between 1984 and 1986, aimed at redefining central banking practices and responsibilities, the bank’s role in federal economic policy was progressively curtailed. The conta de movimento itself began a process of deactivation and was finally frozen as part of the 1986 monetary reforms.Footnote 55 By then, it still accounted for 9 percent of total liabilities, but BB no longer held its unique position in development financing, and the importance of foreign currency transactions was diminishing. The declining weight of the conta in the bank’s funding was offset by a shift towards reliance on commercial deposits. By the time of the 1986 reforms, BB had already transitioned from a multifaceted institution with shifting involvement in development, commercial, fiscal, and monetary functions to primarily a commercial bank, a business profile further consolidated during the 1990s and still its main activity today.
7. Conclusions
This article has examined BB’s role in Brazil’s macroeconomic trajectory during the Military Regime (1964–1985). Whereas previous research has tended to focus on specific dimensions of the bank’s activity—particularly its relationship with the Treasury and its role in balance-of-payments management—we have shown that BB functioned as a multipurpose policymaking institution. Its influence was therefore far more extensive, complex, and nuanced than previously assumed. As an integral component of Brazil’s macroeconomic, financial, and political governance, BB occupied a distinctive institutional position, making it a crucial actor within the developmental state model.
BB was far from a passive, monotonous, or merely destabilizing institution operating in the background of Brazil’s macroeconomic environment. Its intermediation activities, business structure, and the sheer size and scope of its operations gave it a distinctive place in Brazil’s political economy. Indeed, BB acted as a major financial force in its own right. Policy-defined instruments available exclusively to the bank enabled it to support federal objectives in ways no other domestic financial institution could. By adapting its balance-sheet structure to changing state priorities, BB mediated the recurrent tension between stability and growth that lay at the heart of Brazilian economic policy. At times, its operations intensified this trade-off; at others, they helped make these goals more compatible. In fact, BB did not simply respond to the macroeconomic environment in which it operated but also helped shape that environment, influencing outcomes related to growth, inflation, and exchange-rate management. More broadly, its trajectory shows how competing economic and political visions—about inflation control, development, and the uses of state finance—were translated into concrete mechanisms, instruments, and flows of resources. These changes in BB’s operations provide a lens into the internal diversity of military rule and the different approaches successive governments adopted to navigate domestic and global challenges.
These findings shed new light on the management of Brazil’s monetary policy and the institutional innovations that emerged during the country’s developmental process. In particular, the dynamics between the conta de movimento and BB’s foreign-currency portfolio during the Miracle Years reveal that, as external debt expanded, the account was not primarily used to finance the Treasury—which, in fact, held larger deposits at BB than debts to it—but instead served to absorb the surge of foreign-loan inflows. Two factors help explain why monetary authorities relied on BB’s conta de movimento rather than more conventional sterilization instruments. First, although legally prohibited from lending directly to the Treasury, BB itself placed and redeemed ORTNs since their introduction in 1964, providing an alternative mechanism to sterilize liquidity while offering attractive returns. Second, from their introduction in 1970 onward, LTNs underpinned the emerging secondary securities market and became the BCB’s tool for short-term public debt operations and open-market policy. While the choice between these instruments may reflect differences in effectiveness and/or costs, it may also signal a deeper institutional coordination problem, given that the BB and BCB shared the responsibility for foreign-exchange management and public bond operations. These issues highlight critical gaps in our understanding and call for further research.
Another important line of inquiry concerns the political dimension of BB’s role. In Democracia Negociada: Política Partidária do Brasil da Nova República (2024), Leonardo Weller and Fernando Limongi argue that negotiation and compromise between conservative and progressive political forces were central to Brazil’s democratic transition and to the functioning of subsequent governments. They show that power-sharing among rivals was key to policymaking and political stability during the Nova República in the 1990s and 2000s. However, their analysis focuses on democratic governance, a similar logic operated within the Military Regime. Two factions—the castelistas (Castelo Branco, later Geisel and Figueiredo) and the linha-dura (Costa e Silva and Médici)—coexisted by negotiating the distribution of cabinet posts. While they primarily disagreed over political openness versus authoritarian control, power-sharing within the cabinet also balanced differing economic priorities: more orthodox preferences for stability and more heterodox demands for growth. As this article shows, BB stood at the center of this balancing act, which helps explain why BB emerged as central to mediating political and economic tensions.
Finally, while this article focused on the macroeconomic and policy forces shaping BB’s activities, microeconomic dynamics remain underexplored. How did inflation affect BB’s portfolio decisions, risk management, and profitability? To what extent did BB—and other commercial banks—benefit from the well-known arbitrage between non-indexed deposits and high-yield overnight lending? The Brazilian banking sector experienced unusually high profits during this period, and BB was no exception. As its 1984 and 1986 Annual Reports make clear, BB’s priorities centered not on shareholder value but on executing government policy. Yet the bank was hardly passive. By the end of 1979, whether through strategic foresight, institutional constraints, or simple adaptation, it shifted its asset and liability structure toward more conventional commercial banking. This reorientation did not weaken its standing. On the contrary, as its policy role narrowed, BB leveraged its long-standing institutional stature—built over nearly two centuries as the state’s primary financial arm—to consolidate its status as the country’s most influential financial institution, even as the federal government retained majority ownership.
Acknowledgements
We are very grateful to the three anonymous reviewers for their insightful comments and suggestions, and to Rory Miller, Marco Molteni, and Rui Esteves for their valuable feedback. We are especially indebted to Gail Triner, who worked closely with us on the conceptual clarification and classification of Banco do Brasil’s balance-sheet accounts that underpin this study, and who contributed extensively to earlier drafts of the article. We also thank participants at the Business History Conference and the World Economic History Congress, both in 2022, as well as the Seminário de Economia Política e História Econômica of FGV-EESP, for their helpful comments. We have used GenAI solely for language editing purposes.
Appendix
Methodological note
The analysis in this article relies on a newly compiled database constructed from digitized Banco do Brasil (BB) balance sheets from 1964 to 1985. These materials are available in issues of Revista Bancária Brasileira held by the Library of the Faculdade de Ciências Econômicas (FCE) of the Universidade Federal do Rio Grande do Sul (UFRGS) in Porto Alegre, Brazil. The Revista Bancária Brasileira was a monthly publication in which national financial institutions reported their financial statements.Footnote 56 Missing issues were complemented with other sources in which BB also published its balance sheets, including its own monthly and quarterly bulletins and Conjuntura Econômica, published by the Fundação Getulio Vargas and available online. Although the entire series of monthly balance sheets was digitized, the database used in this article includes only annual end-of-year data (December). This database has never been used in prior research and represents one of the main contributions of this study.
Between 1964 and 1985, BB published its balance sheets in three formats: from January 1964 to December 1967, from January 1968 to November 1978, and from December 1978 to December 1986. Each format changed the grouping and labeling of accounts on both the asset and liability sides, making it necessary to reclassify them in order to construct a harmonized long-term series. One notable change was the reduction in the number of reported accounts: the 1964–1967 format listed up to 123 asset accounts and 133 liability accounts; the 1968–1978 format contained 59 and 43, respectively; and the 1979–1986 format listed 42 and 38. To build a consistent long-term series, we consolidated the detailed accounts from earlier formats into the broader, aggregated categories used in later formats. BB did not publish parallel balance sheets under both old and new formats during the transition months, preventing direct cross-checking. We therefore approximated the correspondence by regrouping accounts according to the new format in the month preceding each change.
To address these inconsistencies, we adopted a functional classification system according to the analytical goals of the article—i.e. to conduct a meaningful analysis of BB’s evolving financial structure and macroeconomic role. Owing to its unique institutional position, BB operated across multiple segments of the Brazilian financial and monetary system. Following the historiography on BB’s various functions and financial activities during this period, we organized accounts into five broad functional categories: monetary, foreign currency, fiscal, developmental, and commercial banking. We classified each account based on specific labels across distinct balance sheet formats, cross-checking our classification against BB’s annual reports, quarterly bulletins, and other secondary sources to determine the type of operation each represented. This approach provides a coherent framework for functional analysis and for assessing the evolution of BB’s roles over time, in line with the objectives of this article. Accounts with unclear meaning or purpose were excluded. Overall, the classified accounts represent approximately 90 percent of BB’s total balance sheet on average between 1965 and 1985.
The description and rationales for each of the five categories are the following:
Commercial bank: This category covers BB’s core commercial banking functions, including deposits from private clients, loans to individuals and businesses, and interbank operations, highlighting its role as a traditional financial intermediary.
Fiscal agent: This category includes accounts reflecting BB’s role as the financial agent of the Brazilian federal government, such as managing public funds and handling transactions for and financing operations to the National Treasury. It highlights the bank’s integration with fiscal policy, excluding accounts related to state and municipal governments.
Development bank: This grouping includes accounts associated with BB’s mission in supporting economic development, including specialized or subsidized credit programs for agriculture, industry, and infrastructure. These programs, often aligned with government initiatives aimed at fostering growth in strategic sectors, reflect the state-led developmentalist model of the time.
Foreign exchange management: This category encompasses accounts reflecting BB’s role in managing currency policy, such as lending and borrowing in foreign currency, buying and selling foreign currencies, international trade operations, and external transactions conducted on behalf of the government and central banks.
Monetary authority: This category includes accounts related to BB’s activities as a domestic monetary authority, such as managing liquidity in the banking system, meeting reserve requirements, and notably, the famous conta de movimento held with the central bank.
Grouping accounts by functional purpose ensures comparability across balance sheet formats and enables a meaningful analysis of BB’s evolving activities during a period of major macroeconomic and institutional change. This classification reflects BB’s unique structure and mandates. While well-suited for analyzing its role in Brazil’s financial system, these categories do not align with standard accounting conventions used by other domestic or foreign banks. In that sense, our methodology departs from traditional accounting classifications in financial history, as BB was not a conventional commercial bank but a multifaceted institution combining a large variety of distinct financial roles, as explained in the article. For example, the conta de movimento, which at times represented up to 25 percent of BB’s liabilities, was a unique institutional feature with no parallel elsewhere in Brazilian or international banking. The classification adopted here is thus specifically designed to capture these distinctive functions rather than to replicate standard categories used for cross-country or interbank comparisons.
The tables below list the specific accounts included in each category for the three balance sheet formats, distinguishing between assets and liabilities.



 Open access

