

Postprandial increase in TAG levels is a physiological and transitory response that occurs after the consumption of meals containing fat. Plasma TAG are mainly transported by TAG-rich lipoproteins (TRL), including the liver-derived VLDL, the intestine-derived chylomicrons, which transport diet-derived TAG, and their respective remnants. All these TRL significantly increase in the postprandial state( Reference Pirillo, Norata and Catapano 1 ).
Although TAG levels are commonly measured in the fasting state, the evaluation of postprandial TAG seems important as most individuals consume meals frequently during the day and the postprandial state predominates over a 24- h period( Reference Pappas, Kandaraki and Tsirona 2 , Reference Nordestgaard, Langsted and Mora 3 ). Moreover, several epidemiological studies have suggested that non-fasting hypertriacylglycerolaemia is an independent risk factor for CVD( Reference Nordestgaard, Benn and Schnohr 4 – Reference Langsted, Freiberg and Tybjaerg-Hansen 8 ). The mechanism traditionally thought of as responsible for the increased risk of CVD associated with hypertriacylglycerolaemia is that remnant particles migrate into the subendothelial space inducing local inflammatory process and lead to the formation of foam cells. However, recent evidence suggests that remnants may interact with circulating inflammatory cells, inducing the generation of cytokines and oxidative stress, causing an inflammatory response that precedes the subendothelial reaction( Reference de Vries, Klop and Eskes 9 ).
The amount of fat in the meal seems to be the main factor influencing postprandial lipaemia( Reference Kolovou, Mikhailidis and Kovar 10 ). However, other components of the meal may also affect TAG response such as the type of fatty acids, carbohydrates, dietary fibre and alcohol( Reference Lopez-Miranda, Williams and Lairon 11 , Reference Lairon and Defoort 12 ). A sedentary lifestyle and obesity exacerbate the magnitude of postprandial TAG( Reference Kolovou and Ooi 13 – Reference Adamska, Ostrowska and Gościk 16 ).
As several studies suggest that Ca intake increases faecal fat excretion( Reference Christensen, Lorenzen and Svith 17 – Reference Soerensen, Thorning and Astrup 20 ), it can be hypothesised that Ca can decrease postprandial TAG. Dietary Ca is generally ingested in meals containing fat, as milk and dairy products are the main sources of dietary Ca and may also have a high content of fat. Ca supplements, which are frequently used as an alternative to achieve recommended Ca intake( Reference Shin and Kim 21 – 23 ), can also be taken with high-fat meals. However, it is not known whether Ca is able to decrease the hypertriacylglycerolaemia induced by a high-fat meal. The few studies that have evaluated this issue present very different designs particularly regarding the composition of test meals and the amount and source of Ca( Reference Lorenzen, Nielsen and Holst 24 – Reference Demmer, Van Loan and Rivera 27 ). One study evaluated both supplemental and dairy Ca( Reference Lorenzen, Nielsen and Holst 24 ), whereas the other three evaluated solely the effects of dairy products( Reference van Meijl and Mensink 25 – Reference Demmer, Van Loan and Rivera 27 ). Although the percentage of energy from fat varied widely among the different studies (39–61 %)( Reference Lorenzen, Nielsen and Holst 24 – Reference Demmer, Van Loan and Rivera 27 ), in the majority of them the amount of fat was similar in all test meals( Reference Lorenzen, Nielsen and Holst 24 , Reference van Meijl and Mensink 25 , Reference Demmer, Van Loan and Rivera 27 ). Females were included in only one study that also included men( Reference Demmer, Van Loan and Rivera 27 ), whereas the others studies included solely men( Reference Lorenzen, Nielsen and Holst 24 – Reference Schmid, Petry and Walther 26 ). Almost all studies included only overweight individuals( Reference Lorenzen, Nielsen and Holst 24 , Reference van Meijl and Mensink 25 , Reference Demmer, Van Loan and Rivera 27 ).
The present study aimed to evaluate the effects of dietary and supplemental Ca on postprandial lipaemia in obese women challenged with a high-fat meal. As secondary objectives, we investigate the effects of dietary and supplemental Ca on glucose metabolism, C-reactive protein (CRP) and adiponectin.
Methods
This cross-over randomised controlled trial was performed at the Laboratory of Clinical and Experimental Pathophysiology, CLINEX, located at Pedro Ernesto University Hospital, of Rio de Janeiro State University. It was conducted in accordance with the Declaration of Helsinki. All procedures involving human subjects/patients were approved by the committee on ethics and research of the Pedro Ernesto University Hospital (339.112-CEP/HUPE – CAAE: 19393213.7.0000.5259) and all participants provided written informed consent. The present trial was registered at www.clinicaltrials.gov (ID no. NCT02137434). This design of study has already been described in a previous publication( Reference Ferreira, Leal and Antunes 28 ), in which data about the effects of supplemental or dietary Ca on BP and microvascular function evaluated during the first 2 h after test meals intake were included. In the present publication, we included data about lipid profile, inflammatory markers and glucose metabolism that were evaluated within 4 h after test meal intake.
Subjects
Participants were women presenting BMI≥30 and<40 kg/m2, aged between 20 and 50 years, with low habitual intake of dairy products (≤1 portion/d) and premenopausal status. Pregnant or lactating women were not allowed into the study. The exclusion criteria were smoking; current use of dietary supplements (including supplements of Ca and vitamin D) or use of medication known to interfere with Ca metabolism, body weight, metabolic profile or blood pressure; clinical history of thyroid dysfunction; and diagnosis of diabetes mellitus, hypertension, dyslipidaemia (with drug treatment) and/or chronic diseases severely affecting the cardiovascular, gastrointestinal and renal systems. Those who reported recent (within previous 3 months) changes in dietary intake, body weight (≥3 kg) and intensity or frequency of physical exercise were also excluded.
Participants who engaged in physical activities, including light ones, such as walking, for at least 40 min three times a week were considered physically active.
Study design
Women who met initial eligibility criteria (preliminary evaluation) and agreed to take part in the study were scheduled to a screening visit in order to evaluate other eligibility criteria. At this visit, they arrived at the Laboratory after a 12-h fasting period and abstinence from alcohol for 3 d. While fasting, they were submitted to clinical, nutritional and laboratory evaluations. A week later, participants returned to the laboratory and those eligible for this study were randomly assigned (block randomisation using a table of random numbers) to one of three possible sequences of the three test meals with a washout period of 1 week between meals. The three sequences of the test meals were chosen by lottery and the randomisation to the three sequences determined using the software Excel® from Windows® (Microsoft). This was a single-blind study as participants were blinded but the investigators who prepared the test meals were not.
On the 3 d before each test meal, participants were instructed to (1) eat no more than 1 portion of dairy products/d and 2 portions of fruits; (2) avoid food items rich in fat, alcohol, green tea and dark chocolate; and (3) avoid hard physical activities. On the test day, participants were scheduled to arrive at the Laboratory between 08.00 and 10.00 hours after a 12-h fasting period. An interview was made on arrival of participants to the Laboratory in order to check their compliance to all these study instructions. While fasting, they were submitted to the baseline evaluation including anthropometric parameters and blood sample collection. In sequence, participants were instructed to eat the test meal in no more than 15 min. After test meal intake, at minutes 120 and 240 blood samples were collected.
Test meals
The three test meals presented similar energy, macronutrient and Na content (Table 1). However, the amount and source of Ca differed among the test meals: high dietary Ca meal (HDCM; 547 mg of dietary Ca), high supplemental Ca meal (HSCM; 500 mg of supplemental Ca and 42 mg of dietary Ca) and low Ca meal (LCM; 42 mg of dietary Ca) or control meal. The amount of Ca in HDCM and in HSCM (±500 mg) was chosen because this quantity is frequently consumed both as supplemental Ca (several supplements of Ca contain 500 mg of elemental Ca) and as dairy Ca (two portions of dairy products contain 500–600 mg of Ca). Thus, it is the quantity of Ca that can be easily ingested in a breakfast and represents±50 % of dietary recommended intake for adults( 29 ). The amount of fat in the test meals was planned to be similar to that of a high-fat snack consumed in Brazil.
Nutrient composition of the test meals
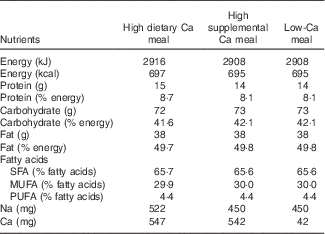
All three meals consisted of cracker (26 g) with butter (10 g), and a beverage. In the HDCM, this beverage consisted in a blend of skim powdered milk (39 g), milk cream (50 g), sugar (16 g), butter (15 g), maltodextrin (20 g), vanilla essence (5 ml) and water (40 ml). In HSCM, the beverage was a mix of powdered calcium carbonate (1250 mg), powdered albumin vanilla flavoured (15 g), milk cream (50 g), sugar (36 g), butter (15 g), maltodextrin (20 g) and water (40 ml). Finally, the beverage in the LCM was the same as in the HSCM but without calcium carbonate.
Meals’ composition was analysed for proximate composition by the standard procedures of the Association of Analysis Chemists (AOAC, 2000)( 30 ): moisture, ash, protein (within assay CV: 5·62–12·50 %) and fat (within assay CV: 1·34–1·92 %). Total carbohydrates were calculated by difference. Energy content was estimated using the usual conversion factors: 4 kcal/g for protein and carbohydrates and 9 kcal/g for lipids. The amount of Ca (within assay CV: 2·35–4·77 %) was analysed by complexometric titration with EDTA and Na (within assay CV: 1·49–1·80 %) content by atomic emission flame spectrophotometry. These analyses utilised standards and were conducted at Nutritional Biochemistry Laboratory and at Bromatology Laboratory of Federal University of the State of Rio de Janeiro. Fatty acid content was estimated by using the Brazilian Table of Food Composition( 31 ).
Test meals were formulated to have low levels of antioxidant substances that are known to improve vascular function and blood pressure, such as polyphenols( Reference Lekakis, Rallidis and Andreadou 32 – Reference Alexopoulos, Vlachopoulos and Aznaouridis 34 ).
Nutritional assessment
A semiquantitative FFQ containing eighty items and usual portions was used to assess usual dietary Ca intake over the previous 6 months( Reference Sichieri and Everhart 35 ). Brazilian Table of Food Consumption( 31 ) and the software SAS® were used to process data from FFQ. Participants who reported consumption of alcoholic beverages 1 or more times/week were considered alcohol consumers.
Height was measured using a stadiometer accurate to ±0·5 cm and weight was obtained with a calibrated scale accurate to ±0·1 kg (Filizola S.A.), with participants wearing light clothing and no shoes, after they have attempted to empty their bladder. BMI was calculated using the standard equation (kg/m2)( 36 ). Waist circumference was measured in the standing position, midway between the lower margin of the last rib and the iliac crest, at mid exhalation. Anthropometric measurements were taken twice and mean values were used. At the screening visit, percentage body fat was estimated by electrical bioimpedance using a Biodynamics BIA-450 body fat analyzer (Biodynamics Corp.).
Laboratory parameters
At the screening visit, blood samples were collected to evaluate serum levels of glucose, insulin, total cholesterol and fractions, TAG and 25 hydroxyvitamin D (25(OH)D). At the test days, serum samples were collected to evaluate glucose, insulin, total cholesterol and fractions, TAG, high-sensitivity CRP and adiponectin.
Glucose was determined by glucose hexokinase method using the equipment Cobas Integra 400 Plus (Roche Diagnostics) with reagents provided by the manufacturer (within assay CV: 0·5–0·8 %; between assay CV: 1·1–1·3 %). Insulin levels were determined by RIA method using the commercially available human insulin specific kit (EMD Millipore Corporation) (within assay CV: 2·2–4·4 %; between assay CV: 2·9–6·0 %). Insulin resistance status was assessed by using the homoeostasis model assessment of insulin resistance (HOMA-IR) index( Reference Matthews, Hosker and Rudenski 37 ). Total cholesterol (within assay CV: 1·8–1·9 %; between assay CV: 1·9–2·2 %), HDL-cholesterol (within assay CV: 2·4–3·5 %; between assay CV: 3·1–3·6 %) and TAG (within assay CV: 1·1–1·3 %; between assay CV: 1·1–1·4 %) concentrations were assessed by using enzymatic colorimetric method with the equipment Cobas Integra 400 Plus with reagents provided by the manufacturer. When TAG values were lower than 4·5 mmol/l, LDL-cholesterol was calculated using Friedewald’s formula( Reference Friedewald, Lévy and Fredckson 38 ). Serum 25(OH)D was determined by electro-chemiluminescence immunoassay using commercial kit (Roche Diagnostics) (within assay CV: 1·6–6·6 %, between assay CV: 2·6–8·7 %). Vitamin D deficiency was defined by serum 25(OH)D<50 nmol/l( Reference Holick, Binkley and Bischoff-Ferrari 39 ).
The turbidimetry method was used to determine the serum concentration of high-sensitivity CRP (BioSystems) (within assay CV: 1·5–1·8 %; between assay CV: 3·0–3·6 %). ELISA was used to assess plasma adiponectin concentrations (Merck Millipore) (within assay CV: 1·0–7·4 %; between assay CV: 2·4–8·4 %).
All laboratory analyses were performed at the University Hospital Central Laboratory and at the Lipids Laboratory of Rio de Janeiro State University. These laboratories have control procedures and quality assurance certification according to national and international standards.
Statistical methods
Means with their standard errors were used to summarise continuous variables. Normality was tested by the Shapiro–Wilk normality test and skewed data were log transformed to improve normality. Categorical variables were expressed as percentage and compared by the χ 2 test.
Repeated-measures ANOVA was used to assess (1) the effect of time (time effect) in each test meal, and (2) the interaction of meal and time (meal×time interaction or treatment effect), which evaluates the difference among test meals.
ANOVA with Bonferroni’s post hoc test was used to evaluate differences among test meals in (1) serum levels at baseline; (2) serum levels at 120 and 240 min (using baseline values of each variable as covariate); and (3) anthropometric parameters obtained at each test day.
To test for carry-over effect, the order of treatment was included as a covariate in the model and no carry-over effect was observed for any of the variables.
All statistical analyses were performed using STATA version 12 (StataCorp LP) software. P<0·05 was considered statistically significant.
It was not possible to determine the desired sample size to achieve a significant change in TAG based on previous studies, because of the non-existence of a prior clinical trial with a similar intervention.
Results
In all, ninety five women were interviewed, of whom forty-two agreed to participate in the study. Among these, twenty met the eligibility criteria and were scheduled for screening visit. The reasons for exclusion were BMI<30 or≥40 kg/m2 (n 9), hypertension (n 4), smoking (n 3), use of medications (n 3), menopause (n 2) and hypothyroidism (n 1). After the screening visit, three more women were not included in the study because of lack of interest. A total of seventeen participants were randomised and sixteen completed the study (Fig. 1). The non-completer left the study because of changes in work schedule. All these sixteen volunteers reported compliance to all study instructions. Thus, no problem of adherence to these instructions was detected in interviews conducted at the beginning of each visit.
Flow diagram of the study. LCM, low-calcium meal; HSCM, high supplemental calcium meal; HDCM, high dietary calcium meal.

Table 2 contains the characteristics of the participants, their habitual intake of Ca and serum levels of 25(OH)D. None of the participants presented with vitamin D deficiency. All anthropometric parameters did not present significant differences among each test meal day (data not shown).
Characteristics of the participants* (Mean values with their standard errors; numbers and percentages)
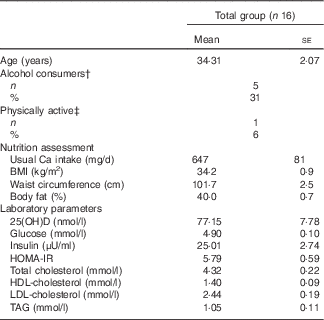
25(OH)D, 25 hydroxyvitamin D; HOMA-IR, homoeostasis model assessment of insulin resistance.
* Baseline values were used as covariables for evaluating the differences between treatments at 120 and 240 min.
† Alcohol consumers=participants who reported consumption of alcoholic beverages ≥1 times/week.
‡ Physically active=participants who engaged in physical activities, including light ones, for at least 40 min three times/week.
Postprandial modifications in serum lipids from baseline to 240 min after each test meal are presented in Fig. 2. According to repeated-measures ANOVA, the effects of the three test meals on total cholesterol, HDL-cholesterol, LDL-cholesterol and TAG were not significantly different (no meal×time interaction). Mean serum levels of these variables at baseline, 120 and 240 min presented no significant difference among test meals (Fig. 2).
Mean values of (a) total cholesterol, (b) LDL-cholesterol, (c) HDL-cholesterol and (d) TAG at baseline, 120 and 240 min after the consumption of high dietary calcium meal (HDCM, ![]() ), high supplemental calcium meal (HSCM,
), high supplemental calcium meal (HSCM, ![]() ) and low-calcium meal (LCM,
) and low-calcium meal (LCM, ![]() ) in obese women (n 16). Values are means, with their standard errors represented by vertical bars. P<0·0001 for time effect in each test meal (repeated-measures ANOVA) (a – HDCM, LCM; c – HSCM; d – HDCM, HSCM, LCM). † P values refer to meal×time interaction (repeated-measures ANOVA). Baseline values were used as covariables for evaluating the differences between treatments at 120 and 240 min.
) in obese women (n 16). Values are means, with their standard errors represented by vertical bars. P<0·0001 for time effect in each test meal (repeated-measures ANOVA) (a – HDCM, LCM; c – HSCM; d – HDCM, HSCM, LCM). † P values refer to meal×time interaction (repeated-measures ANOVA). Baseline values were used as covariables for evaluating the differences between treatments at 120 and 240 min.

Repeated-measures analysis showed that total cholesterol increased significantly from baseline after the HDCM and LCM, but did not change after the HSCM. LDL-cholesterol presented a significant decrease only after HSCM. Serum levels of TAG increased significantly after all test meals, whereas HDL-cholesterol levels did not present significant changes after all test meals (Fig. 2).
Postprandial responses in serum glucose and insulin are shown in Fig. 3. Repeated-measures ANOVA revealed that postprandial changes in glucose and insulin were not significantly different among the three test meals. Serum levels of glucose and insulin at baseline, 120 and 240 min were not significantly different among the three test meals (Fig. 2). Glucose remained without significant increase after all test meals. However, insulin increased significantly after all test meals (Fig. 3).
Mean values of (a) glucose and (b) insulin at baseline, 120 and 240 min after the consumption of high dietary calcium meal (HDCM, ![]() ), high supplemental calcium meal (HSCM,
), high supplemental calcium meal (HSCM, ![]() ) and low-calcium meal (LCM,
) and low-calcium meal (LCM, ![]() ) in obese women (n 16). Values are means, with their standard errors represented by vertical bars. † P values refer to meal×time interaction (repeated-measures ANOVA). P < 0·0001 for time effect in each test meal (repeated-measures ANOVA) (b – HDCM, HSCM, LCM). Baseline values were used as covariables for evaluating the differences between treatments at 120 and 240 min.
) in obese women (n 16). Values are means, with their standard errors represented by vertical bars. † P values refer to meal×time interaction (repeated-measures ANOVA). P < 0·0001 for time effect in each test meal (repeated-measures ANOVA) (b – HDCM, HSCM, LCM). Baseline values were used as covariables for evaluating the differences between treatments at 120 and 240 min.

There was no significant difference among the three test meals in adiponectin and high-sensitivity CRP according to repeated measures ANOVA (Fig. 4). Values at baseline, 120 and 240 min did not differ between the test meals (Fig. 4). Adiponectin and high-sensitivity CRP remained without significant changes after the three test meals (Fig. 4).
Mean values of (a) adiponectin and (b) high-sensitivity C-reactive protein (hs-CRP) at baseline, 120 and 240 min after the consumption of low-calcium meal (LCM, ![]() ), high dietary calcium meal (HDCM,
), high dietary calcium meal (HDCM, ![]() ) and high supplemental calcium meal (HSCM,
) and high supplemental calcium meal (HSCM, ![]() ) in obese women (n 16). † P values refer to meal×time interaction (repeated-measures ANOVA).
) in obese women (n 16). † P values refer to meal×time interaction (repeated-measures ANOVA).

Discussion
In the present study, the main finding was that Ca (supplemental and dietary) did not influence the effects of a high-fat meal on postprandial triacylglycerolaemia in obese women.
We observed a significant increase in serum levels of TAG after the three test meals. This increase was expected as test meals contained 38 g of fat and the postprandial period was evaluated during 4 h. Postprandial lipaemia is evident after meals containing >30 g fat( Reference Lopez-Miranda, Williams and Lairon 11 , Reference Dubois, Beaumier and Juhel 40 ). Serum TAG gradually increases, reaches a peak at 3–4 h and then returns to basal levels at 6–8 h after the meal( Reference Nakamura, Miyoshi and Yunoki 41 ).
After an extensive review of the literature, we found only four studies that evaluated the effects of Ca and/or dairy products on postprandial triacylglycerolaemia induced by a high-fat meal( Reference Lorenzen, Nielsen and Holst 24 – Reference Demmer, Van Loan and Rivera 27 ). Schmid et al.( Reference Schmid, Petry and Walther 26 ) conducted a cross-over study with nineteen healthy men comparing the effect of a high-fat dairy meal (67 g fat, 924 mg Ca), a high-fat non-dairy meal supplemented with milk: high-fat milk meal (84 g fat, 525 mg Ca) and a high-fat non-dairy control meal (67 g fat, 73 mg Ca). Blood samples were collected before and 1, 2 and 6 h after consumption of the test meals. Although the incremental AUC (iAUC) for TAG of the high-fat dairy meal did not differ from that of the high-fat control meal, the iAUC for TAG of the high-fat milk meal was not higher than that of the high-fat control meal, despite the greater amount of fat in the high-fat milk meal. One possible reason suggested by the authors for this finding is the higher Ca content of the high-fat milk meal compared with the high-fat control meal.
In the cross-over randomised trial conducted by Lorenzen et al.( Reference Lorenzen, Nielsen and Holst 24 ), eighteen subjects consumed four isoenergetic meals containing different amounts and sources of Ca. Three test meals contained Ca from dairy products – high-Ca meal (172 mg/MJ), medium-Ca meal (84 mg/MJ) and LCM (15 mg/MJ) – whereas one test meal contained Ca from calcium carbonate – supplemental Ca meal (183 mg/MJ). Each test meal contained 50 % of the subject’s daily energy requirement, and all test meals had the same macronutrient composition presenting 39 % of energy from fat. No significant meal×time interaction and no significant effect of meal on the AUC for total cholesterol and its fractions were observed by the authors. However, a significant effect of time on both serum total cholesterol and HDL-cholesterol was found. The adjusted AUC for chylomicron TAG was lower after the intake of the medium-- and high-Ca meals than after the LCM and the supplemental Ca meal. However, the AUC for total TAG adjusted for baseline concentration was not significantly different among test meals. The authors suggested that a plateau value for dairy Ca intake in chylomicron TAG exists above which an increased intake does not seem to have any additional effect. They also suggested that there must be another property of milk Ca or other bioactive components in dairy products that may also contribute to the decrease in chylomicron TAG levels. In the study conducted by van Meijl & Mensink( Reference van Meijl and Mensink 25 ), the meal containing dairy Ca (44 g fat; 699 mg Ca) compared with a control meal (44 g fat; 49 mg Ca) had no effects on serum levels of TAG and apoB48. Demmer et al.( Reference Demmer, Van Loan and Rivera 27 ) also found no difference in postprandial TAG following the intake of two different high-fat meals: a cheese meal (57 g fat; 487 mg Ca) and a vegan alternative test meal (58 g fat; 130 mg Ca).
In the present study, the lack of significant effects of supplemental and dietary Ca on serum TAG is in line with the findings of van Meijl & Mensink( Reference van Meijl and Mensink 25 ), Lorenzen et al.( Reference Lorenzen, Nielsen and Holst 24 ) and Demmer et al.( Reference Demmer, Van Loan and Rivera 27 ). We can hypothesise that in the study conducted by Schmid et al.( Reference Schmid, Petry and Walther 26 ) the higher amount of fat present in all test meals may have contributed to the observed differences between test meals. This finding may suggest that the effect of Ca on postprandial lipaemia may only be apparent when associated with an extremely high content of fat. However, the different designs of these studies preclude any conclusion, and additional studies are necessary to elucidate this issue.
We performed a post hoc sample size calculation by hypothesising that, at 240 min, serum TAG levels on LCM would be 0·3 mmol/l greater than on HDCM and HSCM. Considering this difference between meals, a significance level of P<0·05 and a power of 80 %, a sample size of fourteen participants (which is fairly similar to the number of participants in our study) would have been needed to detect statistically significant differences between treatments. However, this difference between meals was not reached in our study: the difference between LCM and HDCM was 0·07 mmol/l and between LCM and HSCM was 0·10 mmol/l. This fact may also have contributed to the lack of significant effects of Ca.
Although there is no evidence that the postprandial response to Ca differs between obese and non-obese individuals, we decided to include only obese subjects in this study based on the existing evidence that obesity is associated with a greater increase in postprandial TAG and inflammatory markers after a high-fat meal( Reference Lozano, Perez-Martinez and Delgado-Lista 14 , Reference Schwander, Kopf-Bolanz and Buri 15 ). We hypothesised that this would help to find a significant effect of Ca on TAG.
Although in the present study we included only obese women, presenting abdominal obesity, with mean values of HOMA-IR indicative of insulin resistance (>4·65)( 42 ) and the content of carbohydrates in test meals were similar to the amount of glucose in the oral glucose tolerance test (OGTT) (75 g)( 43 ), we did not observe a significant increase in glucose after the three test meals. Some factors that may have contributed to this finding are as follows: (1) the first blood sampling occurred 2 h after meal consumption (as our first aim in this study was to evaluate postprandial TAG and not glucose); (2) the type of carbohydrate in test meals was different from that of OGTT and all test meals had a high amount of fat, which slows down glucose absorption( Reference Gannon, Nuttall and Westphal 44 ).
We also did not find a significant effect of Ca (either dietary or supplemental) on glycaemia (meal×time interaction). The lack of a significant increase in glucose after the test meals may have favoured this finding, which is in agreement with the studies conducted by Lorenzen et al.( Reference Lorenzen, Nielsen and Holst 24 ) and Schmid et al.( Reference Schmid, Petry and Walther 26 ). These studies also evaluated the effects of Ca/dairy products consumed within high-fat meals on plasma glucose, but measured glucose at the first hour after meal intake and observed a significant increase in glucose levels after the test meals.
We did not observe significant changes in serum levels of CRP after the three test meals. There are inconsistent findings on the postprandial effect of a high-fat meal on serum levels of CRP. Some studies observed a significant increase within 4 h after a high-fat meal( Reference Carroll and Schade 45 , Reference Ceriello, Assaloni and Da Ros 46 ), whereas others did not( Reference Blackburn, Després and Lamarche 47 , Reference Poppitt, Keogh and Lithander 48 ). Herieka & Erridge( Reference Herieka and Erridge 49 ) proposed that CRP presents an almost undetectable increase in its production up to 5 h post stimulus. According to this hypothesis, the lack of significant increase in CRP in our study may be due to the short-term postprandial evaluation (only 4 h). Another possible reason is the amount of fat in our study, which was lower than in the studies that observed a significant increase in CRP.
The effects of dietary Ca/dairy products on CRP after a high-fat meal have been evaluated in a few studies( Reference Schmid, Petry and Walther 26 , Reference Demmer, Van Loan and Rivera 27 ). In the present study, postprandial serum levels of CRP were similar after the three test meals (no meal×time interaction). This finding is different from that observed in the study conducted by Demmer et al.( Reference Demmer, Van Loan and Rivera 27 ) (mentioned above) in which blood samples were collected at 0, 1, 3 and 6 h and the iAUC for CRP was significantly lower in the cheese meal compared with the vegan alternative test meal. In this study conducted by Demmer et al.( Reference Demmer, Van Loan and Rivera 27 ), the test meals were isoenergetic and had the same macronutrient composition, and thus the only difference between them was individual fatty acid composition, the matrix in which it was delivered, dietary cholesterol and Ca concentrations. Therefore, according to the authors, the lower iAUC in CRP after the cheese meal may be explained by some dairy components (e.g. dairy proteins, peptides and SCFA), their interactions and synergy upon digestion and metabolism. In the study conducted by Schmid et al.( Reference Schmid, Petry and Walther 26 ) (described above), the differences identified between the three meals on CRP evaluated at 1, 2, 4 and 6 h were inconsistent and of small magnitude. Thus, the authors concluded that full-fat milk and dairy products (cheese and butter) have no significant impact on the inflammatory response to a high-fat meal.
Studies evaluating plasma levels of adiponectin after a high-fat meal or an oral fat load also have conflicting results. Some studies observed a significant decrease( Reference Rubin, Helwig and Nothnagel 50 – Reference Derosa, Ferrari and D’Angelo 52 ), whereas others (in agreement with our study) did not find a significant change( Reference Poppitt, Keogh and Lithander 48 , Reference Peake, Kriketos and Denyer 53 , Reference Phillips, Peake and Zhang 54 ) or even found an increase in adiponectin, especially in overweight/obese individuals( Reference English, Coughlin and Hayden 55 – Reference Kennedy, Spiers and Crowley 57 ). The increase in adiponectin after an oral fat load was considered as anti-inflammatory reaction by some authors( Reference Westerink, Hajer and Kranendonk 56 ), which might have important beneficial effects on postprandial glucose and lipid metabolism( Reference English, Coughlin and Hayden 55 ). The conflicting results of these studies may be attributed to differences in the composition of the test meals, timing of blood draws and characteristics of the studied populations. We did not find studies evaluating the effects of Ca (dietary and/or supplemental) on postprandial adiponectin. To our knowledge, this study is the first to evaluate the effects of Ca on postprandial adiponectin.
Until this moment the effects of Ca on postprandial inflammation are not known and may vary according to several factors including the content of fat in test meal, the characteristics of the participants, the markers of inflammation and the time of blood sampling. The magnitude of the increase in postprandial serum TAG and glucose is also extremely important for the inflammatory response( Reference Ceriello and Genovese 58 ). In the present study, we observed a significant rise in TAG, but the increase in glucose was not significant. This fact may have contributed to the absence of a significant change in CRP and adiponectin and precluded the observation of a significant effect of Ca on inflammatory markers.
A potential strength of this study is the fact that it is the first randomised clinical trial to evaluate the effects of Ca on postprandial adiponectin. Our test meals were planned to have an amount of fat similar to a high-fat snack in Brazil, which makes the study clinically relevant. However, it may have contributed to the absence of statistical differences among meals, as the amount of energy and fat in the test meals was lower than in similar studies that evaluated the postprandial effects of high-fat meals. This study presents several limitations. The most important one is the short duration of postprandial follow-up (only four hours) with only two blood draws. These characteristics of the study do not allow the identification of blood lipids peak and do not support a reliable AUC evaluation, which is frequently used in the studies that evaluate the postprandial period (including the studies cited in this discussion). The absence of other biomarkers of lipid metabolism and inflammation, the absence of initial sample size calculation and the fact that investigators were not blinded are also limitations. A small sample size is a major limitation and we believe that if it was larger more subtle effects may have been detected. Another limitation is that the study was conducted with obese women aged 20–50 years. Therefore, our findings might not apply to men and individuals in other age groups and presenting different BMI.
Conclusion
In conclusion, the present results suggest that neither dietary nor supplemental Ca can interfere with postprandial lipaemia, glucose metabolism, CRP and adiponectinin in obese women challenged with a high-fat meal. As this study included only obese women and was conducted within only 4 h during the postprandial period, additional studies are recommended to evaluate individuals presenting different characteristics during a longer post-meal period.
Acknowledgements
The authors express their sincere gratitude to Maria de Lourdes Guimarães Rodrigues, Débora Cristina Torres Valença, Vagner Ismerin Lobão, José Firmino Nogueira Neto, Sergio Emanuel Kaiser, Maria Inês Barreto Silva, Orlando Marino Gadas de Moraes, Anderson Junger Teodoro, Diana Barbosa Cunha, Deborah Barbosa Vahia de Abreu, Bernardo Barreto da Silva Gaspar and Vittor Stern Pereira de Melo.
The present study was supported by Fundação Carlos Chagas Filho de Amparo à Pesquisa do Estado do Rio de Janeiro.
T. da S. F., V. P. A., P. M. L., A. F. S. and M. R. S. T. K.: contributed to the study conception and design. T. D. S. F., V. P. A., P. M. L. and M. R. S. T. K.: contributed to the data collection, assembly, analysis and interpretation, manuscript drafting and the approval of the final version of the manuscript.
The authors declare that there are no conflicts of interest.
Supplementary material
For supplementary material/s referred to in this article, please visit https://doi.org/10.1017/S0007114517002525


