


1. Introduction
The global community has adopted the United Nations 2030 Agenda challenge to achieve the 17 Sustainable Development Goals (SDGs) by 2030 (United Nations, 2015). However, global advances on human well-being SDGs in the context of the conventional gross domestic product (GDP)-based growth paradigm could generate systemic deterioration of the biophysical environment (O'Neill et al., Reference O'Neill, Fanning, Lamb and Steinberger2018; Wiedmann et al., Reference Wiedmann, Lenzen, Keyßer and Steinberger2020) or even trigger shifts in large-scale Earth system regime (Steffen et al., Reference Steffen, Rockström, Richardson, Lenton, Folke, Liverman, Summerhayes, Barnosky, Cornell, Crucifix, Donges, Fetzer, Lade, Scheffer, Winkelmann and Schellnhuber2018). This prospect would undermine social gains made under the 2030 Agenda and hinder future development. To avoid these risks, human development would have to take place within the biophysical constraints of the planetary ‘safe operating space’ (Raworth, Reference Raworth2012; Rockström et al., Reference Rockström, Steffen, Noone, Persson, Chapin, Lambin, Lenton, Scheffer, Folke, Schellnhuber, Nykvist, de Wit, Hughes, van der Leeuw, Rodhe, Sorlin, Snyder, Costanza, Svedin and Foley2009; Steffen et al., Reference Steffen, Richardson, Rockström, Cornell, Fetzer, Bennett, Biggs, Carpenter, de Vries, de Wit, Folke, Gerten, Heinke, Mace, Persson, Ramanathan, Reyers and Sörlin2015). But is this at all possible?
We previously developed a highly aggregated quantitative simulation model, Earth3, that allows transparent exploration of pathways of future regional and global development (Randers et al., Reference Randers, Rockström, Stoknes, Golüke, Collste and Cornell2018; Reference Randers, Rockström, Stoknes, Goluke, Collste, Cornell and Donges2019; Goluke et al., Reference Goluke, Randers, Collste and Stoknes2018; Collste et al., Reference Collste, Randers, Goluke, Stoknes, Cornell and Rockström2018). Earth3 builds on insights gained from earlier global system modelling endeavours (including Meadows et al., Reference Meadows, Meadows, Randers and Behrens1972, Reference Meadows, Randers and Meadows2004; Randers, Reference Randers2013; Randers et al., Reference Randers, Golüke, Wenstøp and Wenstøp2016) to simulate linked socio-economic and environmental developments over time towards 2050, taking the 17 SDGs and nine planetary boundaries into consideration. The Earth3 model provided the backbone for the Transformation is feasible report that was submitted to the Club of Rome for its 50th anniversary (Randers et al., Reference Randers, Rockström, Stoknes, Golüke, Collste and Cornell2018). The report raised five key transformations for shifting global development onto a sustainable path: (1) rapid increase in renewable energy, (2) shift to sustainable food chains, (3) new development models, (4) inequality reduction and (5) investments in education, gender equality, health and family planning. These transformations are further explained in Randers et al. (Reference Randers, Rockström, Stoknes, Golüke, Collste and Cornell2018) and are being further explored in the Earth4All project (https://www.earth4all.life).
Our model makes assessments for seven world regions and for the world as a whole (Randers et al., Reference Randers, Rockström, Stoknes, Goluke, Collste, Cornell and Donges2019). Earth3's causal structure and parametrization provide insights into the patterns of regional achievements on human well-being goals in the global context. Regional analysis can provide insights into generalizable policies that are also relevant for national decision-makers, while remaining closer to representation of globally systemic relationships, such as tracking how global well-being goals influence pressures on the planetary boundaries. The regions that we have chosen for this paper and the wider Earth3 analyses are based mainly on total population sizes (people), income per person and sizes of the economies (in purchasing power parity (PPP)-adjusted GDP US$ 2011).
This paper was written in conjunction with the development of the Earth3 model, and the findings set out here have supported its parametrizations. Here, we discuss insights from the model's causal structure and parametrization with the aim to maximize transparency about the socio-economic features of the model, both for users of the model outputs in policy and practice and for model developers who may view Earth3 as a prototype or skeleton for new-generation integrated world-earth models that connect human and Earth system dynamics (Donges et al., Reference Donges, Winkelmann, Lucht, Cornell, Dyke, Rockström, Heitzig and Schellnhuber2017, Reference Donges, Heitzig, Barfuss, Wiedermann, Kassel, Kittel, Kolb, Kolster, Müller-Hansen, Otto, Zimmerer and Lucht2020). Analysis and quantitative exploration of this paper is based on the different sets of data assembled and transformed in the development of the model, and not on model simulations. A more quantitative analysis, including how model parameters were estimated, can be found in Collste et al. (Reference Collste, Randers, Goluke, Stoknes, Cornell and Rockström2018).
2. Materials and methods
2.1 A common tracker for human well-being, consumption and production and social-ecological disruptions
In all global models, the selection of indicators and parametrizations embeds fundamental assumptions and encodes structural accounts of how society works. The diagram of the system in Figure 1 portrays a high-level conceptualization of key feedbacks and influences in world-earth modelling, as implemented in Earth3 and compatible with understandings of sustainable development as meeting people's needs ‘(…) while safeguarding Earth's life-support system (…)’ (Griggs et al., Reference Griggs, Stafford-Smith, Gaffney, Rockström, Öhman, Shyamsundar, Steffen, Glaser, Kanie and Noble2013). The diagram displays how long-term human well-being depends on balancing the reinforcing loop of production (incorporating food, industrial and service systems) against the counteracting loop of social-ecological disruptions. Production and consumption are at the centre of the diagram as it enables the provision of some of people's needs required for human well-being, and it also links to pressures on planetary boundaries through the required material throughput – with the consequent risk of large-scale, abrupt and potentially irreversible social-ecological disruption.
Conceptual sketch of two global feedbacks and influences in world-earth modelling within the Earth3 model representing SDGs within planetary boundaries. Each arrow represents a causal relationship. The ‘+’ signs at the arrowhead indicate that the effect is positively related to the cause (e.g. an increase in production causes the material throughput to rise above what it otherwise would have been). The ‘–’ signs at the arrowhead indicate that the effect is negatively related to the cause (e.g. a social-ecological disruption causes production to fall below what it otherwise would have been). The top loop is self-reinforcing, hence the loop polarity identifier R; the bottom loop in counteracting, hence the loop polarity identifier C. The two lines on the link going from ‘Pressures on planetary boundaries’ to ‘Ecological disruption (SDGs 13–15)’ is a delay mark representing that there are important delays here. The dashed lines from ‘Policy levers (SDGs 16–17)’ indicate that different policies can be analysed in the model environment. These may however both be positive or negative as it depends on which policy is analysed (hence no ‘+’ or ‘–’). The dotted line between ‘Social-ecological disruption (ALL SDGs)’ and ‘Production and consumption (SDG 8)’ indicates that this feedback was not incorporated into the Earth3 model at the point of the study. GDP per capita is represented by production and consumption (SDG 8) at the centre of the diagram. Further note that this figure serves as a simplification. More comprehensive overviews of the Earth3 model are available in Randers et al. (Reference Randers, Rockström, Stoknes, Golüke, Collste and Cornell2018, p. 45, Reference Randers, Rockström, Stoknes, Goluke, Collste, Cornell and Donges2019, p. 3). Also note that a more encompassing understanding of key feedbacks may also incorporate positive contributions of nature for human well-being.

In development policy and in integrated assessment modelling alike, the GDP has long been the most widely used measurement of the value of production and consumption. GDP per person, also referred to as income per person or average income, is also the most widely used indicator of economic progress – and has also been used as a proxy for human well-being (Fanning & O'Neill, Reference Fanning and O'Neill2019; Weil, Reference Weil2009). An advantage of using GDP and average income in modelling is that they have excellent availability of worldwide data (Feenstra et al., Reference Feenstra, Inklaar and Timmer2015). However, the limitations of using a production metric as a well-being measurement are well-known (GDP was never meant for that purpose (Costanza et al., Reference Costanza, Hart, Talberth and Posner2009)). GDP per person does not adjust for the distribution of incomes and wealth within countries, an essential element of well-being (Wilkinson & Pickett, Reference Wilkinson and Pickett2009). It only counts activities that pass through official, organized markets (Himmelweit, Reference Himmelweit2017) and does neither include unpaid domestic work (Himmelweit, Reference Himmelweit2017) nor leisure time (Costanza et al., Reference Costanza, Hart, Talberth and Posner2009) which both clearly contribute to human welfare. It also counts the ‘bads’ that hamper well-being as well as the socially beneficial ‘goods’ in economic activity. For instance, polluting activities that harm well-being can be double-counted as GDP measures the clean-up activities (if these are paid for by the government) as well as the activity itself (Costanza et al., Reference Costanza, Erickson, Fligger, Adams, Adams, Altschuler, Balter, Fisher, Hike, Kelly, Kerr, McCauley, Montone, Rauch, Schmiedeskamp, Saxton, Sparacino, Tusinski and Williams2004; Islam & Clarke, Reference Islam and Clarke2002).
Nevertheless, a key question for SDG modelling (and world-earth modelling more generally) is: What are the implications of using GDP per person as the common tracker for well-being? Here, we investigate this question, studying average income in different world regions and its correlation with indicators of human well-being as targeted by SDGs 1–7, in our examination of achievements of the 2030 Agenda (Table 1). Earlier studies, including Lamb and Rao (Reference Lamb and Rao2015) as well as Steinberger et al. (Reference Steinberger, Lamb and Sakai2020) have looked at the correlations between human development indicators, climate impact and income levels. However, they have not used the plethora of indicators that overlap SDGs as well as human well-being frameworks in their studies.
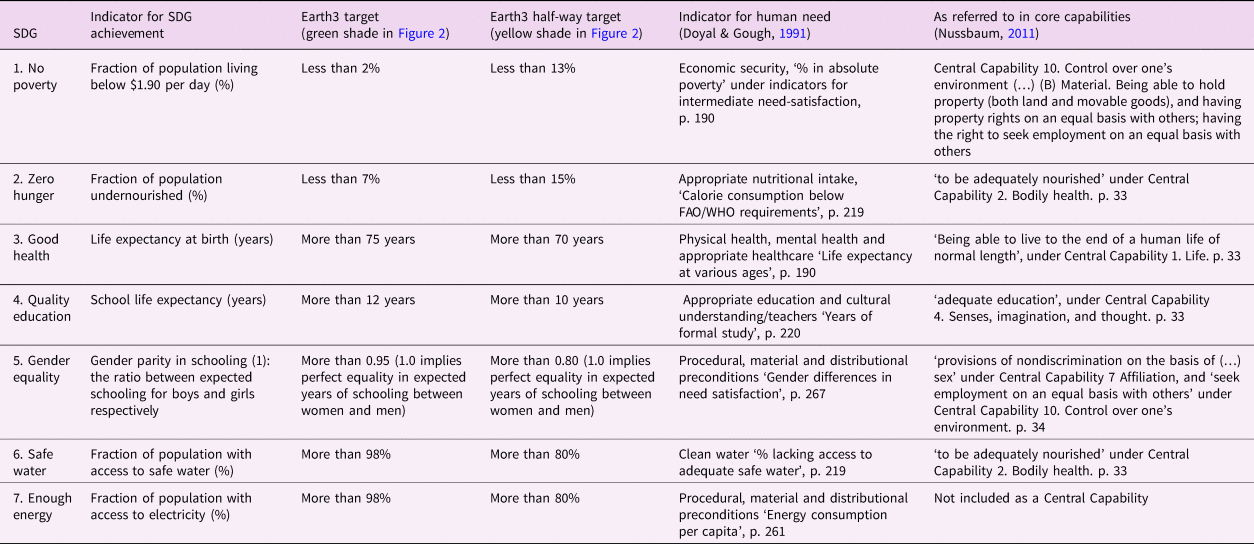
Indicators and threshold values for the UN Sustainable Development Goals 1–7 used in Earth3, and how they relate to Doyal and Gough's (Doyal & Gough, Reference Doyal and Gough1991; Gough, Reference Gough2017) indicators for human needs and Nussbaum's (Reference Nussbaum2011) core capabilities
More details are available in the Supplementary information.
2.2 The basis of well-being in SDG modelling
The 2030 Agenda resolution calls for shifting the world on to a ‘sustainable and resilient path’ where ‘all human beings can fulfil their potential in dignity and equality and in a healthy environment’ (United Nations, 2015). Representation of SDGs 1–7 in world-earth modelling thus requires sustainability measures and frameworks that go beyond preference satisfaction theories of conventional welfare economics (Penz, Reference Penz1986), but that can still be linked to measures of production and average income. In preference satisfaction theory, individual preferences and well-being are best judged by individuals themselves, and people are primarily seen as self-interested and rational. In these lines, objective monetary measures such as average income are useful as all well-being satisfaction options are seen as interchangeable. Real-world problems with preference satisfaction theory are that preferences often change when available options change (as people become richer they may seek yet higher incomes to satisfy new preferences) (Easterlin, Reference Easterlin, David and Reder1974, Reference Easterlin2003). It is also impossible to quantify, compare and weight one person's preference satisfaction against others'. In addition, there are limits to knowledge and people oftentimes do not act according to neoclassical economists' account of rationality (Gough, Reference Gough2015; Kahneman, Reference Kahneman2012).
The life satisfaction approach has been proposed as an alternative basis (Diener, Reference Diener1994; Layard, Reference Layard2005), where well-being is measured subjectively by the extent to which people are happy with their lives. Easterlin (Easterlin, Reference Easterlin, David and Reder1974, Reference Easterlin2003; Easterlin et al., Reference Easterlin, McVey, Switek, Sawangfa and Zweig2010) argues that income supports life satisfaction only up to a certain level. The Easterlin paradox is the observation that while there is a clear positive correlation between average incomes and life satisfaction within a population, the same pattern does not hold over time as these incomes increase beyond a given threshold. At lower levels, income has a strong effect on life satisfaction as it may mediate the satisfaction of ‘…the most basic of physiological needs’ (Howell & Howell, Reference Howell and Howell2008, p. 538). Frey and Stutzer (Reference Frey and Stutzer2010) argue that the relationship between income and life satisfaction levels off somewhere around US$15,000 of average income per person per year (converted to PPP, constant 2011 US$, as used in previous Earth3 studies and in all the following discussion). At this level, the correlation between average income and measures of life satisfaction breaks down. Others have however argued that the positive correlation between life satisfaction and income is still positive beyond this level, although the relationship is weaker (Deaton, Reference Deaton2008).
The capabilities approach sees freedom to achieve well-being as society's primary goal and focuses on people's capabilities to achieve outcomes that they themselves value and ‘have reasons to value’ (Sen, Reference Sen2001, p. 291). This resonates with the text of the 2030 Agenda resolution: ‘a world […] of equal opportunity permitting the full realization of human potential and contributing to shared prosperity’ (United Nations, 2015). However, the operability of this approach in world-earth modelling is limited. Although ‘core capabilities’ have been defined (Nussbaum, Reference Nussbaum2011), measuring them would entail enumerating not just the freedoms that individuals choose but also the almost infinite number of open opportunities they have to choose from (Gough, Reference Gough2015). Brock (Reference Brock2009) argues that for the basic requirements for a decent life (such as those partly covered under SDGs 1–7), the capabilities approach converges with the human needs approach (Doyal & Gough, Reference Doyal and Gough1991; Max-Neef, Reference Max-Neef1992), which better allows for operationalization. The human needs approach proposes minimum levels of fundamental provisions that should be met for all people, and which can be objectively measured.
In Table 1, we show how SDGs 1–7 relate to some of Doyal and Gough's (Doyal & Gough, Reference Doyal and Gough1991; Gough, Reference Gough2017) indicators for human needs and Nussbaum's (Reference Nussbaum2011) core capabilities. Doyal and Gough's list of prerequisite basic needs, and indicators for intermediate need-satisfaction, converges well with the indicators for the well-being SDGs that we have chosen for inclusion in Earth3 (see Table 1). In other words, the objective indicators for SDGs 1–7 used in our study have many overlaps with both a human needs framework and the capabilities approach.
3. Results
The graphs presented in Figure 2 show the observed historic relationships between average income and the respective human well-being SDG indicators over 5-year intervals, from 1980 to 2015.
All regions develop to increased GDP per person (GDPpp, measured in constant 2011 US$ PPP). For data time range, see Supplementary information. Vertical line represents GDPpp at $15k, related to Frey and Stutzer (Reference Frey and Stutzer2010). Data sources: adapted from World Development Indicators, The World Bank, World Bank EdStats, UN Population statistics and Penn world tables (Feenstra et al., Reference Feenstra, Inklaar and Timmer2015).

The regional data in Figure 2 indicate clear saturation levels and patterns of diminishing returns, where income per person levels off with respect to progress on the seven SDGs. Poverty (SDG 1) reaches levels under 2% at average income per person around $15,000, and undernourishment (SDG 2) gets under the 7% threshold between $10,000 and $15,000. Effects on health (SDG 3) are reached between $10,000 and $15,000, with life expectancy passing the 75 years threshold. Educational attainment (SDG 4) above 12 years of expected schooling is reached between $10,000 and $15,000. Gender equality in expected years of schooling (SDG 5) is associated with a GDP per person of less than $10,000 for China and the Indian subcontinent. Africa South of Sahara and rest of the world can be assumed to reach gender equality in expected schooling at similar income levels, if we assume that the trends depicted in the graph continue. For widespread (more than 98%) access to safe water (SDG 6), the patterns are not as uniform, and saturation patterns not as clear. Note that for safe water as well as undernourishment, the earliest data point is 2000 which impairs tracing longer-term trends and the patterns are therefore not as clear as for the other indicators. However, trends seem to suggest that access to safe water is correlated with a GDP level of around $15,000. Finally, the electricity access threshold (more than 98%, SDG 7) is associated with GDP levels of less than $10,000 for all regions.
From the data portrayed in Figure 2, we can derive three main insights: there is a comparatively consistent level of average incomes above which the seven SDGs are met; scale differences are apparent when comparing world data with regional data and regions differ from each other. We elaborated on each of these points below.
3.1 The well-being–production relationship
Our observations indicate the levels of average income per person at which the seven SDGs are met. In the graphs of Figure 2, we have indicated by red dashed lines where the relationship between income and life satisfaction levels off, according to Frey and Stutzer (Reference Frey and Stutzer2010). The ‘levelling-off point’ around US$15,000 was achieved in the United States before 1965, in other rich countries around 1975 and in emerging economies in 2010. It lies above the most recent income data for China ($11,370 for 2015), and just above the world average ($13,130 in 2015).
The human well-being trends evident in our data can be related to what Max-Neef (Reference Max-Neef1995) has referred to as a threshold beyond which economic growth does not bring about significantly more life quality but may even begin to deteriorate. In his data, this threshold lies between $15,000 and $25,000 translated to 2011 US$ PPP. The related concept of genuine progress indicator (GPI) for measuring economic welfare has been argued to peak at around $8000 (Kubiszewski et al., Reference Kubiszewski, Costanza, Franco, Lawn, Talberth, Jackson and Aylmer2013).
3.2 Differences between scales
For the world as a whole (grey in the graphs of Figure 2), progress on the seven SDGs instead appears to be linear with respect to income per person, with no indication of saturation at higher rates of income per person. Why does the world data not indicate the same pattern of saturation as the regional data depict? It is likely that inequality plays a major role here. That is, although the high incomes of the minority living predominantly in USA and other rich countries affect the income per person in the aggregated world data, rich regions have already reached the human well-being SDGs and hence increases in incomes in rich regions do not directly affect the attainment of aggregated human well-being SDGs. An increased size of the world economy may thus not significantly affect the achievement of human well-being SDGs, unless it is due to higher incomes in poorer regions. This finding also highlights the need for regional disaggregation when drawing policy conclusions from world-earth models. Besides, the world data's highest level of income per person is the most recent data point for 2015 at US$13,130 – and the saturation effect is seen only at yet higher levels. The world data do therefore not indicate any level of income per person for which human well-being SDGs are attained. A similar scale effect would likely be observed if we zoomed in further and looked at the national and local levels.
3.3 Regional differences
Finally, despite the uniformity discussed in Section 3.1, regions differ in human well-being SDG performance per unit of GDP per person (a related concept is the environmental efficiency of well-being, see Knight & Rosa, Reference Knight and Rosa2011). For example, while in our data China reaches the target level on SDG 3 good health (i.e. a life expectancy of 75 years) at around US$8000, India reaches the target level only at a level of US$14,000. Further analysis of these kinds of regional differences may give hints on how human well-being can be reached at lower levels of income. Scale does also play out in the data: the regions differ in population size and number of countries that are included (see Supplementary information).
3.4 Trade-off between human well-being and a flourishing planet?
Figure 1 presents the postulation that production and consumption systems are needed to provide for human needs and capabilities. Simultaneously, production and consumption require material throughput that risks causing pressures on planetary boundaries (note that these pressures can be traced by referring to environmental indicators, as included in the wider Earth3 modelling project, see Randers et al., Reference Randers, Rockström, Stoknes, Golüke, Collste and Cornell2018, Reference Randers, Rockström, Stoknes, Goluke, Collste, Cornell and Donges2019). The causal representation in Figure 1 indicates that there are trade-offs between increasing human well-being (especially when GDP per person is used to indicate production and consumption levels) and staying within planetary boundaries. For a sustainable system, the two loops in Figure 1 have to be better balanced against each other.
If human well-being is based on a more inclusive framework, such as the life satisfaction approach, human needs or capabilities, then the levelling-off portrayed in Figure 2 can be seen as an argument for sufficiency. Above a sufficiency threshold, additional income becomes unnecessary to achieve human well-being (see, e.g. Hickel, Reference Hickel2020). The levelling-off in the human well-being SDGs traced in our study would suggest not to focus on GDP per person as a measure for delivery of human well-being SDGs, especially not beyond the indicated threshold. Instead, a focus on life satisfaction, human needs or capabilities can help in finding inclusive sustainability pathways that provide for human well-being while limiting pressures on planetary boundaries. This reasoning however contradicts achievements of SDG 8 that incorporates a focus on economic growth. The contradiction between SDG 8 and achievements of other SDGs has been highlighted elsewhere, notably by Hickel (Reference Hickel2019).
3.5 Contribution to integrated systems modelling
Although current integrated modelling frameworks can provide valuable insights into the social, environmental and economic implications of pursuing multiple SDGs (Costanza et al., Reference Costanza, Daly, Fioramonti, Giovannini, Kubiszewski, Mortensen, Pickett, Ragnarsdottir, De Vogli and Wilkinson2016; Hughes, Reference Hughes2019), they are not constructed and configured to deal with systemic interactions among all the SDGs (van Soest et al., Reference van Soest, van Vuuren, Hilaire, Minx, Harmsen, Krey, Popp, Riahi and Luderer2019). Nor are these models constrained within the comparatively stable and predictable Earth system conditions of the Holocene highlighted by the planetary boundaries framework (Rockström et al., Reference Rockström, Steffen, Noone, Persson, Chapin, Lambin, Lenton, Scheffer, Folke, Schellnhuber, Nykvist, de Wit, Hughes, van der Leeuw, Rodhe, Sorlin, Snyder, Costanza, Svedin and Foley2009; Steffen et al., Reference Steffen, Richardson, Rockström, Cornell, Fetzer, Bennett, Biggs, Carpenter, de Vries, de Wit, Folke, Gerten, Heinke, Mace, Persson, Ramanathan, Reyers and Sörlin2015). There is, furthermore, a paucity of models with bidirectionally integrated social-ecological components (Costanza et al., Reference Costanza, Leemans, Boumans, Gaddis, Costanza, Graumlich and Steffen2007; Hughes, Reference Hughes2019; Verburg et al., Reference Verburg, Dearing, Dyke, van der Leeuw, Seitzinger, Steffen and Syvitski2016). Zimm et al. (Reference Zimm, Sperling and Busch2018) and van Soest et al. (Reference van Soest, van Vuuren, Hilaire, Minx, Harmsen, Krey, Popp, Riahi and Luderer2019) have therefore called for integrated assessment models that meaningfully cover more human dimensions of the SDGs.
The SDGs starkly expose the gap between models appropriate for global policy contexts (energy/economy and climate-focused integrated assessment models are well-established examples), and models informing decisions at the national level of policy makers' typical scope and influence (Collste et al., Reference Collste, Pedercini and Cornell2017; Hughes, Reference Hughes2019; Pedercini et al., Reference Pedercini, Arquitt, Collste and Herren2019). National actions taken independently may not add up to desired global outcomes, and ‘problem shifting’ and spillovers to other sectors and locations are recognized as a global implementation weakness (Engström et al., Reference Engström, Collste, Cornell, Johnson, Carlsen, Jaramillo, Finnveden, Destouni, Howells, Weitz, Palm and Fuso-Nerini2021).
Our insights from building the Earth3 model contribute to a simple and straight-forward yet useful way to link human well-being SDG performance to income levels. As a consequence of the analysis of data presented in this paper, GDP per capita has been kept as a key driver in the Earth3 model. However, the thresholds discussed have been incorporated so that increases in GDP per capita only affect the simulated performance of the human well-being SDGs at lower income levels, and with decreasing marginal effects.
This can be used to further develop integrated social-ecological model components for world-earth modelling, and is currently being further explored in the context of the Earth4All project (https://www.earth4all.life).
4. Conclusions
With regards to the development of our set of indicators of human well-being SDGs 1–7, data patterns are strikingly uniform across regions. In addition to assisting us in building a more robust model (see Randers et al., Reference Randers, Rockström, Stoknes, Goluke, Collste, Cornell and Donges2019), this analysis has yielded some insights that should be taken into account in future global sustainability modelling. Analyses at the regional level can facilitate bridging national policy making with the planetary scale of the 2030 Agenda's ambitions and of the shifting Earth's system dynamics of the Anthropocene. The ways that societies react to emerging problems vary among the world's regions; hence, we have traced trends in indicators of the human well-being SDGs by region. The observed patterns give an indication of the ‘business as usual’ relationship between income per person and the respective human well-being SDG indicators. Through correlation analysis of these trends, we have obtained parameters for both the seven regions and for the world as a whole, that are used in the Earth3 model (see Collste et al., Reference Collste, Randers, Goluke, Stoknes, Cornell and Rockström2018 for a further explanation of the correlation analysis).
Below the identified income level of around US$15,000 (measured in 2011 US$ PPP), growth is associated with achievements of well-being SDGs for the indicators we use. Above this level, the data indicate limits to the well-being gains from economic growth. As income increases above US$15,000, these data are not associated with considerably better achievement of well-being SDGs. This observation holds across all studied SDGs and regions, and our identified well-being SDG threshold income level is similar to levels presented with regards to the life satisfaction approach as the level where national income increases is no longer strongly associated with higher life satisfaction.
The functional patterns are also sensitive to scale. That is, the degree of aggregation hides differences and inequalities between regions as well as countries. Thereby, the story of the relationship between per person incomes and attainment of SDGs 1–7 differs if we look at the world level or at regional levels. Linear relationships emerge for the aggregated world level, while the relationships seem exponential for the regions.
In the current situation of mankind in which critical planetary boundaries are being transgressed, societies must accelerate sustainability transformations for an equitable future on a finite planet. Although ecological limits to growth have been repeatedly emphasized (including by Meadows et al., Reference Meadows, Meadows, Randers and Behrens1972, Reference Meadows, Randers and Meadows2004), our analysis contributes to the literature on the limits of growth in providing human well-being above a certain income threshold.
There is a rapidly growing consensus that it is time to shift the world's focus away from maximizing material production to assuring human well-being in a flourishing environment (including, e.g. Jackson, Reference Jackson2011; Maxton and Randers, Reference Maxton and Randers2016; O'Neill et al., Reference O'Neill, Fanning, Lamb and Steinberger2018; Raworth, Reference Raworth2017; Stoknes, Reference Stoknes2021; Trebeck and Williams, Reference Trebeck and Williams2019; Victor, Reference Victor2019). In the context of Earth3, this has been framed as achieving the SDGs within planetary boundaries. A future in which SDGs have been achieved with limited pressures on planetary boundaries is possible, but we do not have much time.
Supplementary material
The supplementary material for this article can be found at https://doi.org/10.1017/sus.2021.26.
Acknowledgements
We thank collaborators for valuable comments on the draft paper in relation to the Earth3 project, including Ulrich Golüke, Owen Gaffney and Jonathan Donges. D.C. also thanks Arnaud Diemer for valuable feedback on an early draft of the paper.
Author contributions
Conceptualization: D.C., S.C. and J. Ra.; writing – original draft preparation: D.C.; all authors have contributed to the writing – review and editing. All authors have read and agreed to the published version of the manuscript.
Financial support
The Earth4All is initiated by The Club of Rome, the Potsdam Institute for Climate Impact Research, the Stockholm Resilience Centre and the Norwegian Business School. The initiative is supported by the Angela Bennett foundation and the Laudes foundation. The work on Earth3 was made possible by grant from the Global Challenges Foundation in Stockholm. D.C. acknowledges the European Union's Horizon 2020 research and innovation programme under the Marie Sklodowska-Curie Grant Agreement No. 675153 (ITN JD AdaptEconII).
Conflict of interest
The authors declare no conflict of interest.


 Open access