

INTRODUCTION
The Altiplano is a large, endorheic basin located between the Cordilleras Oriental and Occidental of the tropical Andes. Lake Titicaca, the world’s largest high-altitude lake, is located in the seasonally wet northern Altiplano, whereas large salt flats are located in the more arid southern Altiplano (Fig. 1). Early scientific investigations in the region reported on a series of carbonate benches (formed in shallow water as algal bioherms or “tufas”) above the plain of Salar de Uyuni and Salar de Coipasa, as well as elevated deposits above the shoreline of modern Lago Poopó and Lake Titicaca. These were considered evidence of ancient lakes much larger than those of today (Forbes, Reference Forbes1861; Agassiz and Garman, Reference Agassiz and Garman1876; Musters, Reference Musters1877; Minchin, Reference Minchin1882; Pompecki, Reference Pompecki1905; Bowman, Reference Bowman1914). More recently, multiple studies have explored the timing of long-term hydrologic change based on examination of the paleoshoreline deposits (Servant, Reference Servant1977; Rondeau, Reference Rondeau1990; Risacher and Fritz, Reference Risacher and Fritz1991; Bills et al., Reference Bills, de Silva, Currey, Emenger, Lillquist, Donnellan and Worden1994; Sylvestre et al., Reference Sylvestre, Servant, Servant-Vildary, Causse, Fournier and Ybert1999; Placzek et al., Reference Placzek, Quade and Patchett2006) and sediment cores from Lake Titicaca and Salar de Uyuni (Wirrmann and Mourguiart, Reference Wirrmann and Mourguiart1995; Baker et al., Reference Baker, Rigsby, Seltzer, Fritz, Lowenstein, Bacher and Veliz2001a, Reference Baker, Seltzer, Fritz, Dunbar, Grove, Tapia, Cross, Rowe and Broda2001b; Fornari et al., Reference Fornari, Risacher and Feraud2001; Fritz et al., Reference Fritz, Baker, Lowenstein, Seltzer, Rigsby, Dwyer, Tapia, Arnold, Ku and Luo2004, Reference Fritz, Baker, Seltzer, Ballantyne, Tapia, Cheng and Edwards2007) and related reconstructions of regional hydrologic variation to processes at local to global scales. Baker et al. (Reference Baker, Rigsby, Seltzer, Fritz, Lowenstein, Bacher and Veliz2001a, Reference Baker, Seltzer, Fritz, Dunbar, Grove, Tapia, Cross, Rowe and Broda2001b) hypothesized that regional precipitation variation, associated with the South American summer monsoon (SASM), was linked to variation in North Atlantic sea-surface temperature (SST) gradients at multiple temporal scales, a conclusion also supported by more recent stratigraphic and modeling studies (Blard et al., Reference Blard, Sylvestre, Tripati, Claude, Causse, Coudrain and Condom2011; Placzek et al., Reference Placzek, Quade and Patchett2013).
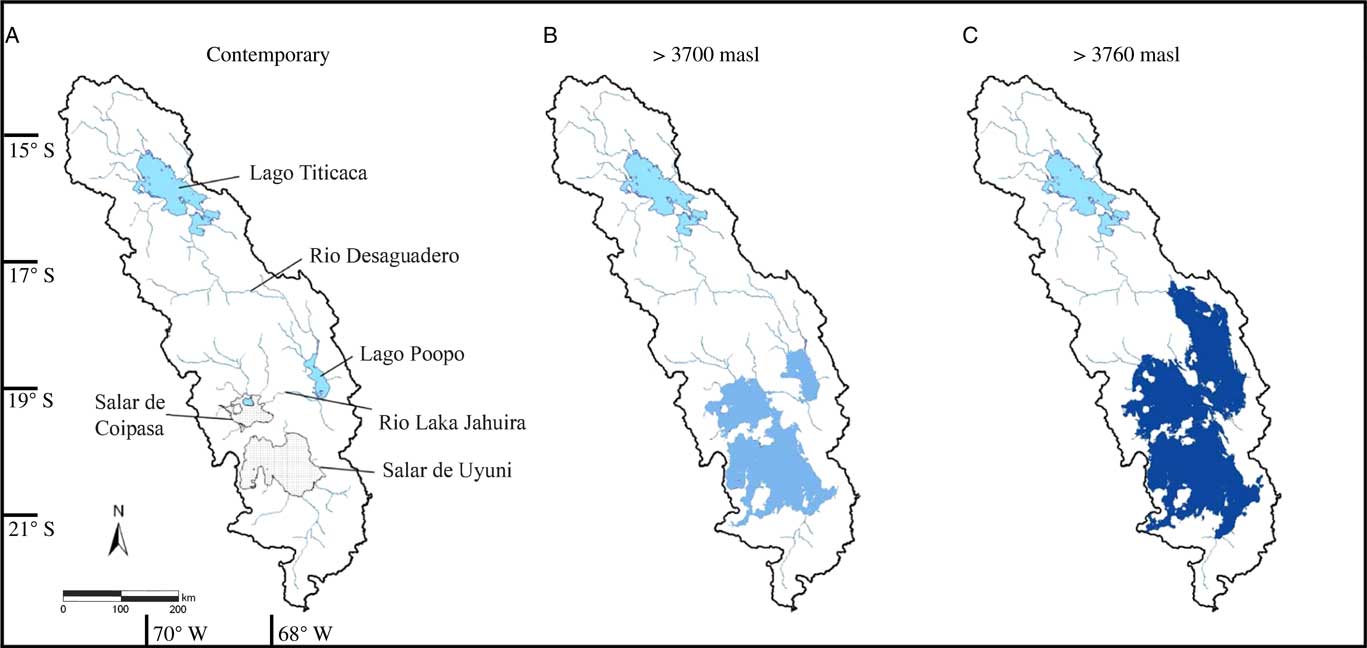
Map of the Altiplano showing (a) the location of Salar de Coipasa and other major hydrologic features mentioned in the text. The adjoining two panels show the size of paleolakes in the region (shaded blue) during intervals of increased effective moisture that raised lake levels to (b) 3700 m asl, which would connect Lago Poopó, Salar de Coipasa, and Salar de Uyuni via narrow straits, and (c) to 3760 m asl, the elevation of paleolake Tauca, as inferred from paleoshoreline deposits in the region. (For interpretation of the references to color in this figure legend, the reader is referred to the web version of this article.)
Most prior studies in the region agree about the ages and relative depths of the paleolakes on the southern Altiplano during the past ∼24 ka yr. From 24 to 15 ka, a paleolake continuously occupied the Salar de Uyuni and Salar de Coipasa basins (Baker et al., Reference Baker, Seltzer, Fritz, Dunbar, Grove, Tapia, Cross, Rowe and Broda2001b; Fritz et al., Reference Fritz, Baker, Lowenstein, Seltzer, Rigsby, Dwyer, Tapia, Arnold, Ku and Luo2004). The paleolake was likely moderately shallow—no tufas within this age range were observed higher than 15 m above the modern surface of Salar de Uyuni (m asu) until near its termination, when the paleolake reached a level of ∼110 m asu coincident with the Heinrich 1 stadial (∼18–14 ka). The paleolake dried in the Bølling-Allerød interstadial and refilled during the Younger Dryas event (12.9–11.6 ka), attaining a maximum level of ∼45 m asu at that time (Sylvestre et al., Reference Sylvestre, Servant-Vildary and Servant1998; Placzek et al., Reference Placzek, Quade and Patchett2006; Blard et al., Reference Blard, Sylvestre, Tripati, Claude, Causse, Coudrain and Condom2011).
In contrast to its more recent history, the timing of lake-level variation on the southern Altiplano prior to 24 ka is contentious and the nomenclature of the paleolakes is confusing. Based on radiocarbon ages of shells found in outcropping sediments, Servant and Fontes (Reference Servant and Fontes1978) identified a paleolake that they called Minchin, dated at 32 to 30 ka. Rondeau (Reference Rondeau1990) observed tufas in the Salar de Coipasa basin that he attributed to paleolake Minchin, which had U/Th dates between 44 and 34 ka, with reported errors of a few thousand years. In contrast, Placzek et al. (Reference Placzek, Quade and Patchett2006, Reference Placzek, Quade and Patchett2013) suggested that, between 80 and 25 ka, the basin was occupied by a paleolake only for a short-period at ∼46 ka based on their U-Th dating of paleoshoreline deposits. Yet, continuous drill cores from Salar de Uyuni show lacustrine sediment and evidence of a long-lived lake of moderate depth, perhaps the equivalent of Servant’s “Minchin” paleolake, between ∼46 and 38 ka, based on coherent radiocarbon and U-series isochron dating of an ∼11-m-thick bed of lacustrine mud, as well as two later short-lived lacustrine phases between ∼33 and 28 ka (Baker et al., Reference Baker, Seltzer, Fritz, Dunbar, Grove, Tapia, Cross, Rowe and Broda2001b; Fritz et al., Reference Fritz, Baker, Lowenstein, Seltzer, Rigsby, Dwyer, Tapia, Arnold, Ku and Luo2004). These lacustrine intervals, marked by deposition of mud containing a rich diatom flora and abundant carbonate brine shrimp fecal pellets, are separated by beds of salt, both halite and gypsum, representing periods of desiccation with deposition in shallow saline lakes or salt pans (Fritz et al. Reference Fritz, Baker, Lowenstein, Seltzer, Rigsby, Dwyer, Tapia, Arnold, Ku and Luo2004).
The great value of lake-level reconstruction using elevated shoreline deposits and tufas is that these deposits yield actual minima datums for paleo-lake level when properly accounting for isostasy and neotectonics (Bills et al., Reference Bills, de Silva, Currey, Emenger, Lillquist, Donnellan and Worden1994), as well as sediment back-stripping. Yet, unlike lacustrine sediment cores, elevated shoreline deposits are highly discontinuous in occurrence and impossible to sample to completeness. It is also often difficult to discriminate multiple high stands that reoccupied the same lake level. Thus, the absence of such paleoshoreline deposits should not by itself be used to infer the absence of a paleolake, shallow or deep, at that date. Furthermore, paleoshoreline deposits, unlike lacustrine sediment, do not follow the rule of superposition.
Placzek et al. (Reference Placzek, Quade and Patchett2013) also suggested a revised chronology of the Salar de Uyuni drill core (Fritz et al., Reference Fritz, Baker, Lowenstein, Seltzer, Rigsby, Dwyer, Tapia, Arnold, Ku and Luo2004) for the interval prior to 24 ka based solely on an Ar-Ar date of 191 ka on an interbedded tuffaceous sandstone in a similar drill-core sequence from the Salar de Uyuni. This date was determined by Fornari et al. (Reference Fornari, Risacher and Feraud2001) on a different drill core recovered in 1986 (Risacher and Fritz Reference Risacher and Fritz1991) taken from almost exactly the same geographic location. Our original U-series chronology placed the same interval at 59 ka (Fritz et al., Reference Fritz, Baker, Lowenstein, Seltzer, Rigsby, Dwyer, Tapia, Arnold, Ku and Luo2004). The Placzek et al. (Reference Placzek, Quade and Patchett2013) vacation of our chronology (Fritz et al., Reference Fritz, Baker, Lowenstein, Seltzer, Rigsby, Dwyer, Tapia, Arnold, Ku and Luo2004) is not well supported, because it dismisses a sequence of internally consistent U-Th ages on salts that also overlap and are concordant with radiocarbon ages, and because it requires a major change in an otherwise steady sedimentation rate that is not suggested by the stratigraphy (Baker and Fritz, Reference Baker and Fritz2015).
Additional records of the timing of hydrologic variability on the southern Altiplano can be used to evaluate regional climate variability more clearly and help to resolve discrepancies in interpretation of regional history. Here, we discuss a new high-resolution analysis of a sediment core from Salar de Coipasa that continuously spans nearly all the past ∼40 ka and contains geochemical and paleobiotic evidence of fluctuations in lake level. This record extends previous reconstructions of the paleohydrology of the Salar de Coipasa (Sylvestre et al., Reference Sylvestre, Servant, Servant-Vildary, Causse, Fournier and Ybert1999), which only covered the deglaciation and early Holocene (15.5–8.5 ka). We use this record to evaluate the paleohydrology of Salar de Coipasa within the context of other records from the Altiplano, particularly for the interval during and prior to the LGM.
Regional description
The Salar de Coipasa (68°8′W, 19°23′S), at an elevation of 3,656 m above sea level (asl), is the second largest salt flat (2500 km2) on the Bolivian Altiplano, which is an internally drained intermontane basin (187,000 km2) located between the Cordillera Oriental and the Cordillera Occidental in the southern tropical Andes. The Salar de Coipasa lies northwest of the Salar de Uyuni, and together they form the ultimate terminal basin of the Altiplano (Fig. 1), receiving water from the northern Altiplano during past periods of overflow of Lake Titicaca and Lago Poopó. The Salar de Coipasa basin is filled with late Tertiary to Quaternary age alluvial, volcanic, and evaporitic deposits (Ericksen et al., Reference Ericksen, Vine and Ballón1978; Risacher and Fritz, Reference Risacher and Fritz1991; Clapperton, Reference Clapperton1993; Sylvestre et al., Reference Sylvestre, Servant-Vildary and Servant1998; Banks et al., Reference Banks, Markland, Smith, Mendez, Rodriguez, Huerta and Sæther2004) and is capped by a salt crust that has a thickness of 2.5 m near its center and tapers to <0.5 m at the margin of the salar (Risacher and Fritz, Reference Risacher and Fritz1991).
Climate and hydrology
Modern climate on the Altiplano is arid to semi-arid, with rainfall ranging from 800 to 1000 mm/yr in the north near Lake Titicaca to <100 mm/yr in the south in the vicinity of the Salar de Uyuni. Most precipitation falls during the austral summer from December to March, with a long dry season from April to November. Annual average precipitation at Salar de Coipasa is 100–200 mm/yr. The major inflow to Salar de Coipasa is the Rio Lauca, with an annual discharge of 0.14 × 10⁹ m3 (Servicio Nacional de Meterología e Hidrología de Bolivia), which today often creates a shallow lake in the portion of the Salar de Coipasa near the mouth of the river. Typically, the salar surface becomes completely flooded during the rainy season and then dries nearly completely during the subsequent dry season.
During multi-annual phases of increased effective moisture, Lake Titicaca rises above its outlet (3810 m asl) and overflows via the Rio Desaguadero into the central basin of the Altiplano, providing increased riverine input to the downstream Lago Poopó (3686 m asl). On paleoclimate timescales, higher local runoff combined with enhanced flow from the north caused Lago Poopó to fill until its surface water elevation was ∼3700 m asl. At this elevation, Lago Poopó overflowed westward via the Rio Laka Jahuira into the Salar de Coipasa (Fig. 1b). The surface of Salar de Coipasa is only ∼3 m above that of the Salar de Uyuni (Risacher and Fritz, Reference Risacher and Fritz1991). The two salars are today separated by a sill that is only about 2 m above the surface of the Salar de Coipasa. If this sill height remained similar for the past 40 ka, water depth in the Coipasa basin would have been limited to only 2 m over a wide range of values of effective moisture. With vastly increased and prolonged periods of effective moisture, reaching the level of paleolake Tauca (ca. 3760 m asl) the Poopó, Coipasa, and Uyuni basins formed a single lake connected by broad straits (Fig. 1c).
METHODS
Core collection
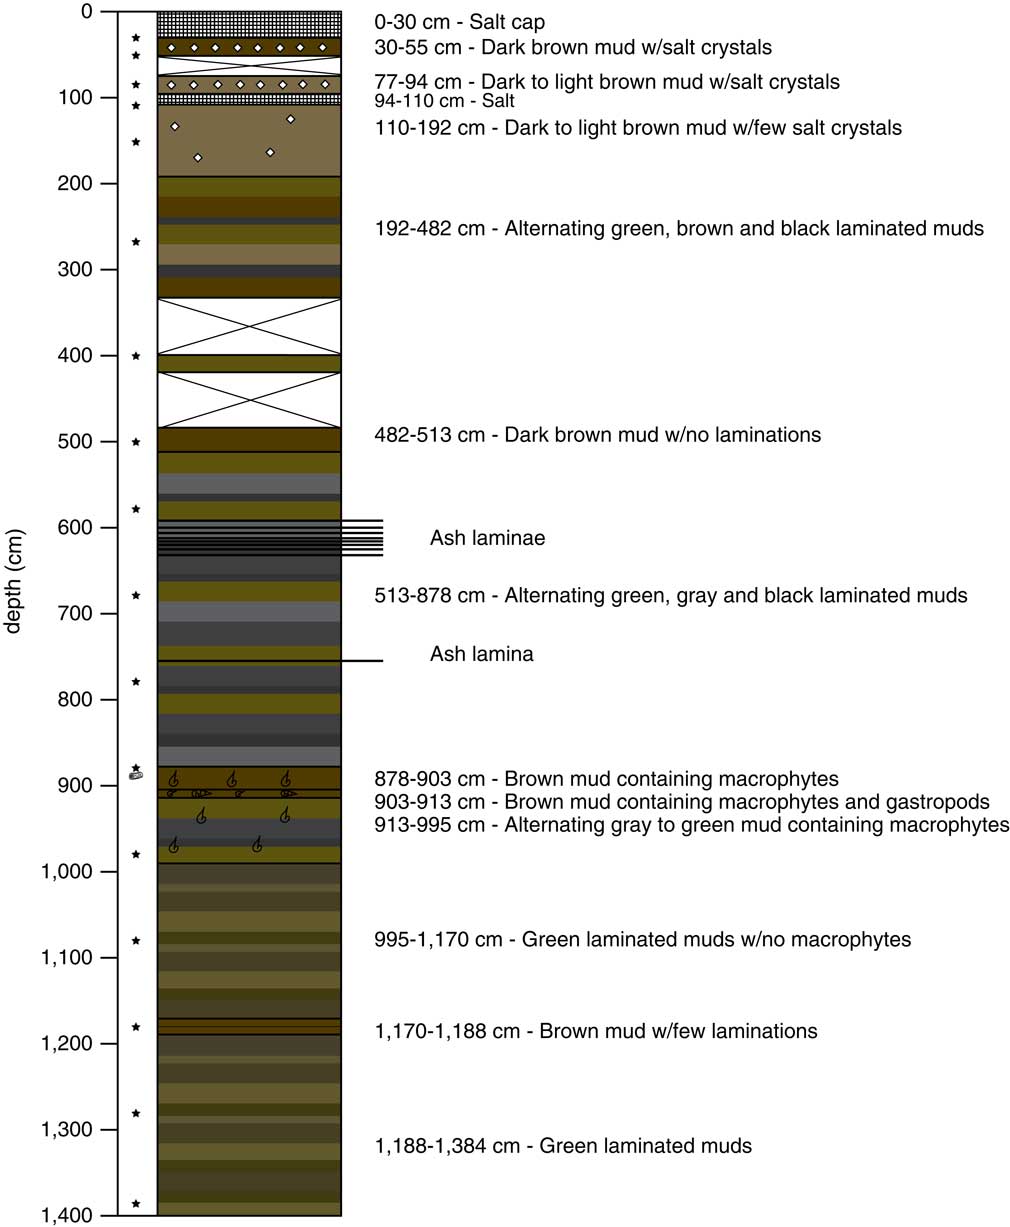
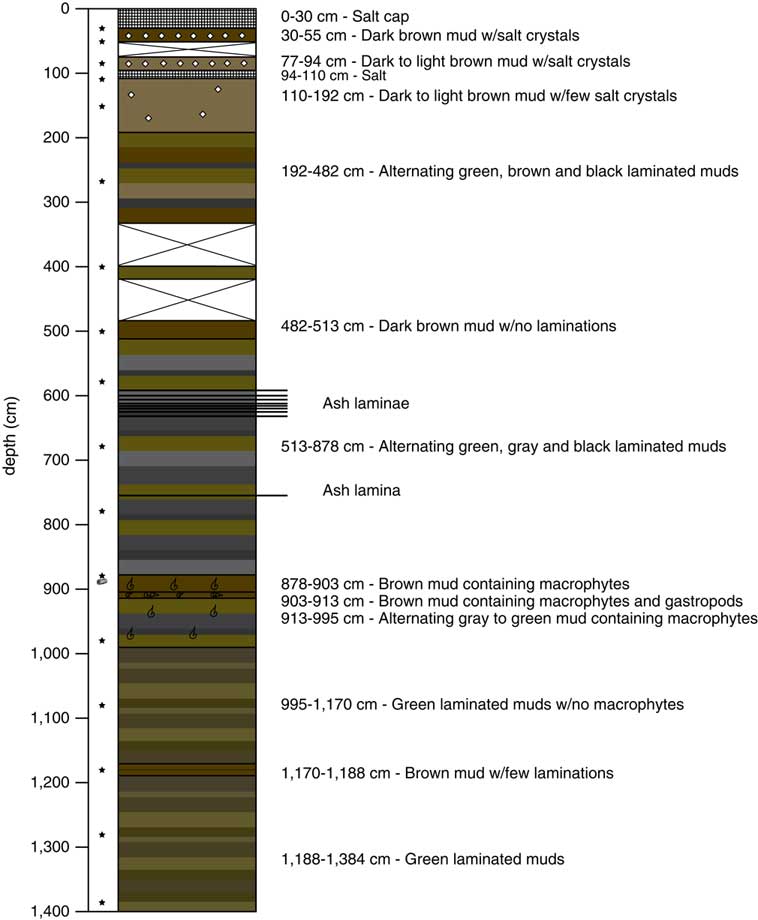
In July 2010, we collected a ∼14-m core from beneath the surficial salt at Salar de Coipasa using a Russian corer. Each section was recovered by reentry into the same borehole. The 30-cm halite cap was broken using a hand pick, retaining a portion of the salt for analysis. Beneath the crust, recovery in the uppermost sediments was incomplete, because of a 16-cm-thick salt bed encountered at 0.94 m below the salar surface (Fig. 2). Below this salt bed, we recovered ∼13 m of continuous lacustrine sediment, stopping because of the increasingly stiff nature of the deep sediment. Sixteen 0.25–1.00 m drives (SC-0 through SC-16) were collected for a total stratigraphic length of 13.84 meters. The cores were photographed and described on site before being wrapped for shipment and storage. More detailed core description was carried out in the laboratory at Duke University, and the cores were subsampled for various analyses within a few months of core collection.
(color online) The stratigraphy of the Salar de Coipasa core. The stars indicate the position of the radiocarbon samples (see Table 1).
Chronology
Accelerator mass spectrometry radiocarbon measurements were made on 17 bulk organic matter samples and one macrophyte sample at the National Ocean Sciences Accelerator Mass Spectrometry Facility at Woods Hole Oceanographic Institute (Table 1). Ages are corrected for stable isotope fractionation but are not adjusted for reservoir effects, which have been estimated to be relatively small for the large paleolakes on the Altiplano (Sylvestre et al., Reference Sylvestre, Servant, Servant-Vildary, Causse, Fournier and Ybert1999; Baker et al., Reference Baker, Rigsby, Seltzer, Fritz, Lowenstein, Bacher and Veliz2001a). The close agreement between radiocarbon and U/Th ages on young tufas in the Coipasa/Uyuni basin (Placzek et al., Reference Placzek, Quade and Patchett2006) supports this conclusion.
Radiocarbon ages for the Salar de Coipasa core.

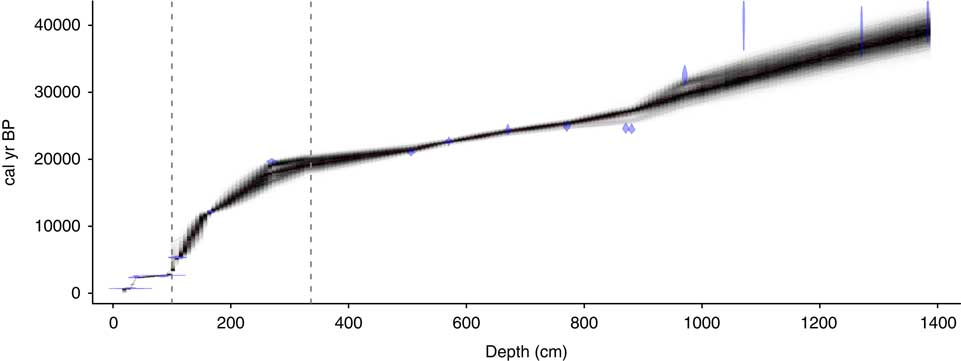
An age model for the core was generated using Bayesian analysis in Bacon (Version 2.2; Blaauw and Christen, Reference Blaauw and Christen2011). Radiocarbon ages were calibrated with the SHCal13 curve (Hogg et al., Reference Hogg, Hua, Blackwell, Buck, Guilderson, Heaton and Niu2013). Based on the sedimentology (see below), a hiatus was placed at a salt layer between 94 and 110 cm depth, with the length of the hiatus estimated to be ∼2000 yr based on bracketing radiocarbon ages at 85 and 110 cm depth (Table 1). The age-depth relationship changes between three stratigraphic intervals: (1) core top to the top of the salt bed at 94 cm depth; (2) a section of slow sedimentation from the base of the salt bed at 110 to ∼336 cm depth; and (3) the remainder of the core. Initial accumulation rates for the Bayesian analysis were set to 30 yr/cm for section 1, 70 yr/cm for section 2, and 20 yr/cm for section 3, with standard Bacon settings for the memory beta distribution (strength = 4, mean = 0.7) for all three sections, which are values appropriate for use in lake sediments (Blaauw and Christen, Reference Blaauw and Christen2011). Sections 2 and 3 were separated by an artificial 10-yr hiatus at 336-cm depth, the base of a unit with uniform lithology (see Fig. 2). This forced hiatus allowed the model to incorporate the change in sedimentation rate, and the resetting of sedimentation rate memory over this interval allowed for an optimized estimate of sediment accumulation rates for each of the three individual sections of the core. One radiocarbon age at 4.06 m was eliminated from the final age model, because it was from a core section with incomplete core recovery (see Fig. 2), thus we are uncertain of its original stratigraphic position.
Geochemistry
Samples were analyzed for stable carbon and nitrogen isotopic ratios and total carbon and nitrogen content (on a carbonate-free basis) at the Duke Environmental Stable Isotope Laboratory. The core was subsampled at 2-cm resolution. Each sample was dried at 60°C, powdered, homogenized, and weighed into silver cups and transferred into a desiccator containing a beaker of 12N HCl (Schubert and Nielsen, Reference Schubert and Nielsen2000). The samples were placed in an acid fume for at least 72 hours to remove any sedimentary carbonate. Samples were dried, transferred into pressed 5 × 9-mm tin caps, and combusted at 1020°C in a Carlo-Erba NA1500 elemental analyzer. Purified, chromatographically separated N2 and CO2 gases were delivered to a ThermoFinnigan Delta + XL continuous flow isotope ratio mass spectrometer via a ThermoFinnigan Conflo III interface. Reproducibility for both isotopes is approximately 0.1 per mil at 1 SD. C/N ratios are reported as a molar ratio.
Calcium content (as weight percent of the total sample) was determined by digesting powdered samples in 1 N HCl and analyzing the leachate for Ca2+ by flame atomic absorption spectroscopy (Perkin Elmer 5000). Mean relative error for CaCO3 determination is approximately 2% for known standard values.
Diatom analysis
Diatom samples were analyzed at the University of Nebraska-Lincoln at 8-cm resolution throughout the core. Samples were processed by treatment with 10% HCl to dissolve carbonates, followed by a cold H2O2 treatment to oxidize organic matter. The prepared samples were rinsed repeatedly to remove oxidation by-products. Slurries of the prepared sample were dried onto coverslips, and the coverslips were mounted onto slides with Naphrax. Diatoms were counted at 1000× magnification on a Zeiss Axioskop 2 microscope with differential interference contrast. Where possible, at least 300 diatom valves were identified and counted. In samples where diatom concentration was low, at least one whole slide was scanned for diatom enumeration. Diatom abundance is expressed as a percentage relative to the total number of counted valves in each sample.
RESULTS
Stratigraphy
The Salar de Coipasa is topped by a salt cap that was ∼30-cm-thick at the core site and consists of coarse halite crystals (Fig. 2). Just below the salt cap, the recovered sediments consist of brown mud with large salt crystals. A second bed of coarse crystalline halite was encountered from 94–110 cm. Below this bed lies a continuous sequence of lacustrine sediments consisting of green, brown, and black muds. Some units below 192 cm were laminated, suggesting temporal variability in sediment source and sufficiently deep conditions for preservation of sedimentary structures. The laminations averaged from <1 to 2 mm in thickness. Core recovery was poor from 336–482 cm, with just a small amount of mud recovered from ∼400 cm that may have been shifted upward or downward as suggested by its incongruent radiocarbon age (see Table 1; Fig. 2). Elsewhere recovery was nearly complete. Several ash layers were recovered between 595 and 765 cm. These ranged in thickness from 1 mm to 1 cm and were located at the following core depths: 595, 600, 603, 611.5, 612, 613, 616.5, 619, and 765 cm. Between 878 and 995 cm, the lacustrine muds contained abundant macrophytes and gastropods indicative of shallow-water conditions.
Chronology
Radiocarbon age determinations indicate that the age of the bottom of the 13.84-m sediment core is 39,200 14C yr BP. The age model (Fig. 3) suggests that linear sediment accumulation rates were moderately high in the basal sediments, with rates averaging 0.043 cm/yr below 8.7 m (>26,900 cal yr BP) and somewhat higher average rates (0.064 cm/yr) above (3.36–8.7 m; 19,400–26,900 cal yr BP). The chronology suggests much slower sediment accumulation in the upper part of the core, with rates of 0.019 cm/yr between 13,600 and 19,400 cal yr BP and 0.008 cm/yr between 5,400 and 13,600 cal yr BP at the base of the salt layer (110 cm).
A Bayesian age-depth model for the core generated with Bacon (Blaauw and Christen, Reference Blaauw and Christen2011), showing the calibrated 14C ages (blue diamonds), the age error (gray shading), and the best fit model (red line). The dotted lines are hiatuses used in generating the age model (see text for further information). (For interpretation of the references to color in this figure legend, the reader is referred to the web version of this article.)
Geochemistry
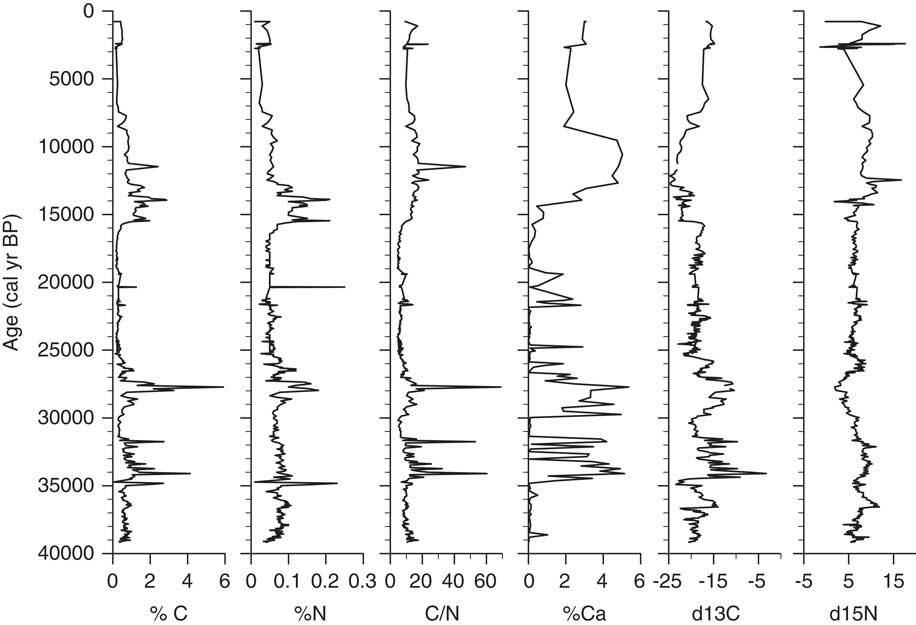
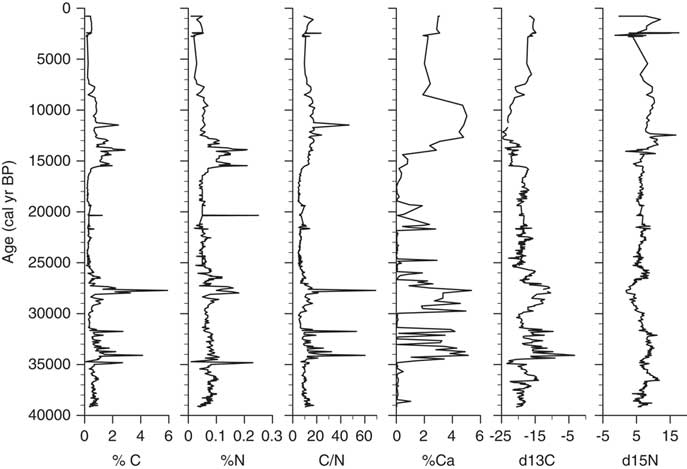
δ13C values of bulk organic carbon in the Salar de Coipasa core range from −3.3 to −24.7‰, with a mean value of −18.38‰ (Fig. 4). In Lake Titicaca, δ13C values of organic carbon from deep-water sediments of pelagic origin are generally between −15 and −25‰ (Cross et al., Reference Cross, Baker, Seltzer, Fritz and Dunbar2000; Rowe et al., Reference Rowe, Dunbar, Mucciarone, Seltzer, Baker and Fritz2002). This suggests that the organic matter in the Coipasa core is composed primarily of algal carbon (in both lakes, it is believed that terrestrial input of particulate organic carbon is minor).
Geochemical data plotted on an age scale (cal yr BP).
In the lower unit of the core, between 8 and 14 m (∼25,800–39,200 cal yr BP), δ13C values are more variable than in overlying sediments. Within this lower zone two distinct intervals exhibit markedly enriched δ13C values: 8–9.5 m (∼25,800–29,300 cal yr BP) and 10.4–11.6 m (31,600–34,400 cal yr BP). The former unit (8–9.5 m) contains abundant rooted macrophytes, indicative of shallow-water environments. A macrophyte sampled at 8.8 m depth (∼27,100 cal yr BP) had a δ13C value of −11.62‰. In Lake Titicaca sediments, macrophytes generally have high δ13C values (>−15‰) relative to algae (Cross et al., Reference Cross, Baker, Seltzer, Fritz and Dunbar2000), consistent with the values here. The relatively high δ13C values in the Salar de Coipasa sediments between 10.4 and 11.6 m are likely due to increasing salinization of the lake during this period (an inference that we discuss later).
Above 8 m (25,800 cal yr BP), δ13C values are notably less variable than during the preceding interval. Between 2.25–8 m (15,500–25,800 cal yr BP), values range between −21 and −18‰. From 1.8–2.25 m (13,000–15,500 cal yr BP) δ13C values are lower and range between −19 and −24‰. At ∼1.8 m (13,000 cal yr BP) slightly higher δ13C, values (−19 to −20‰) persist for a brief interval (1.2–1.8 m, 6500–13,000 cal yr BP) before δ13C again shifts to lower values, with a minimum of −24.7‰. This interval of more negative δ13C is coincident with an increase in % planktic diatoms (see below) to almost 100%, which suggests a deep lake. For the uppermost section of the core (0–1.2 m, <6500 cal yr BP), δ13C values are relatively constant between approximately −15 and −17‰.
Nitrogen isotopes in the sediment column range from 0–17.6‰, with an average of 6.83‰ (Fig. 4). Values are positively correlated with δ13C values for the intervals 2.5–8 m (16,900–25,800 cal yr BP) and 10–14 m (30,600–39,200 cal yr BP), which are both units of laminated sediments. δ15N in sediments for the intervals 0–2.5 m (non-laminated mud; 0–16,900 cal yr BP) and 8–10 m (macrophyte-bearing mud; 25,800–30,600 cal yr BP) is negatively correlated with δ13C. δ15N values between 1.0–2.5 m (4100–16,900 cal yr BP) are high (∼10‰), coincident with an excursion to more negative δ13C and increased % planktic diatoms, %Ca, C/N, and weight percent organic carbon (TOC) and nitrogen (TN). Shifts in δ15N in lake sediments can have several causes, including changes related to rates of nitrogen fixation by algae, nitrification or denitrification of the lake, ammonia volatilization, or change in nitrogen source (Talbot, 2001).
Most C/N values in the core are between 5–10 (Fig. 4), a range characteristic of phytoplankton, which are relatively N rich (Cross et al., Reference Cross, Baker, Seltzer, Fritz and Dunbar2000, Talbot, 2001). Two C/N spikes >50 between 10 and 12 m (30,600–35,200 cal yr BP) are the apparent result of an increase in TOC and coincide with an increase in %Ca and more positive δ13C values, possible indicators of a decrease in lake volume. A C/N spike of 68 at 9 m (27,700 cal yr BP) is likely due to an increase of organic carbon from the macrophyte remains found at this depth.
Calcium carbonate content (reported as weight percent Ca) ranges up to 15 wt% of the sediment. There are three carbonate-rich intervals: 10.5–11.8 m (31,800–34,800 cal yr BP), 8.5–9.8 m (26,600–30,200 cal yr BP), and 1.5–2.0 m (10,600–14,050 cal yr BP). In the two deeper intervals, most of the CaCO3 occurs as gastropod shells, and the high values represent periods of shallow and perhaps more saline lacustrine conditions. The upper carbonate-rich interval does not contain any shells; instead the carbonate here occurs as micrite. This carbonate-rich interval coincides with a deep and fresher lacustrine phase based on interpretations from diatom analysis.
Diatoms
The diatom flora of Salar de Coipasa consists of a mixture of planktic and benthic species, characteristic of a lake of variable depth and salinity through time (Fig. 5). The most common planktic taxon is Cyclotella chochtawatcheana, which occurs in abundance in deep stably stratified saline lakes (Fritz et al., Reference Fritz, Juggins and Battarbee1993), brackish estuaries, and in nearshore marine systems (Prasad, Reference Prasad1990). Also present in moderate abundance is Cyclotella meneghiniana, which grows in lakes of varied depth and salinity but is common in shallow systems (Fritz et al., Reference Fritz, Juggins and Battarbee1993). Discostella stelligera is characteristic of fresh to hyposaline (<10 g/L) waters and occurs in lakes that are of shallow to moderate depth, as well as in nearshore regions of large deep lakes (Tapia et al., Reference Tapia, Fritz, Baker, Seltzer and Dunbar2003). In the planktic-dominated intervals of the Salar de Coipasa core, we interpret high relative abundance of C. chochtawatcheana to represent a deep chemically stratified lake. Salinity is likely lower in the intervals with a high abundance of D. stelligera.
Diatom stratigraphy of major taxa expressed as relative abundance and plotted versus age (cal yr BP).
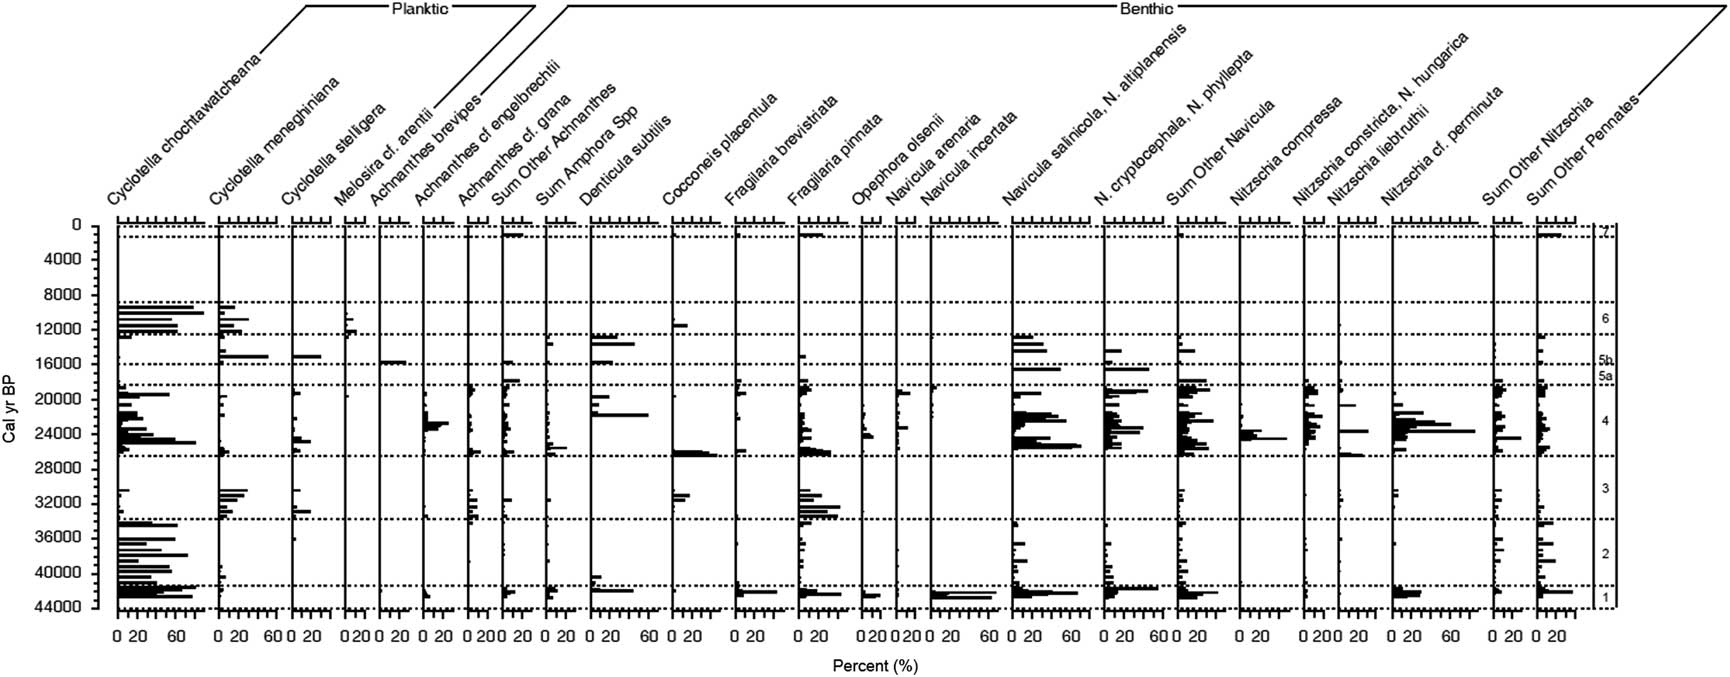
The attached diatom flora of Salar de Coipasa is diverse. It includes tychoplanktic species, such as Pseudostaurosira brevistriata and Staurosirella. pinnata, which can be entrained into the plankton by mixing. The attached benthic species include several taxa characteristic of higher salinity, such as Denticula subtilis and Achnanthes brevipes; Cocconeis placentula, which grows on macrophytes; and high representation by species in the genera Navicula and Nitzschia.
A deep to moderately deep lake dominated by C. chochtawatcheana characterized the basin from 29,900 to 39,200 cal yr BP (zones 1 and 2; 9.70–13.82 m), with a few brief periods within zone 1 (11.66–13.82 m; 34,500–39,200 cal yr BP) that were slightly shallower based on moderate percentages of benthic diatoms. Between 26,400 and 29,900 cal yr BP (zone 3; 8.38–9.70 m), the mixture of C. meneghiniana, S. pinnata, and benthic taxa indicates a moderately shallow system with extensive macrophyte beds, as suggested by the epiphytic Cocconeis placentula. During the LGM (∼18,700 to 26,400 cal yr BP; zone 4; 3.02–8.38 m), variation in the relative abundance of planktic and benthic taxa suggests that lake level fluctuated from moderately deep in the C. chochtawatcheana-dominated zones to shallower in samples with higher relative abundance of benthic diatoms. Benthic diatoms dominated most of the period from 18,700 to 13,500 cal yr BP (zone 5; 1.90–3.02 m), which suggests generally shallow conditions, including some intervals of higher salinity when the relative abundance of Denticula subtilis was high. Yet one sample in zone 5b, dated at 14,800 cal yr BP, is distinctive in the high percentages of the planktic species D. stelligera and C. meneghiniana. This suggests a moderately deep freshwater lake and is correlative with the terminal part of the paleolake Tauca phase in the basin (Baker et al., Reference Baker, Rigsby, Seltzer, Fritz, Lowenstein, Bacher and Veliz2001a). Immediately above this, the high representation of C. choctawatcheana and the low abundance of benthic diatoms suggest that from ∼13,100–10,600 cal yr BP (zone 6; 1.50–1.86 m) a deep chemically stratified lake occupied the basin. Diatoms are absent from most of the Holocene samples in the upper part of the core, except for the uppermost sample (diatom zone 7; 0.30 m), which dates from ∼800 cal yr BP. The barren samples are those with high concentrations of halite.
DISCUSSION
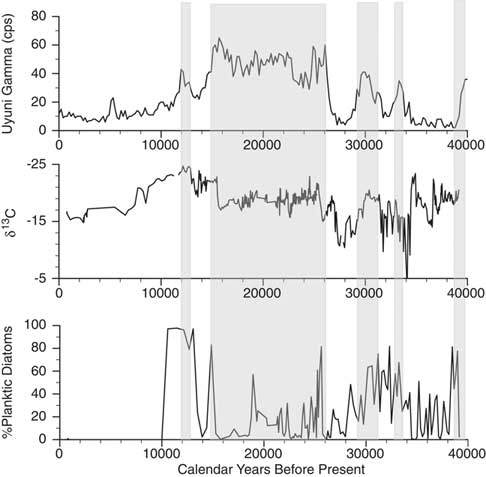
The most notable feature of the Salar de Coipasa record is the continuous presence of lacustrine sediments in the basin from ∼40,000 to 5500 cal yr BP, with no evidence of complete desiccation in that interval. The geochemical, sedimentological, and paleobiotic composition of these sediments (Fig. 6) is consistent with the existence of a permanent lake of varied depth and salinity in the basin.
Comparison of the Salar de Coipasa δ13C and planktic diatom records with the lake-level history of Salar de Uyuni as inferred from the measurement of gamma radiation in the drill core (Baker et al., Reference Baker, Rigsby, Seltzer, Fritz, Lowenstein, Bacher and Veliz2001a). Shaded zones are the lacustrine units identified in the Salar de Uyuni drill core.

In the following discussion, we rely primarily on diatom assemblages and carbon isotopic composition of organic carbon to form our inferences about lake level. Our basis for inference of lake level using δ13C relies on studies that show a strong correlation (generally higher than 0.8) between δ13C and δ18O of carbonate sediments formed in closed-basin lakes (Talbot, Reference Talbot1990; Li and Ku, Reference Li and Ku1997). In most tropical settings, δ18O of carbonate sediments is strongly dependent on δ18O of lake water and, in turn, on precipitation amount (e.g., Baker et al., Reference Baker, Fritz, Burns, Ekdahl and Rigsby2009). We reason that δ13C of lacustrine algae behaves similarly and will be dependent on evaporative concentration, lake level, and ultimately, precipitation amount. This inference assumes that the organic carbon is of purely algal origin, and this could be verified by future studies that consider isolated fractions of the total organic carbon pool. That said, most intervals of the core are dominated by lacustrine algae, rather than macrophyte- or terrestrial-derived carbon.
Hydrologic conditions in the Coipasa basin during the interval between 40,000 and 29,000 cal yr BP were highly variable, fluctuating between deep lake phases dominated by Cyclotella chochtawatcheana and with depleted δ13C values (<−18‰) and moderately shallow lake phases. In particular, multiple short intervals of lowered lake level occurred between 34,400 and 31,600 cal yr BP, marked by enriched δ13C values (−18 to −3‰), and higher proportions of benthic diatoms, including the saline taxon, Denticula subtilis. Lacustrine sedimentation was continuous, indicating that at no time during this period was the lake completely desiccated.
Between ∼29,000 and 25,600 cal yr BP, δ13C values in the Salar de Coipasa sediments are relatively high (>−18‰) and constant, benthic diatoms and the shallow-water planktic taxon Cyclotella meneghiniana are relatively abundant, and C/N values are also elevated to values common in macrophytes (Cross et al., Reference Cross, Baker, Seltzer, Fritz and Dunbar2000; Rowe et al., Reference Rowe, Dunbar, Mucciarone, Seltzer, Baker and Fritz2002). Rooted macrophytes occurred in the sediments of this interval (Fig. 2), coupled with the epiphytic diatom Cocconeis placentula, which grows attached to macrophytes. Together the data indicate a persistently shallow lake with abundant aquatic plants.
Between ∼25,000 and 16,000 cal yr BP, δ13C values are relatively depleted (<−18‰) and constant, whereas the diatom species composition is quite variable, suggesting that although a lake persisted through this interval, it varied considerably in depth. Afterward, a rapid decrease in δ13C values accompanied by the highest abundance within the entire record of the freshwater planktic diatom, Discostella stelligera, at ∼14,800 cal yr BP signals a freshening of the lake, coincident with paleoshoreline evidence of the highest lake stand of the last glacial cycle, paleolake Tauca (Servant and Fontes, Reference Servant and Fontes1978; Sylvestre et al., Reference Sylvestre, Servant, Servant-Vildary, Causse, Fournier and Ybert1999), which reached a maximum elevation of ∼3760 m asl (ca. 110 m deep). This high stand is correlative with the end of the Northern Hemisphere Heinrich 1 event, which increased precipitation on the Altiplano through teleconnections with meridional North Atlantic SST gradients that increased the advection of moisture onto the continent and intensified the SASM (Baker et al., Reference Baker, Rigsby, Seltzer, Fritz, Lowenstein, Bacher and Veliz2001a, Reference Baker, Seltzer, Fritz, Dunbar, Grove, Tapia, Cross, Rowe and Broda2001b; Baker and Fritz, Reference Baker and Fritz2015).
Between ∼13,000 and 10,600 cal yr BP, coincident with the Younger Dryas, δ13C values are more negative (−20 to −24‰), reflecting lake filling that produced the Coipasa highstand, which attained water depths of ∼45 m (Servant and Fontes, Reference Servant and Fontes1978; Sylvestre et al., Reference Sylvestre, Servant, Servant-Vildary, Causse, Fournier and Ybert1999). The dominance of Cyclotella chochtawatcheana suggests that the lake was moderately deep and more saline than during the Tauca high stand. After ∼10,000 cal yr BP, δ13C values become more enriched, which suggests gradual evaporative drawdown of the lake. Diatoms are not preserved in the upper part of the core, likely because of elevated pH and salinity.
Two intervals of salt deposition occur in the upper part of the core: ∼5500–2800 and <1,000 cal yr BP. The former interval is consistent with widespread evidence for a dry mid-Holocene (Baker et al., Reference Baker, Seltzer, Fritz, Dunbar, Grove, Tapia, Cross, Rowe and Broda2001b). Yet, after 4500 cal yr BP, Lake Titicaca rose, whereas lake levels remained shallow in Salar de Coipasa and Salar de Uyuni was dry (Baker et al., Reference Baker, Rigsby, Seltzer, Fritz, Lowenstein, Bacher and Veliz2001a).
Overall the Salar de Coipasa stratigraphy is remarkably coherent with that of the nearby Salar de Uyuni (Fig. 6), excepting two intervals: (1) from ∼34,400–38,000 cal yr BP when lake levels fluctuated from shallow to moderately deep in Salar de Coipasa, whereas the Salar de Uyuni was dry or occupied by a salt-saturated lake; and (2) in the early Holocene when the Salar de Uyuni apparently desiccated more quickly than Salar de Coipasa. The differences in hydrology in these intervals may be a function of the larger surface area of Uyuni and the larger flux of rivers draining into Coipasa (e.g., Rio Lauca and paleo-Rio Laka Jahuira) compared with those draining into Uyuni (e.g., Rio Grande). Consistent with the evidence from paleoshoreline deposits and the Salar de Uyuni drill core, the microfossil and geochemical (δ13C, δ15N, %Ca, and C/N) data suggest the deepest conditions in Salar de Coipasa occurred during the terminal phase of paleolake Tauca and at the time of paleolake Coipasa.
The general coherence of the stratigraphy of the Salar de Coipasa and Salar de Uyuni drill cores in the period prior to ∼24,000 cal yr BP supports the original chronology of the Salar de Uyuni drill core (Baker et al., Reference Baker, Rigsby, Seltzer, Fritz, Lowenstein, Bacher and Veliz2001a; Fritz et al., Reference Fritz, Baker, Lowenstein, Seltzer, Rigsby, Dwyer, Tapia, Arnold, Ku and Luo2004; Baker and Fritz, Reference Baker and Fritz2015) and suggests that the drill-core radiocarbon dates in this interval are not in error by more than a few thousand years, not tens of thousands of years, as suggested by Placzek et al. (Reference Placzek, Quade and Patchett2013). The drill-core lacustrine units in this interval are correlative with tufa samples of similar ages originally identified as paleolake “Minchin” from outcrops in the Salar de Uyuni and Salar de Coipasa basins (Servant and Fontes, Reference Servant and Fontes1978; Rondeau, Reference Rondeau1990). Although contamination of samples with younger radiocarbon is certainly possible, the parsimonious explanation is that the radiocarbon measurements are relatively robust within the measurement errors given the consistency among multiple measurements on different materials (shells, tufa, and lake sediment) and in different locations.
In addition to the dating of lacustrine sediments in drill cores and outcrops from the salars, several other regional records point to elevated effective moisture during the LGM and the latter parts of MIS 3, which would have maintained lakes in the southern Altiplano and increased glacial mass balance. Paleoclimatic data indicate that Lake Titicaca was deep, fresh, and overflowing during this entire interval (Baker et al., Reference Baker, Rigsby, Seltzer, Fritz, Lowenstein, Bacher and Veliz2001a; Fritz et al., Reference Fritz, Baker, Seltzer, Ballantyne, Tapia, Cheng and Edwards2007, Reference Fritz, Baker, Ekdahl, Seltzer and Stevens2010), providing significant discharge to the central and southern Altiplano (Nunnery, Reference Nunnery2012). Other Altiplano records also corroborate the inference of moderate to high effective moisture in this interval, including the presence of lacustrine sediments in drill cores in the Rio Desaguadero valley (Rigsby et al., Reference Rigsby, Bradbury, Baker, Rollins and Warren2005) and regional glacial advance (Blard et al., Reference Blard, Lave, Farley, Ramirez, Jimenez, Martin, Charreau, Tibari and Fornari2014). Neighboring regions under similar climatic influences were also wet at the same time, based on perennial lake deposits in northwestern Argentina (22°S, 66°W; McGlue et al., Reference McGlue, Cohen, Ellis and Kowler2013), evidence of frequent climate-driven landslides in the Santa Maria Basin of northwestern Argentina (24°S, 66°W; Trauth et al., Reference Trauth, Bookhagen, Marwan and Strecker2003), lacustrine sediments in a drill core from Salar de Atacama (23°S, 68°W; Bobst et al., 2001), and speleothem records from throughout the SASM domain (Cheng et al., Reference Cheng, Sinha, Cruz, Wang, Edwards, d’Horta, Ribas, Vuille, Stott and Auler2013). Thus, multiple lines of evidence are inconsistent with the inference of general aridity in the southern Altiplano during MIS 3, as suggested by Placzek et al. (Reference Placzek, Quade and Patchett2013), and instead support the inference of sufficient moisture to support shallow to moderately deep lakes in the salars of the Altiplano during most of this period. These findings highlight the importance of developing multiple regional records to evaluate divergent interpretations of paleoclimatic history more completely.
ACKNOWLEDGMENTS
C. Rigsby, G. Mollericon, and A. Mollericon assisted with fieldwork, and S. Brown assisted with graphing the diatom data. The research was supported by NSF grants EAR-1251678 and EAR-1338694 to SF and PB; a Tage Erlander Visiting Professorship to SF from the Swedish Research Council supported writing of the manuscript.
A. Nunnery participated in fieldwork, described and subsampled the cores, carried out the geochemical analyses, oversaw data interpretation, and wrote an earlier version of the manuscript as a chapter of his Ph.D. dissertation. S. Fritz counted the diatoms, contributed to data interpretation, and took primary responsibility for revising the manuscript. P. Baker designed the project, oversaw the fieldwork, and contributed to data interpretation and writing of the manuscript. W. Salenbien assisted with Bayesian age model construction and drafting of figures.


 Open access