


1. Introduction
To maximize power density of wind farms, power losses caused by low-momentum wind turbine wakes need to be reduced. Wake-steering by intentional misalignment of wind turbines redirects wakes from downstream turbines to increase overall power output, and has received significant interest due to promising results in application (Fleming et al. Reference Fleming, Annoni, Shah, Wang, Ananthan, Zhang, Hutchings, Wang, Chen and Chen2017, Reference Fleming2019; Howland, Lele & Dabiri Reference Howland, Lele and Dabiri2019; Fleming et al. Reference Fleming2020; Howland et al. Reference Howland, González, Pena Martínez, Quesada, Larrañaga, Yadav, Chawla and Dabiri2020). Though it was confirmed early on that rotor-misalignment deflects a wind turbine wake (Clayton & Filby Reference Clayton and Filby1982), the overall power gain for a wind farm is more difficult to quantify as it depends on a balance between the increase in power for the downwind turbines and the reduction in power from misalignment. In order to implement such control strategies successfully, accurate wake models based on a thorough understanding of the wake dynamics are essential if these are to be implemented (Hamilton et al. Reference Hamilton, Viggiano, Calaf, Tutkun and Cal2018; Ali & Cal Reference Ali and Cal2020).
So far, wake-steering by yaw misalignment has received the most interest, as it can be fitted retroactively to existing wind farms. Yet, several large eddy simulations (LES) studies (Fleming et al. Reference Fleming, Gebraad, Lee, van Wingerden, Johnson, Churchfield, Michalakes, Spalart and Moriarty2014; Cossu Reference Cossu2020) and recent experimental results (Scott, Bossuyt & Cal Reference Scott, Bossuyt and Cal2020a) have indicated that tilt-misalignment could allow for even larger gains. Tilt-misalignment of a wind turbine deflects the wake vertically, such that a wake can be steered upwards into higher momentum flow, or downwards into the ground (Fleming et al. Reference Fleming, Gebraad, Lee, van Wingerden, Johnson, Churchfield, Michalakes, Spalart and Moriarty2014; Rockel et al. Reference Rockel, Camp, Schmidt, Peinke, Cal and Hölling2014, Reference Rockel, Peinke, Hölling and Cal2016, Reference Rockel, Peinke, Hölling and Cal2017; Annoni et al. Reference Annoni, Scholbrock, Churchfield and Fleming2017; Bay et al. Reference Bay, Annoni, Martínez-Tossas, Pao and Johnson2019; Kadum et al. Reference Kadum, Rockel, Hölling, Peinke and Cal2019; Su & Bliss Reference Su and Bliss2020; Scott et al. Reference Scott, Bossuyt and Cal2020a,Reference Scott, Viggiano, Dib, Ali, Hölling, Peinke and Calb; Wang, Liao & Ma Reference Wang, Liao and Ma2020). Because the turbine wake can be directed above or below subsequent turbines, tilt-misalignment is especially promising for large wind farms where wake expansion eventually covers the entire farm limiting downwind transfer of kinetic energy (Cal et al. Reference Cal, Lebrón, Castillo, Kang and Meneveau2010; Calaf, Meneveau & Meyers Reference Calaf, Meneveau and Meyers2010; Hamilton et al. Reference Hamilton, Kang, Meneveau and Cal2012; Bossuyt, Meneveau & Meyers Reference Bossuyt, Meneveau and Meyers2018). Tilt misalignment can thus be a tool to increase overall downwards transfer of mean kinetic energy to improve power output of large wind farms. Cossu (Reference Cossu2020) illustrated with LES how tilted wind turbines can be used to alter the vertical interaction with the boundary layer through generation of high-momentum streaks. While dynamic tilt control is currently not possible on most utility-scale wind turbines, current wind turbines are built with a static tilt angle of the order of  ${\approx }5^{\circ }\text {--}6^{\circ }$ (Jonkman et al. Reference Jonkman, Butterfield, Musial and Scott2009; Gaertner et al. Reference Gaertner2020), to prevent blade tower strikes. With the evolution to larger turbine diameters, the concept of downwind operating rotors to allow for larger and flexible blades, while preventing tower-blade strikes (Ichter et al. Reference Ichter, Steele, Loth, Moriarty and Selig2016), would allow for negative tilt angles and thus make it possible to employ static-tilt wake steering in utility-scale wind farms.
The flow properties of a yawed wind turbine wake have been thoroughly studied as wind turbines commonly operate in a state of yaw misalignment due to imperfect measurements of the local wind direction; see Porté-Agel, Bastankhah & Shamsoddin (Reference Porté-Agel, Bastankhah and Shamsoddin2020) for a recent overview and Grant & Parkin (Reference Grant and Parkin2000) and Parkin, Holm & Medici (Reference Parkin, Holm and Medici2001) for early experimental results. Medici & Alfredsson (Reference Medici and Alfredsson2006) performed detailed hot-wire measurements of the cross-plane velocity components in the wake of a wind turbine in a low turbulent inflow, showing that the wake rotation plays a significant role in wake development. Howland et al. (Reference Howland, Bossuyt, Martínez-Tossas, Meyers and Meneveau2016) studied the shape of a yawed wind turbine with wind tunnel experiments of a porous disk, and with LES of an actuator disk and actuator line model. Analysis of the wake structure indicated the presence of a counter-rotating vortex pair system, which deflects the wake and creates a curled wake shape. The actuator line model was found to result in a more complex wake shape as compared with the porous disk and actuator disk, due to the added effects of wake rotation. Recently, Zong & Porté-Agel (Reference Zong and Porté-Agel2019) provided more insight into how the missing hub-vortex system in the wake of a porous disk can affect the overall wake shape. The observed wake-curling mechanism for yaw misalignment was confirmed by Bastankhah & Porté-Agel (Reference Bastankhah and Porté-Agel2016), Bartl et al. (Reference Bartl, Mühle, Schottler, Sætran, Peinke, Adaramola and Hölling2018a) and Castellani et al. (Reference Castellani, Astolfi, Natili and Mari2019) based on particle image velocimetry (PIV) measurements of a scaled wind turbine. By using a potential flow analysis of the counter-rotating vortex pair, they explained the slight upwards or downwards movement of the wake centre, depending on the yaw angle and wake rotation.
Based on these improved insights, Shapiro, Gayme & Meneveau (Reference Shapiro, Gayme and Meneveau2018) represented the yawed wind turbine by a porous lifting surface with an elliptical lift distribution, and applied the lifting line theory, developed by Prandtl, to calculate the initial magnitude of the transverse velocity component. The far-wake expansion is then modelled similarly to a classical wake model with linear wake expansion, for both the streamwise and spanwise velocity component. Several recent works (Martínez-Tossas et al. Reference Martínez-Tossas, Annoni, Fleming and Churchfield2019; Zong & Porté-Agel Reference Zong and Porté-Agel2019) model the vorticity distribution by a series of point vortices along the edge of the rotor area. These models are able to describe wake deflection and deformation due to yaw misalignment. Yet, tuning is necessary to correctly capture the decay of the vortex system from turbulent mixing. The model by Martínez-Tossas et al. (Reference Martínez-Tossas, Annoni, Fleming and Churchfield2019) can also be used to simulate tilted wind turbines (Bay et al. Reference Bay, Annoni, Martínez-Tossas, Pao and Johnson2019). The authors indicate that, contrary to a yawed wind turbine, the counter-rotating vortices from tilt can persist over more than one turbine spacing downstream and positively affect the wake of the next wind turbine also if that turbine is not tilted. This finding provides further support that gains of tilt-misalignment may exceed those of yaw. More recently, Shapiro, Gayme & Meneveau (Reference Shapiro, Gayme and Meneveau2020) developed an analytical expression for the decay of circulation for each of the counter-rotating vortex cores in a yawed wake, based on the growth rate of the vorticity length scale (taken as the width of the vorticity distribution) and the boundary layer friction velocity. This new model shows good agreement with LES results for a yawed porous disk. Their LES results support the notion that the decay of the counter-rotating vortex pair is dominated by turbulent mixing and the resulting gradual cancellation of vorticity from the two counter-rotating vortex cores.
Tilted wind turbine wakes have also been studied by using a vortex lattice method combined with a free-wake model for the downstream development of the shed vortices (Su & Bliss Reference Su and Bliss2020). This approach has confirmed the occurrence of a counter-rotating vortex from misalignment and provides detailed insights in the vortex dynamics, though assumptions need to be made about the initial vortex-core size, and turbulent diffusion to set downstream development and breakdown of the wake. A wake characterization based on wind tunnel experiments can provide accurate parameters for such models.
Compared with yaw misalignment, the flow dynamics in the wake of a tilted wind turbine are more complex due to the non-symmetric interaction with vertical shear of mean velocity in an atmospheric boundary layer and the blockage and friction by the ground. The focus of this paper is specifically on characterizing and quantifying these non-symmetrical effects on wakes of a positively or negatively tilted wind turbine, and compare with a yawed wake. Though significant improvements have been made in understanding misaligned wake dynamics, experimental data is necessary for a better characterization of a tilted wake, and quantification of the decay of the counter-rotating vortex pair. Furthermore, experiments are needed to validate LES results, commonly used as reference for models, and verify the impact of simulation approximations (Martinez-Tossas et al. Reference Martinez-Tossas, Churchfield, Yilmaz, Sarlak, Johnson, Sørensen, Meyers and Meneveau2018) on the vortex decay and wake development. Therefore, cross-plane PIV measurements have been performed on a tilted and yawed wind turbine for a detailed characterization of wake shape and dynamics. The experimental set-up is described in § 2. Results are discussed in § 3, covering, in order, a discussion on the measured wake shape (§ 3.1), deflection of wake centre (§ 3.2), available power (AP) in the wake § 3.3, identification of the counter-rotating vortex cores (§ 3.4), point-vortex-model analysis (§ 3.5), wake recovery (§ 3.6) and a comparison of the measured contributions with the Reynolds-averaged Navier–Stokes (RANS) equation in the streamwise direction (§ 3.7).
2. Experimental set-up
Wind tunnel experiments were performed in the closed-loop wind tunnel at Portland State University. The test section consists of a  $0.8\ \textrm {m} \times 1.2\ \textrm {m}$ cross-section with a test length of 5 m. The wind tunnel speed can be adjusted between 2 and $40\ \textrm {ms}^{-1}$. The tunnel ceiling was configured to approach a zero-pressure gradient boundary layer. The sidewalls are assembled of schlieren-grade annealed float glass fastened to the steel framework to ensure maximum access for the laser and camera (Hamilton, Melius & Cal Reference Hamilton, Melius and Cal2015; Aseyev & Cal Reference Aseyev and Cal2016; Ali et al. Reference Ali, Hamilton, DeLucia and Cal2018).
Stereoscopic particle image velocimetry (S-PIV) was used to measure two-dimensional– three-component (2-D–3C) velocity fields in planes perpendicular to the main flow direction. The S-PIV set-up consisted of two 4M pixel CCD cameras and a Litron Nano double pulsed Nd:YAG (532 nm, 1200 mJ, 4 ns duration) laser. The camera lenses had a focal length of 100 mm and were set to a fixed aperture of f/2.8. The thickness of the laser sheet (approximately 2–3 mm) and the delay time between the laser pulses ( $50\ \mathrm {\mu } \textrm {s}$) was tuned to obtain optimal quality of the velocity vector reconstruction, while preventing significant out-of-plane motion of PIV particles, which is essential to keep the peak-detection error small. The uncertainty on the measured velocities was estimated with Davis8.4 software using the correlation statistics approach by Wieneke (Reference Wieneke2015). The estimated uncertainty over all planes is at most $0.05\ \textrm {m}\ \textrm {s}^{-1}$ for $U$ and $0.03\ \textrm {m}\ \textrm {s}^{-1}$ for $V$ and $W$. The cameras were set up on one side of the wind tunnel, with a view angle of $45^{\circ }$ to the measurement plane. A Scheimpflug adapter was used to correct the camera focus to the measurement plane. Neutrally buoyant fluid particles of diethylhexyl sebacate were aerosolized by a seeding generator with a constant density throughout the experiment. For each measurement 1500 independent snapshot-pairs were recorded at a frequency of 4 Hz and DAVIS 8.4 software was used to apply a multipass fast Fourier transform-based cross-correlation algorithm and apply a universal outlier detection method to filter out any bad vectors from the PIV data. A multiple-pass reducing size interrogation window of $48 \times 48$ pixels and $24 \times 24$ pixels, with a 50 % overlap was used to process the data. The PIV window covers an area of 0.24 m by 0.18 m, with a vector resolution of approximately 0.9 mm. Several planes were measured in the wake of the turbine by changing the relative position of the scaled wind turbine model compared with the location of the fixed PIV measurement plane. Time-averaging was approximated by ensemble averaging over all S-PIV snapshots.
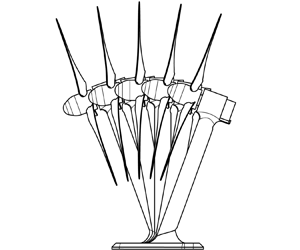
A scaled wind turbine model with a diameter of 0.08 m and hub height of 0.084 m was used for the wind tunnel experiments, see figure 1(a). The rotor design by Odemark & Fransson (Reference Odemark and Fransson2013) was geometrically scaled from a diameter of 0.226 m to a diameter of 0.08 m, such that the S-PIV measurements captured the full wake shape. The rotor blades were 3-D printed on a 3D Systems ProJet MJP 3600 in high detail resin. A Faulhaber 1016SR direct current (DC) motor, with a diameter of 0.01 m was used as a DC generator to control the tip speed ratio. Positive and negative tilt are defined as shown in figure 1(b). Positive yaw is defined as clockwise seen from a top view. For each tilt angle, a scaled turbine tower was 3-D printed with a fixed tilt rotation around its base, similar to the tilt movement of a floating wind turbine, see figure 1(b). As a result, for a tilt angle of  $\pm 20^\circ$, the hub height is 0.0045 m lower, and 0.026 m downstream or upstream, respectively, which is considered in relative comparisons in the results section. The thrust coefficient was measured in the boundary layer inflow with a 100 g double-beam bending load cell, mounted between the DC motor and an adjusted tower such that only the force on the rotor is measured, and not the drag of the tower. With an incoming velocity at hub height of $U_H=6.5\ \textrm {m}\ \textrm {s}^{-1}$, a thrust coefficient of $C_T\approx 0.6\text {--}0.65$ and power coefficient of $C_p\approx 0.15$ were measured for a tip speed ratio of $\gamma \approx 4$. The power coefficient was estimated from the measured current and the motor torque constant specified by the manufacturer, which should give a reasonable estimate following the discussion by Bastankhah & Porté-Agel (Reference Bastankhah and Porté-Agel2017). However, it is important to note that several losses (e.g. friction and electrical losses) are likely to be underestimated, and that the motor constant provided by the manufacturer is only a rough indication.
(a) Schematic of the scaled wind turbine model, (b) side view of the tilted model for  $-20^{\circ },-10^{\circ }, 0^{\circ }, 10^{\circ }, 20^{\circ }$ and (c) yaw direction convention.

The Reynolds number, based on turbine diameter and hub-height velocity, is  $Re_D=3.3\times 10^4$, which is considered within but on the lower end of acceptable Reynolds numbers to capture the main large-scale wake dynamics outside of the near-wake region in a turbulent boundary layer (Lim, Castro & Hoxey Reference Lim, Castro and Hoxey2007; Chamorro, Arndt & Sotiropoulos Reference Chamorro, Arndt and Sotiropoulos2012). Similarly, the thrust coefficient is reasonably high (e.g. close to the range of practical values for a wind turbine operating in the below rated and rated regime: $C_T=0.75\text {--}0.9$). The circulation of the counter-rotating vortex pair scales with the thrust coefficient (Shapiro et al. Reference Shapiro, Gayme and Meneveau2018), and the strength of the hub- and tip-vortices of an aligned turbine scale with the power coefficient (Burton et al. Reference Burton, Sharpe, Jenkins and Bossanyi2001). For a wind turbine with larger thrust coefficient and power coefficient one can expect a higher value for the circulation of the vortex cores, which would lead to stronger wake curling. The realistic thrust coefficient of the model turbine is expected to result in a counter-rotating vortex pair with a correctly scaled circulation, while the relatively lower power coefficient is expected to result in a slightly lower circulation for the hub- and tip-vortices in the aligned scenario. The interaction with hub- and tip-vortices is discussed in more detail in § 3.4. Based on the Reynolds number, the large-scale interaction of the wind turbine wake with turbulent mixing from the boundary layer is expected to scale correctly (Lim et al. Reference Lim, Castro and Hoxey2007). Though the focus of this study is on tilted wakes, results for yaw misalignment are also included throughout the paper in order to make a valuable comparison, and identify fundamental differences. Considering that the flow dynamics for yaw and tilt are fundamentally connected, several of our findings are also of importance for yaw misalignment. Furthermore, the measurements for a yawed wind turbine in this study show excellent agreement with results in the literature (see § 3.1), and serve as a validation for the performance of the experimental set-up.
The wind tunnel inflow was conditioned with vertical strakes at the entrance and by covering the floor of the entire test section with a series of chains spaced with a distance of 0.01 m, as shown in figure 2. The chains are directed perpendicular to the flow, and have a height of approximately 0.005 m. The strakes are shaped to match the velocity statistics of a scaled atmospheric boundary layer and were originally designed and used by Cal et al. (Reference Cal, Lebrón, Castillo, Kang and Meneveau2010). The strakes are composed of 0.0125 m thick acrylic and are evenly spaced across the width of the tunnel, with an interval of 0.136 m. The inflow conditions were measured with the S-PIV set-up by removing the wind turbine from the test section. Figure 3 shows a semi-log plot of the time averaged streamwise velocity, and the measured profile of turbulence intensity. The velocity profile indicates a logarithmic region reaching up to the top tip height of the turbine (0.124 m), while the boundary layer height exceeded the measurement plane, which reaches up to a height of 0.2 m. The roughness length scale was estimated by using a linear fit to the logarithmic region of the measured velocity profile, resulting in  $y_0 = 4.6\times 10^{-4}\ \textrm {m}$. By considering the geometric scaling ratio of the scaled wind turbine in comparison with a full-scale turbine with a diameter of $D=100\ {\rm m}$ ( ${\sim }$1 : 1250), the roughness length scale corresponds to a value of $z_{0,FS}=0.6\ \textrm {m}$ in full scale. The corresponding friction velocity was $u_\tau = 0.5\ \textrm {m}\ \textrm {s}^{-1}$. The measured turbulence intensity is shown in figure 3(b), as defined by $TI = \sqrt {\overline {u'^2}}/U_0$, with $U_0=7.6\ \textrm {m}\ \textrm {s}^{-1}$ the highest mean velocity measured in the PIV inflow plane and here used as an estimate for the free stream velocity. At hub height, the inflow turbulence intensity is $TI = 11\,\%$.
Photograph of the experimental set-up in the wind tunnel at Portland State University. The inflow is conditioned with strakes at the inlet, and a roughness pattern created by spanwise oriented chains.

(a) Vertical profiles of time-averaged velocity and (b) turbulence intensity for the scaled boundary layer inflow conditions.

3. Measurement results
Wake deflection by yaw misalignment is known to be caused by the formation of a counter-rotating vortex pair trailing from the top and bottom half of the wind turbine rotor. This mechanism deflects and changes the shape of the wake, also referred to as wake curling (Howland et al. Reference Howland, Bossuyt, Martínez-Tossas, Meyers and Meneveau2016). The change in wake shape can result in more wake deflection in the centre, thereby improving the benefits for a downstream turbine. The improved understanding of this wake-deflection mechanism has helped to develop better physics-based models for wake deflection of yawed wind turbines (Shapiro et al. Reference Shapiro, Gayme and Meneveau2018, Reference Shapiro, Gayme and Meneveau2020; Zong & Porté-Agel Reference Zong and Porté-Agel2019; Martínez-Tossas et al. Reference Martínez-Tossas, Annoni, Fleming and Churchfield2019). Yet, a thorough understanding of tilt-wake deflection, and detailed experimental studies of a tilted wake are missing. In this section, the experimental results are used to characterize changes in wake shape, deflection, and recovery. To identify the underlying mechanisms, the time-averaged vortex-structure in the wake is discussed and the dominant terms in the streamwise RANS equation are characterized.
3.1. Wake shape
Cross-plane measurements of the wake, which demonstrate their shape, are shown in figures 4 and 5, for different tilt and yaw angles, and for a downstream distance of  $3D$ and $7D$, respectively. To isolate the turbine induced momentum changes from the incoming boundary layer flow, contours of streamwise velocity deficit, $\Delta U / U_H = (U-U_{inflow})/U_H$, are shown with the incoming velocity at hub height, $U_H$, and the inflow velocity, $U_{inflow}$, sampled at the same cross-plane location without a turbine present, following Bastankhah & Porté-Agel (Reference Bastankhah and Porté-Agel2016). Measurements of different yaw angles are arranged vertically, while results for tilting are aligned horizontally, such that the relative horizontal and vertical wake deflection can be compared. The wake centre is determined as the maximum of the velocity deficit, after applying a spatial Gaussian smoothing filter with radius $0.1D$, and is indicated with a black dot on each plot. The centre location of the rotor axis is indicated by the dotted cross-hair, taking into account the slight reduction in hub height for a tilted turbine (see figure 1). As expected, yaw misalignment deflects the wake centre horizontally, while tilt misalignment redirects the wake vertically.
Contours of normalized velocity deficit for different yaw angles (arranged vertically) and tilt angles (arranged horizontally) at a streamwise distance of  $x/D=3$ downwind from the turbine. The wake shape is identified by a solid black contour for $\Delta U / \Delta U _{max} = 0.5$, and the fitted ellipse is plotted with a dashed black line.

Contours of normalized velocity deficit for different yaw angles (arranged vertically) and tilt angles (arranged horizontally) at a streamwise distance of  $x/D=7$ downwind from the turbine. The wake shape is identified by a solid black contour for $\Delta U / \Delta U _{max} = 0.5$, and the fitted ellipse is plotted with a dashed black line.

The measured velocity contours for yaw misalignment show good agreement with existing results in the literature from wind tunnel experiments (Bastankhah & Porté-Agel Reference Bastankhah and Porté-Agel2016), LES results (Martínez-Tossas et al. Reference Martínez-Tossas, Annoni, Fleming and Churchfield2019) and full-scale lidar measurements in a field test (Brugger et al. Reference Brugger2020). In comparison with the results of Bastankhah & Porté-Agel (Reference Bastankhah and Porté-Agel2016), the slightly lower thrust and power coefficient of the scaled wind turbine in this experiment result in a slightly smaller velocity deficit. However, the wake shape shows overall an excellent agreement. For a yaw misalignment exceeding 20 degrees, more pronounced wake curling and a larger deflection are expected (Bastankhah & Porté-Agel Reference Bastankhah and Porté-Agel2016; Howland et al. Reference Howland, Bossuyt, Martínez-Tossas, Meyers and Meneveau2016; Bay et al. Reference Bay, Annoni, Martínez-Tossas, Pao and Johnson2019). Previous measurements noted the non-symmetrical wake deflection for positive and negative yaw-angles as a result of wake rotation (Fleming et al. Reference Fleming, Gebraad, Lee, van Wingerden, Johnson, Churchfield, Michalakes, Spalart and Moriarty2014). Similarly, these experiments show more wake deflection for downwards deflecting tilt angles. Neglecting differences in the magnitude of the deflection, the shape of the yaw-deflected wake is relatively symmetric for positive and negative angles, especially in comparison with the non-symmetry seen for positive and negative tilt angles. For negative tilt, the wake is directed towards the ground such that it is affected by blockage of the ground, and interacts with lower-momentum flow with a higher level of turbulence. This downwards displacement aids in directing high-momentum flow from above the turbine to the rotor region of the next turbine, thus enhancing downwards transfer of kinetic energy (Scott et al. Reference Scott, Bossuyt and Cal2020a); a relevant quantity as indicated by Calaf et al. (Reference Calaf, Meneveau and Meyers2010) and Cal et al. (Reference Cal, Lebrón, Castillo, Kang and Meneveau2010). As a result, the wake shape spreads wider as it is pushed into the ground. For positive tilt, the wake is directed upwards, i.e. a ‘flying’ wake (Scott et al. Reference Scott, Bossuyt and Cal2020a), into higher-momentum flow, thereby creating higher levels of shear, which could enhance wake recovery (discussed in more detail in § 3.6). However, as the wake is directed upwards, it reduces the incoming velocity in the upper half-region of the downwind turbine rotor, which otherwise would see the highest wind speeds and contribute the most to power production. Therefore, upwards deflecting tilt may not be ideal for wind plants. Contrary to negative tilt, the wake of a positively tilted wind turbine is not obstructed, and the measurements show that the shape stays mostly circular, thus indicating a smaller degree of wake curling. For an objective comparison, the wake shape is characterized by fitting an ellipse to the measured wake contours (indicated in figures 4 and 5), and plotting the corresponding eccentricity  $e$ in figure 6. For an ellipse, eccentricity can by calculated as $e=\sqrt {1 - b^2 / a^2}$, with $b$ the length of the semiminor axis and $a$ the length of the semimajor axis. For a circle, the eccentricity is zero, while for an increasing ratio of semimajor to semiminor axis, the eccentricity increases, with $e=1$ the limit-case of a parabola. The wake shape is identified by contours of $\Delta U / \Delta U _{max} = 0.5$. Contour data for $y/D<0.3$ is discarded in the fit to prevent bias by low-momentum regions near the ground. As shown in figure 6, the wake of a negatively tilted wind turbine shows the largest values of eccentricity. On the other hand, the wake shape of a turbine with upwards deflecting tilt becomes increasingly circular as it develops downwind. It is concluded that the behaviour of tilt-wake deflection is strongly asymmetric.
Eccentricity of ellipse fitted to measured wake shapes.

3.2. Deflection of wake centre
Figure 7 shows the measured horizontal ( $z/D$) and vertical ( $y/D$) wake deflection. The wake centre is determined as the maximum of the velocity deficit, after applying a spatial Gaussian smoothing filter with radius $0.1D$. Results confirm that also an aligned wind turbine results in a small amount of horizontal wake deflection $z/D\approx 0.13$, as a result of wake rotation, consistent with the finding by Fleming et al. (Reference Fleming, Gebraad, Lee, van Wingerden, Johnson, Churchfield, Michalakes, Spalart and Moriarty2014). As discussed by Zong & Porté-Agel (Reference Zong and Porté-Agel2019), wake deflection for an aligned turbine is affected by two competing effects. It follows from the streamwise momentum equation that vertical shear in mean streamwise velocity will shift the wake centre to one side, depending on blade rotation. On the other hand, stronger tip-vortices at the top-tip location will result in a vertical vorticity imbalance shifting the wake centre in the opposite direction. In the measurement results by Zong & Porté-Agel (Reference Zong and Porté-Agel2019) a zero-wake deflection was measured for an aligned wind turbine, thus indicating that these two effects were balanced. Differences in velocity shear, turbine thrust and power coefficient, can result in a different balance, explaining the deflection of the wake centre for an aligned turbine in this experiment, and also seen in the results of Fleming et al. (Reference Fleming, Gebraad, Lee, van Wingerden, Johnson, Churchfield, Michalakes, Spalart and Moriarty2014) and Bartl et al. (Reference Bartl, Mühle, Schottler, Sætran, Peinke, Adaramola and Hölling2018b). The wake centre is deflected more for negative yaw ( $z/D\approx 0.5$) than for positive yaw ( $z/D\approx -0.18$). Relative to wake deflection by the aligned wind turbine, a yaw angle of $-20^\circ$ results in a deflection of $z/D \approx 0.38$, while a yaw angle of $20^\circ$ corresponds to a horizontal deflection of $z/D \approx -0.3$. Horizontal deflection of wake centre for $+20^{\circ }$ yaw reduces slightly from $x/D=3$ to $x/D=7$. However, compared with the deflection of an aligned wind turbine, the wake centre does show a monotonically increasing deflection with increasing $x/D$. Tilt misalignment also results in a horizontal deflection of $z/D\approx 0.2$ for $20^\circ$ of tilt misalignment, or $z/D\approx 0.07$ compared with an aligned wind turbine. Vertical wake deflection mechanistically occurs in a different manner for positive and negative tilt. For positive tilt, wake deflection is found to increase proportionally with downstream distance. For negative tilt, the wake centre follows a trajectory that is characterized by an initial downwards jump of the wake centre taking place in the first three diameters downstream from the turbine. After four diameters, the wake centre has stagnated vertically, and slowly drifts upwards, indicating an impact and immediate influence by the ground. For both negative tilt angles, a similar trajectory is measured, with a maximum downwards wake deflection of ${-}0.3$ for the largest negative tilt angle of $-20^\circ$.
(a) Wake deflection in the horizontal direction  $z/D$ and (b) vertical direction $y/D$.

3.3. Available power
The hypothetical AP for a second downwind turbine, in comparison with the power of a free-standing turbine, can be calculated from (Vollmer et al. Reference Vollmer, Steinfeld, Heinemann and Kühn2016; Zong & Porté-Agel Reference Zong and Porté-Agel2019)
 \begin{equation} \left.\begin{gathered} f_{AP}(x_T,y_T,z_T) = \iint\limits_G U^3(x_T,y',z') / U^3_{inflow}(x_T,y',z') \, \textrm{d} z' \,\textrm{d} y' \\ G: (y'-y_T)^2 + (z'-z_T)^2 < (D/2)^2,\end{gathered}\right\}\end{equation}
with the coordinates  $x_T,y_T,z_T$ the hypothetical turbine location, $U$ the streamwise velocity in the wake and $U_{inflow}$ the streamwise velocity in front of the first turbine. The AP at a downstream location of $x/D = 7$ is shown in figure 8, as calculated from the PIV measurements. If the first turbine is aligned, the $f_{AP}$ for a second turbine with the same hub height and same $z$ coordinate is $62\,\%$. A power loss of $40\,\%$ is a typical value for wind turbines with a streamwise spacing of the order of $7D$ (Barthelmie Reference Barthelmie2009). Figure 8 shows that if the second turbine is moved out of the wake by moving it along the spanwise direction ( $z$-axis), it can operate in partial wake overlap, with a higher AP. However, certain spanwise shifts can result in even higher losses. For instance, all measurements with no yaw misalignment show small wake deflection towards the positive $z$-direction (see also figure 5), which explains why the power potential is larger for $z<0$ in these cases. With yaw misalignment, the $f_{AP}$ for a turbine located $7D$ downstream with the same hub height, increases to $71\,\%$ for negative yaw, which deflects the wake farther in the positive $z$-direction. Downwards deflecting tilt results in the highest $f_{AP}$ of $80\,\%$, significantly higher than for all other cases. The higher measured $f_{AP}$ is in good agreement with power measurements of two scaled wind turbine models with tilt misalignment by Nanos et al. (Reference Nanos, Letizia, Clemente, Wang, Rotea, Iungo and Bottasso2020), and indicates the higher potential power gains that can be made with downwards deflecting tilt. It is interesting to note that if the second turbine is placed at $z/D\approx -0.75$, negative yaw steering can provide an even higher $f_{AP}$ than downwards deflecting tilt. For upwards deflecting tilt the increase in AP is rather limited, and less than for yaw, thus confirming the stark differences between positive and negative tilt.
Contours of AP.

3.4. Vortex-core identification
In this section, the measurement results for in-plane velocity components are used to characterize the vortex system for a tilted wind turbine, and compare with the well-studied case of a yawed wind turbine. For this purpose, figures 9 and 10 show streamlines for the time-averaged in-plane velocity components superimposed on contours of streamwise vorticity  $\omega _x$, based on time-averaged velocities, and normalized by the hub-height velocity $U_H$ and turbine diameter $D$. Streamwise vorticity is smoothed with a Gaussian kernel with a radius of 4 PIV pixels (equivalent to a radius of $0.05D$) to improve identification of the large-scale vortex structures, and a central difference scheme is used for the derivatives.
Contours of vorticity for different tilt angles and downstream locations, based on ensemble-averaged in-plane velocity components. Solid blue and red lines show contours of  $\varGamma _2={\rm \pi} /2$, as an indication of the vortex cores. The centre of the vortex cores are identified by maxima of $|\varGamma _1|$, and are plotted with *. The wake shape is indicated by a black contour line for $\Delta U / \Delta U_{max} = 0.5$.

Contours of velocity deficit for different yaw angles and downstream locations, based on ensemble-averaged in-plane velocity components. Solid blue and red lines show contours of  $\varGamma _2={\rm \pi} /2$, as an indication of the vortex cores. The centre of the vortex cores are identified by maxima of $|\varGamma _1|$, and are plotted with *. The wake shape is indicated by a black contour line for $\Delta U / \Delta U_{max} = 0.5$.

Figure 9 shows the results for tilt angles of  $+20^\circ$, $0^\circ$ and $-20^\circ$, and streamwise locations of $x/D = 2,3,5,7$. Streamlines indicate the formation of a counter-rotating vortex pair for positive and negative tilt, deflecting the wake up or down. Vortex-core centres are identified by maxima of $\varGamma _1$, and an outline of the vortex cores by contours of $\varGamma _2 = {\rm \pi}/2$, as introduced by Graftieaux, Michard & Grosjean (Reference Graftieaux, Michard and Grosjean2001). For an aligned wind turbine, a negative vortex core is identified corresponding to the hub-vortex of the scaled wind turbine. The sign of the hub-vortex indicates the anticlockwise rotation of the wake, as a result of the clockwise rotation of the rotor blades. Outside of the wake centre a region of positive vorticity takes place as a result of the tip-vortices, in agreement with results by Zong & Porté-Agel (Reference Zong and Porté-Agel2019). While the centre of the wake slowly moves to the right (positive $z$), the location of the vortex core is found to move left ( $z/D=-0.38$ at $x/D=7$). For the tilted wakes, positive and negative vortex cores are identified, confirming the presence of a counter-rotating vortex pair causing wake deflection. Due to the interaction with the hub-vortex, and effects related to velocity shear and the ground, the shape of the positive and negative vortex core is altered. As the counter rotating vortex cores develop downstream, their shape is found to become more symmetric, especially for upwards deflecting tilt. It is expected that turbulent mixing, and the increasing separation between the vortex cores with downstream distance, aid in this evolution of vortex-core shape.
Figure 10 shows the wake evolution for yaw angles of  $+20^{\circ }$, $0^{\circ }$ and $-20^{\circ }$, at a streamwise location of $x/D = 3, 7$. Other than differences in strength of the vortex cores due to interactions with the hub- and tip-vortices, the main behaviour of the counter-rotating vortex pair is found to be more symmetric as a function of yaw direction. Though relatively horizontal at $x/D=3$, the centreline between the vortex cores is pointed diagonally in the direction of the deflection, and upwards for both yaw angles at $x/D=7$.
Figure 11(a) contains the evolution of circulation of vortex cores in the wake of the misaligned wind turbine. Circulation is estimated by spatially integrating vorticity over all positive ( $+\omega$) and negative ( $-\omega$) vorticity patches. Upwards deflecting tilt results in the highest values of circulation. For downwards deflecting tilt, the circulation is significantly smaller within the measured range of streamwise locations. At a position of $x/D=2$, the measured circulation for downwards deflecting tilt is only slightly larger than the circulation from wake rotation as measured for an aligned wind turbine. However, the circulation is found to decay faster downstream for downwards deflecting tilt.
(a) Evolution of circulation as calculated by integrating all positive ( $+\omega$) or negative ( $-\omega$) streamwise vorticity patches and (b) evolution of the maximum streamwise vorticity magnitude. Results from the 2-D point-vortex model are indicated by * in the legend.

The difference in circulation for positive and negative tilt is not expected to be caused by the same mechanism leading to differences in wake deflection for negative and positive yaw, e.g. closely related to vertical shear of mean streamwise velocity and rotor rotational direction (Schottler et al. Reference Schottler, Hölling, Peinke and Hölling2017). Here, a different mechanism for the difference in vortex circulation between positive and negative tilt is proposed. Similar to the increased lift coefficient of an airfoil operating in ground effect, due to local changes in pressure (Zerihan & Zhang Reference Zerihan and Zhang2000), the downdraft of a downwards deflecting turbine interacting with the ground is expected to increase pressure near the ground negatively affecting the overall thrust force of the turbine, and the resulting formation of the counter-rotating vortex pair. This blockage effect by the ground is indicated in figure 12. The opposite takes place for upwards deflecting tilt, increasing the pressure drop over the rotor, and thus explaining the difference in vortex circulation. Tobin, Hamed & Chamorro (Reference Tobin, Hamed and Chamorro2017) have indeed shown that changing the flow blockage locally between rotor and ground can affect turbine performance. Such a ground interaction could thus also adversely affect the power of a downwards deflecting turbine, which should be looked at in more detail in future studies. Nanos et al. (Reference Nanos, Letizia, Clemente, Wang, Rotea, Iungo and Bottasso2020) measured a lower power for downwards deflecting tilt, though this is expected to be also related to their tilt mechanism shifting the rotor slightly down. In the current study, the top-tip height of the blades is approximately 3 mm, or 0.04D lower for negative tilt due to forwards tilting and thus not expected to be the main reason for the difference in circulation. Unless a downwind rotor is used or the tower design is corrected, it is almost inevitable that the rotor will be slightly lowered by forwards tilting. It should also be recognized that tower interactions can change for positive and negative tilt (Santoni et al. Reference Santoni, Carrasquillo, Arenas-Navarro and Leonardi2017; Scott et al. Reference Scott, Bossuyt and Cal2020a). However, in this study the tower is tilted with the rotor, thereby keeping the tower-blade distance constant, such that a minimal impact on performance is expected. It is important to note that even despite a potential ground effect, arrays of downwards deflecting turbines have been found to show superior gains for the overall power output of a farm, thanks to a major reduction of wake losses (Annoni et al. Reference Annoni, Scholbrock, Churchfield and Fleming2017; Cossu Reference Cossu2020; Nanos et al. Reference Nanos, Letizia, Clemente, Wang, Rotea, Iungo and Bottasso2020), and the improvement of vertical entrainment of mean kinetic energy (Scott et al. Reference Scott, Bossuyt and Cal2020a). For these measurement results, the circulation of the vortex cores can be approximated reasonably well by a power-law decay, as indicated by the plotted fits of  $y=ax^b$. The fitted exponent was $b\approx -0.3$ for upwards deflecting $20^{\circ }$ tilt, $b\approx -0.45$ for no tilt and $b\approx -0.5$ for downwards deflecting $20^{\circ }$ tilt, thus confirming the slightly faster decay for negative tilt.
Schematic representation of differences in ground effect for different tilt directions, affecting the pressure field at the rotor, the formation of the counter-rotating vortex pair, and the resulting updraft or downdraft.

In figure 11(b) the maximum value of vorticity is plotted for each vortex core as a function of downstream location. The decay of maximum vorticity follows a similar evolution as the previously discussed decay of vortex circulation, confirming a higher value and slower decay for upwards deflecting tilt than for downwards deflecting tilt. The maximum value of streamwise vorticity for the hub vortex of an aligned wind turbine is lower than for the vortex cores of the negatively tilted wind turbine, though shows a slower decay. The fitted exponent for  $y=ax^b$ is $b\approx -0.6$ for positive $20^{\circ }$ tilt, $b\approx -0.63$ for no tilt and $b\approx -0.68$ for negative $20^{\circ }$ tilt.
3.5. Point-vortex-model analysis
A simple 2-D vortex model is now used to identify and illustrate the main mechanisms leading to different vortex interactions for upwards and downwards deflecting tilt. The recent point-vortex model by Zong & Porté-Agel (Reference Zong and Porté-Agel2019) is implemented, which was found to show good agreement with the measured vorticity distribution in the wake of a yawed miniature wind turbine. A brief overview of the implemented model is provided below (cf. Zong & Porté-Agel Reference Zong and Porté-Agel2019). The model describes the downstream evolution of a discrete set of streamwise vortices in the  $y$–
$y$– $z$ plane by marching through time, in a frame of reference moving with the mean convective velocity. The change in circulation induced by the turbine blades is modelled by the change in relative blade velocity with azimuth (i.e. the angle with the $z$-axis $\phi$), and the yaw or tilt angle. For the coordinate system and blade rotation in this study and with $\beta$, the tilt angle, the relative tip velocity $\boldsymbol {C}$ is modelled by
 \begin{equation} \boldsymbol{C} = \left( U(y) (1-a) + \omega R \sin(\beta) \cos(\phi) \right) {\boldsymbol{e}}_x -\omega R \cos(\phi) \cos(\beta) {\boldsymbol{e}}_y + \omega R \sin(\phi) {\boldsymbol{e}}_z, \end{equation}
with  $\omega$ the blade rotational speed and $R$ the tip radius. The circulation shed from the blade tips is modelled by a discrete set of vortices, by dividing the circumference of the rotor disk into $N$ arc segments, and normalizing the circulation of each vortex according to the local streamwise velocity, such that the net circulation of the tip-vortices is equal to $\varGamma _0$, which depends on the specific turbine design (Zong & Porté-Agel Reference Zong and Porté-Agel2019) and the misalignment angle. An opposite hub-vortex with circulation $-\varGamma _0$ is placed in the hub centre. The net circulation is therefore equal to zero, satisfying the condition that no net circulation is created in the absence of non-conservative forces and away from the wall (Saffman Reference Saffman1992). Shear in the velocity profile is included by modelling $U(y)$ according to the fitted log-law and the derived friction velocity and roughness length scale given in § 2.
The total circulation of streamwise vorticity shed from the blade tips can be defined from vortex cylinder theory, resulting in (Zong & Porté-Agel Reference Zong and Porté-Agel2019)
 \begin{equation} \varGamma_0 = k_{WT} {\rm \pi}U_H^2 C_T / \omega (1+a^\prime), \end{equation}
for an aligned turbine with  $k_{WT}$ a correction factor to account for the idealization, which needs to be defined from a near wake measurement. In this analysis, the same value $k_{WT}=0.45$ as found by Zong & Porté-Agel (Reference Zong and Porté-Agel2019) is used, as no near wake measurement is available to perform a calibration.
Turbulent diffusion is modelled by considering Lamb–Oseen vortices, such that vorticity from each vortex is described by
 \begin{equation} \omega_x (x,y,z) = \frac{\varGamma_p}{4 {\rm \pi}\eta^2(x) } \exp \left( - \frac{ (y-y_0)^2 + (z-z_0)^2}{ 4 \eta^2 (x)} \right), \end{equation}
with  $\varGamma _p$ the circulation of the point vortex, $y_0$ and $z_0$ the point location and $\eta (x)$ the viscous length scale of the vortex. Shapiro et al. (Reference Shapiro, Gayme and Meneveau2020) show that in the wake of a wind turbine, operating in a turbulent boundary layer, the viscous length scale $\eta (x)$ of the vortices can be expressed in terms of the wake expansion coefficient, and the downstream distance by $\eta ^2(x) = k^2(x-x_0)^2/\sqrt {24}$, with the wake expansions coefficient defined as $k=u_*/U_0$, and $x_0$ the virtual origin to account for the finite thickness of the initial vorticity shed from the blades. The induced tangential velocity of each Lamb–Oseen vortex,
 \begin{equation} u_t = \frac{\varGamma_p}{2 {\rm \pi}( (y-y_0)^2 + (z-z_0)^2)^{1/2}}\left[1 - \exp\left( -\frac{(y-y_0)^2 + (z-z_0)^2}{4 \eta^2 (x)} \right) \right], \end{equation}
is used to progress the location of the point vortices as the simulation is marched in time. The ground effect is modelled by mirroring the point vortices along the ground-plane  $y=0$ with an opposite sign of circulation.
The point vortex model is simulated based on the experimental conditions (e.g.  $U_H$, $CT$,
$CT$,  $\lambda$), a wake coefficient of $k=u_*/U_H=0.068$, using 36 point vortices along the rotor circumference and one in the rotor centre. The virtual origin is found from $x_0 = - 24^{1/4} \varDelta /k$ (Shapiro et al. Reference Shapiro, Gayme and Meneveau2020), with $\varDelta =0.004$ m based on the blade-tip chord length. Equation (3.3) is used to calculate the net circulation of the tip-vortices with $k_{WT} = 0.45$. Contours of streamwise vorticity resulting from the 2-D vortex model are shown in figure 13, showing good agreement with the main features observed in the measurements. Grey circles indicate the location of the simulated point vortices, which move due to the induced velocity field. Panels (a) and (b) show model results including shear in the velocity profile and mutual induction by the point vortices, and panel (c) shows results without mutual interaction of the vortex points, and considering a uniform inflow.
Contours of vorticity from the point-vortex model for  $+20^{\circ }$ and $-20^{\circ }$ tilt. Grey circles indicate vortex locations. The maximum and minimum vorticity are indicated by a white circle, and their trajectory over time by the connected black line. Mirror vortices for modelling the ground effect are not displayed. Panels (a,b) show model results including shear in the velocity profile and mutual induction by the point vortices. Panel (c) shows results without mutual interaction between vortex cores, and for a uniform inflow.

A counter-rotating vortex pair is shown to originate from positive tip-vortices on one side, and negative tip-vorticity merging with the hub-vortex on the other side. This merging with the hub-vortex explains why the location of the negative vortex centre starts inside the wake centre. Similar results have been documented by Zong & Porté-Agel (Reference Zong and Porté-Agel2019) for a yawed wind turbine. The model illustrates how the irregular shape of the vortex cores originates from positive vorticity shed at the blade tips, and the hub-vortex merging with a zone of negative streamwise vorticity at the blade tips due to misalignment. The model also shows how the points of maximum and minimum vorticity initially deflect with the induced velocity, and later on diverge away from each other as a result of the increasing vortex radius from turbulent mixing. For the results with fixed vortex locations (e.g. no mutual interaction), the maximum and minimum point of vorticity diverge on a straight line, due to cancellation of vorticity at the line of symmetry, which is discussed in more detail below. Though not shown in these model results, farther downstream, the maximum and minimum point of vorticity can move up, due to cancelation of vorticity with the mirrored image vortices. These effects, and differences between the model and the experiments, are discussed in more detail below.
The circulation of the counter-rotating vortex pair cores from the point-vortex model are compared with the experimental results in figure 11. The circulation is smaller than the measured circulation, which indicates that the correction factor  $k_{WT}$ in the model is too small for the used wind turbine model. The LES results of Shapiro et al. (Reference Shapiro, Gayme and Meneveau2020) show an evolution of circulation which remains more or less constant up to $x/D\approx 3$, before decaying. In this experiment, and according to the point-vortex model, circulation is found to decay from the earliest measurement location, $x/D=2$ for tilt. It is expected that mutual cancellation of vorticity results in an earlier onset of decay for a turbine, in comparison with an actuator disk, due to the smaller separation between hub-vortex and the vorticity shed from the blade tips.
Shapiro et al. (Reference Shapiro, Gayme and Meneveau2020) demonstrate that the decay of the counter rotating vortex pair for a yawed wind turbine is dominated by gradual cancellation of positive and negative vorticity at the line of symmetry, as the wake expands. This mechanism is illustrated by the point-vortex model, as circulation decays resulting from the increasing radius of the Lamb–Oseen vortices. Other than having an overall lower circulation which is expected to be caused by the non-symmetric ground effect, the circulation for downwards deflecting tilt also exhibits a slightly faster decay. The faster decay can be attributed to two effects. In the first instance, the closer distance to the ground results in mutual cancellation of vorticity caused by the mirrored image vortices. For negative tilt the point-vortex model results indeed in a slightly faster decay of the positive vortex-core circulation, in comparison with the hub-vortex core, which is located farther away from the ground. However, the faster decay in the point-vortex model does match the faster decay in the experiment. It can be seen from figure 9 that in the experiment, the wake and the vortex centres have a significant initial downwards displacement (e.g. a wake centre deflection of  $y/D\approx -0.25$ at $x/D=2$), already from the first measurement plane. This downwards displacement can strongly enforce cancellation by the ground effect (i.e. by the mirror-vortices). Mutual cancellation of vorticity also depends on background turbulence levels (Van Jaarsveld et al. Reference Van Jaarsveld, Holten, Elsenaar, Trieling and Van Heijst2011). Therefore, higher turbulence levels near the ground may be a second reason for faster decay of circulation in case of downwards deflecting tilt.
Profiles of maximum streamwise vorticity from the point-vortex model show a similar trend. The model results are smaller than measured due to an underestimate of  $k_{WT}$, similar to the observation for circulation. The profile for minimum negative vorticity is much higher in the model, due to the representation of the hub-vortex in a single point-vortex. In practice, the hub-vortex originates from the blade roots such that it is spread over a larger area, resulting in a lower maximum value.
It can be observed from figures 9 and 10 that the vortex centres follow the edge of the wake, as the wake expands and deflects. Figure 14(a) exhibits this downstream evolution of the vortex centre locations for yaw and tilt. The start location and downstream evolution of the vortex-core centres can depend on mutual interaction between the vortex cores, and on the interaction with other present flow dynamics, such as velocity shear and ground-effects. As a result, the trajectories follow non-symmetric paths. For all misalignment angles, the vortex-centres display a shift (from the first measured location,  $x/D=2$ for tilt and $x/D=3$ for yaw) corresponding to the effective wake deflection, and in agreement with the expected mutual interaction of a counter-rotating vortex pair (Leweke, Le Dizès & Williamson Reference Leweke, Le Dizès and Williamson2016). The vortex-core locations for negative tilt stagnate vertically, while showing a mostly horizontal spreading as the wake advects downwind.
(a) Downstream development of vortex centre locations for different yaw and tilt angles. Increasing downstream location (data at  $x/D=2,3,5,7$) is indicated by arrow. (b) Separation of vortex-core centres as a function of downstream location.

A horizontal divergence is also present for tip-vortices from aeroplanes interacting with the ground at landing or take-off (Zheng & Ash Reference Zheng and Ash1996; Leweke et al. Reference Leweke, Le Dizès and Williamson2016). The horizontal divergence of the vortex pair can be described through inviscid theory by modelling the ground plane by two image vortex cores with equal, but opposite strength. Induction by the image vortex can then result in a horizontal separation when the distance to the ground becomes small enough. Similarly, for a wind turbine with negative tilt, the interaction with image vortex cores can explain the vortex-core trajectories. Ground blockage by the vortex images cancels the vertical velocity at the ground, and limits the downwards deflection of the wake. The mutual interaction of the vortex cores with their image vortices can further induce horizontal spreading. However, a more important contributor to the apparent spreading of the vortex cores is mutual induction of vorticity, resulting from turbulent diffusion. This effect can be illustrated by following the point of maximum and minimum vorticity for two Lamb–Oseen vortices with opposite sign, and fixed location,  $(y=-S/2,z=0)$ and $(y=S/2,z=0)$, with $S$ the distance between the two vortex locations. The superimposed vorticity distribution for a cross-section at $z=0$ is then
 \begin{equation} \omega_x(x,y,z=0)= \frac{\varGamma_p}{4 {\rm \pi}\eta^2(x)} \left[ \exp{ \left( - \frac{ (y+S/2)^2 }{4 \eta^2 (x)} \right)} - \exp{ \left( - \frac{ (y-S/2)^2 }{4 \eta^2 (x)} \right)} \right]. \end{equation}
Figure 15(a) shows profiles of vorticity for increasing viscous length scale  $\eta (x)$. When the viscous length scale becomes large enough, the separation between the points of maximum and minimum vorticity increases due to mutual cancellation of vorticity. Figure 15(b) shows the increasing separation distance as a function of vortex viscous length scale. Once the viscous length scale is large enough ( $\eta (x) > S / (2\sqrt {2})$), the separation increases, with an apparent limit scaling of $L(x)/D = 2 \sqrt {2} \eta (x)/D$. Following the scaling by Shapiro et al. (Reference Shapiro, Gayme and Meneveau2020) for the viscous length scale of the vortex cores in the wake of a turbine operating in a turbulent boundary layer with velocity scales $U_\infty$ and $u_*$, the increasing separation of the vortex cores can be connected to the wake expansion coefficient (defined as $k=u_*/U_\infty$),
 \begin{equation} L(x)/D = 2 \sqrt{2} \eta (x)/D = 2 \sqrt{2} k (x-x_0) /24^{1/4}. \end{equation}
The horizontal spreading of the vortex cores is thus largely an effect from mutual cancellation, and is reproduced by the point-vortex model, also without considering the induced velocities, see figure 13(c).
(a) Dissipation of two opposite Lamb–Oseen vortices. Profiles of vorticity for increasing length scale  $\eta$ and $S=D$. (b) Increasing separation between points of maximum and minimum vorticity as a function of length scale $\eta$ .

For upwards deflecting tilt, the vortex-core locations start at a higher location, and move upwards as the wake develops downstream. The vortex cores for upwards deflecting tilt follow a more complex trajectory in comparison with negative tilt, as mutual interaction by the vortex cores is likely to be more significant as there is no obstruction by the ground.
For each misalignment case, one of the vortex cores originates closer to the wake centre, while the other takes place outside of the direct wake region. From the vorticity, contours in figures 9 and 10, and from the point-vortex model results, it is revealed that the vortex core originating close to the wake centre has merged with the hub-vortex. This interaction with the hub-vortex explains the location shift towards the centre of the wake and the non-circular initial shape of the resulting counter-rotating vortex pair, as shown for yaw by Zong & Porté-Agel (Reference Zong and Porté-Agel2019).
Figure 14(b) depicts the Euclidean distance between the identified vortex centres for each misalignment scenario. At a downstream distance of  $x/D = 3$, the separation length varies over a range of $L/D=0.7\text {--}0.95$, depending on the tilt or yaw angle. Negative yaw results in the smallest separation, while positive yaw or tilt result in the largest separation. Interestingly, independent of the different separation at $x/D=3$, the evolution of the trajectories develop approximately linearly and mostly parallel to each other. The slope is found to lie between $L/D \sim 0.1 x/D$ and $L/D \sim 0.15 x/D$. The linear increase of separation for vortex centres defined by the $\varGamma _1$ criteria (see figures 9 and 10) is in agreement with the result for the separation of vorticity-maxima resulting from mutual cancellation, though they are generally not in the same location. With a wake-expansion coefficient of $k=u_*/U_0 \approx 0.065$, and $L(x)/D = 2\sqrt {2} k (x-x_0) /24^{1/4} \approx 0.086(x-x_0)$, the vortex centres given by the $\varGamma _1$ criteria are found to separate approximately twice as fast as the scaling for maxima of vorticity.
3.6. Wake recovery
For the purpose of developing simplified analytical wake models, the downstream evolution of wake width and velocity deficit are characterized in this section. In a turbulent boundary layer, a wind turbine wake deviates quickly from the expected axisymmetric shape due to effects of wake rotation, shear, ground blockage and in particular wake curling when there is wake deflection. Therefore, the wake width expansion ratio is here quantified from the cross-section ratio  $\sqrt {A(x)/A(x=3D)}$. Wake recovery depends strongly on the incoming flow conditions. In flows with a significant amount of background turbulence, such as a turbulent boundary layer, wake width is found to increase linearly with streamwise coordinate in the far-wake region ( $x/D>3$), following from a constant ratio of cross-diffusion velocity scale to streamwise advection velocity (Lissaman Reference Lissaman1979; Jensen Reference Jensen1983; Katic, Højstrup & Jensen Reference Katic, Højstrup and Jensen1986; Stevens & Meneveau Reference Stevens and Meneveau2017).
Figure 16(a) shows the measured wake width expansion ratio for all misalignment angles, based on contours of  $\Delta U / \Delta U_{max} = 0.5$, with $\Delta U = U - U_{inflow}$ as shown in figures 4 and 5. Though this threshold is arbitrarily chosen as the half-wake-width, the sensitivity of the results to the threshold is very small. The measured wake width expansion based on the cross-sectional area is found to be very similar for all cases, following a linear increase ranging from ${\sim }0.125x/D$ to ${\sim }0.15x/D$. Wake recovery in the experiment is thus dominated by ambient turbulence, similar to what is expected for field conditions. Linear growth of wake width $D_W$ is commonly modelled as $D_W = D(1+ 2k x/D)$ (Stevens & Meneveau Reference Stevens and Meneveau2017; Shapiro et al. Reference Shapiro, Starke, Meneveau and Gayme2019), with $k$ the wake expansion coefficient. Based on the results in figure 16(a) the measured wake expansion coefficient in these experiments is thus in the range of $k\approx 0.06$ up to $k\approx 0.075$.
(a) Wake width expansion ratio quantified based on contours of constant velocity deficit  $\Delta U / \Delta U_{max} = 0.5$, with $\Delta U = U - U_{inflow}$. Dashed lines indicate a linear increase of ${\sim }0.125x/D$ and ${\sim }0.15x/D$. (b) Wake width expansion quantified based on contours of constant momentum. Dashed lines indicate a linear increase of ${\sim }0.07x/D$ and ${\sim }0.15x/D$. (c) Evolution of maximum velocity deficit in the wake.

The wake expansion ratio calculated from contours of constant streamwise momentum deficit, i.e.  $\int \rho U ( U_{inflow} -U) \,\textrm {d}A =\textrm {const}.$, are shown in figure 16(b). The momentum deficit integrated over an area equal to the rotor disk at $x/D=3$ is used as the value to track. The wake expansion shows a linear behaviour within the range of ${\sim }0.07x/D$ to ${\sim }0.15x/D$. In this case, the wake expansion for downwards deflecting tilt is found to be slightly higher than for the other cases, and especially compared with positive tilt, indicating a relative faster wake spreading for the downwards directed wake. Due to the downwards wake deflection, the faster wake expansion in figure 16(b) may be partly caused by inclusion of low momentum flow close to the ground when the wake contours are identified. However, the recovery rate of maximum velocity deficit, shown in figure 16(c), was also found to be faster for downwards deflecting tilt. These results thus indicate faster recovery of a negatively tilted wind turbine wake, in agreement with Scott et al. (Reference Scott, Bossuyt and Cal2020a). Positive and negative yaw deflection show a similar recovery rate as for an aligned wind turbine. Upwards deflecting tilt is found to result in a slower recovery. A slower recovery for upwards deflecting tilt could seem counter intuitive as the wake is deflected upwards into higher-momentum flow, and higher levels of shear generated turbulence could lead to improved entrainment of momentum. Some potential mechanisms for the faster decay of the downwards deflected wake are the higher level of turbulence near the ground and better mixing thanks to a squeezed non-circular shape of the wake. To gain more insight into the wake recovery, the measured terms of the RANS equation in the streamwise direction are compared in the next section.
3.7. Streamwise momentum recovery
In this section, the components of the RANS equation in the streamwise direction are estimated to study the main contributors to recovery of streamwise momentum in the wake (e.g. as described by  $\bar {u} {\partial \bar {u}}/{\partial x}$), and identify the impact of tilt misalignment on wake recovery. In the wake no body forces are introduced by the turbine, and the Reynolds number is considered high enough to neglect viscous terms. The RANS equation in the streamwise direction is then denoted by
 \begin{equation} \bar{u} \frac{\partial \bar{u}}{\partial x} + \bar{v} \frac{\partial \bar{u}}{\partial y} + \bar{w} \frac{\partial \bar{u}}{\partial z} ={-} \frac{1}{\rho} \frac{\partial \bar{p} }{ \partial x} - \frac{\partial \overline{u^\prime u^\prime}}{\partial x} - \frac{\partial \overline{u^\prime v^\prime}}{\partial y} - \frac{\partial \overline{u^\prime w^\prime}}{\partial z}, \end{equation}
with overlines indicating time-averaging and primes indicating temporal fluctuations compared with the temporal mean (Pope Reference Pope2001). Streamwise, vertical and transverse velocities are denoted by  $u$,
$u$,  $v$ and $w$, respectively, in the direction $x$,
$x$,  $y$ and $z$. The velocity terms of (3.8) are shown in figure 17. Similar evaluation has been done in Hamilton & Cal (Reference Hamilton and Cal2015), Kadum et al. (Reference Kadum, Cal, Quigley, Cortina and Calaf2020), Kadum, Knowles & Cal (Reference Kadum, Knowles and Cal2018), Ali et al. (Reference Ali, Hamilton, Calaf and Cal2019), Cortina, Calaf & Cal (Reference Cortina, Calaf and Cal2016) and Camp & Cal (Reference Camp and Cal2016). In-plane spatial gradients ( $\partial /\partial y$ and $\partial /\partial z$) are calculated with central differences after spatially smoothing by convolving a Gaussian kernel with a radius of $5\Delta L$, with $\Delta L$ the PIV grid-size resolution. Streamwise gradients are estimated using a second-order polynomial fit over data at locations $x/D = 2,3,5$. This method allows an improved estimation of the local streamwise gradient at $x/D=3$.
Measured terms of the RANS equation in the streamwise direction. For each tilt misalignment the terms are normalized by the maximum value of  $\bar {u}(\partial \bar {u} / \partial x)$, as denoted by $^*$.
$^*$.

When all estimated terms in (3.8) are summed, the residual term corresponds to the unmeasured pressure contribution, any measurement errors and possible effects from other missing terms such as the neglected viscous terms. This residual contribution is shown in figure 17. Residual values are generally smaller than  $0.2 MAX( \bar {u} {\partial \bar {u}} / {\partial x} )$ and expected to be mostly a result from the approximation of the streamwise derivative of $\bar {u} {\partial \bar {u}} / {\partial x}$. If the streamwise derivatives are calculated with a simple backwards central difference scheme over measurement planes at $x/D=2$ and $x/D=3$ the residual term increases slightly, but the main conclusions remain valid. Because wake momentum deficit depends on tilt misalignment, the estimated RANS terms are normalized by the maximum value of $\bar {u} {\partial \bar {u}}/{\partial x}$ for each tilt angle, as to allow for a relative comparison of the streamwise momentum budget, and verify which terms are the main contributors to wake recovery.
For all cases, the advection of streamwise momentum  $\bar {u} {\partial \bar {u}} / {\partial x}$ shows a positive region in the core of the wake, indicating wake recovery (i.e. $\partial \bar {u} / \partial x > 0$, with $\bar {u} > 0$), and a negative region directly outside of the wake, where the flow is slowed down as the wake expands and momentum is extracted as it is transferred to the wake region. For a negative tilt angle, the negative region is less pronounced directly above the wake, as the wake is deflected downward, and high-momentum flow from higher up replenishes the wake region. On the other hand, for positive tilt the negative region is more pronounced, as a result of the upwards wake deflection.
Vertical advection of streamwise momentum  $\bar {v} {\partial \bar {u}}/{\partial y}$ shows a clear difference between positive and negative tilt. For downwards deflecting tilt, a large negative region of $\bar {v} {\partial \bar {u}}/{\partial y}$ results from the downwards wake deflection, and contributes significantly to the wake recovery budget. For upwards deflecting tilt, a smaller positive region of $\bar {v} {\partial \bar {u}}/{\partial y}$ above hub height indicates the slow-down downstream as the wake is deflected upwards. A negative region of $\bar {v} {\partial \bar {u}}/{\partial y}$ below hub height corresponds to an upwards deflection of streamwise momentum contributing to wake recovery, yet this region is smaller than for downwards deflecting tilt.
The contribution of  $\bar {w} {\partial \bar {u}}/{\partial z}$ to wake recovery is small relative to the other terms, and the smallest for downwards deflecting tilt. The term ${\partial \overline {u^\prime u^\prime }}/{\partial x}$ shows a footprint of the wake shape, but is also relatively small compared with the other terms. Positive values indicate a downstream reduction of turbulence intensity, and a contribution to wake recovery. For upwards deflecting tilt, a more significant negative region is observed above the wake, resulting from the increase of turbulence levels at that height, as the wake is directed upwards. Higher turbulence levels for a downwind turbine can result in unwanted higher unsteady loading.
Gradients of streamwise-vertical ( $- {\partial \overline {u^\prime v^\prime }}/{\partial y}$) and streamwise-transverse ( $- {\partial \overline {u^\prime w^\prime }}/{\partial z}$) Reynolds shear stresses are main contributors to the streamwise momentum budget. For downwards deflecting tilt, the contribution of the Reynolds shear stresses to the overall budget is relatively smaller, thus indicating the bigger contribution of downwards transport of high-momentum flow to the overall budget. The gradient of streamwise-vertical Reynolds stresses have a smaller value but are spread out over a wider region, likely due to the elongated wake shape. Especially the contribution of streamwise-transverse Reynolds stresses is smaller for downwards deflecting tilt, as compared with the other cases. A vertical shift due to tilt-misalignment is clearly observed for ( $- {\partial \overline {u^\prime v^\prime }}/{\partial y}$). The shear stresses have the largest contribution for upwards deflecting tilt angles, as expected from the higher shear of mean velocity when the wake is deflected upwards into higher-momentum flow.
4. Conclusion
Cross-plane S-PIV measurements of a tilted and yawed wind turbine are documented detailing the respective wake deflections due to rotor misalignment. The results for a yawed wind turbine show excellent agreement with results in the literature. Compared with yaw, a positive or negatively tilted wind turbine shows a stronger non-symmetric wake behaviour. In particular, the experiments document increased wake-curling leading to horizontally elongated wakes for downwards deflecting tilt angles, i.e. a ‘crashing wake’. The wake of a positively tilted wind turbine is deflected upward, i.e. a ‘flying wake’ (Scott et al. Reference Scott, Bossuyt and Cal2020a), is not obstructed by the ground, and as such preserves its axisymmetric shape.
The potential AP in the wake, calculated from the measured velocity planes is the highest for downwards deflecting tilt, also for cases with partial wake overlap. Based on the wake measurements and analyses in this study, it is concluded that downwards deflecting tilt increases AP downwind in multiple ways and more effectively than the other studied misalignment scenarios (positive tilt or yaw). A downwards deflected wake will interact with the lower half of a downwind turbine, such that the relative impact on power will be minimized. On the other hand, the resulting downdraft of high-momentum flow results in maximum AP in the upper half of a downwind turbine, which is generally responsible for most of the power production.
The evolution of vorticity in the wake of a tilted wind turbine is analysed in more detail with the help of a 2-D point-vortex model. For downwards deflecting tilt, the counter-rotating vortices show a faster decay due to mutual cancellation of vorticity with the mirrored image vortices (i.e. ground effect). Furthermore, higher levels of turbulence near the ground are expected to aid the decay process. The distance between the vortex cores and the locations of maximum vorticity is found to increase linearly with downstream distance, and is shown to scale similarly to the measured wake-expansion rate, as a result of mutual cancellation of vorticity.
An analysis of the contributions to the streamwise RANS equation indicate further differences in the wake of a negatively and positively tilted wind turbine. For negative tilt, the downwards flux of mean momentum plays a relatively more important role in the overall momentum budget, replenishing the wake region with high momentum flow from higher up. For positive tilt, it was found that the Reynolds shear stresses play a more important role in the overall budget and contribution to wake recovery, resulting in higher turbulent fluctuations, while the contribution of updraft of low-momentum flow from near the ground to wake recovery is more limited.
Therefore, it is concluded that wake deflection from downwards deflecting tilt results in multiple beneficial effects for higher power availability downstream, which are valuable for large wind farms. Especially as downwind rotors are being considered in the future to make larger rotor diameters possible, static or dynamic tilt could provide significant improvements to overall power output, and deserves further investigation.
Acknowledgements
This work was supported by the Belgian American Educational Foundation.
Declaration of interests
The authors report no conflict of interest.


 Open access