


Over the past two decades, the prevalence of childhood stunting has decreased, particularly in low- and middle-income countries. However, stunting remains a significant public health problem in many low-income countries(Reference Stevens, Finucane, Paciorek, Black, Laxminarayan, Temmerman and Walker1) and is associated with several negative short- and long-term consequences. These include lower cognitive function(Reference Woldehanna, Behrman and Araya2,Reference Ekholuenetale, Barrow and Ekholuenetale3) , increased vulnerability to chronic diseases(Reference Grillo, Gigante and Horta4), reduced educational attainment(Reference Coetzee, du Plessis and van Staden5) and decreased economic productivity in adulthood(Reference Akseer, Tasic and Nnachebe Onah6). These consequences can exacerbate intergenerational cycles of poor health, hindering individual well-being and societal and economic development(Reference Cheng, Johnson and Goodman7).
Previous studies investigating the association of linear growth with cognitive function and school achievement often rely on data from one time point(Reference Upadhyay, Pathak and Raut8–Reference Kowalski, Georgiadis and Behrman10) or from the perspective of stunting(Reference Woldehanna, Behrman and Araya2,Reference Fink and Rockers9,Reference Sunny, DeStavola and Dube11,Reference Crookston, Schott and Cueto12) . While these studies show that height-for-age z-scores (HAZ) at specific points in time and stunting are associated with cognitive function and school achievement(Reference Fink and Rockers9–Reference Crookston, Schott and Cueto12), they do not capture the relationship of distinct growth patterns longitudinally. This is important because children may exhibit different growth patterns that are not fully captured when examining growth at specific time points. In addition, children may experience growth faltering if their height is below the expected average for their age, even though their linear growth has not yet reached the level to be classified as stunted, i.e. HAZ < –2(Reference Perumal, Bassani and Roth13,Reference Victora, De Onis and Hallal14) .
Some children who had restricted growth might experience subsequent catch-up growth, a period of accelerated growth after the cause of growth faltering is resolved(Reference Boersma and Wit15). Understanding the diverse childhood growth patterns is essential for understanding growth progression and identifying hidden growth patterns within the population(Reference Lennon, Kelly and Sperrin16,Reference Rosato and Baer17) , which may have distinct associations with health and development. Previously, in the cohort used in this study, we reported that early childhood is a period where distinct body composition(Reference Andersen, Wibaek and Kaestel18) and body mass index growth trajectories are observed(Reference Wibaek, Vistisen and Girma19). These distinct trajectories are associated with health outcomes such as cardiometabolic indicators(Reference Wibaek, Vistisen and Girma19,Reference Megersa, Andersen and Abera20) . A study in Guatemala demonstrated that childhood features diverse linear growth trajectories, which were associated with adult cognitive and socioemotional functioning(Reference Ramírez-Luzuriaga, Hoddinott and Martorell21). We have also reported the association between early childhood linear growth velocity and school achievement(Reference Ali, Zinab and Megersa22). However, evidence on early childhood linear growth trajectories using longitudinal data and their association with cognitive function and school achievement is scarce, particularly in low-income countries where linear growth faltering is most prevalent(23,Reference Kinyoki, Osgood-Zimmerman and Pickering24) . In this study, our first aim was to identify distinct linear growth trajectories during the early childhood period (0–5 years) using latent class trajectory (LCT) modelling. Secondly, we aimed to examine associations of the identified linear growth trajectories with cognitive function and school achievement at 10 years of age.
Methods
Study setting and participants
The Infant Anthropometry and Body Composition birth cohort examined 644 newborns and their mothers in Jimma Town, Ethiopia, between December 2008 and October 2012. This birth cohort followed the children for a decade, from birth through childhood prospectively, with a total of 14 visits: birth, 1·5, 2·5, 3·5, 4·5, 6 months, and 1, 1·5, 2, 3, 4, 5, 6 and 10 years of child’s age. Newborns born pre-term, with congenital anomalies, weighing below 1500 grams and from families residing outside Jimma town were excluded. Out of 644 children initially examined at birth, 73 were excluded based on the criteria mentioned earlier. Consequently, 571 children were enrolled and invited for follow-up visits. At enrolment, assessment was performed within 48 h of delivery. Further details about setting and participants can be found in previous publications(Reference Andersen, Girma and Wells25,Reference Andersen, Girma and Wells26) . At the most recent follow-up, the children’s age ranged from 7 to 12 years, henceforward referred to as the 10-year follow-up. Mothers/caregivers and their children were traced using their last registered phone number or by a home-to-home visit by the research team using their address or landmark.
Main exposure
Anthropometry from 0–5 years
For children younger than two years of age, length was measured using SECA 416 Infantometer (Seca, Hamburg, Germany) in recumbent position. For children ≥ 2 years, a SECA 213 (Seca, Hamburg, Germany) was used to measure height in standing position. Each measurement was taken twice by the research nurses to the nearest 0·1 centimetre. The average of the two measurements at each time point was used in analyses.
Covariables
Background data on newborn’s sex, birth order and gestational age (determined using the Ballard score(Reference Ballard, Khoury and Wedig27)) were collected by trained research nurses using a structured and pre-tested questionnaire. Maternal data, including age and educational level (categorised according to the Ethiopian education system as none, primary (1–8 years), secondary (9–12 years) and higher (college and universities)), were also collected. Family socioeconomic data such as source of drinking water, type of latrine and asset ownership were collected at enrolment.
Infant head circumference was measured using a non-stretchable tape. This measurement was taken twice to the nearest 0·1 cm. Fat mass and fat-free mass at birth were measured using an infant-sized air-displacement plethysmograph: PEA POD (COSMED, Rome, Italy) as described elsewhere(Reference Wibaek, Vistisen and Girma28).
Outcomes
Cognitive function
Cognitive function was measured using Peabody Picture Vocabulary Test Fourth Edition (PPVT IV), translated for use in Amharic and Affan Oromo, languages spoken in the study area. This tool has been used in previous studies to assess cognitive function among Ethiopian children(Reference Fink and Rockers9,Reference Leon and Singh29) . PPVT is a tool designed to measure receptive vocabulary acquisition from age 2·5 to 90+ years of age(Reference McKinlay, Goldstein and Naglieri30). Receptive vocabulary measures an important facet of general intelligence and is one of the best predictors of school achievement(Reference McKinlay, Goldstein and Naglieri30,Reference Eigsti31) . The test is individually administered and norm-referenced, that is, it is a standardised test designed to compare scores among the individuals. Each PPVT IV test contains training items to familiarise examinees with the test and 228 test items, nineteen sets of twelve items arranged in order of increasing difficulty. The test starts with a set of items appropriate for the child’s age. The test uses a basal and ceiling set rule to determine the start and end of the examination for each child. The basal set refers to a test set where the examinee scored one or zero errors. Once the basal set is identified, the test continues until it reaches the ceiling point. This ceiling is reached when an examinee makes eight or more errors out of twelve total items.
Ninety-seven children required retesting at home due to examination errors. However, we adjusted for place of test (home v. facility) in all multiple linear regression models assessing the association between the trajectories and cognitive function, to account for potential systematic differences.
Research nurses were trained on the PPVT administration, and the test was conducted in private room to ensure suitable environment for testing.
School achievement
School achievement in this study was assessed using academic subject scores and being in the appropriate, or expected, grade in school for one’s age (which we refer to as grade-for-age). Subject scores, school name and grade level were obtained directly from official school records. Although Ethiopian schools do not adhere to a common curriculum(Reference Begna32), all schools offer math, English, and science (MES). Therefore, we selected these three subjects for further analysis and we also took into account the child’s school in the analyses. A principal component analysis was performed to explore potential groupings among these subjects. However, the loading values for all three subjects (English: 0·566, science: 0·582 and math: 0·584) were close, suggesting that the three subjects are influenced by the same factors (online Supplementary Fig. 1). Thus, an average value of the MES combined score was used in subsequent analyses.
Grade-for-age was computed by subtracting the current grade from the expected grade based on Ethiopia’s official age of entry into primary grade 1, which is 7 years(33). Subsequently, these grade-for-age values were divided into two categories according to the UNESCO classification(34): children who were two or more years behind the expected grade for their age were classified as having a low grade-for-age, while those who were one year behind or at grade level were considered to have an appropriate grade-for-age.
Statistical analysis
Data were entered in Epi Data version 4.4.2.0 and exported to Stata version 17 (StataCorp LLC College Station, Texas, USA) for further analysis. All continuous variables were normally distributed; therefore, we present the mean (standard deviation (sd)). For categorical data, we computed percentages. A wealth index was computed using principal component analysis(35) from self-reported ownership of material assets: car, motorcycle, bicycle, electric stove, refrigerator, mobile phone, land, telephone, television, radio, access to electricity, source of drinking water and type of latrine (data not shown).
HAZ was computed using Zscore06 Stata package for children younger than 60 months(Reference Leroy36). For children 60 months of age and older, we used the WHO Reference 2007 Stata macro package(37).
Identifying HAZ trajectories
LCT modelling was used to identify HAZ trajectories among children having at least three length/height measurements, at birth, between 0 and 6 months, and between 1 and 5 years of age using R statistical software (version 4.3.3, R Foundation for Statistical Computing, Vienna, Austria). LCT model estimates include fixed effects: average HAZ at birth and HAZ trajectory from 0 to 5 years for each identified class. Models were run with thirty repetitions and iterations of 100. Both class-specific and model-specific parameters were taken into account to determine the optimal number of trajectories. We ensured that each class included a minimum of 5 % of the children for clinical significance and for sufficient sample size per class for subsequent analysis(Reference Lennon, Kelly and Sperrin16). Detailed information on how we identify HAZ trajectories is provided in online Supplementary Text 1.
Following the identification of the distinct HAZ trajectories, we compared maternal and child characteristics across the trajectories. For continuous variables, we used an ANOVA test to assess overall differences between groups. For categorical variables, we assessed differences between trajectories using Chi-square tests and Fisher’s exact test for variables with cell counts < 5.
Association of HAZ trajectory and outcomes
Three separate linear regression models were fitted to examine associations between distinct HAZ trajectories with cognitive function as well as MES combined score. Similarly, three separate logistic regression models were used to assess the associations between distinct HAZ trajectories and grade-for-age. As a supplementary analysis, we also assessed the association between HAZ trajectories with each subject separately (MES). Model 1 was adjusted for age at the 10-year follow-up and sex. Model 2 was additionally adjusted for head circumference, gestational age and birth order. Model 3 was further adjusted for maternal and household characteristics: maternal age, education and household wealth index. All PPVT models were adjusted for the location where the cognitive test was administered. Current age was not included in grade-for-age models, as grade-for-age was calculated using the current age of the child. Covariates were selected following a review of the literature(Reference Fink and Rockers9–Reference Crookston, Schott and Cueto12).
Students within schools are more homogeneous due to shared learning environments, potentially violating the independence assumption in regression(Reference Menard38), leading to biased coefficient estimates, inaccurate standard errors and ultimately, misleading statistical inferences. Therefore, for models assessing associations with school achievement, each school was assigned a unique identifier (school id) for clustering. As a result, all regression models assessing the association of HAZ trajectories and MES score used cluster-robust standard errors,(Reference Cameron and Miller39–Reference Jayatillake, Sooriyarachchi and Senarathna41) taking account of clustering within school id.
Results
The Infant Anthropometry and Body Composition birth cohort initially examined 644 newborns. After excluding sixty-three who lived outside Jimma and ten preterm, 571 children were enrolled and invited for subsequent visits. A total of 454 children were included in the LCT modelling, meeting the criteria of having at least three length/height measurements: at birth, between 0 and 6 months, and between 1 and 5 years. Of these, 320 children were included in the 10-year follow-up. At the 10-year follow-up, 355 children (62 %) were recruited. Among them, 318 completed the PPVT test, 276 had MES combined scores and 343 had current grade data (Fig. 1).
Flow diagram of the study participants. LCT (latent class trajectory), PPVT (Peabody Picture Vocabulary Test), MES (mathematics, English and science) combined score.

A comparison revealed no differences between children included in the 10-year analysis and those who were not with regard to sex, birth characteristics (length, gestational age, weight, fat mass and fat-free mass), wealth index or maternal characteristics at birth (height and education). However, children included in the 10-year analysis were more likely to be firstborn and have younger mothers compared to those who were not (online Supplementary Table 1).
HAZ trajectories from 0–5 years
We identified four distinct trajectories of HAZ (Fig. 2): (1) decreasing (n 145, 31·9 %) had HAZ above zero at birth which declined rapidly between 3 and 24 months to below the WHO cut-off point for stunting (HAZ −2 sd) and then remained consistently low; (2) increasing-decreasing (n 196, 43·2 %) started low at birth, followed by an increase in HAZ up to 3 months then a decrease to 18 months and stable afterwards; (3) stable low (n 74, 16·3 %) had low HAZ at birth followed by a further decrease and then consistently low after 3 months; (4) rising (n 39, 8·6 %) had low HAZ at birth which increased rapidly within the first 6 months, a decrease from 6 to 36 months and then remained above but near the median of the WHO child growth standard(42). The average posterior probability of assignment of each trajectory was above 80 % (online Supplementary Table 2).
Height-for-age z-scores (HAZ) trajectories from 0 to 5 years among children in the Infant Anthropometry and Body Composition birth cohort study. These four distinct trajectories were identified using latent class trajectory modelling. Solid lines represent the average HAZ as a function of age for each trajectory, and the colour-shaded areas with dashed lines illustrate the estimated 95 % confidence intervals. The black horizontal zero-line indicates the median value of the WHO child growth standards.

Background characteristics across HAZ trajectories
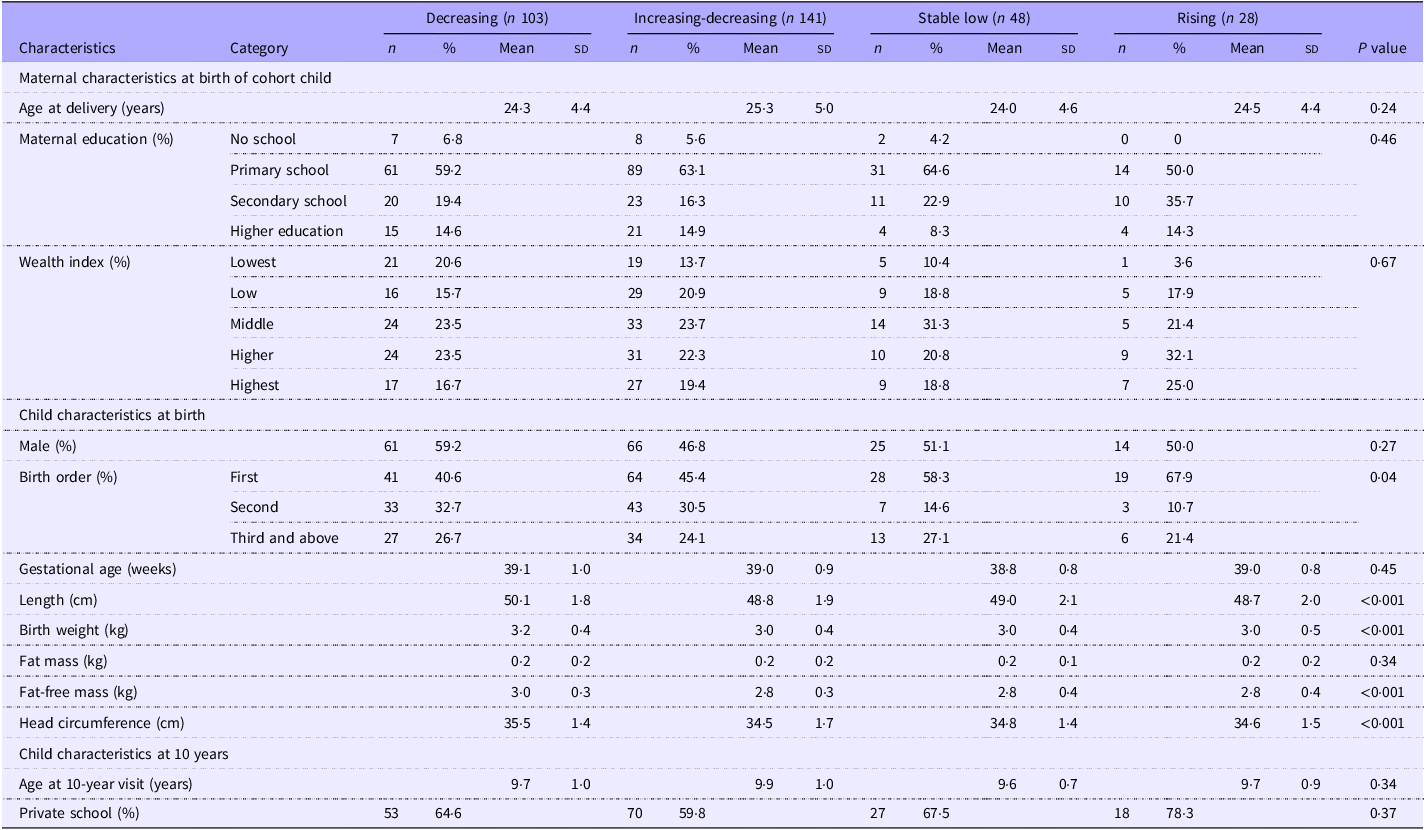
Background characteristics of mothers and children across the four trajectory classes are presented in Table 1. Birth order showed statistically significant difference across the four trajectories (P = 0·04): children in the rising trajectory were more likely to be firstborns. The trajectories also showed differences among anthropometric measurements and fat-free mass at birth. There were no statistically significant differences (P > 0·05) observed with regard to maternal characteristics at birth (maternal age, educational level and wealth index) or child sex, gestational age at birth and fat mass at birth across the four trajectories.
Maternal and child characteristics across the four HAZ trajectories among children followed up at 10 years (n 320) *

HAZ categories were derived from latent class modelling.
* Values are expressed as mean (sd) for continuous variables and as n (%) for categorical variables.
HAZ, height-for-age.
Association between HAZ trajectory and cognitive function and school achievement
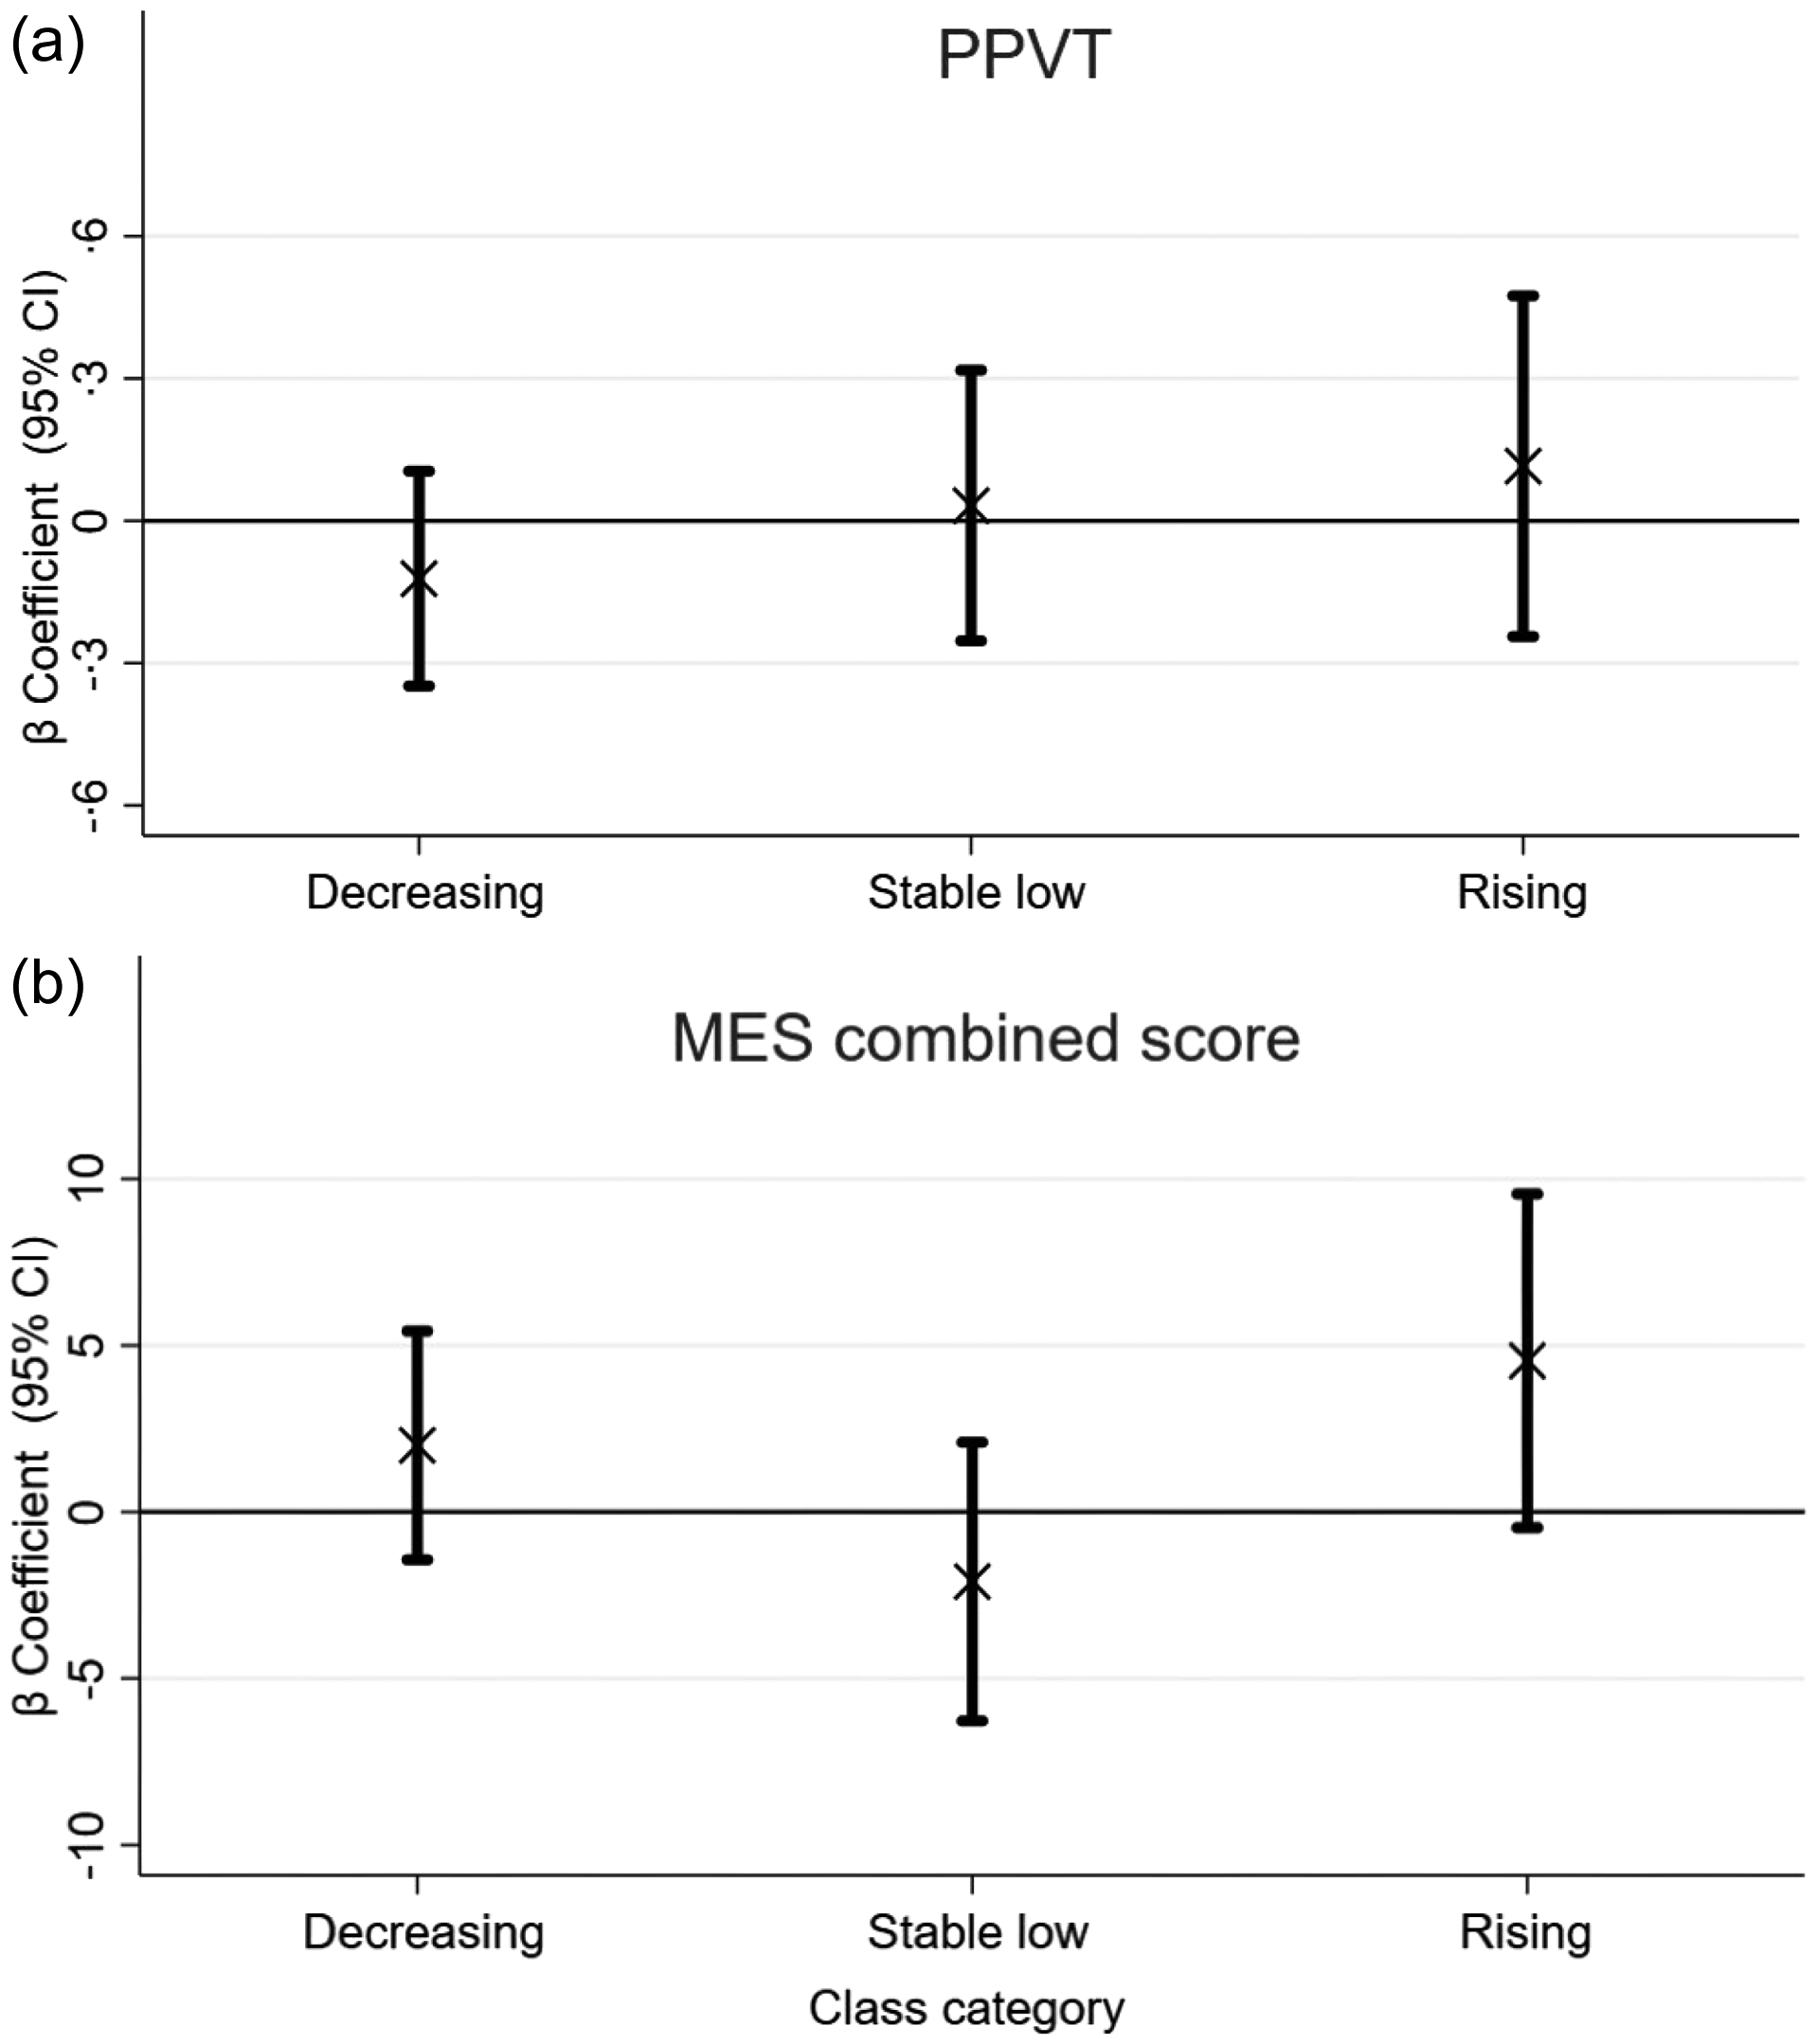
Due to minimal variation in estimations across the models (online Supplementary Table 2), we present the final models in Fig. 3. Although HAZ trajectories were not associated with PPVT scores overall, children in the decreasing trajectory had lower scores than those in the reference group (the increasing-decreasing trajectory; β = −0.12, 95 % CI: −0.35, 0.11, P = 0.29). Those in the stable low group had very similar scores to the reference group (β = 0·03, 95 % CI: −0·25, 0·32, P = 0·83). Children in the rising trajectory had 0·12 sd (4·8-point scores) (95 % CI: −0·24, 0·47, P = 0·53) higher PPVT than the reference group. Children in the rising trajectory class had 4·54 (95 % CI: −0·45, 9·55, P = 0·075) points higher MES combined scores compared to children in the reference group, the increasing-decreasing trajectory. Similarly, children in the rising trajectory had 2·4 times higher odds of being in the appropriate grade-for-age (OR = 2·40, 95 % CI: 1·12, 5·15, P = 0·025) compared to the reference group. The association between stable low and decreasing trajectory with grade-for-age had OR close to 1 compared with children in the reference group.
Association of height-for-age z-score trajectories from 0 to 5 years with (a) PPVT and (b) MES combined score at 10 years. β coefficients (95 % CIs) displayed in the figure were derived from the final adjusted model. The final model for PPVT score included HAZ trajectories, PPVT score, sex, current age, place of test, head circumference at birth, birth order, gestational age, maternal education, maternal age at child birth and wealth index. The final model for MES combined score included HAZ trajectories, MES combined score, sex, current age, head circumference at birth, birth order, gestational age, maternal education, maternal age at child birth, wealth index and child’s school type. Reference group = increasing-decreasing trajectory.

In the separate subject analysis, children in the rising trajectory had 6·38 (95 % CI 1·85, 10·91, P = 0·007) higher math score and 5·14 (95 % CI: 0·14, 10·13, P = 0·04) higher score in science. Children in the decreasing trajectory had 3·12 (95 % CI: −0·37, 6·62, P = 0·08) higher math score compared to the children in the reference group (online Supplementary Table 4).
Discussion
In this birth cohort, we identified four trajectories of HAZ from 0 to 5 years and assessed associations of these trajectories with cognitive function and school achievement (assessed using MES combined scores and grade-for-age) at 10 years. The HAZ trajectories were: decreasing, increasing-and-decreasing, stable low and rising. Children in the decreasing trajectory showed a negative association with cognitive function, those in the stable low trajectory showed close to zero association, and children in the rising trajectory exhibited a positive association with cognitive function compared with those in the increasing-decreasing trajectory. Similarly, children in the rising trajectory class showed higher MES combined scores and higher odds of being in the appropriate grade-for-age. In the analysis of the individual subjects, the association observed between the rising trajectory and the combined MES score stemmed from math and science scores.
Across all four trajectories, most changes in HAZ occurred during the first six months after birth and continued until the age of two. After reaching two years of age, the HAZ trajectories were relatively stable up to the age of 5 years, indicating that most dynamic changes in linear growth occur during the first 2 years of life. This emphasises the importance of the first two years for achieving optimal growth, development and overall health(Reference Nguyen, Tran and Khuong43,Reference Cusick and Georgieff44)
Children in the three of the four trajectories, accounting for 92 % of the children, exhibited different patterns of declining HAZ, resulting in an average HAZ below the WHO child growth standards(42). The observed rapid decline in HAZ trajectories, particularly after 6 months of age, might be explained by the critical role of complementary feeding in sustaining optimal growth thereafter(Reference Dewey, Caballero, Allen and Prentice45,Reference Saha, Frongillo and Alam46) In addition, during this period, as children begin to explore their environment(47), their exposure to infectious agents increases, which might also affect their growth. A study conducted in Guatemala demonstrated that all identified linear growth trajectories exhibited a declining pattern, particularly with a sharper decrease observed up to 24 months of age(Reference Ramírez-Luzuriaga, Hoddinott and Martorell21). While distinct trajectories were not specified, other studies in low-and middle-income countries also reported a decline in mean HAZ during early childhood, with a notable drop observed from birth up to 24 months(Reference Faye, Fonn and Levin48–Reference Hanieh, Braat and Tran50). Additionally, one of these studies(Reference Roth, Krishna and Leung49) reported that this decline in mean HAZ was accompanied by a narrowing of the HAZ distributions, implying that children initially with higher HAZ were also likely experiencing decrease in linear growth during this developmental stage.
Children in the rising trajectory had a higher cognitive function, those in the decreasing trajectory had lower cognitive function and those in the stable low trajectory had very similar scores to the reference group, the increasing-decreasing trajectory. Even though distinct trajectories were not identified in previous literature, higher linear growth during early childhood was found to have a positive association with cognitive function(Reference Crookston, Schott and Cueto12,Reference Nguyen, Tran and Khuong43,Reference Georgiadis, Benny and Crookston51) . The rising and the reference – increasing-decreasing – trajectory exhibited a similar pattern, especially up to the 3-month mark, which could have masked any potential significant difference.
Children in the rising trajectory had a 4·54 point higher MES combined scores and 2·4 times higher odds of being in the appropriate grade-for-age compared to those in the increasing-decreasing trajectory. This might be due to factors such as lower school absenteeism, which is more prevalent among children experiencing linear growth faltering(Reference Rodríguez-Escobar, Vargas-Cruz and Ibáñez-Pinilla52). These children might be more susceptible to missing school due to illness(Reference Stephensen53) or social-emotional challenges(Reference Hickson, de Cuba and Weiss54–Reference Belachew, Hadley and Lindstrom56). This explanation could extend to the social advantages that favour children with higher linear growth. Children experiencing optimal growth may come from environments offering better access to resources and educational support, thereby supporting their school achievement(Reference Munir, Faiza and Jamal57). Additionally, children with better linear growth during early childhood may receive differential treatment from parents, teachers and others(Reference Fentiman, Hall and Bundy58), potentially leading to earlier school enrolment compared to children with linear growth faltering. The association between the rising trajectory and MES score was driven by math and science. This might be due to the fact that math and science share certain cognitive abilities like analytical thinking and problem-solving abilities, which differ from those needed for learning English or language studies in general. Brain regions responsible for analytical thinking and problem-solving differ from those involved in language learning, as each part of brain tends to specialise in specific cognitive ability(Reference Nilsson and Karwowski59).
Childhood is a critical period for brain development, laying the foundation for cognitive abilities in adulthood(Reference Stiles and Jernigan60). Furthermore cognitive function and school achievement during childhood are also vital, not just for future academic success but also for personal development and the overall socio-economic progress of a nation(Reference Licardo, Mezak and Evin Gencel61). During this sensitive period, early childhood feeding practices, illness and environmental stimuli play fundamental roles in supporting optimal brain development and physical growth.
Strength and limitation
This research contributes to the limited body of literature identifying early childhood linear growth trajectories and their association with cognitive function and school achievement. A key strength of this study lies in its longitudinal design, following children from birth to 10 years of age. Secondly, we employed LCT modelling, a robust data-driven statistical method that categorises children into distinct trajectories. The posterior probability of each class was > 80, indicating good assignment.
However, the study also had the following limitations. It is important to note that these trajectories might not be generalised to other populations. Future research should investigate whether these distinct growth trajectories are commonly observed across diverse populations of the same age. The second limitation is the loss to follow-up at the 10-year follow-up. While those lost to follow-up were similar to those included in the 10 years in terms of most variables, children included in the analysis were more likely to be firstborns and have younger mothers. Third, ninety-seven children required retesting at home due to examination errors. However, we adjusted for the testing site in all multiple linear regression models assessing the association between trajectories and cognitive function.
Conclusion
This study identified four distinct trajectories of HAZ among children from 0 to 5 years of age. Most of the changes in HAZ growth occur between birth and 6 months, continuing to 2 years of age. After 6 months, most children’s HAZ on average fell below the median of WHO child growth standards. Children who grow fast during early infancy and stay above the median of WHO child growth standards had better cognitive function and school outcomes. These findings underscore the necessity for targeted interventions during the crucial transition to complementary feeding and continued promotion and education of exclusive breastfeeding for the first 6 months of a child. Furthermore, monitoring childhood growth is crucial for tracking growth patterns during this period. Additionally, we suggest conducting further research to investigate the growth patterns of children within different demographic contexts. We also recommend assessing the association of different cognitive function domains and academic achievement in future studies.
Supplementary material
For supplementary material/s referred to in this article, please visit https://doi.org/10.1017/S0007114525105990
Acknowledgements
We would like to acknowledge the research staff for their commitment. Our sincere gratitude also extends to the study participants for their time and invaluable contributions. Special thanks are extended to Gregers S Andersen for his instrumental role in cohort establishment and to Melkamu Berhane for leading the most recent follow-up.
The study was funded by GSK Africa Non-Communicable Disease Open Lab (Project Number: 8658). The funders had no role in the study design, data collection, analysis, decision to publish or preparation of the manuscript.
The authors’ responsibilities were as follows H. F., J. C. K. W., S. F., T. G., R. W., D. Y., M. F. O., M. A. and R. A. Conceptualise the study; R. A., B. Z. and B. S. M. supervised the data collection; H. F., J. C. K. W., S. F., R. W., M. F. O., M. A. and R. A. participated in methodology; R. A. analysed the data and interpreted the findings. R. A. wrote the first draft. B. Z., B. S. M., D. Y., T. G., S. F., H. F., D. N., J. C. K. W., A. A. M., M. F. O., R. W. and MA commented on the manuscript, contributed to manuscript revisions, read the final manuscript and approved it for submission.
There are no conflicts of interest.
Ethical clearance was obtained from Jimma University Ethical Review Board of the College of Public Health and Medical Sciences (reference IHRPHD/333/18) and the London School of Hygiene and Tropical Medicine (reference 15076). Written informed consent was obtained from parents/care givers of all participating children after a thorough explanation of the study protocol.


 Open access