


Introduction
There is consensus that health outcomes are shaped to a considerable extent by social determinants or non-medical factors (Marmot Reference Marmot2005). The World Health Organization (WHO) describes these social determinants as
the conditions in which people are born, grow, work, live, and age, and the wider set of forces and systems shaping the conditions of daily life. These forces and systems include economic policies and systems, development agendas, social norms, social policies and political systems (WHO 2023).
The crucial factors underpinning almost all social determinants of health are disposable income and poverty. Health inequality is strongly related to income inequality – the lower an individual’s socio-economic position, the greater the likelihood of poor health access and outcomes (AIHW 2024a; Marmot Reference Marmot2005).
The health system and government benefits certainly dissipate the social determinants of health in Australia. However, a key argument of this article is that, similar to other OECD countries, class, racial, and spatial inequalities are replicated in the health system. Thus, although Australia has one of the world’s most sophisticated and extensive public health systems, it is characterised by substantial inequalities in life expectancy, health access, utilisation, and outcomes (Adair and Lopez Reference Adair and Lopez2020; AIHW 2024a; Blumenthal et al Reference Blumenthal, Gumas, Shah, Gunja and Williams2024; Flavel et al Reference Flavel, McKee, Tefay, Musolino, Freeman, van Eyk and Baum2022). While low-income individuals are more likely to be bulk billed when they visit their GP, that is, the full cost of the consultation will be borne by the government, they are more likely to have chronic health conditions and lower life expectancy (AIHW 2024a). Moreover, they are more prone to defer seeing specialist health professionals because of costs associated with not having private health insurance (ABS, 2023a). These inequalities and impacts are most evident in the case of Indigenous Australians and for people living in regional and remote locations (AIHW 2024b; Markwick et al Reference Markwick, Ansari, Sullivan, Parsons and McNeil2014; Pulok et al Reference Pulok, van Gool and Hall2020a). The data indicate that the legacy of colonialism and dispossession, on the one hand, and effects of contemporary racism and discrimination on the health of Indigenous Australians on the other hand, continue to be extreme (Kairuz et al Reference Kairuz, Casanelia, Bennett-Brook, Coombs and Yadav2021; Mitchell Reference Mitchell, Carson, Dunbar, Chenhall and Baillie2007).
The article, drawing on existing research and government reports, endeavours to give a wide-ranging account of the various features of health inequality in Australia. Thus, besides addressing core features of health inequality and different groupings’ access to, and use of, general practitioners (GPs) and specialists, the article utilises a sociological lens to examine a range of health inequalities. I first outline the organisation of healthcare in Australia. GP practice and bulk billing are then reviewed, followed by an examination of inequality with respect to capacity to consult a medical specialist. Next, inequality in life expectancy is discussed. I then examine inequality in mental health and care, followed by a focus on inequality and dental care. The gender health gap and spatial inequality in health care are then considered. Health outcomes and socio-economic indicators are then appraised. The chapter concludes with a discussion of inequality with respect to key contributors to poor health – smoking, alcohol, and diet.
The organisation of healthcare in Australia
Australia has a hybrid system of healthcare:
The government provides public insurance for basic coverage, and individuals can buy private insurance for healthcare coverage in addition to the public insurance they already have …[and] gain access to both private and public hospitals’ (Dixit and Sambasivan Reference Dixit and Sambasivan2018, 3).
The sizeable universal public health sector provides free or low-cost care for most medical procedures. A major gap is dental care which is barely covered – private dentists are not covered by Medicare, but individuals can put their name on a ‘public dental waiting list’. Specialist care, discussed below, although partially covered by Medicare, can be extremely costly for the patient. Alternative medical interventions such as physiotherapy and acupuncture have limited coverage. Medicare has three key components – public hospitals, general practitioners (GPs) and specialists outside of hospitals, and the Pharmaceutical Benefit Scheme (PBS).
There were 697 public hospitals in Australia in 2021–2022, and 2.5 beds per 1000 people in the public system (including psychiatric) (AIHW 2025a; Productivity Commission 2024). In comparison, the United Kingdom in 2022 had 2.44 beds per 1000 inhabitants, New Zealand, 2.57, and Chile, 1.93 (OECD 2024). The public hospitals are supplemented by the private system; there were 657 private hospitals in 2016–17 (latest figures available) (AIHW 2025a). Anybody covered by Medicare can be treated at a public hospital for no charge.
Medicare cardholders can consult a doctor or medical specialist, and part or all of their consultation fee will be covered. If the whole cost is covered, this is referred to as bulk billing. A range of medical procedures are fully or partially covered by Medicare; pathology tests, screening programmes, scans, surgery, and basic eye tests are all covered by Medicare. There are some important exceptions – for example, some MRIs are not covered at all or are only partially covered.
The PBS makes most medicines accessible. It began as a limited government scheme in 1948, providing free medication to pensioners and 139 ‘life-saving and disease preventing’ medication free to the rest of the population (Australian Government 2024). Under the PBS, a patient will pay only a proportion of the cost of the prescribed medication if the medication in question is covered by the PBS. The remaining cost is covered by the government. In June 2022, there were 925 different medicines in 5178 brands listed on the PBS (PBS 2024). The maximum cost for most PBS medications in 2024 was $31.60. A pensioner who has a ‘Commonwealth Seniors Health card’ will pay as little as $7.70 for PBS medicines. Despite the generous government subsidy, in areas of most socio-economic disadvantage, 11% of people delayed purchasing their prescribed medication or went without (ABS 2024).
A more recent addition to Australia’s health system is the National Disability Insurance Scheme (NDIS), which began in mid-2013 and has become the third biggest expenditure in the federal government budget. The NDIS (it is not part of Medicare) provides support for around 740,000 people with disability and although there are limitations, it has transformed the lives of tens of thousands of Australians (see Brown et al Reference Brown, D’Cruz, Oliver, Winkler and Douglas2025; Hamilton et al Reference Hamilton, Hancock and Scanlon2024).Footnote 1 It does appear that people who are socio-economically disadvantaged do have greater difficulty accessing the scheme (Cortese et al Reference Cortese, Truscott, Nikidehaghani and Chapple2021).
The public-private divide
A fundamental inequality in the Australian health system is between those patients who are totally reliant on the public system and those who have private health cover. In 2024, 54.6% of the population had some form of private health insurance (APRA, 2024). Table 1 shows that household income plays a major role in determining whether a person has private health insurance. Whereas just over a third (35.3%) of individuals in the bottom 20% were covered, just under 80% of people in the highest 20% were (ABS, 2024).
Proportion of people 15 years and over, that had private health insurance in 2023–2024
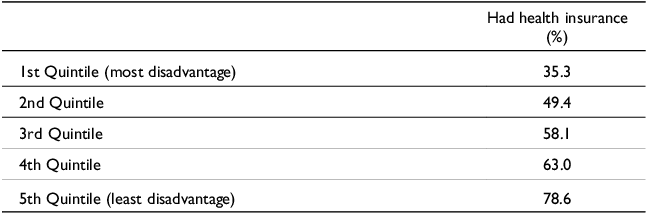
Reference period 2022–23. Source ABS (2024)
The difference that having private health insurance makes is perhaps most marked with respect to surgery. Whereas most patients with private health insurance that covers private hospital care, are able to choose their surgeon and a date for their surgery in a private hospital, patients reliant on the public system have no say over their medical team. If the surgery is not urgent, public patients usually have to wait for an extended period. About 95,000 people were on an elective surgery waitlist in New South Wales (NSW), Australia’s most populous state, in March 2022 and almost 11,000 were overdue for elective surgery, including 3200 waiting for a hip replacement (Carroll and Ward Reference Carroll and Ward2022). The median waiting time nationally for surgery in 2023–24 was 46 days (56 days for Indigenous Australians); however, there was significant variation depending on the procedure. Thus, the average waiting time for a hip replacement was 135 days in 2023–24 (AIHW 2025a).
Where people live is a key factor as to whether they use public or private hospitals. In 2023–24, people living in the least advantaged socio-economic areas had the highest public hospital hospitalisation rates, 350 hospitalisations per 1000 population, compared to 159.7 public hospitalisations for people in the most advantaged areas. People living in the highest advantage socio-economic area had the highest private hospital hospitalisation rate, 235 hospitalisations per 1000 population, compared to 111 per 1000 for people living in areas of lowest advantage (AIHW 2025a).
Private health insurance is a huge business. The profits of Medibank, which has more than 4 million members and is Australia’s largest private health insurer, jumped by almost 30% in 2022–23 to $511 million and a further 14% in 2023–2024 to $570.4 million. The profits of Bupa, the second largest operator with around 3.5 million members, increased by 43% in 2022 to £575 million (May and Barrett Reference May and Barrett2023). How much the Australian component contributed is not clear. Bupa Australia is part of the Bupa group that operates in over 190 countries and is headquartered in London.
Any increase in private health insurance premiums has to be approved by the Federal Government. Each year, the industry approaches the Federal Government for an increase, which is invariably above inflation. At the end of 2024, they requested that premiums be increased by between 5 and 6%. Ultimately, the government allowed an increase of 3.73% (Butler Reference Butler2025). Over the last two decades, private health premiums have risen around 60% more than wages (Jericho Reference Jericho2024). It is expensive, with top cover for a couple around $450–$500Footnote 2 a month (Australian Government 2025). The high fees, as indicated by Table 1, certainly exclude a large proportion of low-income individuals/ households. Alternatively, many individuals who take out private health insurance opt for minimal coverage.
GPs, bulk billing, and access
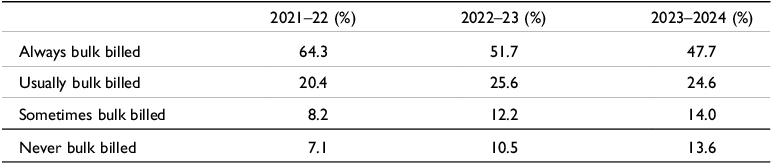
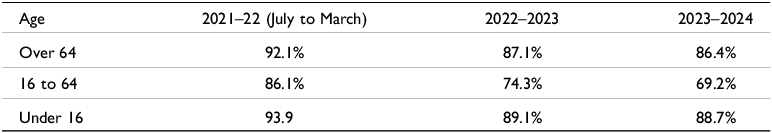
When Medicare was launched in 1983 it was envisaged that all visits to GPs and specialists would be bulk billed, that is, consultations would be free for the patient, while the GP or specialist concerned would claim the consultation fee from the government. Although bulk billing has declined, patients who are reliant on government benefits for their income (they are called concession card holders) are still usually bulk billed for GP visits. Concession card holders include retirees on the government Age Pension, people reliant on the Disability Support Pension or the unemployment benefit, currently called JobSeeker. Children are also usually bulk billed. However, an increasing proportion of GPs are not bulk billing concessional patients and are certainly not non-concessional patients, that is, patients who are above the age of 16 and not reliant on a government benefit for their income. Table 2 displays the proportion of concessional and non-concessional patients always bulk billed, usually bulk billed, sometimes bulk billed, and never bulk billed in 2022–23 and 2023–2024. It shows an alarming and rapid drop in the proportion of patients that were always bulk billed – from 64.3% in 2021–22 to 47.7% in 2023–24. Furthermore, the proportion of patients who were never bulk billed nearly doubled, increasing from 7.1% to 13.6%.
Extent of bulk billing by GPs in 2021–22, 2022–2023, and 2023–24

Source: Australian Government (2024a); Chrysanthos & Dow (Reference Chrysanthos and Dow2023)
Table 3 shows a disturbing and rapid decline in the number of patients bulk billed between the ages of 16 and 64. Most of this age group would be non-concessional patients. Whereas in 2021–22, 86.1% of patients in the 16 to 64 age group were bulk billed, in 2023–24, only 69.2% were.

The proportion of GPs that bulk bill all of their patients fell from 29% in 2017 to 12% in 2023 (The Royal College of General Practitioners 2023). For patients who move to a new area, finding a GP who bulk bills can be extremely difficult. A nation-wide survey of 6000 GP clinics in 2023 found that in nine electorates, not one GP bulk billed new non-concessional patients, and nationwide, in only nine electorates did more than 75% of GPs bulk bill this group of patients (in Branley and Thorne Reference Branley and Thorne2024).
Where patients are located also plays a central role in whether patients are bulk billed. Wealthier areas tend to have lower bulk billing rates than low-income areas in the same city. Thus, in the financial year 2022–23, 83.4% of patients in Western Sydney, an area with a high proportion of low-income households, were bulk billed, the highest rate in Australia’; in contrast in North Sydney, a high-income area, only 45.1% were bulk billed. However, outside of the larger cities, there are low levels of bulk billing in low-income communities; 43.2% of patients in country South Australia, 49% in country Western Australia, 43.5%, in Western Victoria, and in Tasmania, Australia’s poorest state, only 36.5% of patients had all their GP visits bulk billed (Australian Government 2024). In rural areas, 60% of patients were bulk billed in 2021–22 compared to 69% of patients in metropolitan areas, and ‘bulk billing deserts’ are more prevalent in low-income areas (Breadon and Fox 2023).
People in remote and very remote areas also have far greater difficulty accessing a GP. In 2021–22, there were 67 doctors per 100,000 in very remote areas, 75 doctors per 100,000 in remote areas, and 125 doctors per 100,000 in metropolitan areas (The Royal College of General Practitioners 2023). Despite overseas trained doctors being required to work in regional and more remote areas called Distribution Priority Areas for ten years, many of these areas face a critical shortage of GPs. One estimate is that in NSW, 60 towns and regions are at risk of ‘critical doctor shortages’ in the coming years (Carroll and Fellner Reference Carroll and Fellner2022).
GP consultation fees and the government rebate
The average fee charged by GPs for a consultation in 2024 was $78, in 2023, it was $75, and in 2022, it was $64.03 (Royal Australian College of General Practitioners 2024). The government rebate in 2024 was $41.40. Thus, the out-of-pocket cost for an average fee consultation ($78) would be $36.60 ($78 minus $41.40). Only 19% of GPs charged $41.40 for a consultation in 2024; 38% charged between $41.40 and $85, and 43% charged $85.01 or more (Royal Australian College of General Practitioners 2024).
The government rebate for GPs was virtually frozen from 2013 to 2022. In a context of rising costs of running a medical practice, the freeze made it increasingly difficult for GPs to bulk bill. The Labor Party, when it was in power federally (November, 2007 to September, 2013) introduced the first rebate freeze in 2013 (Dickinson Reference Dickinson2016). After regaining power in 2013, the Coalition federal governmentFootnote 3 continued the freeze right up to May 2022 when it lost power. Figure 1 illustrates how increases in the Medicare rebate have been constantly outstripped by increases in average weekly wages and the Consumer Price Index (CPI).
Medicare rebate verse average weekly earnings and CPI.
Source: May (2024b).
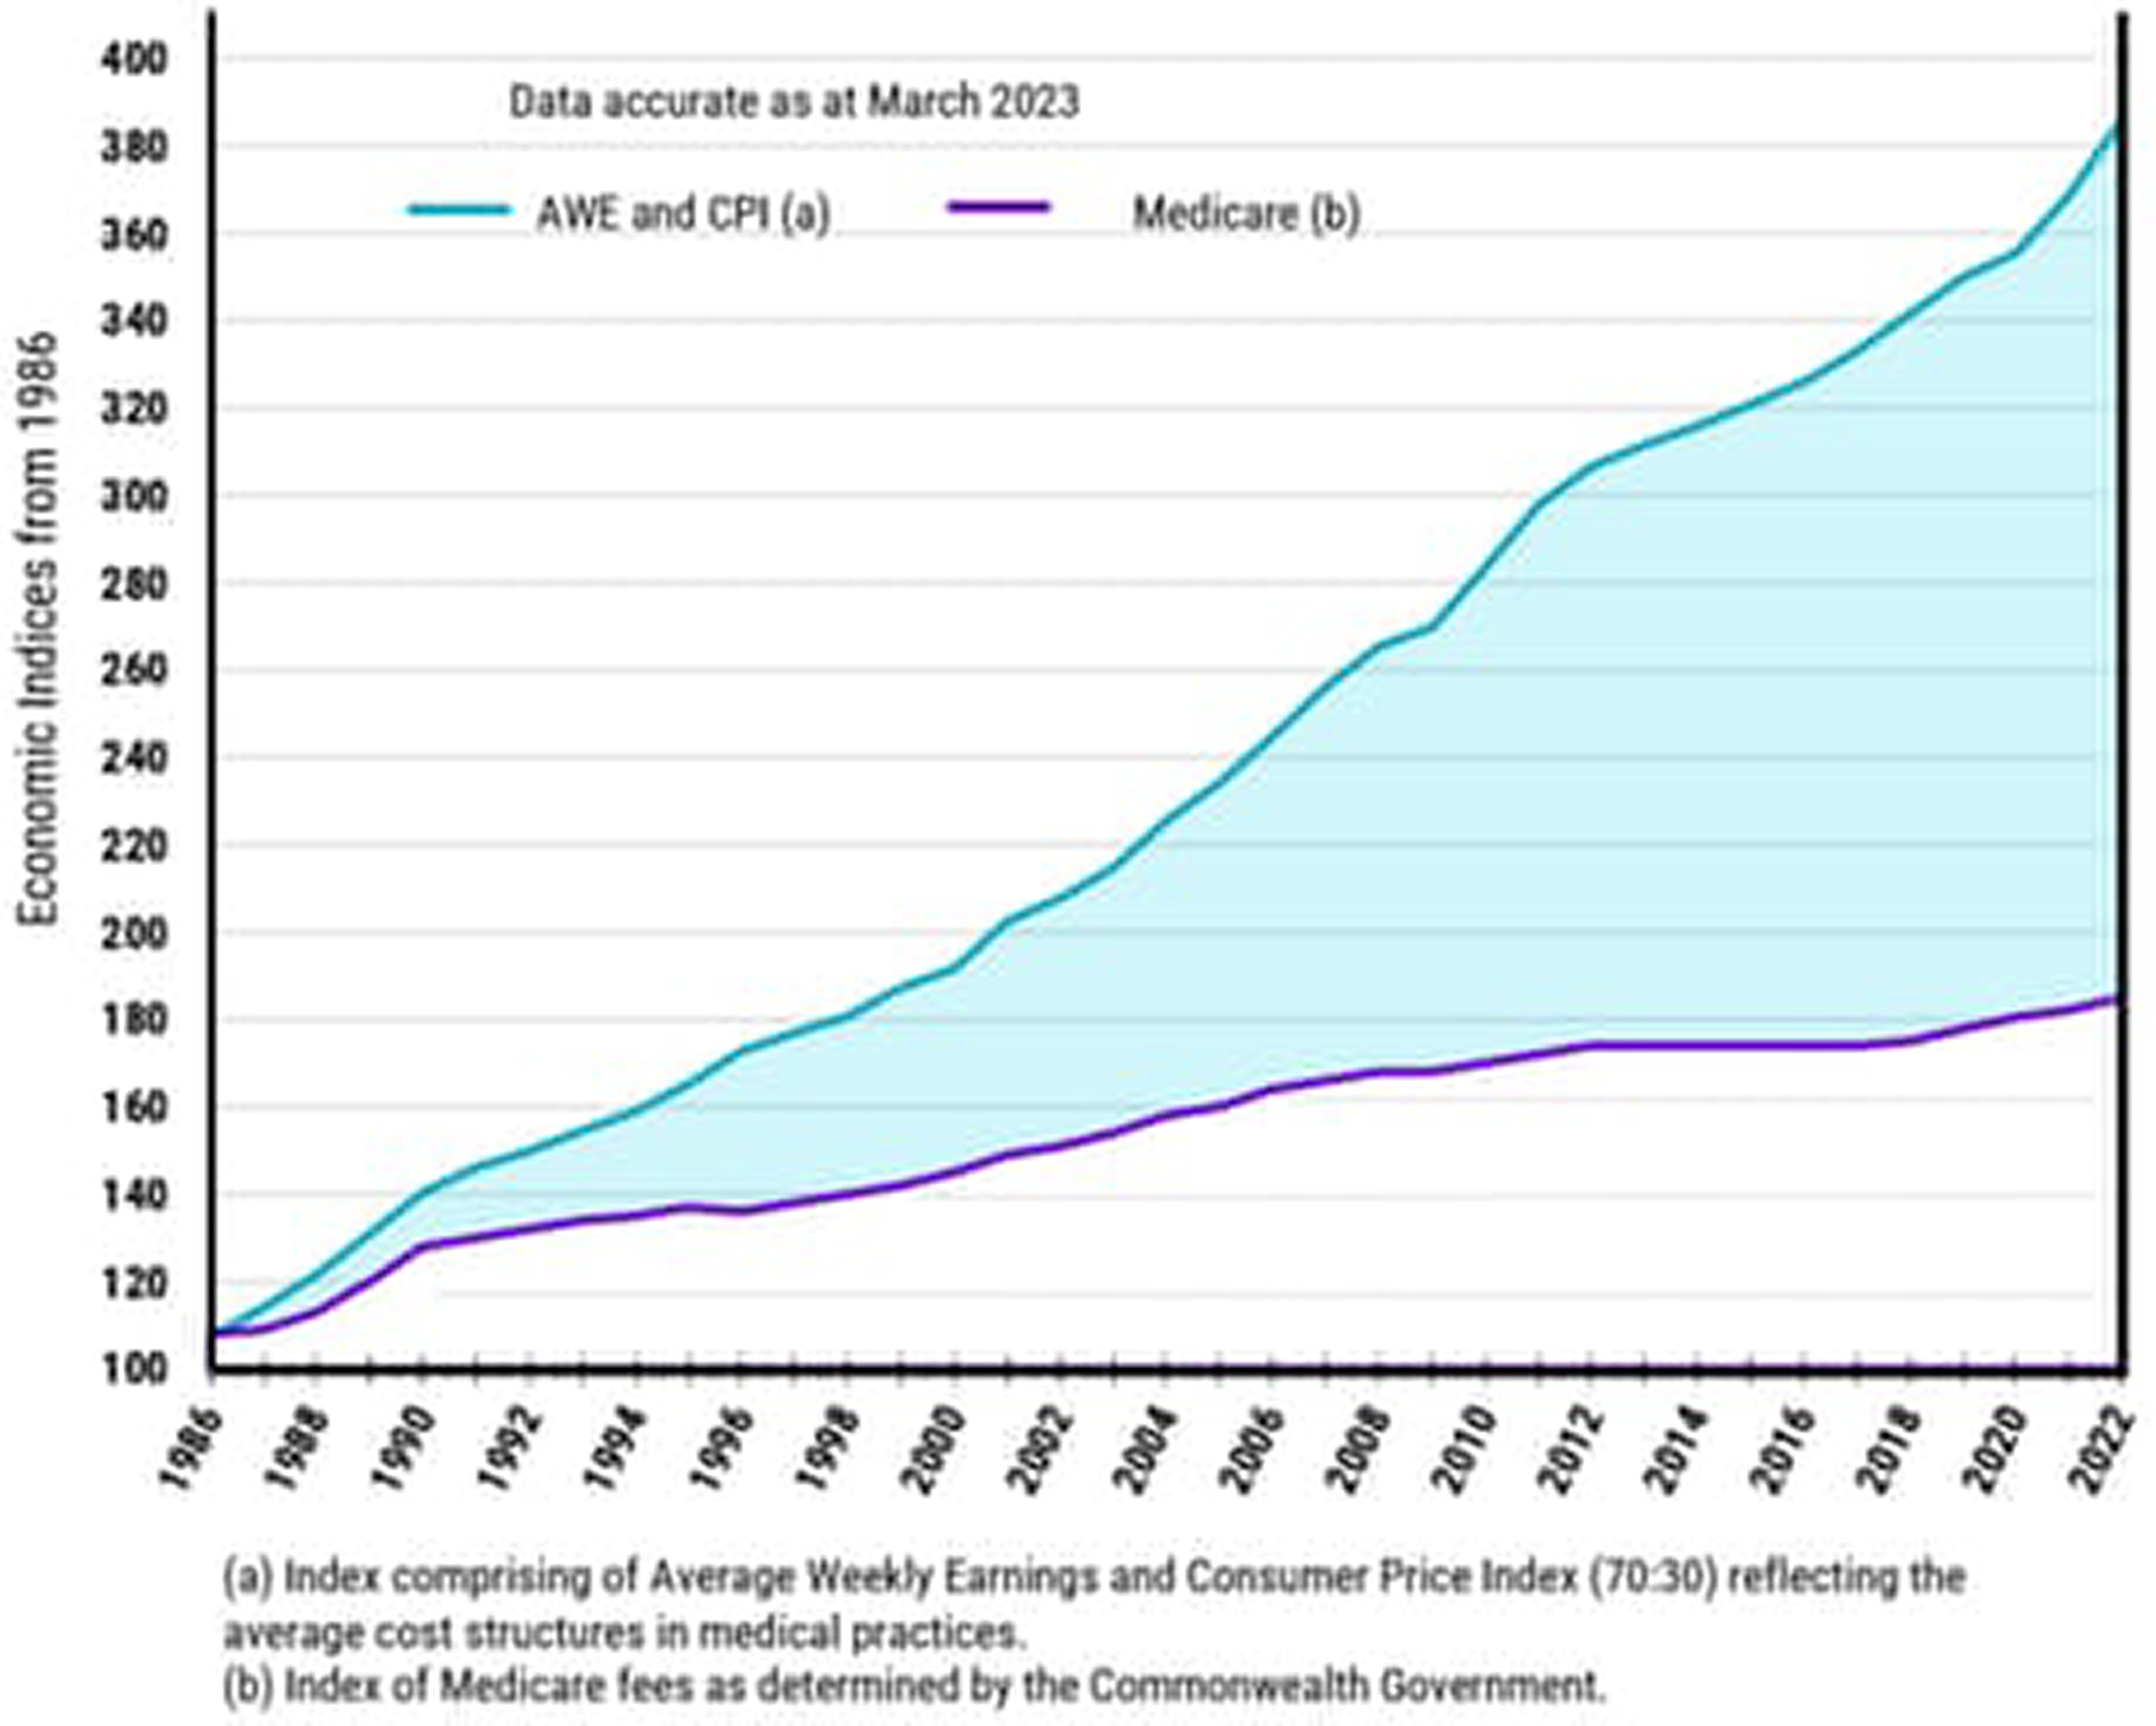
The decade-long virtual freeze on Medicare rebates has put enormous pressure on GPs who are seeing a lot more complex cases requiring longer consultation times and greater out-of–pocket expenses for patients. The number of patients with two or more chronic conditions has grown substantially; in 2007–08, 16.5% of Australians had two or more chronic conditions, in 2022, 21.9% did (AIHW 2024a). This is partially due to the increasing number of older patients; in 2024, just under 17% of Australia’s population was aged 65 and over, up from 13.3% in 2009 (AIHW 2024c). The President of the Royal Australian College of General Practitioners (RACP) commented in October 2024 that ‘Government has only taken the first steps to rebuild Medicare and general practice after decades of underfunding and the Medicare freeze’ (in Elmas Reference Elmas2024).
Surprisingly, the potential cost of a consultation appeared to be deterring, only a small proportion of individuals from seeing a GP. Only 7.9% of people in the most disadvantaged areas said they delayed seeing a GP when needed due to cost, compared to 3.5% in the least disadvantaged areas (ABS 2023a). The Australian National Health Survey 2014–2015 showed ‘a small pro-rich inequity in the probability of any GP visit’ (Pulok et al Reference Pulok, van Gool and Hall2020b, 7). This inequity was primarily due to increasing out-of-pocket expenses. Earlier studies had found that low-income household members were more likely to visit their GP than high-income household members (Hajizadeh et al Reference Hajizadeh, Connelly and Butler2012; van Doorslaer et al Reference Van Doorslaer, Clarke, Savage and Hall2008).
The increase in bulk billing due to incentive payments
In November 2023, the federal government introduced ‘Increases to bulk billing incentive payments’ to encourage more GPs to bulk bill. GPs in metropolitan areas whose bulk bill concession card holders and children under 16 receive a $20.65 bonus an increase from $6.85. Moreover, the bulk billing incentive in very remote areas has increased from $13.15 to $39.65. The incentives had an immediate impact – there were 360,000 additional bulk billed visits to GPs in November 2023 of which 202,000 were in regional and rural areas (Chrysanthos Reference Chrysanthos2024). Nationally, 79% of GP services were bulk billed in May Reference May2024, up from 75.6% in October 2023. In Tasmania, bulk billing increased by 8.1% in this period, from 66.3% to 74.4% (Australian Government 2024a).
Medical specialists and inequality in usage
The impact of the cost of consultations is far more significant in the case of medical specialists (Pulok et al Reference Pulok, van Gool and Hall2022). Similar to many countries in the OECD, the high out-of-pocket expenses associated with specialist care means that ‘In general people from poorer socioeconomic backgrounds use fewer specialist services compared to their richer counterparts …’ (Pulok et al Reference Pulok, van Gool and Hall2022, 652). As with GPs, fees for specialists are unregulated, and they can charge whatever they see fit. A major limitation of Medicare in Australia is the limited coverage of the cost of specialist consultations. Thus, between January and March 2024, Medicare funding covered just over half (52%) of specialist fees, excluding surgery, down from 72% in the early 2000s (Dalzell Reference Dalzell2024). A study found that in 2016, only 8% of specialists charged a fee to all of their patients, which meant that patients did not have out-of-pocket expenses (Johar et al Reference Johar, Mu, Van Gool and Wong2017).
Although the Labor Party has increased the rebate for specialists to $78 per consultation (Australian Government 2024), patients usually have substantial out-of-pocket expenses if they need to see a specialist. The ‘typical’ initial specialist appointment in 2024 was $210, and patients thus had to pay $132 out-of-pocket (Australian Government 2024). The high cost of seeing a specialist, not surprisingly, results in people deferring their appointment or deciding not to see a specialist despite a referral from a GP (Pulok et al Reference Pulok, van Gool and Hall2022). Latest figures (2022–23) indicated that 12.9% of people aged 15 and over in ‘most disadvantaged areas’ delayed or did not see a medical specialist due to cost, compared to 8.7% of people in ‘least disadvantaged areas’ (ABS 2023a). Overall, in 2022–23, 10.5% of people deferred or did not see a specialist due to cost, up from 8% in 2021–22 (ABS 2023a). Consultations with specialists are less common for people in disadvantaged areas; 25% of people in disadvantaged areas had at least one specialist consultation in 2022–23 compared to 43% of people living in the highest socio-economic area (AIHW 2024a).
For serious illnesses that require ongoing treatment, the out-of-pocket expenses can be considerable and leave many low-income and even middle-income individuals/families struggling to cover the costs. The Leukaemia Foundation estimated that the annual average out-of-pocket expenses for blood cancer treatments can range from $5000 to $11,000. The chief executive of the Foundation commented that its financial assistance programme had received a 37% increase in demand in 2023:
People can’t afford to put tyres on their cars and that means they can’t get to appointments. It’s extraordinary, people are forced to choose between basics—electricity and food—or getting life-saving treatment (in Banks Reference Banks2023).
A survey that had 1200 respondents, most of whom had private health insurance, found that 38% of those with an autoimmune condition, 27% with breast cancer, and 18% with chronic illness, annually had had more than $10,000 in out-of-pocket expenses (in Han Reference Han2018). The high fees also lead to inequity – ‘people with higher income utilised more of these [specialists] after accounting for the differences in need …’ (Pulok et al Reference Pulok, van Gool and Hall2020c, 1268). Even with top cover private health insurance, a range of procedures are not covered or are only partially covered. A woman who had top private health cover recounted how her breast cancer diagnosis resulted in $14,000 in out-of-pocket expenses (in Han Reference Han2018).
It is evident that the Medicare rebate for specialist treatment is too low; however, it is not the sole reason for the prevalence of substantial out of pocket expenses. Many specialists charge excessive fees. Four of the five highest paid professions in Australia, according to the Australian Tax Office, are in medical specialities. The average taxable income for the Australian population in 2021–22 was $71,237; however, the average income of surgeons was $460,356; of anaesthetists, $431,193; and of internal medicine specialists, $340,729 (Read and McIlroy Reference Read and McIlroy2024).
Life expectancy and inequality
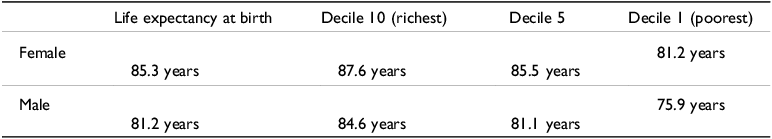
Life expectancy in Australia is the third highest globally and has increased by 40% since the start of the 20th century (ABS 2023b; AIHW 2024a). A girl born in 2020–2022 in Australia is expected to live on average to 85.3 years and a boy to 81.2 years. However, there are significant class, racial, and spatial differences. An analysis by the government actuary found that the Socio-Economic Indexes for Areas (SEIFA), in which an individual is born makes a substantial difference. Table 4 shows that a boy born in the most affluent SEIFA (decile 10, top 10%) in 2016 has a life expectancy of 84.6 years, whereas a boy born into the lowest SEIFA (decile 1, bottom 10%), has a life expectancy of 75.9 years, nearly 9 years less (Australian Government Actuary 2021). For girls, the differences are not as dramatic. A girl born in the highest SEIFA has a life expectancy of 87.2 years, compared to an average lifespan of 81.2 years for a girl born in the lowest SEIFA, a difference of 6 years.
Life expectancy overall and by SEIFA

Not only are there differences between the top 10% and the bottom 10%, even children born into SEIFA 5 have a lower life expectancy than children born in SEIFA 10. For boys, it is 3.5 years, and for girls, it is 2.1 years (Australian Government Actuary 2021).
There are also significant spatial differences. A report by the National Rural Health Alliance concluded,
The further an Australian lives from an urban centre, the lower their life expectancy. They are also twice as likely to die from preventable illness. … [R]ural men are 2.5 times and women 2.8 times more likely to die from potentially avoidable causes than those in urban areas (National Rural Health Alliance 2023).
A study that examined widening inequalities in premature mortality in Australia between 2006 and 2016, concluded that ‘death rates in the lowest area socio-economic quintile are double those in the highest quintile, with the gap widening by over 26% for females and 14% for males from 2011–16’ (Adair and Lopez Reference Adair and Lopez2020, 47). Location was also found to be a key factor, and its significance has increased since 2006. The age-standardised death rates (ASDRs) for 35- to 74-year-olds ‘living in outer regional, remote and very remote areas of Australia were 40% higher in 2016 than for the population living in major cities and this excess mortality has been rising since 2006, more so for women’ (Adair and Lopez Reference Adair and Lopez2020, 43).
Inequality in screening is an important factor contributing to varying life expectancy. People who have immigrated to Australia, more especially those from culturally and linguistically diverse (CALD) communities, tend to have lower rates of screening and higher rates of some cancers. The Deputy Chief Executive of the Cancer Institute in NSW commented, ‘some communities continue to bear the burden of cancers more than others’ (in Ward Reference Ward2022).
First Nation Australians and life expectancy
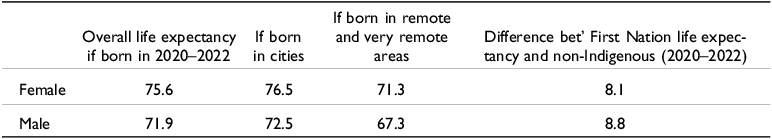
There is a considerable difference in life expectancy for Indigenous Australians compared to non-Indigenous Australians – around 8.8 years for males and 8.1 years for females. Life expectancy at birth (2020–2022) for First Nations males was 71.9 years, and 75.6 years for females (2024b). Table 5 shows that there are also significant spatial differences; First Nations people in remote and very remote areas have far lower life expectancies than First Nations people in cities. First Nations males in remote and very remote areas have a life expectancy of 67.3 years compared to 72.5 years in major cities. The comparative figures for females are 71.3 years in remote and very remote areas versus 76.5 years in ‘major cities’ (ABS 2023c). Noteworthy is that life expectancy in remote and very remote areas is more in line with less developed countries. For example, in India, life expectancy in 2020 was 67.74 years.
Life expectancy of Indigenous Australians

Source: ABS (2023c) Aboriginal and Torres Strait Islander life expectancy. Canberra: ABS.
The impact of location for Indigenous Australians and life expectancy is potentially profound. For example, a parliamentary inquiry into regional health in NSW found that in Wilcannia in regional NSW, about 950 kilometres from Sydney, people requiring dialysis have to travel or move to Dubbo, which is 550 kilometres away. Wilcannia’s 600 residents are mainly Indigenous. The chair of the Wilcannia Local Aboriginal Land Council observed that the average life expectancy in Wilcannia was 37 for man and 42 for women. He commented, ‘I’m 39 and every day I wake up and thank god I’m still alive’ (in Fellner Reference Fellner2021).
Inequality in mental health outcomes and care
Mental health is a major part of Australia’s health burden. ‘In 2020–2022, an estimated 8.5 million Australians aged 16–85 had experienced a mental disorder at some time in their life (43% of the population)’ (AIHW 2024d, 23). Five million Australians, 18% of the population, were dispensed a mental health-related prescription in 2023–24 (AHIW 2025b). Studies suggest that financial hardship increases the possibility of psychological distress (Hashmi et al Reference Hashmi, Alam, Gow and March2021; Ryu and Fan Reference Ryu and Fan2023). A systematic review of financial stress and depression in high-, middle-, and low-income countries concluded,
Economic indicators such as material assets, unsecured debt, financial hardship, and subjective measures of financial stress are relatively strong and persistent predictors of depressive symptoms … (Guan et al Reference Guan, Guariglia, Moore, Xu and Al-Janabi2022, 12).
An Australian study drawing on the 2011–2012 National Health Survey (12,332 adult respondents) found that among the bottom 20% of income earners, one in four had psychological distress at a high or very high level, compared to one in 20 people in the richest one-fifth. If the focus is solely on very high psychological distress, one in ten people in the poorest one-fifth had very high distress, compared to less than one in 50 people in the richest one-fifth (Isaacs et al Reference Isaacs, Enticott, Meadows and Inder2018).
An analysis of the data of 13,496 persons from the Household, Income, and Labour Dynamics in Australia (HILDA)Footnote 4 survey, waves 12 to 17, (2012 to 2017), concluded that ‘Lower SES groups experience more life shocks than higher SES groups and in turn generate higher socioeconomic mental health inequality’ (Hashmi et al Reference Hashmi, Alam and Gow2020). Life shocks refer to negative life events (separation from a partner, prison, serious personal injury) and financial hardship.
Despite its prevalence, the coverage of mental health by Medicare is limited, and just under one in five people (19.3%) said that ‘they delayed or did not see a health professional for their own mental health when needed due to cost. This rose from 16.7% in 2021–2022’ (ABS 2023a). A central feature of the government’s mental health programmes is the Mental Health Treatment Plan. Medicare allows a GP to create a Mental Health Treatment Plan, which gives a patient ten sessions with a mental health professional. Patients in rural and remote areas can access the scheme using video conferencing. These sessions are not necessarily bulk billed, but the rebate is generous. If a patient has a Mental Health Treatment Plan, they will get back $141.85 (2024 figure) if they see a clinical psychologist. The average cost of a consultation in Sydney in 2024 was $217; so, low-income patients would struggle to cover the out-of-pocket cost of around $85.
An analysis of the HILDA survey from wave 9 (year 2009) to wave 17 (year 2017) found significant inequalities in mental health status and psychiatric care utilisation. Despite the ‘richest income group’ having a mental illness rate that was far lower than the poorest income group, 17.56% versus 32.23%, their utilisation of mental health support was similar; 8.48% for the highest income group and 10.16% for the poorest income group (Hashmi et al Reference Hashmi, Alam, Gow, Alam and March2023).
A 2023 report found that in NSW although mental issues represented 15% of the state’s total burden of disease, spending on mental health represented only 6.5% of the health budget (Ward Reference Ward2024). The historical under-funding of mental health, combined with the increased prevalence of psychological distress, has resulted in a crisis in the sector. The executive director of the Black Dog Institute in NSW commented,
The fact is the NSW mental health system is critically underfunded and on the brink of collapse. Across the state, we are seeing mental health services stretched to their limits, the mental health workforce is burnt out, and people who need help are falling through the cracks (in Ward Reference Ward2024).
At the end of 2024, in protest against understaffing and uncompetitive pay, 145 out of 295 psychiatrists in the public sector in NSW resigned. The NSW chair of the Royal Australian and New Zealand College of Psychiatrists voiced her support for her colleagues:
There are so many psychiatrists that are dedicated to the public sector, and they want to keep working in the public sector, but it is absolutely demoralising when you can’t provide the care that you are trained to provide because of how under-resourced the system is. I think it really shows how serious and how dire the issues are in our public mental health system (in Ward Reference Ward2024).
The mental health staffing crisis in the public sector is certainly more acutely felt by low-income patients who would be reliant primarily or totally on the public system for support.
Inequality in dental health outcomes and care
The failure to include dental care in Medicare means that many low-income individuals are reliant on the hopelessly overstretched and under-funded public system for dental treatment. Whereas 65% of people living in areas of least socio-economic disadvantage saw a dental professional in 2022–23 compared with only 41% of people in areas of most disadvantage (ABS 2024). It has been estimated that in 2022–23, around two million Australians, 16% of the population, avoided dental care due to cost. Around four in ten adults wait for more than a year before seeing a dentist (Breadon and Griffiths Reference Breadon and Griffiths2024).
The public dental waiting list in April 2022 in NSW was just under 100,000 up from 47,000 people in 2013. The average wait time for a first appointment was 460 days (Carroll Reference Carroll2022). In Victoria, just over 151,000 people were on the waiting list and the average wait time was 24.8 months. Delaying dental care can have serious repercussions. Nationally, in 2021, there were 67,000 hospital admissions for dental problems (Carroll Reference Carroll2022). Almost all of them could have been avoided if the patient had had early access to dental treatment.
Adults who were eligible for public dental care ‘had a higher average number of decayed, missing and filled teeth (15.7) compared with those who were ineligible for public dental care (9.3)’ (AIHW 2023). All children under 12 are eligible to be on the public waiting list for dental care, as are all concession card holders, that is, people reliant on the Disability Support Pension, the Age Pension, and JobSeeker (the unemployment benefit).
The inequality begins in childhood. Half of the children in low-income households had tooth decay versus 40% in medium-income, and 33% in high-income households. Around 42% of children aged between five and ten had experienced dental caries (decay); however, the rate was 1.5 times higher for Indigenous children – 61% versus 41% for non-Indigenous (AIHW 2023). Tooth decay was 1.4 times higher for children living in remote and very remote communities compared to those living in cities.
Gingivitis (early-stage gum disease) was also more prevalent in children from low-income households. Just over a quarter (26%) of children from low-income households had gingivitis compared to 17% of children from high-income households. Indigenous children were more likely to have gingivitis – 34% versus 21% of non-Indigenous children (AIHW 2023).
Gender inequality: the gender health gap
‘Medical misogyny’ – the argument that the medical concerns of women are taken less seriously than those of men, is a serious concern (Norman Reference Norman2018). The view that women’s medical conditions are not given equal priority has been noted by the president of the National Association of Specialist Obstetricians and Gynaecologists (NASOG). She powerfully highlighted gender discrimination in Medicare rebates:
Over time, the Medicare rebates [for women’s health issues] fall further and further behind, so that we see now they’re almost meaningless when it comes to accessing care. It is so far out of touch with what it actually costs to access the services that it doesn’t provide any degree of comfort to the patients who have to purchase these services … There’s been a historical lack of funding for women’s health and that’s federal government-sanctioned gender-based unfairness. The Medicare rebates for women’s health issues are notoriously undervalued and paid less than for men’s health (in Dalzell Reference Dalzell2024).
The vice president of the Royal Australian and New Zealand College of Obstetricians and Gynaecologists (RANZCOG) had a similar view: ‘What the Medicare Benefits Schedule shows us very clearly is that there is a Medicare gap between what is reimbursed for women and what is reimbursed for men’ (in Long Reference Long2024). She pointed to the rebates for a scrotal ultrasound (recommended rebate fee, $118.65) versus a pelvic ultrasound (recommended rebate fee, $106.45) as an example:
The pelvis contains the uterus, it contains the neck of the uterus, which is the cervix, it contains the bowel, it contains all of the attachments of the uterus to the side walls of the pelvis, it contains the bladder … which means that these scans take time, they take expertise, but they definitely should have a higher Medicare rebate than a [scrotal] scan that doesn’t require that level of expertise or that amount of time.
Specialists have requested an urgent review of Medicare rebates for procedures around women’s health. For example, only 39% of obstetric costs were covered by Medicare in July 2024, compared to 60% in 2009 (Dalzell Reference Dalzell2024). It is estimated that up to a million Australian women suffer from endometriosis and pelvic pain (Khot Reference Khot2024). A 37-year-old women suffering from ‘severe complex endometriosis’ calculated that over the last two decades her condition had resulted in out-of-pocket medical expenses of around $11,000 (in May Reference May2024).
Pressure, spearheaded by the advocacy group, Endoactive, has resulted in a recent shift in the way endometriosis is viewed in Australia, and in 2024, the Federal Labor government increased the rebate for endometriosis consultations. The Victorian state government launched an inquiry into women’s pain in 2024. In NSW, the state government established the Birth Trauma Inquiry. Close to 2000 women sent in submissions noting that their experience around giving birth was traumatic due to callous treatment by the doctors and healthcare workers involved in their care (NSW Parliament 2024).
A study of 186,789 women who gave birth in Queensland between 2012 and 2015, found inequitable health service utilisation (Fox et al Reference Fox, Topp, Lindsay and Callander2021). The study concluded that Indigenous women were less likely to commence antenatal care in the first trimester compared to non-Indigenous mothers. Moreover, the most disadvantaged women were less likely than advantaged women to attend more than eight antenatal care appointments and begin antenatal care in the first trimester. Spatial inequalities were significant: ‘Rural and remote mothers with a mental health diagnosis were significantly less likely to receive psychological support from a GP and support from a psychologist than urban mothers’ (Fox et al Reference Fox, Topp, Lindsay and Callander2021, 2188).
‘Obstetric violence’ is a major issue. In a national survey of 8804 women who had given birth in the last five years just over one in ten answered ‘yes’ or ‘maybe’ to the question, ‘Do you think you experienced obstetric violence (dehumanized treatment or abuse by health professionals towards the body or reproductive process of women)?’. The women who responded yes or maybe were asked to comment and the comments indicated that the women felt ‘dehumanised’, ‘violated’, or ‘powerless’ (Keedle et al Reference Keedle, Keedle and Dahlen2022).
Family and domestic violence
A major medical issue that overwhelmingly impacts on women is the aftermath of gender violence. In 2021–22, 20% of the adult population (3.8 million people) reported experiencing physical and/or sexual family and domestic violence since the age of 15 (AIHW 2024e). The health consequences of being a victim of sexual violence are often severe. Besides the severe mental health impacts, studies have found that the long-term impacts include a greater risk ‘of reporting symptoms such as nausea, vomiting, abdominal pain, diarrhoea, and bloatedness (41%) compared with non-assaulted women (26%)’ (Jina and Thomas Reference Jina and Thomas2013, 16). The Chair of the Family Violence Prevention at the University of Melbourne has called for greater training for GPs and noted that at present ‘there is no mechanism in place to fund the extra time needed upon disclosure to assess, respond and refer all members of a family to appropriate care’ (in Liotta Reference Liotta2021). She has called for the development of Family Safety Plans:
Like Mental Health Care Plans, after assessment patients could be eligible for up to 10 sessions with social workers and psychologists trained in trauma-informed care specific to domestic, family and sexual violence (in Liotta Reference Liotta2021). *
Spatial inequality in health care and access
Around 28% of the Australian population lives in rural and remote areas. Overall, the health outcomes of people in these areas are poorer than that of people in metropolitan areas. ‘Data show that people living in rural and remote areas have higher rates of hospitalisations, deaths and injury and also have poorer access to, and use of, primary health care services, than people living in major cities’ (AIHW 2024f). A negligible number of medical specialists are located in regional, remote, and very remote areas and most of these areas rely on specialist services flying in from larger centres.
The collapse of Rex, a regional airline, in July 2024, created a crisis in these areas.Footnote 5 The director of Ophthalmology at Broken Hill hospital commented that his team of 10 specialists takes turns to travel to Broken Hill from Sydney and Adelaide (Broken Hill is 1142 kilometres from Sydney and 516 kilometres from Adelaide) and relied on Rex:
Broken Hill, like many remote places, has a very heavy dependence on remote specialists who fly in and fly out, and without them the service stops, and the only people to suffer in the end will be our patients. This is an absolute red-line, critical infrastructure issue. From a medical perspective, this is a service that cannot be allowed to fail (in Naylor Reference Naylor2024).
A Sydney-based cardiologist flies to regional towns once a month, where she runs outreach clinics. She also noted how critical Rex is for specialist services in more remote areas:
A whole bunch of different specialties use these services to deliver healthcare to people all over the country. … Having affordable regional air travel is essential to getting specialists to deliver healthcare (in Naylor Reference Naylor2024).
The federal government, realising the importance of the regional airline, gave Rex an $80 million lifeline, enabling it to continue flying whilst it looked for a buyer. If a buyer is not found, the government pledged to purchase the airline (Chrysanthos and Foley Reference Chrysanthos and Foley2025).
Patients in regional and rural areas who require complex specialist treatment usually have to be taken to larger centres for treatment. Even in towns close to major cities, patients can struggle to access the required care. For example, at the end of 2024 in the Central Coast area, which is only around 100 kilometres from Sydney, gynaecologists in Gosford public hospital, cancelled all non-urgent cases. Staff shortages meant that they could only treat urgent and life-threatening cases. Gosford is the largest town in the area and the hospital serves a region covering 1680 square kilometres and a population of 350,000 (Aubusson Reference Aubusson2024).
The issue of unequal access is not confined to regional and rural areas. For example, in a low-income suburb in northern Hobart (Hobart is the capital of the state of Tasmania, population about 189,000 in 2024), the closure of the local GP clinic with an active patient list of around 3000, created a crisis for the local population. A mother of two young children who are highly susceptible to illness captured the impact on people residing in the area:
I’m struggling to get into any doctors that are close, everyone just turns around and says there’s no place for any new patients, and they don’t say, ‘We can put you on a waiting list’. (in Alvaro et al Reference Alvaro, Holmes and Whitfield2022).
In a low-income outer Sydney suburb, a GP practice catering to a vulnerable low-income population had spent 10 months endeavouring to recruit a GP and at the time of writing had not been successful. The chair of the Royal Australian College of General Practitioners’ poverty and health group said he was not surprised that the clinic was battling to recruit:
There’s a sense that only rural and remote areas have GP workforce shortages, but so do disadvantaged areas in major cities. Doctors working in west and south-west Sydney areas tell me they really struggle to recruit (in Aubusson Reference Aubusson2025).
Health outcomes and socio-economic indicatorsFootnote 6
The available data show that socio-economic status is a major factor shaping health outcomes in Australia. The analysis by de Leeuw et al (Reference De Leeuw, Fatema, Sitas, Naidoo, Treloar, Phillips, Dorsch and Goldie2021), drawing on the Australian National Health Survey (NHS), indicates that in the latest NHS, although 45.6% of people aged 15 years and over ‘considered themselves to be in excellent or very good health’, there was a ‘noticeable pattern related to income position and employment’ and geographic location (de Leeuw et al Reference De Leeuw, Fatema, Sitas, Naidoo, Treloar, Phillips, Dorsch and Goldie2021, 19). Table 6 illustrates the relationship between income and physical and mental health outcomes. It compares the health outcomes of people in the first decile (lowest income) to people in the tenth decile (highest income) and the pertinence of source of income.
Health outcomes, income, source of income, employment status, and location
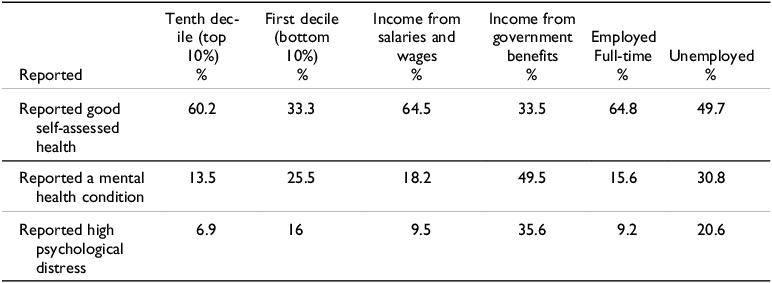
With respect to self-assessed health and income, 60.2% of individuals in households with an equivalised weekly income of $2174 (tenth and highest income decile) reported good self-assessed health compared to 33.3% of individuals in households in the first decile (less than $376 a week, lowest income). Irrespective of age, individuals who were reliant on government benefits for their income reported poorer health than those reliant on wages or salaries. Just under two-thirds (64.5%) of people reliant on wages or salary reported good self-assessed health compared to a third (33.5%) of respondents (under 65) reliant on a government benefit for their income. Labour force status is also an important predictor of self-assessed health status. Just under two-thirds (64.8%) of respondents employed full-time had good self-assessed health, compared to 49.7% of unemployed respondents and 45.7% of people (under 65) not in the workforce.
A similar pattern was evident with respect to mental health, as shown in Table 6. While 13.5% of respondents in the tenth decile (top income) reported a mental health condition, 25.5% of respondents in the first decile (lowest income) did. Respondents on government benefits were also far more likely to report a mental health condition. Just under half (49.5%) of respondents under the age of 65 whose main source of income was a government benefit reported a mental condition compared to 18.2% of respondents earning a wage or salary. Not surprisingly respondents who were unemployed were far more likely to report a mental health condition. Just under a third (30.8%) of unemployed respondents reported a mental health condition, compared to 15.6% of respondents employed full-time.
Household income also shaped how survey participants responded to the question of whether they experienced ‘high psychological distress’; whereas 6.9% of respondents in the tenth decile reported high psychological distress, 16% did in the first decile (de Leeuw et al. Reference De Leeuw, Fatema, Sitas, Naidoo, Treloar, Phillips, Dorsch and Goldie2021). Over a third (35.6%) of respondents reliant on government benefits for their income reported high psychological distress compared to 9.5% of respondents reliant on wages or salary (de Leeuw et al Reference De Leeuw, Fatema, Sitas, Naidoo, Treloar, Phillips, Dorsch and Goldie2021). Unemployed respondents were also more likely to report high psychological distress; 20.6% of unemployed respondents reported high psychological distress compared to 9.2% of employed respondents working full-time (de Leeuw et al Reference De Leeuw, Fatema, Sitas, Naidoo, Treloar, Phillips, Dorsch and Goldie2021).
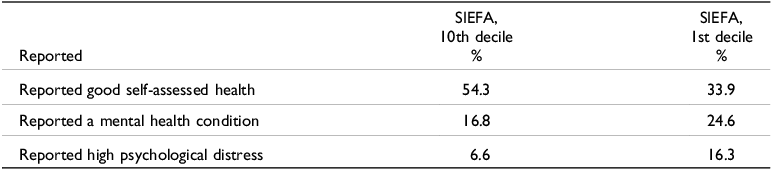
Table 7 indicates that where people are located is also significant. People resident in more affluent areas were more likely to report ‘good self-assessed health’, than individuals located in relatively disadvantaged areas. The socio-economic Indexes for Areas (SEIFA) was highly significant with 54.3% of respondents in the tenth decile (the most advantaged) assessing their health as good, as opposed to 33.9% of respondents in the first decile (most disadvantaged). With respect to mental health, the differences were less significant. Thus, 16.8% of respondents residing in the tenth decile reported a mental health condition compared to 24.6% in the first decile. The differences with respect to high psychological distress were more significant – 6.6% of respondents in the tenth decile reported high psychological distress compared to 16.3% in the first decile (de Leeuw et al Reference De Leeuw, Fatema, Sitas, Naidoo, Treloar, Phillips, Dorsch and Goldie2021).
Health outcomes and location

Smoking, alcohol, processed foods, fast foods, obesity, and inequality
Research has identified the ‘commercial determinants of health’ (CDoH). This approach focuses on ‘the role of commerce and corporate interests as factors in population health …’ (Fox Reference Fox2024, 2). Tobacco, alcohol, and processed foods are the key features of CDoH. Corporations spend vast amounts encouraging the population to consume their unhealthy products and lobby governments to minimise regulation and blunt the impacts of public health campaigns (Robertson et al Reference Robertson, Sacks and Miller2019).
Smoking
Public health campaigns in Australia have resulted in a substantial decline in smoking-related diseases since the 1970s (Adair and Lopez Reference Adair and Lopez2020). However, tobacco is still a major risk factor with respect to disease and poor health in Australia contributing to 44% of the cancer burden and resulting in more deaths than any other risk factor besides obesity (AIHW 2024g). It was estimated that in 2018, tobacco use contributed to almost 20,500 deaths – 13% of all deaths (AIHW, 2024g) This is despite a dramatic drop in daily use from 19.4% of people aged 18 and over in 2001 to 8.3% in 2022–23 (AIHW 2024g). Tobacco use has a substantial class and regional dimension. A study drawing on HILDA data concluded that low-income groups have higher smoking prevalence than high-income groups (Disney et al Reference Disney, Petrie, Yang, Aitken, Gurin and Kavanagh2023). People living in the most disadvantaged areas are far more likely to smoke; 13.4% smoke daily, compared to 4.1% in the most advantaged socio-economic areas. Around one in five people in remote areas smoke (AIHW 2024h).
Research has shown that public campaigns are less effective for low-income populations and ‘the more unfavourable the social and economic conditions of a population group, the less effective change strategies are likely to be’ (Baum and Fisher Reference Baum and Fisher2014, 215). An interesting example of the impact of historical hardship and trauma is that the Stolen Generation, that is, Aboriginal adults who as children were removed from their family, are twice as likely to smoke than those who were not removed (Thomas et al Reference Thomas, Briggs, Anderson and Cunningham2008).
A major recent concern is the rise of illegal tobacco sales which it is estimated accounted for 39% of the Australian tobacco market in 2024, up from around 14% in 2018 (Kruger Reference Kruger2025). The federal government raised the excise duty on cigarettes from 47 cents per cigarette in 2015 to $1.40 in March 2025 to deter people from smoking (Kruger Reference Kruger2025). However, the high prices have spurred a massive black market for cheap cigarettes and undermined government efforts to curtail smoking rates.
Alcohol
Excessive alcohol consumption is a major risk factor for injury, chronic conditions, and premature death. It is estimated that in 2022–23, 31% of Australians aged 14 and over consumed alcohol in ways that put their health at risk, down from 39% in 2004 (AIHW, 2024h). Just under a quarter (24%) drank more than four drinks in a single day at least once a month which is above the recommended amount for safe drinking. Interestingly, people residing in the lowest socio-economic regions and the lowest quintile (27% of people in the lowest quintile) are less likely to engage in risky drinking than the general population. However, people living in remote and very remote areas were more likely to engage in risky drinking. It is estimated that in 2022–23, ‘… people aged 14 or over living in remote and very remote areas (40%) and outer regional areas (39%) are about 1.4 times more likely as those living in major cities (29%) to consume alcohol at risky levels’ (AIHW 2024h, 25).
Diet and obesity
Excessive eating of processed foods high in fat, salt, and/or sugar) is associated with obesity and a range of illnesses including heart disease, strokes, diabetes, and some cancers (Fox Reference Fox2024; Rauber et al Reference Rauber, Chang, Vamos, da Costa Louzada, Monteiro, Millett and Levy2021). Australia has one of the world’s highest rates of obesity and the obesity rate has tripled since 1980. Obesity or being overweight has been linked to 30 diseases and in 2024 overtook tobacco as the leading risk factor contributing to poor health in Australia (AIHW 2024i).
In 2022, 31.7% of Australian adults were obese, up from 18.6% in 1995 and 34% were overweight, down from 37.6% in 1995. One in four children was either overweight or obese (AIHW 2024i). Australia was ranked equal fourth in the OECD for the proportion of men who are obese and ninth for the proportion of women living with obesity. The proportion of adults overweight or obese (66%) in Australia is higher than the OECD average of 59% (AIHW 2024i).
Economic and cultural capital are key factors influencing people’s capacity to eat healthily
People with less money, less education, insecure working conditions and poor living conditions are more likely to experience food insecurity, and have higher levels of dietary-related diseases (Friel et al Reference Friel, Hattersley and Ford2015).
There are socio-economic and regional variations in rates of obesity. Thus, 68% of adults in lowest socio-economic areas were overweight or obese compared to 60% in the highest socio-economic areas (AIHW 2024j). There are also differences between First Nations people and the non-Indigenous population. In 2018–2019, 74% of First Nations adults and 38% of First Nations children were overweight or obese (AIHW 2024j). In many remote areas, fresh fruit and vegetables are either not available or very expensive, and food insecurity is a huge issue (Sheriff et al Reference Sheriff, Kalucy, Tong, Naqvi, Nixon, Eades, Ingram, Slater, Dickson, Lee and Muthaya2022). The health implications are devastating. In Northern Australia, First Nations people over 30 years of age have one of the highest rates of diabetes globally at approximately 40% compared to around 4.5% of Australians nationally (Australian Government 2024f). Kidney failure rates for Indigenous communities in remote and very remote areas are up to 20 times higher than the rate for non-Indigenous Australians (Australian Government 2024f).
Conclusion
It is apparent that significant health inequalities are a feature of contemporary Australia. Certainly, bulk billing by GPs, access to free healthcare in public hospitals, and the PBS have ensured that health inequality between high-income and low-income Australians is not extreme. However, it is still significant. The inequalities in the broader society are reflected in health statistics. As Marmot et al (Reference Marmot, Allen, Goldblatt, Boyce, McNeish, Grady and Geddes2010, 39) conclude, ‘the cumulative effects of hazards and disadvantage through life produce a finely graded social patterning of disease and health’. That there are still substantial inequalities in life expectancy between low-income and higher-income Australians is unconscionable. This is especially so in the case of the sizeable gap in life expectancy of Indigenous Australians compared to non-Indigenous Australians.
Alleviating health inequality will involve addressing social and economic inequality and poverty. Thus, a key aim of government policy should be to ensure that all individuals have access to adequate income and affordable, secure, and satisfactory housing thereby creating a platform for the capacity to live a healthy and decent life (see Sen 2001). People in the labour force need to be adequately remunerated. For those individuals reliant on government benefits, the benefit amount should allow for healthy living for the individual and their family. A major issue that needs to be addressed over time is the cost of accommodation. For a substantial proportion of the population, housing is their major expense and concern. Education is also key to good health. The life chances and health status of people who have had a poor education are usually reduced. The lessening of health inequalities will result not only in a healthier and fairer society but also in a more cohesive and productive society.


 Open access