





Introduction
Hydrothermal explosion craters are geological features that commonly occur in regions of intense hydrothermal activity (Muffler et al., Reference Muffler, White and Truesdell1971; Browne and Lawless, Reference Browne and Lawless2001; Montanaro et al., Reference Montanaro, Mick, Salas-Navarro, Caudron, Cronin, de Moor, Scheu, Stix and Strehlow2022). They provide valuable insights into subsurface hydrothermal conditions, including the phase of hydrothermal fluids, pressure, temperature (Thiéry and Mercury, Reference Thiéry and Mercury2009), and the degree of sealing in the hydrothermal reservoir (Browne, Reference Browne1978). The Yellowstone Plateau volcanic field (YPVF) (Fig. 1A) hosts one of the largest active hydrothermal systems in the world (Christiansen et al., Reference Christiansen, Lowenstern, Smith, Heasler, Morgan, Nathenson, Mastin, Muffler and Robinson2007; Morgan et al., Reference Morgan, Shanks and Pierce2009; Hurwitz and Lowenstern, Reference Hurwitz and Lowenstern2014). Hydrothermal explosion craters are dramatic landscape features, especially in the YPVF; however, there is an incomplete understanding of the mechanisms that trigger these explosions (Morgan et al., Reference Morgan, Shanks and Pierce2009). Hydrothermal explosions pose a considerable hazard due to their unpredictable onset as well as the boulders, hot mud, boiling water, and steam that are ejected during an explosion. These explosions mostly have no precursory signals. For example, a recent hydrothermal explosion at Black Diamond Pool in July 2024 at Biscuit Basin, Yellowstone National Park occurred without warning, ejecting rocks, mud, boiling water, and debris (Harrison et al., Reference Harrison, Poland, Reed, Sims and Hungerford2025). Despite increases in water turbidity and explosive activity since 2006 at Black Diamond Pool, there were no preceding or accompanying seismic signals detected on the Yellowstone Volcano Observatory’s network (the closest seismometer was ∼4 km away at Old Faithful; Harrison et al., Reference Harrison, Poland, Reed, Sims and Hungerford2025). While smaller hydrothermal explosions that create craters less than 4 m in diameter have historically been observed (Poland et al., Reference Poland, Iezzi, Farrell and Vaughan2025), explosions that create craters larger than this are less frequent and sometimes may occur in the backcountry or at night and are thus rarely observed (Christiansen et al., Reference Christiansen, Lowenstern, Smith, Heasler, Morgan, Nathenson, Mastin, Muffler and Robinson2007).
(A) Geologic map of Yellowstone National Park, situated within the Yellowstone Plateau volcanic field (YPVF). The map highlights major geologic units and their respective ages (detailed unit descriptions can be found in Churchill et al., Reference Churchill, Muffler and Robinson2021, and Koch et al., Reference Koch, Ramsey and Christiansen2011). The green star marks the location of Twin Buttes (UTA0015), a hydrothermal explosion crater. (B) Northern shore of Yellowstone Lake, showing Mary Bay, the largest documented hydrothermal explosion in the world. Sample sites are shown in red. (C) Pocket Basin crater, with sample locations indicated in red. All samples were collected from hydrothermal explosion deposits. Base elevation data from NASA JPL (Reference NASA2021); geologic map compilation from Churchill et al., Reference Churchill, Muffler and Robinson2021, and Koch et al., Reference Koch, Ramsey and Christiansen2011.

Hydrothermal explosions are caused by gradual pressure increase of liquid water and gas in a confined subsurface reservoir until that pressure exceeds the strength of the surrounding rocks. When the surrounding rocks break, liquid water flashes to steam. Explosions can be directly or indirectly triggered by earthquakes, deglaciation, outburst flooding, landslides, increases in non-condensable gas in the subsurface reservoirs, and overpressure rupturing of sealed subsurface caprocks—all of which can induce pressure drops (Browne and Lawless Reference Browne and Lawless2001; Morgan et al., Reference Morgan, Shanks and Pierce2009; Hurwitz et al., Reference Hurwitz, Clor, McCleskey, Nordstrom, Hunt and Evans2016; Montanaro et al., Reference Montanaro, Mick, Salas-Navarro, Caudron, Cronin, de Moor, Scheu, Stix and Strehlow2022). Identifying the specific trigger for a past hydrothermal explosion requires establishing temporal relations between large explosions and ages of potential triggers, such as the most recent deglaciation in the YPVF (Licciardi and Pierce, Reference Licciardi and Pierce2018).
However, dating these explosions has proven challenging for a variety of reasons, including a lack of dateable material, post-depositional reworking of sediments that alter the stratigraphy, and hydrothermal alteration, which can degrade signal characteristics in some geochronometers (Morgan et al., Reference Morgan, Shanks and Pierce2009). While many of these explosion craters have been mapped, few have been directly dated. Most current age estimates are based on geological context. All explosions are interpreted to be postglacial, because evidence of earlier explosions was erased by the last glaciation (Muffler et al., Reference Muffler, White and Truesdell1971; Christiansen et al., Reference Christiansen, Lowenstern, Smith, Heasler, Morgan, Nathenson, Mastin, Muffler and Robinson2007; Morgan et al., Reference Morgan, Shanks and Pierce2009).
Luminescence dating is a promising technique for dating these deposits. Prior to an explosion, hydrothermal fluids circulate through the subsurface, at temperatures of roughly 100–270°C within the uppermost 100 m of the surface (White et al., Reference White, Fournier, Muffler and Truesdell1975; Fournier, Reference Fournier1989; Hurwitz and Lowenstern, Reference Hurwitz and Lowenstern2014; King et al., Reference King, Hurwitz, Lowenstern, Nordstrom and McCleskey2016). This temperature is high enough that, over the span of thousands of years, all commonly measured luminescence signals should be continuously, thermally zeroed (Guralnik et al., Reference Guralnik, Ankjærgaard, Jain, Murray, Müller, Wälle and Lowick2015). During an explosion, sediments and boulders are ejected onto the ground surface to form debris fields and meter-high rims around the crater. This starts the luminescence dating clock, as the sediments are exposed to the atmosphere and instantaneously cool. The luminescence signals that were previously zeroed, because of hydrothermal heat exposure, begin to accumulate, registering time since the explosion. There may also be some degree of light exposure during or immediately after the explosion, although the duration of light exposure is likely small compared to the optical resetting timescales of some of the signals we investigated (e.g., pIRIR225 signal; Colarossi et al., Reference Colarossi, Duller, Roberts, Tooth and Lyons2015).
Here we investigate four independent luminescence dating methods applied to quartz (RTL, BTL, BLOSL) and K-feldspar (pIRIR225) grains isolated from hydrothermal explosion deposits in Lower Geyser Basin (Fig. 1A) and on the northern shore of Yellowstone Lake (Fig. 1B). Based on the data analyzed, RTL and pIRIR225 methods provide the best accuracy for dating hydrothermal explosions.
Study area: Yellowstone Plateau volcanic field
The study area is in the Yellowstone Plateau volcanic field (Fig.1A), which hosts the largest documented hydrothermal explosion crater in the world, Mary Bay (Morgan et al., Reference Morgan, Shanks and Pierce2009). The last major glaciation on the Yellowstone Plateau, the Pinedale glaciation, is dated at 14.4–22.0 ka, based on cosmogenic nuclide dating of marginal ice features, radiocarbon dating of postglacial lake sediments, and U-series dating of postglacial travertine (Licciardi and Pierce Reference Licciardi and Pierce2018; Harrison et al., Reference Harrison, Hurwitz and Paces2024). Unloading of the ice cap would have gradually decreased the overburden pressure, which would lead to enhanced boiling in subsurface reservoirs given the sustained high rates of heat flow. Deglaciation induced numerous changes across the YPVF landscapes, including isostatic adjustment, increased meltwater recharge into the subsurface, and the formation of glacially buttressed features. During deglaciation, hydrothermal explosions could be induced by depressurization during ice-cap thinning or by the draining of ice-dammed lakes (Muffler et al., Reference Muffler, White and Truesdell1971; Licciardi and Pierce Reference Licciardi and Pierce2018). However, it has also been inferred that the hydrothermal explosion at Mary Bay, the largest explosion crater on Earth, was triggered by an earthquake and tsunami (Morgan et al., Reference Morgan, Shanks, Pierce, Iverson, Schiller, Brown and Zahajska2022).
Twin Buttes
Twin Buttes is in Lower Geyser Basin and contains evidence of at least three hydrothermal explosion craters and a major landslide, which may be temporally related to these explosions (Morgan et al., Reference Morgan, Shanks and Pierce2009). The sample collected for this study is marked as a green star in Figure 1A. Twin Buttes encompasses several smaller craters that form a rough circular shape spanning ∼645 meters in circumference. Like other craters in Lower Geyser Basin, the Twin Buttes explosions have been considered as postglacial, based on stratigraphic interpretation of lake sediments and gravel cores from surrounding areas (Muffler et al., Reference Muffler, White and Truesdell1971; Morgan et al., Reference Morgan, Shanks and Pierce2009).
Mary Bay Crater
The Mary Bay explosion crater (Fig. 1B) is exposed within, and along the northern shore of Yellowstone Lake and has a diameter of approximately 2.8 km. The exposed crater rim rises roughly 5 meters above the modern lake level. Exposed sections of the crater reveal brecciated deposits composed of a fine-grained matrix containing hydrothermally altered lithic fragments (Morgan et al., Reference Morgan, Shanks and Pierce2009, Reference Morgan, Shanks, Pierce, Iverson, Schiller, Brown and Zahajska2022). Radiocarbon ages from beneath the Mary Bay explosion breccia deposit provide constraints on the timing of the explosion. Ash from Glacier Peak volcano in the northern Cascade Arc found below the Mary Bay explosion deposit has a reported radiocarbon age of 13,710–13,410 cal yr BP (Kuehn et al., Reference Kuehn, Froese, Carrara, Foit, Pearce and Rotheisler2009). Charcoal recovered from beneath the Mary Bay explosion breccia deposit places the explosion at ca. 13 ka BP (Pierce et al., Reference Pierce, Despain and Morgan2007; Morgan et al., Reference Morgan, Shanks and Pierce2009, Reference Morgan, Shanks, Pierce, Iverson, Schiller, Brown and Zahajska2022). Our sampling site within the Mary Bay crater (Fig. 1B) is also situated near an additional hydrothermal explosion crater, Turbid Lake. Radiocarbon dates from charcoal from below Turbid Lake deposits have a maximum age of 9365 ± 800 cal BP (Pierce et al., Reference Pierce, Despain, Whitlock, Cannon, Meyer, Morgan, Licciardi and Easterbrook2003; Morgan et al., Reference Morgan, Shanks and Pierce2009).
Pocket Basin
Pocket Basin in the Lower Geyser Basin (Fig. 1C) is one of the largest hydrothermal explosion craters in the YPVF (Muffler et al., Reference Muffler, White and Truesdell1971, Reference Muffler, White, Truesdell and Fournier1982). This crater has an asymmetrical rim (∼365 × 800 meters) that is intersected by the Firehole River. The explosion breccia includes a diverse assemblage of unsorted clastic rocks, including conglomerates, quartz sandstones, and silicified mudstones (Muffler et al., Reference Muffler, White and Truesdell1971). The crater and the surrounding landscape contain numerous active thermal features including geysers, mud pots, hot springs, and fumaroles (Churchill et al., Reference Churchill, Muffler and Robinson2021). The incision of the Firehole River through Pocket Basin, rather than through the surrounding lowlands, was used to suggest the presence of ice, implying that Pocket Basin explosion occurred sometime during or shortly after the last glaciation (Muffler et al., Reference Muffler, White and Truesdell1971).
Previous luminescence dating of volcanic deposits
Luminescence dating has been successfully applied in a range of volcanic settings. RTL emissions from quartz grains as they are heated is one commonly used signal in these settings. Miallier et al. (Reference Miallier, Faïn, Montret, Pilleyre, Sanzele and Soumana1991) conducted foundational work on the characterization of RTL properties in quartz extracted from pumice deposits, demonstrating its potential for extending the upper age limits of luminescence dating (Miallier et al., Reference Miallier, Faïn, Montret, Pilleyre, Sanzele and Soumana1991; Bösken and Schmidt, Reference Bösken and Schmidt2019). Subsequent studies by Fattahi and Stokes (Reference Fattahi and Stokes2000) further advanced this approach by applying RTL to quartz from ignimbrite formations. By incorporating the single-aliquot regenerative dose (SAR) protocol, they achieved age estimates consistent with independent estimates from 40Ar/39Ar and zircon fission track dating methods. Similarly, studies using RTL techniques on pyroclastic flow deposits from Toya Caldera in Japan showed age agreement between RTL and independent age estimates from quartz BTL and pollen analysis (Ganzawa et al., Reference Ganzawa, Furukawa, Hashimoto, Sanzelle, Miallier and Pilleyre2005). Additional research on maar eruptions in the Eifel Volcanic Field has highlighted the promise of RTL for dating volcanic quartz in these settings (Preusser et al., Reference Preusser, Rufer and Schreurs2011; Schmidt et al., Reference Schmidt, Tchouankoue, Nkouamen Nemzoue, Ayaba, Nformidah-Ndah and Chifu2017).
While RTL has proven effective, other luminescence techniques have shown limitations in volcanic contexts. For instance, Tsukamoto et al. (Reference Tsukamoto, Murray, Huot, Watanuki, Denby and Bøtter-Jensen2007) reported significant anomalous fading and thermal instability in OSL signals from volcanic quartz, preventing reliable age determination (see Bösken and Schmidt, Reference Bösken and Schmidt2019, for a comprehensive overview of luminescence applications to volcanic deposits). Due to lack of previous studies in dating hydrothermal explosion deposits using luminescence dating techniques, in this study we investigated four luminescence dating techniques: BLOSL, BTL, and RTL from quartz, and pIRIR225 from K-feldspar.
Methodology
Sample collection
All samples used in this study were collected from Yellowstone National Park. Except for samples collected from the Mary Bay site, all samples were collected by digging shallow pits into the hillside and retrieving sediments within metal tubes.
We sampled the Mary Bay event with two sediment samples collected from the northern shoreline of Yellowstone Lake (Fig. 1B; Table 1). Samples were retrieved from the Mary Bay hydrothermal explosion breccia 3 meters below the top of exposed shoreline sections (Fig. 2; Table 1). Although much of this deposit lies within Yellowstone Lake, portions of the stratigraphic sequence are exposed along the shoreline of the lake (Fig. S1). The shoreline exposure of Mary Bay has two additional hydrothermal explosion deposits visible, Turbid Lake and Indian Pond. These breccias are separated by thin lake sediments, and storm-wave erosion has produced an exposed stratigraphic section encompassing all three deposits (Fig. 2). The Mary Bay breccia forms the basal unit of this exposed sequence (Fig. S1).
Photograph of the northern shoreline of Yellowstone Lake, showing a naturally exposed stratigraphic section of explosion deposits from the Mary Bay, Turbid Lake, and Indian Pond explosions. This is the sampling location of UTA0320 retrieved from Mary Bay breccia. The unit has 127 cm exposed, and the sample was retrieved 90 cm from the top of the Mary Bay unit and 3 m from the top of the stratigraphic section. Larger numbers on exposed tape measure indicate inches. Photographed by K. Cordero, University of Texas at Arlington. Photo taken under NPS research permit YELL-2023-SCI-5052.

Dosimetric and equivalent dose information for K-feldspar post-infrared infrared stimulated luminescence (pIRIR225) and quartz red thermoluminescence (RTL) measurements.

1 RTL not measured for this sample.
Elemental concentrations are assumed to have a 5% analytical error. Geologic dose rate calculations were performed using the dose rate and age calculator (DRAC) (Durcan et al. Reference Durcan, King and Duller2015).
All errors are reported as 1σ uncertainties.
One hydrothermal explosion breccia sample is reported from the explosion crater rim at Twin Buttes, UTA0015 (Fig. 1A; Table 1). Although more samples were originally collected at this site, the complexity of the geologic context for this site prompted us to focus more on the Mary Bay and Pocket Basin samples.
Twelve sediment samples from Pocket Basin hydrothermal explosion breccia deposits are reported along several transects within the crater (Fig. 1C; Table 1). Starting from the west rim and extending to the east, samples were taken from the crater’s slopes and divided into three sections: top, middle, and bottom (Fig. 1C). This approach allowed us to assess whether the ages and characteristics of the sediments varied spatially, both laterally and vertically. Areas exhibiting evidence of recent hydrothermal activity were excluded to avoid post-depositional signal resetting by heat exposure. Hydrothermal alteration is evinced by unvegetated, light-tan sediments, which contrast with the vegetated hillslopes surrounding the crater (Fig. S2). Areas with signs of significant animal activity, particularly from bison herds, were avoided to minimize sediment disturbance from overturning and bioturbation.
Sample preparation
Sediment samples were processed at the University of Texas at Arlington Luminescence Laboratory. Under dim amber lighting conditions, the outer 3 cm of sediments were removed from both ends of the sampling tubes to separate any grains that may have been exposed to light during sample retrieval. The outer subsamples were oven dried to determine water content and then sent to SGS Canada for elemental analysis using inductively coupled plasma mass spectrometry (ICP-MS) and optical emission spectroscopy (ICP-OES). Resulting concentrations of U, Th, and K are shown in Table 1.
The remaining interior portions of the samples were placed in a 5% sodium hexametaphosphate solution and stirred with a magnetic stir bar for 10 minutes to deflocculate clay particles and remove magnetic mineral grains. The samples were then wet sieved to isolate 150- to 200-μm grains. K-feldspar and quartz grains were separated using heavy liquid density separation. A lithium metatungstate and deionized water solution with a specific density of 2.565 g/cm3 was used for K-feldspar separation, targeting the most potassic grains (Rhodes, Reference Rhodes2015). Additional heavy liquid separations at densities of 2.62 and 2.68 g/cm3 were performed to separate quartz from the bulk sediments. The quartz grains were etched with a 40% hydrofluoric (HF) acid solution for 40 minutes to preferentially digest non-quartz phases. Samples were then treated with concentrated hydrochloric (HCl) acid to remove any precipitates formed during HF digestion.
Instrumentation and measurements
Infrared stimulated luminescence (IRSL), optically stimulated luminescence (OSL), and thermoluminescence (TL) measurements were performed using a TL/OSL-DA-20 Risø automated luminescence reader equipped with a 90Sr beta source. For all measurements, grains were mounted as a 3-mm-diameter monolayer on aluminum (IRSL and BLOSL) and steel (TL) discs. IRSL measurements were detected through BG3–BG39 blue-pass filter. BLOSL measurements were detected through a U-340 UV-pass filter. BTL measurements were conducted in a nitrogen environment and detected through the BG3–BG39 filter pack. RTL measurements were made in a nitrogen environment and detected through a Schott KG3 short pass (< 875 nm) filter and an Edmund Optics bandpass filter centered at 625 nm with full-width half maximum tolerance of 25 nm. All emissions were detected with a blue-/UV-sensitive PDM9107Q photomultiplier tube.
Results
In the following sections, we assess several dating protocols for these sediments: K-feldspar pIRIR225, quartz BLOSL, quartz BTL, and quartz RTL. Then we report depositional ages using K-feldspar pIRIR225 and quartz RTL, the two signals that provided the best results.
Signal testing
K-feldspar pIRIR225
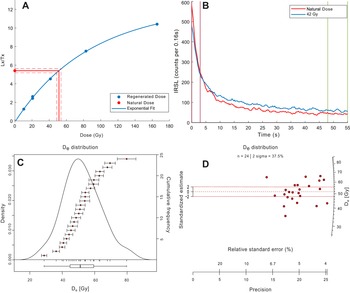
K-feldspar grains were measured using a SAR pIRIR225 protocol (Buylaert et al., Reference Buylaert, Murray, Thomsen and Jain2009). Following natural or regenerative doses, aliquots were preheated at 250°C for 10 s. Next, aliquots were stimulated with IR LEDs at 50°C for 60 s. Then, discs were stimulated with IR LEDs at 225°C for 60 s. These steps were repeated for the test-dose response, with a cutheat of 250°C. Finally, at the end of each SAR cycle, discs underwent a hot bleach at 290°C for 60 s with IR LEDs (see Fig. 3A for typical signal characteristics and dose distribution). This sample, UTA0015, yielded an overdispersion of 22.7% (Fig. 3A), consistent with a single-dose population (Arnold and Roberts, Reference Arnold and Roberts2009). The regenerative and natural shinedown curves are similar in shape and have high signal-to-noise ratios (Fig. 3B).
K-feldspar post-infrared infrared stimulated luminescence (pIRIR225) signal characteristics from sample UTA0015. (A) Dose response points were fitted with a single saturating exponential plus linear function and gave an aliquot equivalent dose (De) value of 51.40 ± 2.42 Gy. (B) pIRIR225 shinedown curves are shown in response to natural and 82.8-Gy regenerative doses. Integration limits; signal 0–3 s; background 48–55 s. (C) Kernel density estimate plot of 24 3-mm-mask aliquots. (D) Radial plot of equivalent dose values displays a distribution consistent with a single-dose population.

We tested for signal fading on multiple discs per sample (n = 4 for UTA0026 and UTA0027; n = 24 for UTA0013), that were previously measured for equivalent dose. Samples were irradiated, preheated, and then kept dark at room temperature for effective fading durations ranging from 484 s to ca. 3 days. Fading data were plotted on a logarithmic x-axis and fitted with a weighted fit line to estimate g-values and uncertainties (Huntley and Lamothe, Reference Huntley and Lamothe2001). Measured g-values were 6.43 ± 0.94% loss per decade for sample UTA0013 from Twin Buttes, 2.30 ± 1.76% loss per decade for samples UTA0026 and UTA0027 from Pocket Basin, and no fading was observed for samples UTA0320 and UTA0322 from Mary Bay. The differing fading characteristics are likely attributable to variations in sample composition, degrees of weathering, hydrothermal alteration, or a combination of these factors at each sampling site (Fig. S3).
Quartz BLOSL
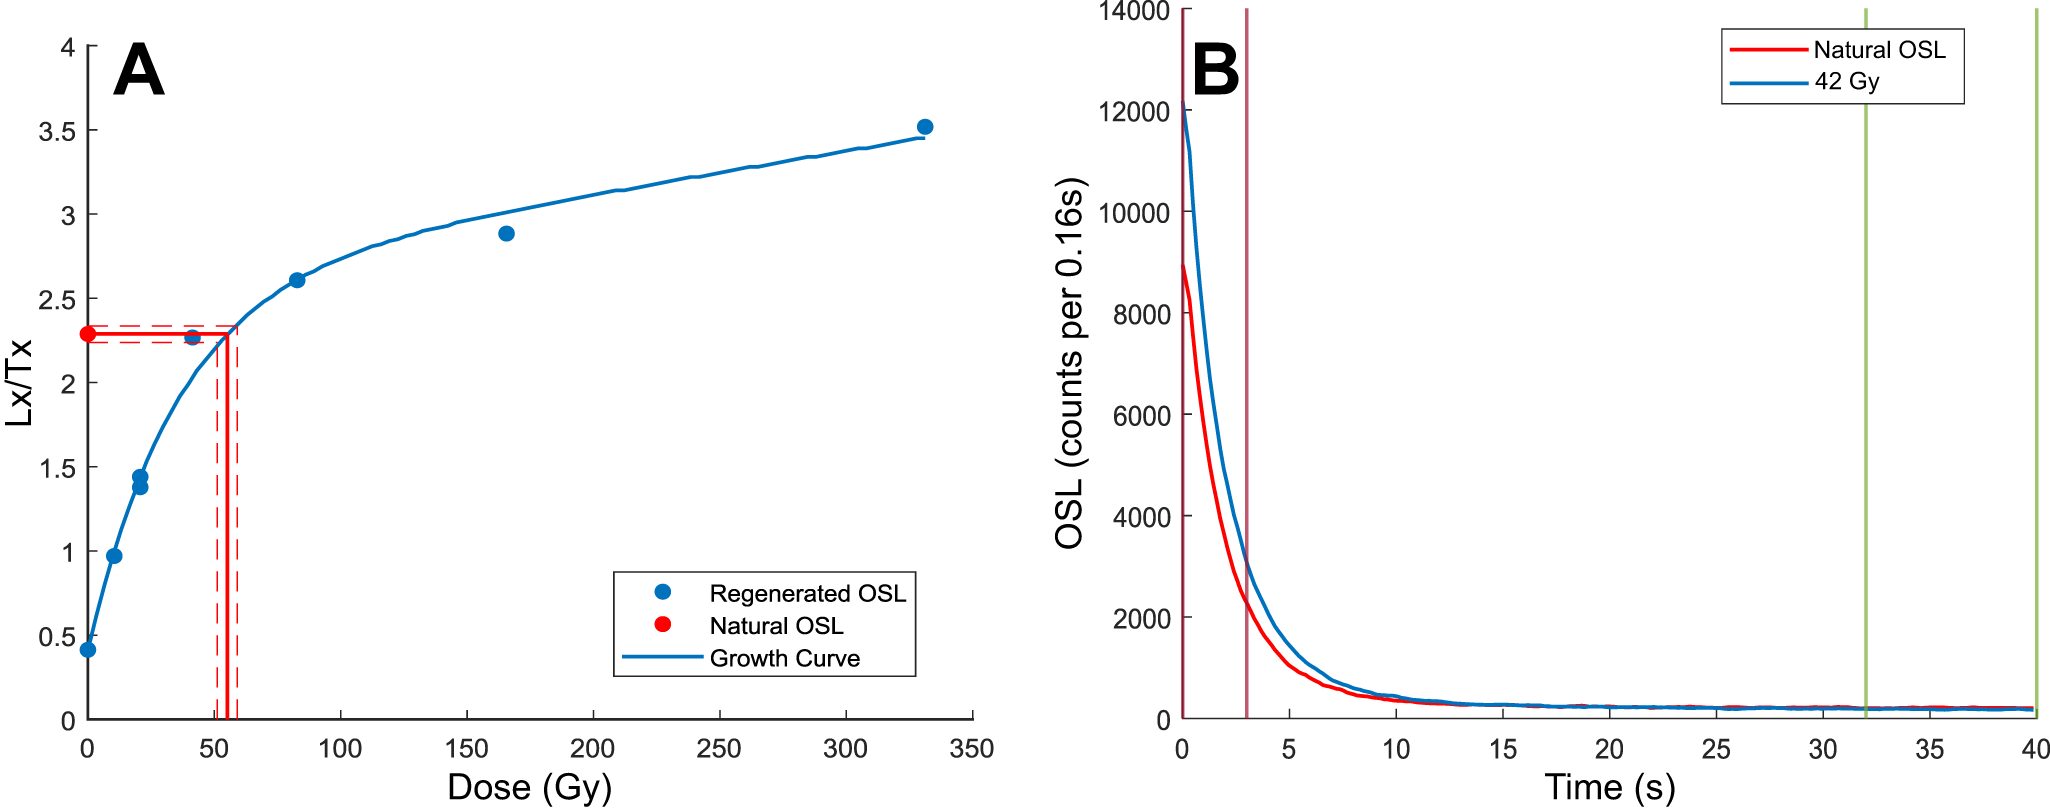
Quartz BLOSL measurements were conducted using a SAR protocol. Following natural or regenerative doses, aliquots were preheated at 220°C for 10 s. Next, aliquots were stimulated with IR LEDs at 60°C for 40 s to minimize signal contamination from non-quartz phases. Then, discs were stimulated with blue LEDs at 125°C for 40 s. These steps were repeated for the test-dose response, but with a cutheat of 200°C. Finally, at the end of each SAR cycle, discs underwent a hot bleach at 220°C for 60 s with blue LEDs. The resulting dose response data showed high recuperation values of 37 ± 1% and recycling ratios ranging from 0.96 ± 0.03 to 1.26 ± 0.04 (Fig. 4A). Overdispersion for sample UTA0015 (n = 24) was 43%, higher than expected for a single-dose population (Arnold and Roberts, Reference Arnold and Roberts2009). Natural and regenerative shinedown curves had high signal-to-noise ratios (Fig. 4B).
Quartz blue light optically stimulated luminescence (BLOSL) signal characteristics from UTA0015. (A) Single aliquot regenerative dose response points were fitted with a single saturating exponential plus linear function to estimate a De value of 18.70 ± 1.70 Gy. (B) BLOSL shinedown curves in response to the geologic dose (red) and a regenerative dose of 42 Gy (blue).

To investigate the BLOSL signal further, we measured the linearly modulated OSL (LM-OSL) signal from the same sample to assess whether the fast component is dominant (Bulur, Reference Bulur1996). For the LM-OSL protocol, samples (n = 6) were given a dose and preheated to 220°C for 10 s. Discs were then stimulated for 1000 s at 125°C for 0–90% LED power (72mW/cm2). This was followed by a cutheat of 220°C for 10 s and another identical LM-OSL step to monitor the test-dose response. This was followed by a hot bleach at 250°C with blue LEDs at 90% power for 40 s. The LM-OSL measurements were fitted using the algorithm of Singarayer (Reference Singarayer2002) by first solving for the optimal photoionization cross-section (PIC) values of each component and then estimating the relative abundance of each. For sample UTA0015, the measured curve was fit with six components with the following PIC values and our interpretation of the corresponding BLOSL component (Jain et al., Reference Jain, Murray and Bøtter-Jensen2003): 6.69×10⁻²¹ (slow 4), 5.07×10⁻¹⁹ (slow 2), 3.28×10⁻¹⁸ (medium), 1.99×10⁻¹⁷ (fast), 1.07×10⁻¹⁶ (ultrafast), and 4.90×10⁻¹⁵ (unnamed) cm2. The results show a bulk quartz signal that is not dominated by the fast component, which is the dosimetric trap ordinarily targeted with BLOSL methods (Murray et al., Reference Murray, Arnold, Buylaert, Guérin, Qin, Singhvi, Smedley and Thomsen2021). Instead, the signal is primarily dominated by the medium component in the beginning and the slow-4 component at the end (Fig. 5), making BLOSL unsuitable for age estimation.
Linearly modulated optically stimulated luminescence (LM-OSL) plot of UTA0015. LM-OSL curve is fitted to six signal components, with the corresponding photoionization cross-sections (PIC) shown. The measured curve was fit with six components with the following PIC values and our interpretation of the corresponding BLOSL component (Jain et al., Reference Jain, Murray and Bøtter-Jensen2003): 6.69×10⁻²¹ (slow 4), 5.07×10⁻¹⁹ (slow 2), 3.28×10⁻¹⁸ (medium), 1.99×10⁻¹⁷ (fast), 1.07×10⁻¹⁶ (ultrafast), and 4.90×10⁻¹⁵ (unnamed) cm2. The fast component, which is the desirable dosimetric signal in BLOSL, does not dominate the early signal. Rather the medium and slow-4 components are more prominent.

Quartz BTL
Quartz BTL emissions were measured using a SAR protocol. Following a natural or regenerative dose, discs were preheated to 180°C for 10 s, then BTL glow curves were measured at a heating rate of 1.0°C/s up to 450°C. Another glow curve was then measured to subtract out the thermal background. These steps were repeated for the test-dose response.
The natural BTL glow curve exhibits a markedly different shape compared to the regenerative curves (Fig. 6). The natural signal plateaus around 210–220°C, whereas the regenerative signal’s dominant peak is centered at 190°C. Additionally, the natural signal features a rising temperature limb beyond 250°C, while the regenerative signal presents a descending high-temperature shoulder. This dissimilarity in shape suggests that the traps dominating the natural signals are different than those in the regenerative glow curves, and therefore equivalent dose estimation with this protocol would be unreliable.
Blue thermoluminescence (BTL) glow curve following a heating rate of 1.0°C/s. The natural signal (red) exhibits a narrow plateau around 210–220°C followed by a rising temperature limb past 250°C. By contrast, the regenerative glow curves exhibit a peak centered around 190°C (slightly higher than the preheat temperature of 180°C) and a falling high temperature limb. An additional peak emerges at temperatures centered around 250°C. The dissimilarity in shape between natural and regenerative glow curves suggests different trap populations are dominant between natural and laboratory curves, which is problematic for estimating equivalent dose.

Quartz RTL
Quartz RTL emissions were measured with the same SAR protocol used for BTL. The natural and regenerative glow curves display similar shapes, with a dominant peak around 320–340°C for the regenerative curves and a broad peak around 330–360°C for the natural curve (Fig. 7A). An equivalent dose plateau is seen in the temperature range of 250–320°C, and the growth curve was measured from the temperature range of 300–310°C (Fig. 7B). At lower doses (< 45 Gy), dose response growth was often superlinear (Fig. 7B), and therefore data were fit to order 2 polynomials to estimate equivalent dose. Therefore, reported equivalent dose errors for each RTL aliquot include uncertainty from curve fitting as well as the scatter of mean values within the range of 300–310°C.
(A) Red thermoluminescence (RTL) glow curve produced by heating at a rate of 1.0°C/s. The natural glow curve has a narrow plateau around 330–360°C and the regenerative glow curves exhibit a peak centered around 320–340°C. (B) Single aliquot regenerative dose response results corresponding to a glow curve temperature of 300–310°C. Dose response points were fitted with a second-order polynomial, due to the superlinear growth at low doses, yielding a De value of 65.64 ± 3.35 Gy for this aliquot.

Comparing signal performance
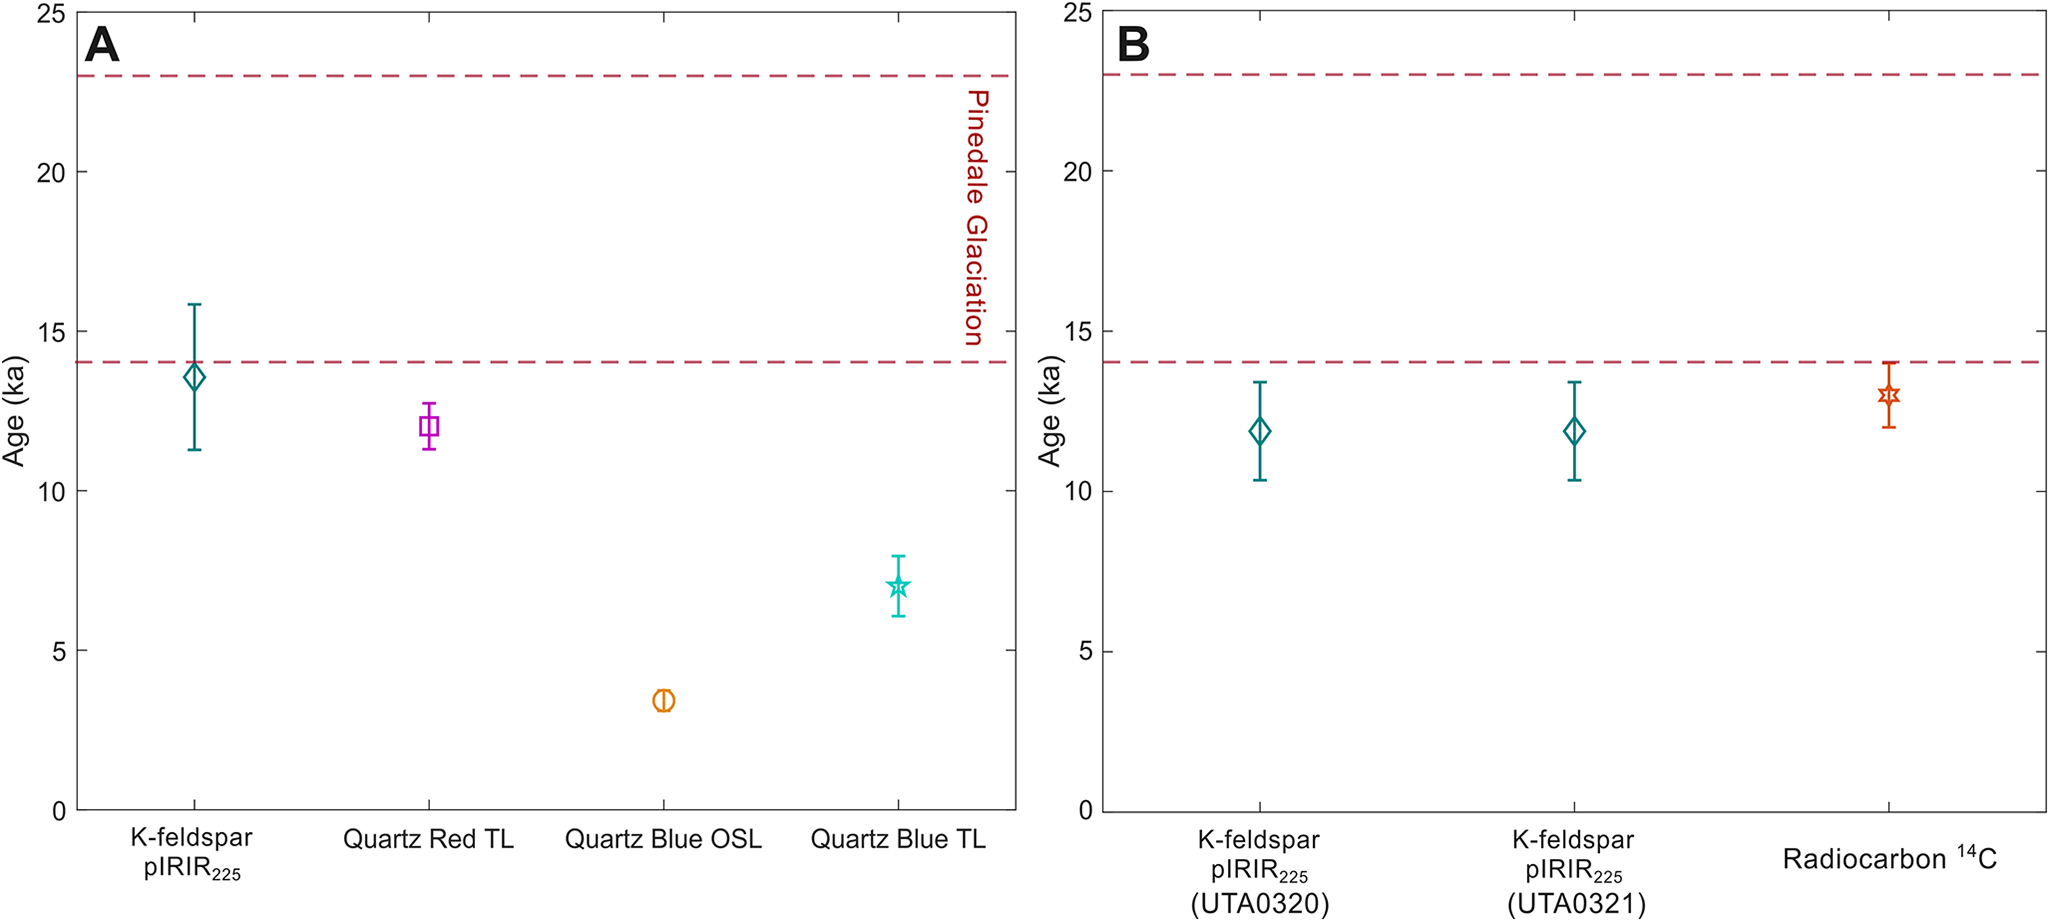
Sample UTA0015 was used to compare the signal performance of all four techniques. The K-feldspar pIRIR225 signal gave a fading-corrected age of 13.56 ± 2.28 ka (Table 2). Fading correction was performed using the R Luminescence package (Kreutzer et al., Reference Kreutzer, Schmidt, Fuchs, Dietze, Fischer. and Fuchs2012) using the measured g-value of 6.43 ± 0.94% loss per decade. It is noted that this g-value is relatively high for a pIRIR225 protocol, and this elevated fading rate is probably due the volcanic provenance of these feldspars (Guérin and Visocekas, Reference Guérin and Visocekas2015). The BLOSL protocol gave an apparent age of 3.42 ± 0.32 ka (Fig. 8A), and the BTL and RTL protocols gave apparent ages of 7.00 ± 0.94 ka and 12.02 ± 0.72 ka, respectively (Fig. 8A). In addition to yielding mutually consistent apparent ages at 1σ, the pIRIR225 and the RTL measurements both yielded overdispersion values consistent with a single-dose population (23% and 0%, respectively), gave high signal-to-noise ratios, and the RTL results exhibited an equivalent dose plateau from 250–320°C. The BLOSL and BTL displayed low-quality signal characteristics such as high recuperation (37 ± 1%; BLOSL), high overdispersion (43%), no dominant fast component (BLOSL), and high thermal background (BTL). These protocols also gave discordant ages with pIRIR225 and RTL, which are in better general agreement with the geological evidence of the area that suggests this explosion was a directly post-glacial event (Muffler et al., Reference Muffler, White and Truesdell1971). The combination of pIRIR225 and RTL measurements are therefore used for the remaining age estimates.
(A) Results from the four tested luminescence techniques from sample UTA0015. Red horizontal dashed lines represent the age of the Pinedale Glaciation across the YPVF (Licciardi and Pierce, Reference Licciardi and Pierce2018). (B) K-feldspar post-infrared infrared stimulated luminescence (pIRIR225) ages of two samples from Mary Bay sediments compared with published radiocarbon ages from charcoal, ash, and insect fragments from below the Mary Bay explosion breccia (Pierce et al., Reference Pierce, Despain and Morgan2007; Kuehn et al., Reference Kuehn, Froese, Carrara, Foit, Pearce and Rotheisler2009; Morgan et al., Reference Morgan, Shanks and Pierce2009). All errors are reported as 1σ uncertainties.

K-feldspar post-infrared infrared stimulated luminescence (pIRIR225) and quartz red thermoluminescence (RTL) ages, overdispersion, and accepted discs.

a values were corrected using g value = 6.43 ± 0.94 % loss per decade.
b values were corrected using g value = 2.30 ± 1.76 % loss per decade.
All errors are reported as 1σ uncertainties.
Dose recovery test
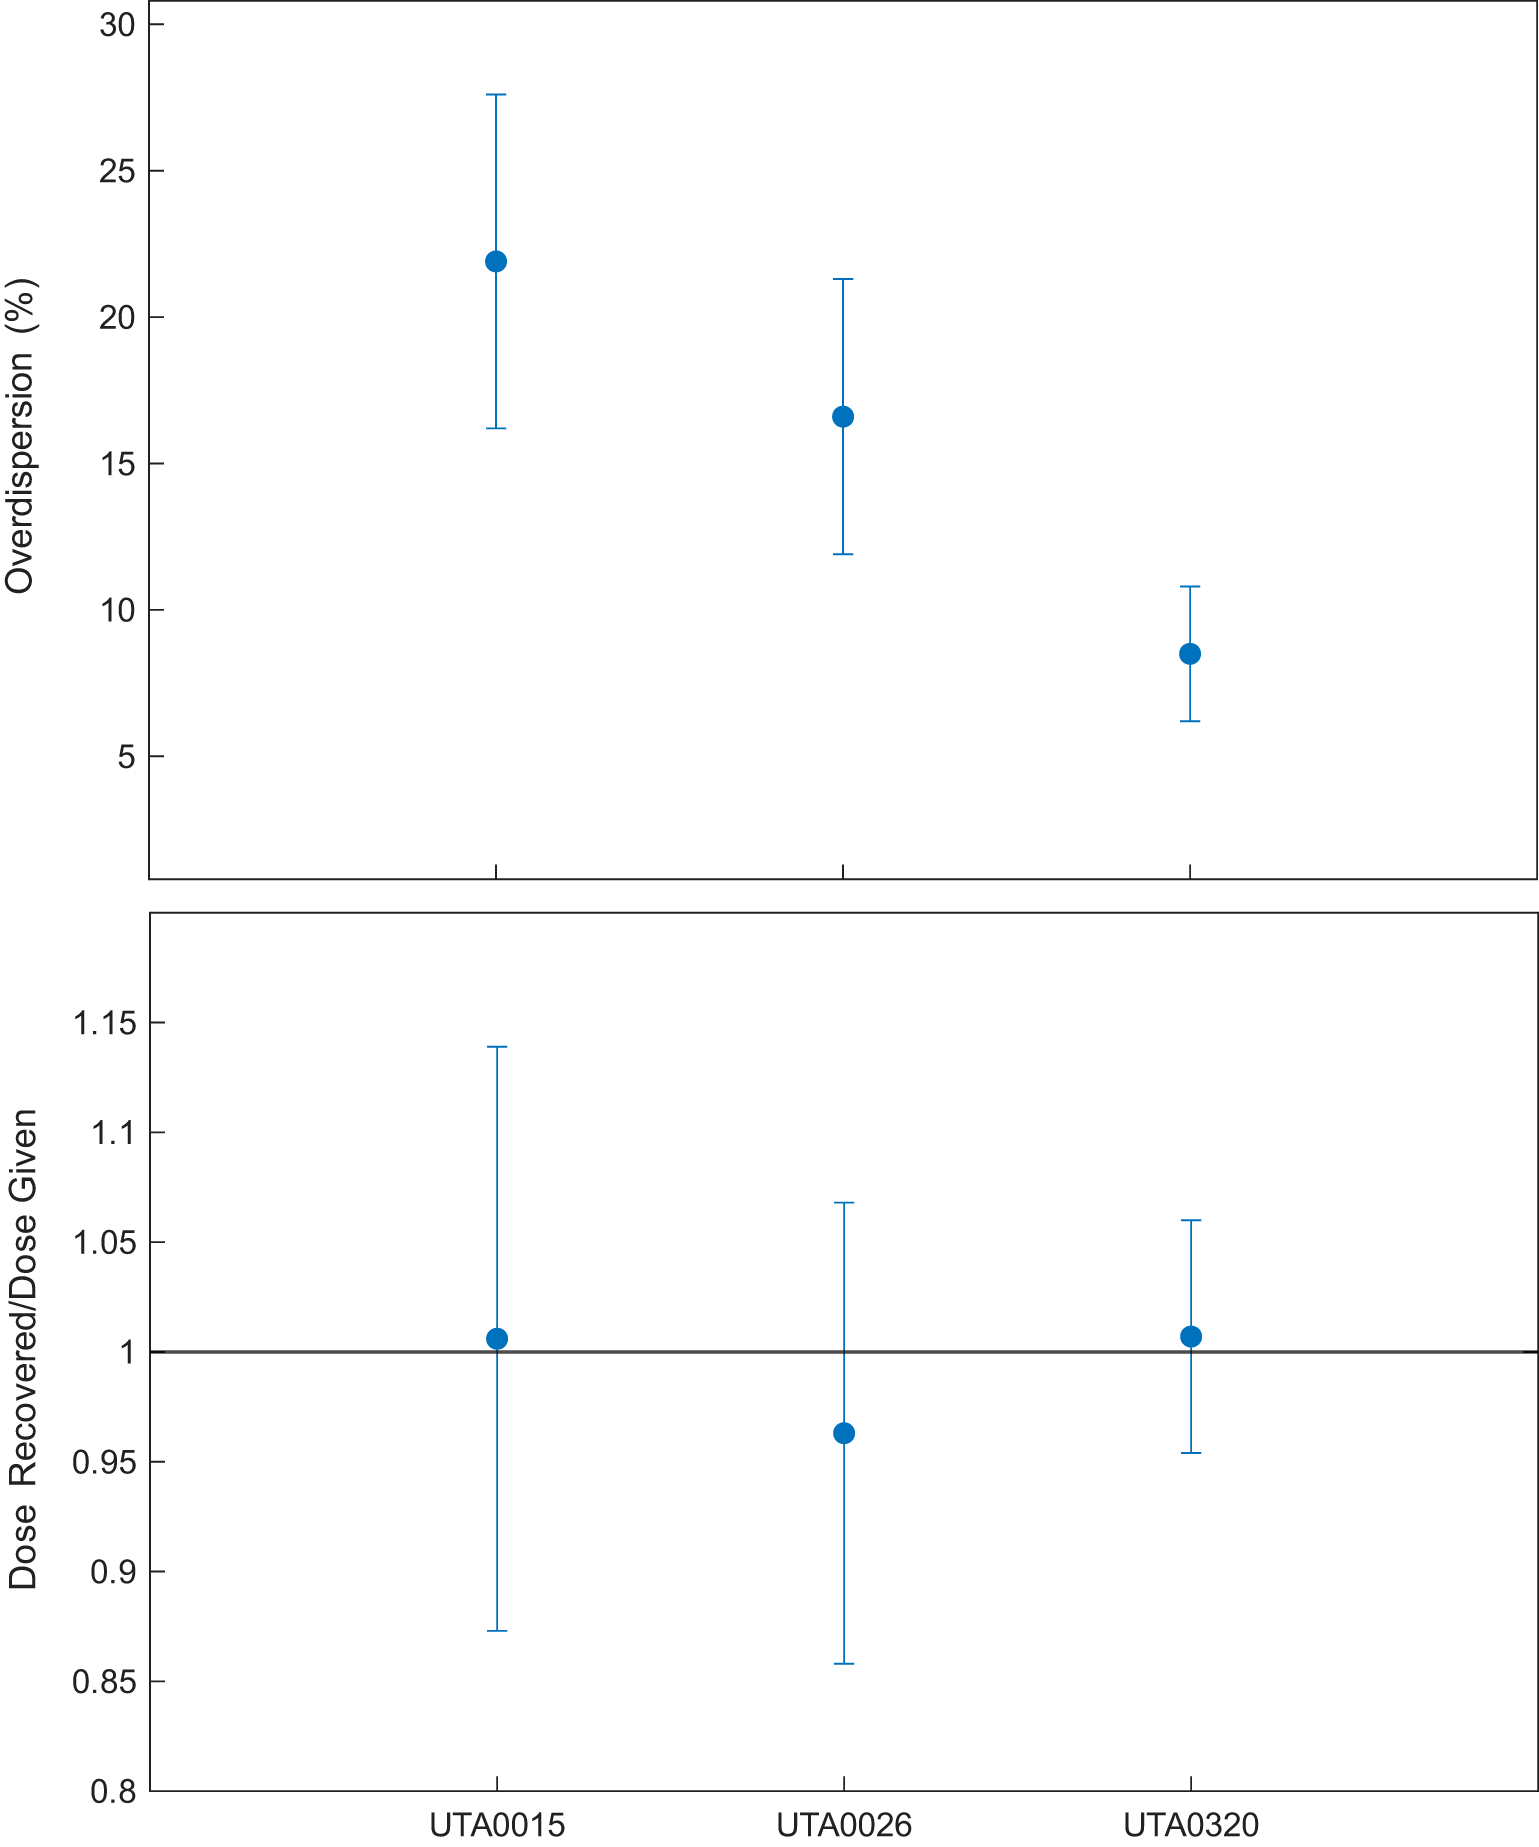
To test the performance of these pIRIR225 and RTL protocols, a thermal dose recovery test was performed. For the pIRIR225 dose recovery test, three samples (n = 6 per sample), one from each hydrothermal explosion site (UTA0015, UTA0026, and UTA0320) were heated to 500°C for 10 s to thermally deplete the natural signal, then given doses similar to the estimated equivalent doses (60 Gy, 60 Gy, and 50 Gy, respectively). The samples were then measured using the pIRIR225 protocol. The doses recovered were 60.09 ± 7.98 Gy (overdispersion of 22%), 57.51 ± 6.01 Gy (overdispersion of 32%), and 50.60 ± 2.66 Gy (overdispersion of 14%), respectively, indicating good recovery (Fig. 9).
Dose recovery test for three samples (n = 6 per sample) from all three hydrothermal explosion sites (UTA0015, UTA0026, and UTA0320). Samples were heated to 500°C for 10 s to deplete the natural signal. Discs were then given doses of 60 Gy, 60 Gy, and 50 Gy, respectively, and the doses were estimated using the same protocols used for equivalent dose determinations. The doses recovered were 60.09 ± 7.98 Gy (overdispersion of 22%), 57.51 ± 6.01 Gy (overdispersion of 17%), and 50.60 ± 2.66 Gy (overdispersion of 8%), respectively. All recovered doses are within 1σ error of given doses, indicating good protocol performance.

We also performed an RTL dose recovery test. Sample UTA0015 was also heated to 500°C, then given doses similar to the estimated equivalent dose (66 Gy) and measured with the RTL protocol. The resulting dose recovered when using the central dose model was 82.40 ± 6.44 Gy (overdispersion of 13%). The three-parameter minimum dose model recovered a dose of 68.59 ± 10.06 Gy (overdispersion of 0%). This elevated ratio from the central dose model may be due to thermal transfer. However, good agreement between pIRIR225 and RTL ages without any systematic offset indicates that any residual dose in the RTL equivalent dose estimation is negligible compared to reported errors (Fig. 10).
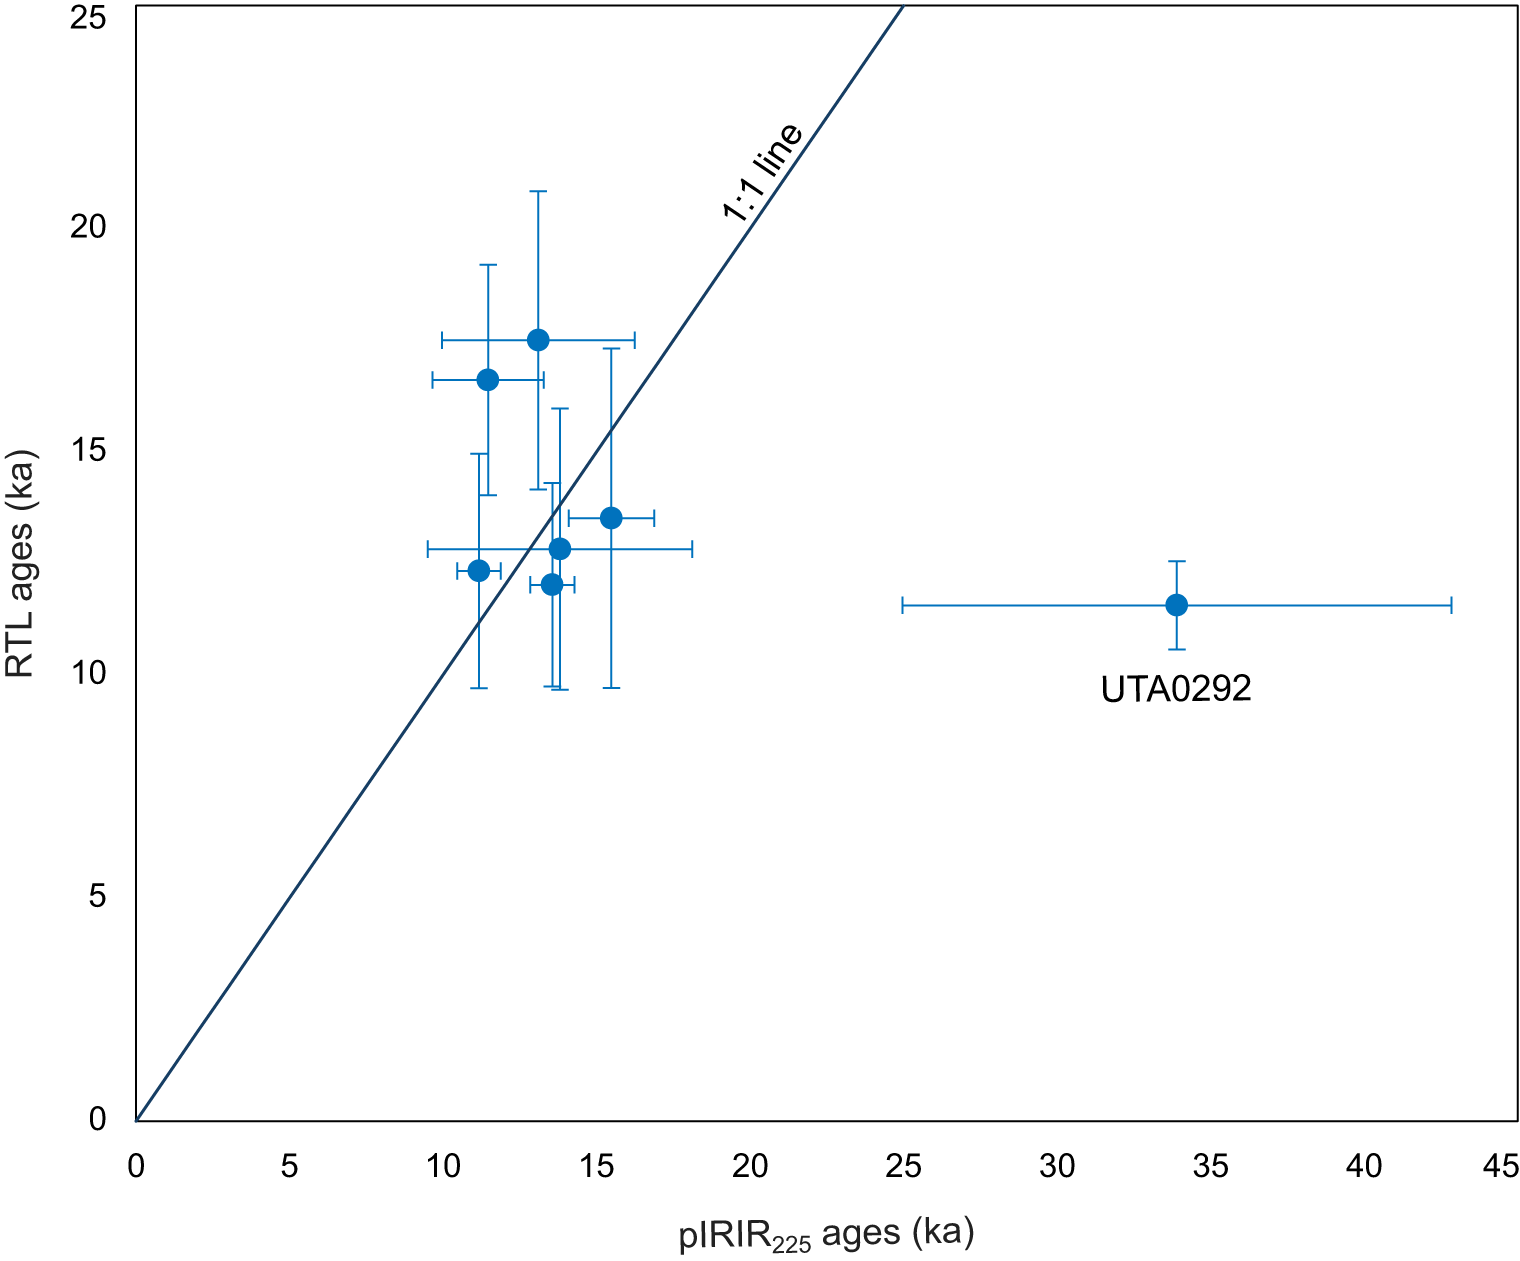
All K-feldspar post-infrared infrared stimulated luminescence (pIRIR225) and quartz red thermoluminescence (RTL) ages are compared. The two techniques show good correspondence, excluding sample UTA0292, which was likely exposed to post-depositional hydrothermal alteration. All errors are reported as 1σ uncertainties.

Sediment dating results with K-feldspar pIRIR225 and quartz RTL
Twin Buttes
Sample UTA0015 from Twin Buttes was dated using K-feldspar pIRIR225 and RTL (Table 2). The central age model was used, which gave a pIRIR225 (corrected for fading) age of 13.56 ± 2.28 ka (overdispersion of 23%) and RTL age of 12.02 ± 0.72 ka (overdispersion of 0%; Table 2).
Mary Bay Crater
Two samples were retrieved from the north shoreline of Yellowstone Lake, within the Mary Bay crater (Fig. 2). Samples UTA0320 and UTA0322 gave pIRIR225 ages of 11.97 ± 0.70 ka and 12.27 ± 2.58 ka, respectively (Table 2). These pIRIR225 ages are consistent with published radiocarbon ages from the same unit, estimated to be ca. 13 ka (Pierce et al., Reference Pierce, Despain, Whitlock, Cannon, Meyer, Morgan, Licciardi and Easterbrook2003; Morgan et al., Reference Morgan, Shanks and Pierce2009). The RTL signal from samples UTA0320 and UTA0322 were measured, but the natural signal is of the same magnitude as the thermal background and the equivalent dose could not be determined, resulting in no RTL ages for the Mary Bay explosion.
Pocket Basin
Twelve sediment samples from Pocket Basin were dated using K-feldspar pIRIR225 and quartz RTL techniques (Table 2). For samples measured using the pIRIR225 protocol, the central age model was used for samples that gave overdispersion values of 0.0–34.7%. The three-parameter minimum age model was used for sample UTA0290, which had an overdispersion value of 35% (Galbraith et al., Reference Galbraith, Roberts, Laslett, Yoshida and Olley1999; Arnold and Roberts, Reference Arnold and Roberts2009). Single aliquots were rejected based on three criteria: (1) the signal was saturated, (2) the natural signal exceeded the highest dose point, or (3) the associated errors were of similar magnitude to the equivalent dose. There are three general groups of pIRIR225 ages for the Pocket Basin samples < 4.5 ka (n = 2), 13.44 ± 1.06 ka (n = 9), and 33.90 ± 8.94 ka (n = 1) (Table 2).
Six of the twelve collected samples were analyzed using RTL (Table 1). The remaining RTL samples were not analyzed due to limited material availability and the time required to complete each RTL measurement: 3.5 days of measurement time required for each equivalent dose experiment (n = 12). Of the six RTL results (samples UTA0026, UTA0027, UTA0290, UTA0292, UTA0293, and UTA0300), all but one (UTA0292) are within 1σ of their respective pIRIR225 ages (Table 2).
Discussion
We compared age estimates from all four methods alongside the timing of the Pinedale deglaciation (Licciardi and Pierce, Reference Licciardi and Pierce2018) for sample UTA0015 from Twin Buttes (Fig. 8A). Both K-feldspar pIRIR225 and quartz RTL methods produced ages (13.56 ± 2.28 ka and 12.02 ± 0.72 ka, respectively) that overlap within 1σ and immediately postdate Pinedale Glaciation. All samples from Pocket Basin have overlapping pIRIR225 and RTL ages at 1σ, excluding sample UTA0292, which gives pIRIR225 and RTL ages of 33.90 ± 8.94 ka and 11.56 ± 0.99 ka, respectively. However, UTA0292, which has a distinct elemental composition compared to the rest of the samples from Pocket Basin (Fig. S4), was collected near an area with visual indicators of recent hydrothermal alteration (Fig. S2). Interestingly, the RTL age for this sample aligns with the remainder of the samples from Pocket Basin (Table 2), possibly indicating that the K-feldspar pIRIR225 signal has been adversely affected by post-depositional alteration whereas quartz RTL has not. Both pIRIR225 results from the Mary Bay explosion deposit are within 1σ and consistent with the existing radiocarbon age of ca. 13 ka (Fig. 8B; Morgan et al., Reference Morgan, Shanks, Pierce, Iverson, Schiller, Brown and Zahajska2022).
Samples from Pocket Basin crater cluster in three age groups for the K-feldspar pIRIR225 protocol: < 4.5 ka (n = 2), 13.44 ± 1.06 ka (n = 9), and 33.90 ± 8.94 ka (n = 1) (Table 2). The two samples from the first group have anomalously young ages, which we attribute to two different, recent resetting mechanisms. Sample UTA0028 is located at the bottom of a hillslope and likely represents slope wash that was re-exposed to sunlight when it was remobilized, resulting in an age of 1.77 ± 0.36 ka. By comparison, sample UTA0291 is located near the crest of the crater and has an age of 4.15 ± 0.97 ka, which we attribute to recent hydrothermal alteration. Evidence of alteration was observed near this site (Fig. S2). Efforts were made to avoid such areas during sampling; however, the subsurface extent of these hydrothermal features is unknown. An age of 33.90 ± 8.94 ka for sample UTA0292 is unreliable and inconsistent with glacial history in the YPVF. One proposed mechanism for the explosion at this site involves drainage of an ice-dammed lake, which may have reduced overburden pressure on the underlying hydrothermal system, triggering the explosive event (Muffler et al., Reference Muffler, White and Truesdell1971). Combined, pIRIR225 and RTL ages of the Pocket Basin crater breccia give a weighted mean age of 12.89 ± 0.45 ka (Table 2), consistent with the hypothesis that these explosions were triggered by Pinedale deglaciation (Muffler et al., Reference Muffler, White and Truesdell1971).
Dose rate disequilibrium
Our geologic dose rate calculations use inductively coupled plasma mass spectrometry (ICP-MS) and ICP optical emission spectroscopy to quantify the concentration of elemental U, Th, K, and Rb. This assumes secular equilibrium, meaning all daughter products have activity equal to the parent. In some geologic contexts, this assumption fails, especially in areas of intense weathering (Olley et al., Reference Olley, Murray and Roberts1996). Samples from Pocket Basin have experienced some degree of chemical alteration, as seen in the geochemical markers (Fig. S3, S5), presumably due to hydrothermal fluid exposure. What is unknown is the extent to which this hydrothermal fluid alteration was pre- or post-explosion.
This effect is usually restricted to the 238U decay chain. Its disequilibrium rarely exceeds 50% and is typically less than 20% (Olley et al., Reference Olley, Murray and Roberts1996). For the samples we report here, the portion of geologic dose rate assumed based on elemental U concentrations is 22 ± 6%, with a maximum value for sample UTA0292 at 37% and 40% for K-feldspar and quartz, respectively. If we assume a 20% disequilibrium magnitude, this will correspond to an average dose rate error of 4%. Assuming the worst-case scenario of disequilibrium at 50% and a U-supported dose rate of 40%, this would be a 20% error for sample UTA0292. For most samples, the worst case would be an 11% error, which is a similar or lesser magnitude to most reported age uncertainties. While it would be valuable to constrain the degree of disequilibrium at this site in future work, we suspect that the error magnitude that may result from U-series disequilibrium is of similar magnitude or less than our reported errors.
Additionally, we note the age agreement for samples collected across the Pocket Basin crater. This internal age agreement suggests that either: (1) all samples were affected to a similar degree and therefore disequilibrium has produced a systematic error that is present for all ages, or (2) disequilibrium is not a measurable effect here. If hydrothermal fluid circulation has migrated randomly throughout the crater sediments, we would expect to see a high degree of scatter in the luminescence ages, owing to significantly different time-integrated geologic dose rates. We argue that the internal age agreement of these samples indicates that any disequilibria present in these sediments is undetectable at the reported precision.
Conclusions
Four luminescence techniques were evaluated to determine the most effective methods for dating hydrothermal explosions. The first method investigated was K-feldspar post-IR IRSL stimulated at 225°C. While the pIRIR225 signal is intended to minimize anomalous fading (Thomsen et al., Reference Thomsen, Murray, Jain and Bøtter-Jensen2008), these samples exhibited g-values of 0–6.43 ± 0.94 % loss per decade, and therefore most required fading correction to estimate final ages. Corrected pIRIR225 ages are consistent when compared to quartz RTL for samples from Twin Buttes and Pocket Basin. No fading was observed for the pIRIR225 results from Mary Bay. The variation in g-values across all three field sites is likely due to variations in sample composition, degrees of weathering, hydrothermal alteration, or a combination of these factors at each sampling site. Pocket Basin crater breccia pIRIR225 results give a weighted mean age of 13.44 ± 1.06 ka, which agrees with RTL results that give a weighted mean age of 12.75 ± 0.50 ka.
Due to prior success with volcanic materials, RTL measurements were also evaluated (Bösken and Schmidt, Reference Bösken and Schmidt2019). In contrast with BTL, natural and regenerative RTL glow curves exhibit comparable shapes, with a dominant peak centered at 320–340°C for the regenerative curves and a broad peak around 330–360°C for the natural curve, suggesting the same dosimetric traps are involved. Dose response data from this region of the RTL glow curves also exhibited good SAR characteristics. RTL results yielded ages that agree with both the pIRIR225 results and previous age estimates for regional hydrothermal explosion craters, excluding one sample that was near visible hydrothermal alteration. The success of RTL in dating hydrothermal breccias in the YPVF is consistent with past successes dating materials of volcanic provenance with quartz RTL (Maillier et al., Reference Miallier, Faïn, Montret, Pilleyre, Sanzele and Soumana1991; Fattahi and Stokes, Reference Fattahi and Stokes2000; Ganzawa et al., Reference Ganzawa, Furukawa, Hashimoto, Sanzelle, Miallier and Pilleyre2005, Tsukamoto et al., Reference Tsukamoto, Murray, Huot, Watanuki, Denby and Bøtter-Jensen2007).
Although the signal from the quartz BLOSL measurement showed a high signal-to-noise ratio, it was characterized by high recuperation (37 ± 1%), high recycling ratios (0.96 ± 0.03 to 1.26 ± 0.04), and large overdispersion values (43%). Additionally, LM-OSL measurements indicate that the quartz signal is not dominated by the fast component, but by the medium and slow-4 components, which perform poorly for most dating applications (Jain et al., Reference Jain, Murray and Bøtter-Jensen2003). The BLOSL signal was therefore unsuitable for dating these deposits. BTL was deemed unsuitable, as the natural glow curve exhibited a different peak structure from the regenerative curves. Therefore, pIRIR225 and RTL methods provide the best accuracy for dating hydrothermal explosions.
Supplementary material
The supplementary material for this article can be found at https://doi.org/10.1017/qua.2025.10061.
Acknowledgments
Samples were collected for this study under Yellowstone National Park Research Permits YELL-2022-SCI-8158, YELL-2023-SCI-8158, and YELL-2023-SCI-5052. The study was supported by the USGS Volcano Hazards Program. We thank Josh Crozier and Sarah Lapinski for their assistance in collecting samples. We thank Harrison Gray, Shannon Mahan, and an anonymous reviewer for their constructive comments. Any use of trade, firm, or product names is for descriptive purposes and does not imply endorsement by the U.S. Government.
Data availability statement
Data reported in this study can be accessed at https://doi.org/10.32855/dataset.2025.11.20.







 Open access

