


Introduction
After the 2001 crisis, Turkey experienced significant labor productivity growth, averaging 6.1 percent per year from 2002 to 2007. Following the global financial crisis, the labor productivity growth rate slowed to an average of 2.64 percent between 2010 and 2023. The slowdown in productivity growth over the past decade primarily stems from credit allocation and incentive policies aimed at low-productivity sectors, deterioration of institutions, and an increase in macroeconomic instability, leading to a decline in foreign direct investment (Acemoglu and Ucer Reference Acemoglu, Ucer, Akat and Gürsel2023; Atiyas and Bakış Reference Atiyas, Bakış, Akat and Gürsel2023; Dincer et al. Reference Dincer, Eichengreen and Tekin-Koru2022; World Bank 2019). However, to achieve higher living standards, Turkey needs substantial productivity growth (World Bank 2019). Policy improvements targeting the acceleration of aggregate labor productivity growth must be based on a deeper understanding of productivity dynamics, both within and across sectors. This study examines the evolution of aggregate labor productivity growth by decomposing it into its components at both aggregate and sector levels.
Labor productivity growth in an economy can be driven by sectoral dynamics through capital accumulation or technological upgrading (the within-change component), the reallocation of labor between sectors with different productivity levels (the structural-change component), or a combination of both. Since the use of chained volume measures (CVM) began for real output calculations in labor productivity, changes in sector prices relative to aggregate prices have been discussed as a third potential component (the relative sectoral price-change component) of aggregate labor productivity growth.
Using CVM-based real gross domestic product (GDP) addresses the sensitivity of constant-price GDP to the choice of base year, but it also makes the aggregate real GDP, and therefore the aggregate labor productivity, non-additive. To address this issue, Tang and Wang (Reference Tang and Wang2004) and subsequent studies (e.g. Diewert Reference Diewert2015, Reference Diewert, Greene, Khalaf, Sickles, Veall and Voia2016; Dumagan Reference Dumagan2013; Dumagan and Balk Reference Dumagan and Balk2016) proposed an exactly additive decomposition that incorporates the relative sectoral price-change component. Relative sectoral price is defined as the ratio of a sector’s implicit output price deflator to that of the aggregate economy. It reflects the importance of the sector in the aggregate real GDP index and, in turn, in the growth of the aggregate labor productivity (Diewert Reference Diewert2015; Tang and Wang Reference Tang and Wang2004). This implies that as a sector’s relative price increases, its importance in the aggregate real GDP index – and consequently its contribution to aggregate labor productivity growth – rises.
Changes in relative sectoral prices driven by supply-and-demand dynamics within a specific sector are seen as a potential factor in the structural transformation of economic activity (for a literature review, see Van Neuss Reference Van Neuss2019).Footnote 1 Moreover, cross-country differences in relative sectoral price changes are crucial for explaining variations in productivity across nations during economic development (e.g. Duarte and Restuccia Reference Duarte and Restuccia2020; Herrendorf and Valentinyi Reference Herrendorf and Valentinyi2012).Footnote 2 Since national statistical offices began publishing GDP series as CVM, relative sectoral prices have generated interest for their quantitative contribution to aggregate labor productivity growth at both the aggregate and sectoral levels. However, the number of countries examined regarding the role of relative sectoral prices in labor productivity growth, particularly emerging and developing nations, remains limited.
This paper addresses this gap by decomposing aggregate labor productivity growth in Turkey using real GDP series calculated as CVM. Specifically, we aim to identify the key factors driving aggregate labor productivity growth, determine which sectors contribute most, and examine whether relative sectoral price changes significantly impact aggregate labor productivity growth and/or sectoral contributions. With this aim, we develop a new exactly additive decomposition method that builds on existing approaches. Tang and Wang (Reference Tang and Wang2004) were the first to exactly additively decompose overall labor productivity growth based on chain-indexed output for the United States (US) and Canada, although their method combined the effects of relative sectoral price changes with labor reallocation. Dumagan (Reference Dumagan2013) applied this approach to the agriculture sectors of the US and Italy, while Dumagan and Balk (Reference Dumagan and Balk2016) and Voskoboynikov (Reference Voskoboynikov2020) extended it to the US manufacturing sector and Russia. These studies consistently find that relative price changes, together with labor reallocation, significantly affect sectoral contributions. Diewert (Reference Diewert2015) introduced a new method that separates the contribution of relative sectoral price changes from the labor reallocation component, applying it to Australia and showing that, while these changes influence sectoral contributions, their aggregate effect is negligible. Diewert (Reference Diewert, Greene, Khalaf, Sickles, Veall and Voia2016) attributed this to the cancellation of relative price effects during aggregation. In contrast, Nishi (Reference Nishi2019) applied Diewert’s (Reference Diewert2015) method to Japan and found that relative price changes accounted for about 80 percent of aggregate labor productivity growth between 2005 and 2010.
The new exactly additive decomposition method we propose integrates Diewert’s (Reference Diewert2015) method with the widely used shift-share framework (e.g. De Vries et al. Reference De Vries, Erumban, Timmer, Voskoboynikov and Wu2012; McMillan and Rodrik Reference McMillan and Rodrik2011). As in Diewert (Reference Diewert2015), our method overcomes the non-additivity issue that arises in the decomposition of CVM-based labor productivity growth using the shift-share method. It separates within-, structural-, and relative price-change effects without approximation, and produces more intuitive component weights compared to Diewert (Reference Diewert2015).
Recently, the OECD (2023) proposed an exactly additive decomposition of CVM-based labor productivity growth that mimics constant-price decompositions by excluding relative price changes as a component.Footnote 3 However, having the relative price component explicitly ensures consistent sectoral contributions, distinguishes real productivity changes from price-driven shifts, and provides a clearer and more comprehensive view of aggregate labor productivity dynamics (Coyle et al. Reference Coyle, Mei and Hampton2024). Thus, our three-component additive decomposition offers a more informative framework for researchers and policymakers seeking to track changes in sectoral weights and their effects on overall labor productivity growth than methods that omit the relative price-change effect.
Among prior studies on Turkey, this is the first to decompose aggregate labor productivity growth using chain-indexed GDP with an exactly additive method, explicitly accounting for the role of relative sectoral price changes alongside within-and structural-change components. Earlier decompositions relied on constant-price GDP and consistently identified structural change as the main driver of productivity growth since the 1990s. Rodrik (Reference Rodrik2010) showed that structural change was a major driver of aggregate labor productivity growth in Turkey during both 1990–2005 and 1999–2008. In a similar vein, Atiyas and Bakış (Reference Atiyas and Bakış2015) found that structural change explained nearly all of the growth in the 1990s. Although its contribution declined in the 2000s, it remained the dominant factor, with consistent evidence across different sub-periods. However, Atiyas and Bakış (Reference Atiyas, Bakış, Akat and Gürsel2023) noted that the contribution of structural change declined sharply after 2014, potentially due to the misallocation of labor to low-productivity service sectors. Kaya and Çiçekçi (Reference Kaya and Çiçekçi2023) likewise documented a gradual downward trend in the structural-change contribution in their long-term analysis of labor productivity growth from 1960 to 2021.
Our findings align with previous discussions on labor productivity growth components in Turkey. The impact of structural change tends to decrease over time. Over the full period, structural change contributed slightly more to aggregate labor productivity growth than within-sector improvements, accounting for 54.5 percent and 45.6 percent of total labor productivity growth, respectively.Footnote 4 However, their contributions varied across sub-periods. During crisis years (1999–2001 and 2008–2009), structural change was positive while within-sector productivity declined, resulting in overall negative labor productivity growth. In non-crisis periods (2002–2007, 2010–2017, 2018–2023), aggregate labor productivity growth was substantially higher in the first period, averaging 6.1 percent annually, and slowed sharply in the latter two periods, where it averaged about 2.6 percent per year. Both components have a role in this decline but the main driver is the persistent decline in structural change, which nearly vanished after 2018.
Sectoral decomposition indicates that the slowdown in labor productivity growth is largely driven by construction, finance and real estate, community, personal, and government services, and transport and communication. Manufacturing’s contribution remained quantitatively stable but shifted compositionally from within-sector productivity to structural and relative price effects, a concerning pattern, particularly in the last period, given an almost zero within-change contribution. Rising within-change contributions from trade, and from finance and real estate in the last period partly mitigated the decline in aggregate within-change growth. Over the entire twenty-five-year period, trade was the largest contributing sector to labor productivity growth, followed by community, personal, and government services, then manufacturing, transport and communication, and finance and real estate sectors.
Regarding relative price changes, we find a negligible net effect at the aggregate level, consistent with offsetting sectoral movements, since relative prices reflect sectoral weights within aggregate real GDP. Nevertheless, they affect sectoral contributions: declining prices in finance and real estate after 2018 turned this sector’s contribution negative, while rising prices in community, personal, and government services reinforced its role as the second-largest contributor to aggregate labor productivity growth.
The paper continues, in the following section, by briefly describing the data and aggregation method of chain-indexed real GDP. Next, we show how Turkey’s sectoral allocation of economic activity and labor productivity have changed over the past twenty-five years. The section after this outlines our exactly additive decomposition equation. The “Findings” section first discusses the findings from this decomposition across years and sub-periods defined by each period’s policy context, then compares them with results obtained using other commonly applied decomposition methods. The final section concludes.
Data and aggregation of real GDP as CVM
We use sectoral national income and employment data from the Turkish Statistical Institute (Turkstat) for all calculations in this paper. The annual sectoral GDP series (value-added) in chain-linked volumes and current prices are used for the sectoral income series. Since December 2016, Turkstat has published real GDP figures in chain-linked volumes instead of constant prices, following the NACE Rev. 2 classification. As Turkstat has backdated these series to 1998, our labor productivity growth analysis covers the period 1999–2023. Sectoral employment data were constructed using four different series published by Turkstat. The series for the period up to 1999 and from 2000 to 2008 follow the NACE Rev. 1 classification, while the series for 2009 to 2013 and the period since 2014 follow the NACE Rev. 2 classification.
Both sectoral GDP and employment data are aggregated into the following nine sectors: agriculture, hunting, forestry, and fishing (AGR in tables and figures; agriculture in text); mining and quarrying (MIN; mining); manufacturing (MAN); public utilities – electricity, gas, and water (PU; public utilities); construction (CONS); wholesale and retail trade, hotels and restaurants (WRT; trade); transport, storage, and communications (TSC; transport and communication); finance, insurance, real estate, and business services (FIRE; finance and real estate); and community, social, personal, and government services (CSPSGS; community, personal, and government services). For further details on the data, see Appendix A in the Supplementary material.Footnote 5
Sectoral aggregation of employment and GDP at current prices is achieved by directly summing the underlying sectors’ employment and nominal GDP series.Footnote 6 However, the sectoral aggregation of the chain-indexed GDP series is complex. The chain method employed by Turkstat is the Laspeyres quantity index, which uses the previous year as the base year. This new method allows for an annual update of the base year in the real GDP calculation, enabling consideration of relative price changes across years for GDP components, at the cost of an additivity loss. Consequently, regardless of the GDP approach used (i.e. production, expenditure, or income), the components do not precisely sum to the aggregate GDP because the component weights change during aggregation. Nevertheless, given the sectoral chain-indexed and nominal GDP series and their aggregate counterparts, exactly additive aggregation is achievable by summing the sectoral chained-indexed volume weighted by their relative prices as follows (Diewert Reference Diewert2015; Dumagan Reference Dumagan2013; Tang and Wang Reference Tang and Wang2004):
 $$Y_t^{CVM} = \sum\limits_i {{p_{i,t}}} Y_{i,t}^{CVM}$$
where $Y_{i,t}^{CVM}$
and
$Y_{i,t}^{CVM}$
and $Y_t^{CVM}$
are real GDP in chained prices produced in sector
$Y_t^{CVM}$
are real GDP in chained prices produced in sector $i$
and the sector total, respectively.
$i$
and the sector total, respectively. ${p_{i,t}}$
is the relative price of sector
${p_{i,t}}$
is the relative price of sector $i$
, obtained by dividing the implicit price deflator of sector
$i$
, obtained by dividing the implicit price deflator of sector $i$
by the aggregate implicit price deflator. The implicit price deflator for sector
$i$
by the aggregate implicit price deflator. The implicit price deflator for sector $i$
is obtained by dividing the nominal GDP in sector
$i$
is obtained by dividing the nominal GDP in sector $i$
(
$i$
( $Y_{i,t}^N$
) by its chain-indexed GDP (
$Y_{i,t}^N$
) by its chain-indexed GDP ( $Y_{i,t}^{CVM}$
). Its aggregate counterpart is given by the ratio of the aggregate nominal GDP (
$Y_{i,t}^{CVM}$
). Its aggregate counterpart is given by the ratio of the aggregate nominal GDP ( $Y_t^N$
) to the aggregate chain-indexed GDP (
$Y_t^N$
) to the aggregate chain-indexed GDP ( $Y_t^{CVM}$
). Turkstat provides
$Y_t^{CVM}$
). Turkstat provides $Y_{i,t}^{CVM}$
for twenty sectors, which we regrouped into nine sectors mentioned above using equation (1). For further details on the calculation of equation (1) and the regrouping of sectors, see Appendix B in the Supplementary material.
$Y_{i,t}^{CVM}$
for twenty sectors, which we regrouped into nine sectors mentioned above using equation (1). For further details on the calculation of equation (1) and the regrouping of sectors, see Appendix B in the Supplementary material.
Sectoral allocation of economic activity and labor productivity in the last twenty-five years
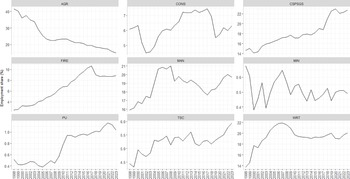
This section outlines the changes in the composition of sectoral activities and labor productivity over the last twenty-five years. Figure 1 illustrates the share of nominal value-added in the total value-added for the nine sectors from 1998 to 2023. Figures 2 and 3 present the employment shares and relative prices in these sectors during the same period.
Sectoral value-added shares. AGR, agriculture, hunting, forestry, and fishing; CONS, construction; CSPSGS, community, social, personal, and government services; FIRE, finance, insurance, real estate, and business services; MAN, manufacturing; MIN, mining and quarrying; PU, public utilities – electricity, gas, and water; TSC, transport, storage, and communications; WRT, wholesale and retail trade, hotels and restaurants.
Source: Authors’ calculations using Turkstat data

Sectoral employment shares. AGR, agriculture, hunting, forestry, and fishing; CONS, construction; CSPSGS, community, social, personal, and government services; FIRE, finance, insurance, real estate, and business services; MAN, manufacturing; MIN, mining and quarrying; PU, public utilities – electricity, gas, and water; TSC, transport, storage, and communications; WRT, wholesale and retail trade, hotels and restaurants.
Source: Authors’ calculations using Turkstat data

Relative sectoral prices. AGR, agriculture, hunting, forestry, and fishing; CONS, construction; CSPSGS, community, social, personal, and government services; FIRE, finance, insurance, real estate, and business services; MAN, manufacturing; MIN, mining and quarrying; PU, public utilities – electricity, gas, and water; TSC, transport, storage, and communications; WRT, wholesale and retail trade, hotels and restaurants; Coef. of Var., coefficient of variation.
Source: Authors’ calculations using Turkstat data

The sectoral composition of the Turkish economy regarding value-added shares has remained stable over the last twenty-five years, with only mild changes in the shares of agriculture, community, personal, and government services, construction, and manufacturing. The share of agriculture decreased steadily, while the share of community, personal, and government services increased until 2020, then declined in 2020 and 2021 due to the COVID-19 pandemic. Construction’s share increased from 2001 to 2017, then reverted to its initial levels after being impacted by the crisis that began in the third quarter of 2018. Meanwhile, manufacturing’s share decreased until the global financial crisis, but then increased by a similar amount and returned to its original levels.
On the other hand, the composition of labor allocation has changed significantly over the last twenty-five years. The share of agriculture declined from 42 percent to 15 percent during this period. Most of this decline occurred before the global financial crisis. Workers leaving agriculture primarily transitioned to community, personal, and government services, and to trade, followed by finance and real estate, manufacturing, construction, and transport and communication.
Another important change during this period was the decline in relative prices in sectors experiencing rises in their labor productivity, such as manufacturing, transport and communication, trade, and construction, alongside a persistent increase in the relative price of community, personal, and government services, which experienced very low labor productivity growth.Footnote 7 This pattern may be attributed to rising wages in community, personal, and government services, driven by wage increases in sectors with higher productivity growth, without a corresponding increase in the productivity of community, personal, and government services.
Given shifts in the allocation of sectoral activities, how has the composition of sectoral labor productivity changed during this period, where labor productivity is defined as value-added per worker?Footnote 8 Figure 4 displays the sectoral labor productivity levels relative to the aggregate labor productivity indexed to 100 each year. The size of each bubble represents the corresponding sector’s employment share for the given year. Over the past twenty-five years, the labor productivity gap between sectors has narrowed significantly, with the coefficient of variation declining from 111 percent in 1998 to 56 percent in 2023. The labor productivity in finance and real estate, public utilities, transport and communication, and mining consistently remained above the aggregate labor productivity throughout this period. At the beginning of this period, labor productivity in finance and real estate was almost 7.5 times the aggregate labor productivity, but this decreased to about twice by the end, mainly due to an increase in its employment share, which rose from 2.5 percent to 8.9 percent. Similarly, labor productivity in transport and communication remained two to three times higher than the aggregate labor productivity throughout the entire period, with some fluctuations. In contrast, agriculture, which held the largest employment share until 2018, consistently recorded the lowest labor productivity among these nine sectors. Although its labor productivity experienced increases in some years during the study period, in line with a significant decrease in its employment share, the labor productivity in agriculture has always been the lowest. Another sector with consistently below-aggregate labor productivity is the community, personal, and government services sector, with labor productivity levels ranging from 70 to 90 percent of the aggregate. Manufacturing, trade, and construction exhibited labor productivity levels that oscillated around aggregate levels. The employment share of these three sectors accounted for 36 percent of total employment in 1998, rising to 46 percent by 2023.
Sectoral labor productivities (LP) relative to aggregate LP. AGR, agriculture, hunting, forestry, and fishing; CONS, construction; CSPSGS, community, social, personal, and government services; FIRE, finance, insurance, real estate, and business services; MAN, manufacturing; MIN, mining and quarrying; PU, public utilities – electricity, gas, and water; TSC, transport, storage, and communications; WRT, wholesale and retail trade, hotels and restaurants; CV, coefficient of variation.
Source: Authors’ calculations using Turkstat data

Decomposition
The labor productivity growth decomposition equation proposed in this study, which combines the Diewert (Reference Diewert2015) method with shift-share analysis in McMillan and Rodrik (Reference McMillan and Rodrik2011), is given by:

where $L{P_t}$
and
$L{P_t}$
and $L{P_{it}}$
are the aggregate and sector
$L{P_{it}}$
are the aggregate and sector $i$
’s labor productivity at time
$i$
’s labor productivity at time $t$
, respectively. Labor productivity is defined as the real value-added measured as a chained volume measure per total number of workers.
$t$
, respectively. Labor productivity is defined as the real value-added measured as a chained volume measure per total number of workers. ${s_{it}}$
is the employment share of sector
${s_{it}}$
is the employment share of sector $i$
in the total number of workers in the economy in year
$i$
in the total number of workers in the economy in year $t$
.
$t$
. ${p_{i,t}}$
is the relative sectoral price of sector
${p_{i,t}}$
is the relative sectoral price of sector $i$
at time
$i$
at time $t$
, which is defined as the ratio of the implicit price deflator of sector
$t$
, which is defined as the ratio of the implicit price deflator of sector $i$
to the aggregate implicit price deflator. This term appears in the decomposition equation because of using real value added as a chained volume measure.
$i$
to the aggregate implicit price deflator. This term appears in the decomposition equation because of using real value added as a chained volume measure. ${\rm{\Delta }}$
stands for the change between
${\rm{\Delta }}$
stands for the change between $t$
and
$t$
and $t - 1$
, so the left-hand side of the equation corresponds to overall labor productivity growth. For further details on labor productivity calculation with chained volume value-added series and derivation of equation (2), see Appendix C in the Supplementary material.
$t - 1$
, so the left-hand side of the equation corresponds to overall labor productivity growth. For further details on labor productivity calculation with chained volume value-added series and derivation of equation (2), see Appendix C in the Supplementary material.
The first term on the right-hand side of equation (2) is productivity growth within sectors between $t$
and
$t$
and $t - 1,$
weighted by the product of employment share and the relative price of the underlying sector averaged over time
$t - 1,$
weighted by the product of employment share and the relative price of the underlying sector averaged over time $t$
and
$t$
and $t - 1$
. This corresponds to the within-change component of the overall labor productivity growth. It measures the contribution of labor productivity change in sector
$t - 1$
. This corresponds to the within-change component of the overall labor productivity growth. It measures the contribution of labor productivity change in sector $i$
to aggregate labor productivity growth given its average importance in the overall economy across periods
$i$
to aggregate labor productivity growth given its average importance in the overall economy across periods $t$
and
$t$
and $t - 1$
. An increase in sectoral labor productivity positively contributes to the aggregate labor productivity growth. The second term is the change in sectoral employment shares between times
$t - 1$
. An increase in sectoral labor productivity positively contributes to the aggregate labor productivity growth. The second term is the change in sectoral employment shares between times $t$
and
$t$
and $t - 1$
, weighted by the average product of labor productivity and the relative price of the underlying sector for those periods. This term captures the structural-change component of the aggregate labor productivity growth. An increase (decrease) in employment share in sector
$t - 1$
, weighted by the average product of labor productivity and the relative price of the underlying sector for those periods. This term captures the structural-change component of the aggregate labor productivity growth. An increase (decrease) in employment share in sector $i$
leads to a positive (negative) structural change. The contribution of the structural change to overall labor productivity growth is small if the sector has a low labor productivity and a low share in aggregate output in both periods. However, if both are high for sector
$i$
leads to a positive (negative) structural change. The contribution of the structural change to overall labor productivity growth is small if the sector has a low labor productivity and a low share in aggregate output in both periods. However, if both are high for sector $i$
, then a labor shift towards this sector highly contributes to the overall labor productivity growth. The third term on the right-hand side, which does not appear in labor productivity growth decompositions with value-added at constant prices, shows the contribution of the change in the relative share of sector
$i$
, then a labor shift towards this sector highly contributes to the overall labor productivity growth. The third term on the right-hand side, which does not appear in labor productivity growth decompositions with value-added at constant prices, shows the contribution of the change in the relative share of sector $i$
in aggregate output between
$i$
in aggregate output between $t$
and
$t$
and $t - 1$
. This change is weighted by the average of two products: the product of the initial period’s labor productivity in sector
$t - 1$
. This change is weighted by the average of two products: the product of the initial period’s labor productivity in sector $i$
and its employment share in the last period, and the product of the initial period’s employment share and the last period’s labor productivity in sector
$i$
and its employment share in the last period, and the product of the initial period’s employment share and the last period’s labor productivity in sector $i$
. This term corresponds to the relative price-change component of aggregate labor productivity growth.Footnote 9 A positive (negative) relative price change in a sector implies that the price level in that sector increases more or decreases less (increases less or decreases more) than the aggregate price level; thus, the weight of that sector in real aggregate output increases (decreases). In labor productivity growth decomposition, the contribution of the relative price change captures the change in labor productivity growth through the change in the weight of the underlying sector in the real aggregate output.
$i$
. This term corresponds to the relative price-change component of aggregate labor productivity growth.Footnote 9 A positive (negative) relative price change in a sector implies that the price level in that sector increases more or decreases less (increases less or decreases more) than the aggregate price level; thus, the weight of that sector in real aggregate output increases (decreases). In labor productivity growth decomposition, the contribution of the relative price change captures the change in labor productivity growth through the change in the weight of the underlying sector in the real aggregate output.
When constant price-based labor productivity growth is decomposed, the last term and the relative sectoral price term ( ${p_{it}}$
) would not appear in equation (2). This is because the relative sectoral prices, which reflect the sectors’ weights in total real output, are fixed in the base year and do not change over time. As a result, sectoral weights in total real output remain constant and do not contribute to growth in aggregate real output, and consequently to labor productivity growth. However, with real output measured as a chained volume index and using the current decomposition method, it is possible to track how sectors contribute to overall labor productivity growth by examining changes in their weight in total real output, as well as changes in their within-productivity and labor shares. But at the aggregate level, one should expect nearly zero impact when there are moderate changes in quantities and prices across periods (Diewert Reference Diewert, Greene, Khalaf, Sickles, Veall and Voia2016). This aligns with the idea that the weight of some sectors increases (or decreases), while others decrease (or increase) in real aggregate output, which is defined by the index numbers. Appendix C, from equation (C10) to (C13), demonstrates that changes in aggregate real prices have an approximately zero contribution (see Supplementary material).
${p_{it}}$
) would not appear in equation (2). This is because the relative sectoral prices, which reflect the sectors’ weights in total real output, are fixed in the base year and do not change over time. As a result, sectoral weights in total real output remain constant and do not contribute to growth in aggregate real output, and consequently to labor productivity growth. However, with real output measured as a chained volume index and using the current decomposition method, it is possible to track how sectors contribute to overall labor productivity growth by examining changes in their weight in total real output, as well as changes in their within-productivity and labor shares. But at the aggregate level, one should expect nearly zero impact when there are moderate changes in quantities and prices across periods (Diewert Reference Diewert, Greene, Khalaf, Sickles, Veall and Voia2016). This aligns with the idea that the weight of some sectors increases (or decreases), while others decrease (or increase) in real aggregate output, which is defined by the index numbers. Appendix C, from equation (C10) to (C13), demonstrates that changes in aggregate real prices have an approximately zero contribution (see Supplementary material).
Findings
Labor productivity growth dynamics
We decompose annual labor productivity growth using annual chain-linked GDP (value-added) and employment data in equation (2). This decomposition yields three components: the aggregate within-, structural-, and relative sectoral price change. Figure 5 shows the annual labor productivity growth and its components from 1999 to 2023. Over this period, the average annual labor productivity growth was 2.69 percent. Negative growth rates occurred in 1999, 2001, 2008, 2009, 2014, and 2022. Crises in 1999, 2001, and 2009 caused negative real output growth, leading to a drop in overall labor productivity growth. In 2008, 2014, and 2022, labor productivity growth fell because employment grew faster than real output.Footnote 10
Aggregate labor productivity (LP) growth.
Source: Authors’ calculations using Turkstat data

From 2002 to 2007, labor productivity growth stayed relatively steady and high. However, after 2005, labor productivity growth started to slow down and never returned to its previous peak levels. The contributions of the structural change and within-change components to labor productivity growth were fluctuating, while the relative price-change component remained negligible throughout the period, as expected theoretically. The positive labor productivity growth in 2000, 2004, 2006, 2010, 2012, and 2016 was primarily driven by the structural-change component. This indicates that reallocating labor to more productive sectors played a more significant role in overall labor productivity growth than productivity improvements within individual sectors. Throughout the entire period, the average contribution of the structural-change component slightly surpassed that of within-sector change. Annual averages for the entire period indicate that 54.5 percent of the average labor productivity growth originated from structural change, while 45.6 percent resulted from within-sector productivity improvements.
Another takeaway from Figure 5 is the volatility of aggregate labor productivity growth and its components over the past twenty-five years, consistent with findings in Kaya and Çiçekçi (Reference Kaya and Çiçekçi2023). This volatile pattern is likely associated with Turkey’s shifting policy environment. To better understand the changing dynamics of labor productivity growth, we carried out the analysis over a number of sub-periods that reflect changes in the overall policy environment. The period from 1999 to 2001 covers crisis years: The 1990s were characterized by macroeconomic instability and chronic fiscal deficits, as well as increased fragility in the banking system. In 1999, Turkey suffered a devastating earthquake that caused a large drop in GDP. A disinflation program backed by the International Monetary Fund was adopted towards the end of 1999, but the program collapsed in February 2001, causing a run on the Turkish lira, a deep recession, with GDP contracting over 5 percent in 2001, soaring inflation, and a massive banking sector bailout.
Following the crisis, there was a change in economic management and the launch of a comprehensive reform program, which was also adopted by the incoming Justice and Development Party (AKP) government. The years 2002–2007 correspond to a period of significant economic, political, and institutional reforms, partly guided by an optimistic perception of accession to the European Union (EU). Institutions of economic management were strengthened in a wide range of fields, including central bank independence and monetary policy, the financial sector, energy, telecommunications, competition policy, and public financial management (Acemoglu and Ucer Reference Acemoglu, Ucer, Akat and Gürsel2023; Atiyas Reference Atiyas2012). This period of relatively “high quality growth” (Acemoglu and Ucer Reference Acemoglu, Ucer, Akat and Gürsel2023) was punctuated by another crisis in 2008–2009, this time instigated by the 2008 global financial crisis.
We further divide the period after the global financial crisis into two: the first, between 2010 and 2017; and the second, between 2018 and 2023. The period 2010–2017 is characterized by a slowdown of economic reform, the weakening of the EU anchor, gradual degradation of the independence of regulatory institutions, including the central bank, and increased authoritarianism and weakening of the rule of law, especially following the Gezi protests in 2013 and a failed coup in 2016 (Acemoglu and Ucer Reference Acemoglu, Ucer, Akat and Gürsel2023; Özel Reference Özel2015). Economic growth started to be increasingly driven by the expansion of credit and the construction industry, rather than productivity and exports.Footnote 11 The final period starts with 2018, the year Turkey switched to a presidential system of government, and also experienced a run on the Turkish lira. The switch to the presidential system resulted in further centralization of executive authority. The role of credit expansion in growth accelerated with the extensive use of a credit guarantee scheme (revived in 2017).Footnote 12 The period is characterized by almost complete elimination of central bank independence, the formal adoption of a heterodox approach to monetary policy where the interest rate was seen as a key driver of inflation (Gürkaynak et al. Reference Gürkaynak, Kısacıkoğlu and Lee2023), increased resort to overt and covert price controls, and various mechanisms introduced to prevent dollarization, including a mechanism to compensate for foreign exchange losses of deposits kept in domestic currency and compelling exporters to deposit part of their foreign exchange earnings. Politically, in this period, Turkey experienced further reductions in the rule of law (World Bank n.d.).
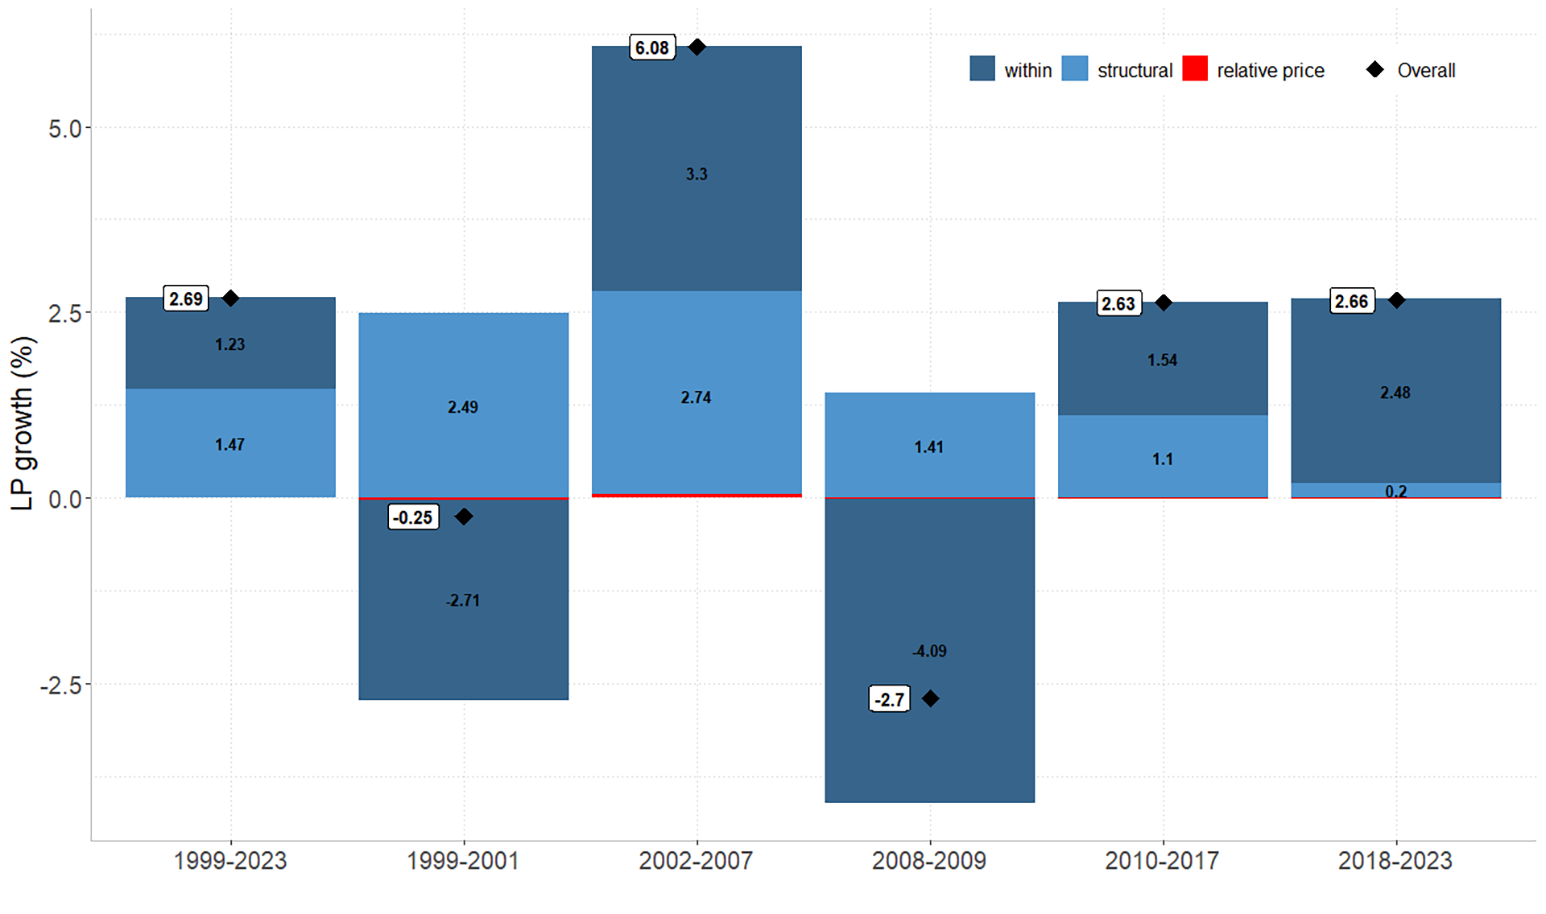
Figure 6 summarizes the aggregate labor productivity growth and its components across these five sub-periods, presenting averages for each period. The first bar shows the average for the whole period, while the remaining bars illustrate averages for the individual sub-periods in chronological order. During both crisis periods, the decline in the within-change component outweighed the positive contribution of the structural change to the labor productivity growth, resulting in an overall contraction. However, the contraction in 2008–2009 was nearly ten times greater than that in 1999–2001, driven by a sharper decline in the within-change component and weaker structural change. Sectoral contributions to these changes through three components, as displayed in Figure 8, provide further insights about them. In the first crisis period, trade was the primary driver of the within-sector decline (–2.10 percentage points [pp]), followed by manufacturing and finance and real estate (each around –0.75 pp). During the second crisis period, the contraction was mainly driven by finance and real estate (–1.51 pp), followed by construction (–0.97 pp), trade and transport and communication (around –0.70 pp each), manufacturing (–0.35 pp), and public utilities (–0.23 pp). Conversely, substantial increases in the structural-change component within similar sectors – finance and real estate (1.59 pp), trade (1.26 pp), and manufacturing and transport and communication (around 0.35 pp each) in the first crisis, and finance and real estate (2.03 pp) in the second – suggest that labor hoarding played an important role in these periods, an interpretation also supported by Atiyas and Bakış (Reference Atiyas, Bakış, Akat and Gürsel2023) and Kaya and Çiçekçi (Reference Kaya and Çiçekçi2023). The limited role of structural change during the latter crisis aligns with the observation that most employment shifted from the low-productivity agriculture sector to relatively more productive sectors before the global financial crisis, as discussed in the “Sectoral allocation of economic activity and labor productivity in the last twenty-five years” section.
Aggregate labor productivity (LP) growth by sub-periods.
Source: Authors’ calculations using Turkstat data.
Notes: The numbers in boxes indicate the average annual growth rate of aggregate LP for each period. The numbers in each stacked segment show the contributions of within-sector and structural-change components, expressed in percentage points. Their sum equals aggregate LP growth. Additional figures are provided in Table D2 in Appendix D in the Supplementary material.

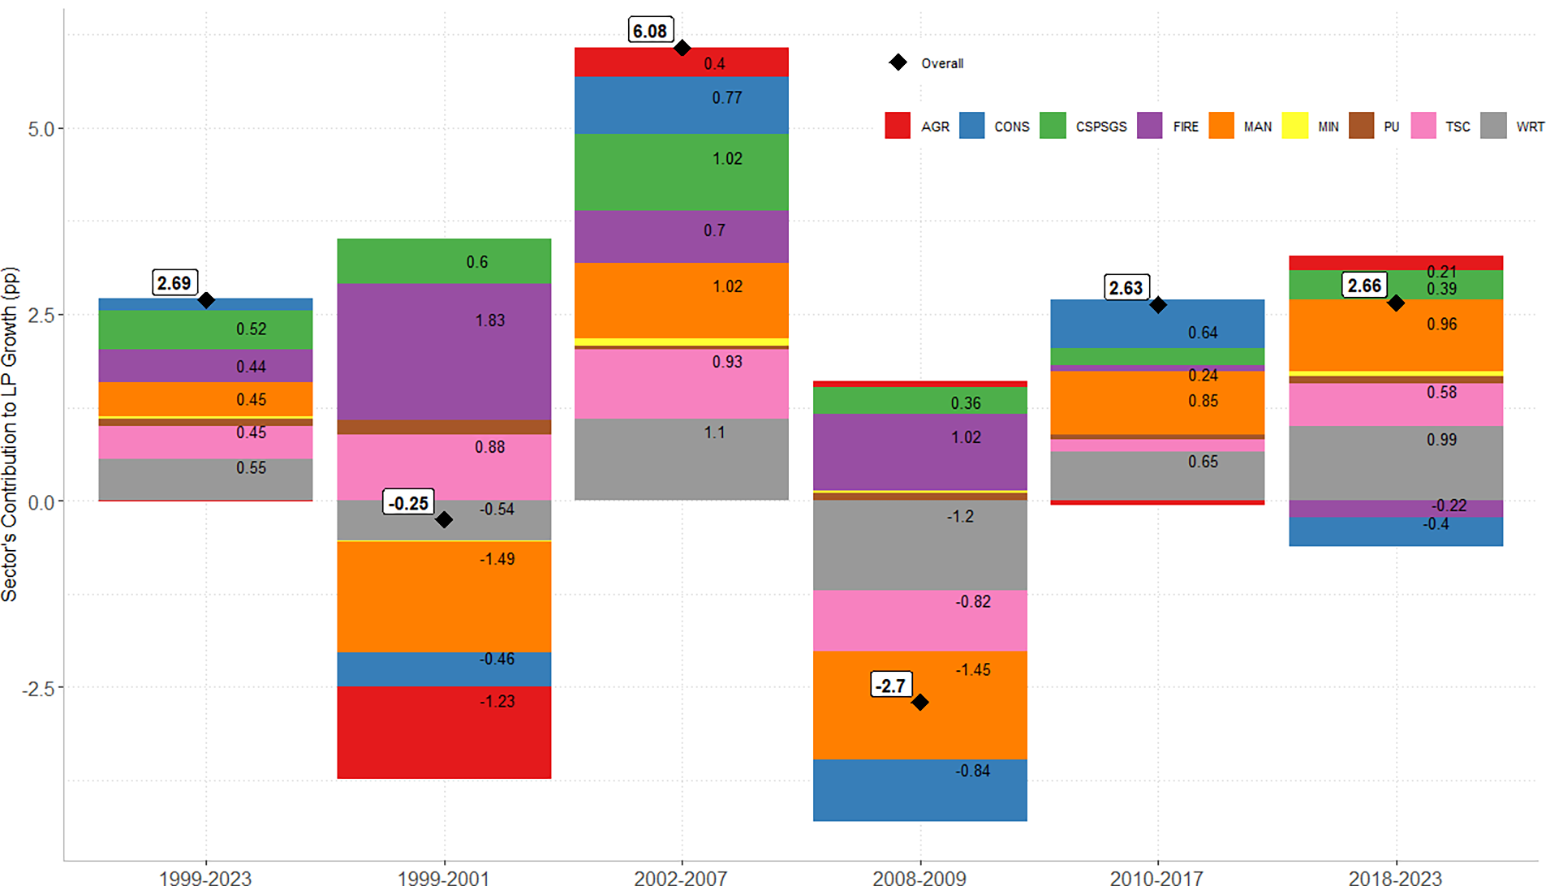
Sector contributions to aggregate labor productivity (LP) growth. AGR, agriculture, hunting, forestry, and fishing; CONS, construction; CSPSGS, community, social, personal, and government services; FIRE, finance, insurance, real estate, and business services; MAN, manufacturing; MIN, mining and quarrying; PU, public utilities – electricity, gas, and water; TSC, transport, storage, and communications; WRT, wholesale and retail trade, hotels and restaurants.
Source: Authors’ calculations using Turkstat data.
Notes: The numbers in boxes indicate the average annual growth of aggregate LP over each period. The numbers in each stacked segment show sectoral contributions to aggregate LP growth, expressed in percentage points (pp). Their sum equals the aggregate LP growth. For clarity, contributions with an absolute value smaller than 0.2 are omitted. Additional figures are reported in Table D2 in Appendix D in the Supplementary material.

When non-crisis periods are considered together, a clear pattern emerges: a steady decline in overall labor productivity, which fell from 6.08 percent in 2002–2007 to 2.63 percent in 2010–2017 and 2.66 percent in 2018–2023. Both within- and structural-change components contribute to this slowdown. The within-change component decreased from 3.3 pp to 1.5 pp in 2010–2017 and to 2.5 pp in 2018–2023. However, the more pronounced and persistent decline comes from the structural-change component, which steadily declined from 2.74 pp in 2002–2007 to 1.10 pp in 2010–2017 and to 0.20 pp in 2018–2023.
To better understand the sources of this deceleration, Figure 7 decomposes aggregate labor productivity growth into sectoral contributions for each sub-period. The results reveal that the major decline in total labor productivity growth is largely driven by a few key sectors: construction, finance and real estate, community, personal, and government services, transport and communication, and, to a lesser extent, agriculture. Construction declined from 0.77 pp to 0.64 pp in the 2010–2017 period, despite a rapid boom in the sector, fueled by credit expansions and government policies within the period (Acemoglu and Ucer Reference Acemoglu, Ucer, Akat and Gürsel2023). The situation worsened in 2018–2023 with a large fall in its contribution to –0.4 pp, because of a sector-specific crisis that started in the third quarter of 2018 and lasted until the third quarter of 2020. Similarly, the high-productivity finance and real estate sector saw its contribution decline from 0.7 pp to nearly zero during 2010–2017 and is –0.22 pp in the last period. A comparable decline is observed in the high-productivity transport and communication sector, whose contribution dropped from 0.9 pp to 0.2 pp, before modestly recovering to 0.6 pp in 2018–2023. Meanwhile, the low-productivity community, personal, and government services’ contribution declined from 1 pp to 0.2 pp, then slightly rebounded to 0.4 pp during these periods, whereas agriculture’s contribution decreased from 0.4 pp to zero and then marginally recovered to 0.21 pp. Manufacturing remains relatively steady at around 1 pp across these periods.
Sector contributions to the within-change component (panel A); the structural-change component (panel B), and the relative price-change component (panel C). AGR, agriculture, hunting, forestry, and fishing; CONS, construction; CSPSGS, community, social, personal, and government services; FIRE, finance, insurance, real estate, and business services; MAN, manufacturing; MIN, mining and quarrying; PU, public utilities – electricity, gas, and water; TSC, transport, storage, and communications; WRT, wholesale and retail trade, hotels and restaurants.
Source: Authors’ calculations using Turkstat data.
Notes: Sectoral contributions to aggregate labor productivity growth through the within-change, structural change, and relative price-change components are presented in panels A, B, and C, respectively. In each panel, the numbers in boxes indicate the average annual contribution of the corresponding component over each period. The numbers in each stacked segment show sectoral contributions to the respective component, expressed in percentage points (pp). Their sum equals the aggregate contribution of that component. For clarity, contributions with an absolute value smaller than 0.1 are omitted. Additional figures are reported in Table D2 in Appendix D in the Supplementary material.

To uncover the mechanisms behind these patterns, we next examine the roles of sector-level within-, structural-, and relative price change in shaping the overall decline. Figure 8 presents sectoral contributions to each component of aggregate labor productivity growth. Starting with construction, the decline in labor productivity growth arose from decreases in both the within-and structural-change components. The within-change contribution fell from 0.72 pp in 2002–2007 to 0.37 pp in 2010–2017 and further to –0.07 pp in 2018–2023. Similarly, the structural-change component decreased from 0.20 pp to 0.16 pp and finally to –0.23 pp. The role of relative prices in construction is not significant; it was around –0.10 pp in 2002–2007 and in 2018–2023, while it was 0.12 pp in 2010–2017. The increase in the latter period may be related to higher labor costs resulting from the 2016 minimum wage increase.
In finance and real estate, the contraction in labor productivity growth is driven primarily by a sharp decline in the structural-change component, which was around 1.20 pp in both 2002–2007 and 2010–2017 but fell to –0.54 pp in 2018–2023. The contribution of relative price changes also weakened substantially from 0.13 pp in 2002–2007 to –0.32 pp in 2010–2017 and –0.63 pp in 2018–2023, signaling a steady decline in the relative importance of this sector in GDP. A similar pattern emerges for community, personal, and government services, where relative price effects play a particularly pronounced role. In 2002–2007, they accounted for more than half of the total labor productivity growth in this sector (0.66 pp out of 1.02 pp). This pattern is consistent with evidence of rising relative prices in traditional service sectors that typically exhibit limited productivity growth, whereas manufacturing and non-traditional service sectors, such as transport and communication, experienced notable productivity gains, leading to higher wages (Duarte and Restuccia Reference Duarte and Restuccia2020). In Turkey, this mechanism is likely reinforced by notable total factor productivity (TFP) increases in key sectors such as agriculture, manufacturing, and construction during the same period (Atiyas and Bakis Reference Atiyas, Bakış, Akat and Gürsel2023). However, the relative price contribution in community, personal, and government services declined sharply to 0.21 pp in 2010–2017 and turned negative (–0.24 pp) in 2018–2023. In contrast, the within-change component made only negligible contributions (–0.06, –0.07, and 0.16 pp, respectively), while the contribution of structural change initially fell from 0.42 pp to 0.11 pp in 2010–2017 but rebounded to 0.47 pp in 2018–2023. Overall, the slowdown in community, personal, and government services is therefore largely explained by relative price movements, which may have weakened as productivity-driven wage growth in more productive sectors slowed compared with 2002–2007 and/or lower demand for these services, due to uncertain economic conditions and the COVID-19 shock in the last period.
In the transport and communication sector, the decline comes mainly from contributions to within-change components. As a high-productivity service sector, transport and communication contributed 0.84 pp to the within-change component in 2002–2007, but this fell to 0.26 pp and 0.19 pp in 2010–2017 and 2018–2023, respectively. Its contribution to structural change dropped from 0.32 pp in 2002–2007 to nearly zero in 2010–2017, before recovering modestly to 0.25 pp in the last period. However, the relative price-change contribution helped the sector in the last period with a 0.14 pp contribution, whereas it was negative in 2002–2007 (–0.23 pp), consistent with high within-productivity growth, and was almost zero (–0.07 pp) in 2010–2017. The low-productivity agriculture sector’s contribution to this decline occurs mainly through structural change, reflecting a substantial exit of employment from the sector. This reallocation raised within-sector productivity but resulted in a declining positive contribution over time; from 1.10 pp in 2002–2007 to 0.13 pp in 2010–2017 and 0.29 pp in 2018–2023.
Manufacturing deserves particular attention. Although its overall contribution to labor productivity growth remained relatively stable across periods, the composition of that contribution changed notably. In 2002–2007 and 2010–2017, the main driver was the within-change component (0.80 pp and 0.95 pp, respectively). In 2018–2023, however, the within-change contribution declined sharply to 0.13 pp. This decline is consistent with the slowdown in positive TFP growth in the sector, as reported in Bakış (Reference Bakış2024): 3.7 pp in 2003–2007, 2.8 pp in 2011–2014, and 0.9 pp in 2015–2022. The contribution through structural change exhibited considerable volatility, falling sharply from 0.72 pp in 2002–2007 to –0.21 pp in 2010–2017 before recovering to 0.41 pp in 2018–2023. The sharp decline in the structural-change component occurring in 2002–2007 aligns with the increase in market concentration, which is negatively correlated with labor shares (see Facts 2 and 8 in Akcigit et al. Reference Akcigit, Akgunduz, Cilasun, Ozcan-Tok and Yilmaz2020), an increase in the share of informal labor in this sector, notably in 2016 (Akcigit et al. Reference Akcigit, Akgunduz, Cilasun, Ozcan-Tok and Yilmaz2020), and a shift to low-and medium-technology manufacturing sectors that are unable to generate substantial employment increases (Doğruel and Doğruel Reference Doğruel, Doğruel, Koyuncu, Mıhçı and Yeldan2017). The contribution of relative price change was –0.50 pp in 2002–2007, consistent with a large increase in TFP. However, it turned positive in later periods: 0.12 pp in 2010–2017 and 0.42 pp in 2018–2023. The positive contribution in the former period is in line with the increased market concentration and labor costs due to a rise in minimum wages in 2016, while the latter was likely driven by the rising input costs associated with exchange rate depreciation. This shift indicates a changing structure of productivity growth within the manufacturing sector itself. The almost zero contribution of the within-sector component is clearly a worrisome development, underscoring the need for further analysis on allocation efficiency at the firm level.
Despite the sharp decline in manufacturing’s contribution to the aggregate within component in the last period, it remains nearly 1 pp higher than its level in 2010–2017. During this period, the gap left by manufacturing was largely filled by within-sector productivity gains in two sectors: finance and real estate, and trade. Although finance and real estate’s total contribution was negative due to adverse structural and relative price effects, its within-change contribution reached 0.94 pp, the highest among all periods. Similarly, trade’s contribution through the within-change component steadily increased across the three non-crisis periods, from 0.57 pp in 2002–2007 to 0.82 pp in 2010–2017 and 0.94 pp in 2018–2023. While the contribution of its structural-change component fluctuated considerably across these periods (0.65 pp, –0.15 pp, and 0.11 pp, respectively), the consistently high within-change contributions make trade the primary driver of aggregate labor productivity growth over the past twenty-five years, with an average contribution of 0.55 pp. It is followed by community, personal, and government services with an average contribution of 0.52 pp and by manufacturing, transport and communication, and finance and real estate, each contributing around 0.45 pp on average.
Comparison of findings calculated by different decomposition methods
To benchmark our results, we compare them with two widely used approaches.Footnote 13 The first is the standard shift-share decomposition applied to CVM-based labor productivity growth. This method, however, generates notable non-additivity problems, especially during periods such as 1999–2001 and 2002–2007, when relative prices shifted significantly in some sectors. The second is the previous-year-price approach (OECD 2023), which calculates real value added at the previous year’s prices and then applies the shift-share method. Because the base year in CVM is always the previous year, this procedure yields an exactly additive decomposition of within-and structural-change effects but excludes relative price changes as a separate factor. Thus, it serves as a practical alternative in the absence of constant-price output series or sector-level deflators. Further details are provided in Appendix E.3 in the Supplementary material. While suitable for measuring traditional within-and structural-change effects in a manner similar to constant-price decompositions, it cannot capture the impact of evolving sectoral weights on aggregate real output.
As emphasized by Coyle et al. (Reference Coyle, Mei and Hampton2024), accounting for relative prices is crucial, even when the results may seem counterintuitive. For instance, if a sector’s quality-adjusted price declines while its labor productivity remains constant, its contribution to aggregate productivity growth may fall in that year. This is because decompositions provide period-specific snapshots of a dynamic process: the relative price component reflects how a sector’s weight in aggregate output changes. Over time, adjustments in output and employment shares reveal the sector’s true contribution to productivity. Our proposed three-component additive method is therefore better suited for researchers and policymakers seeking to track how sectoral weights influence aggregate productivity growth. By explicitly incorporating relative price effects, it generates consistent sectoral contributions, distinguishes real productivity gains from price-driven shifts, and provides a clearer picture of overall dynamics, in line with the argument of Coyle et al. (Reference Coyle, Mei and Hampton2024).
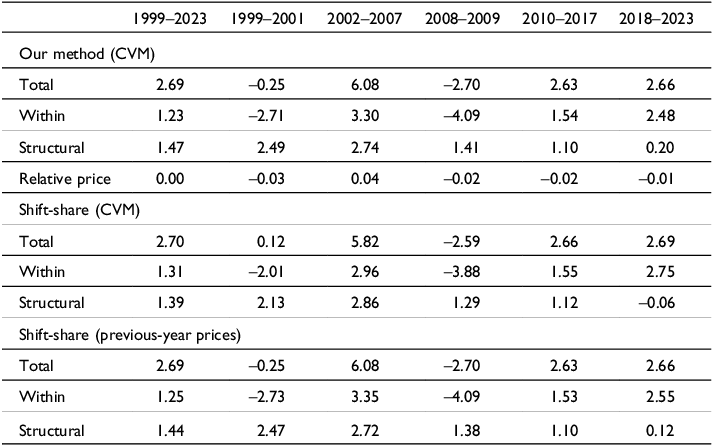
Table 1 compares aggregate labor productivity growth decompositions using our method, the shift-share method applied to CVM-based labor productivity growth, and the shift-share method with previous-year-price-based labor productivity growth. The first takeaway is that the standard shift-share method is non-additive when CVM value added is used in labor productivity calculations. This non-additivity becomes more apparent as the relative price changes increase during the periods 1999–2001 and 2002–2007, and it produces misleading aggregate results. Therefore, we recommend not applying the standard shift-share decomposition with CVM-based values. Non-additivity is not an issue when labor productivity is calculated using value added at previous-year prices. Additionally, the contributions of the within and structural-change components to overall labor productivity growth are very similar in this method and ours.
Comparison of aggregate contributions to labor productivity growth regarding different decomposition methods

CVM, chained volume measures.
Source: Authors’ calculations using Turkstat data
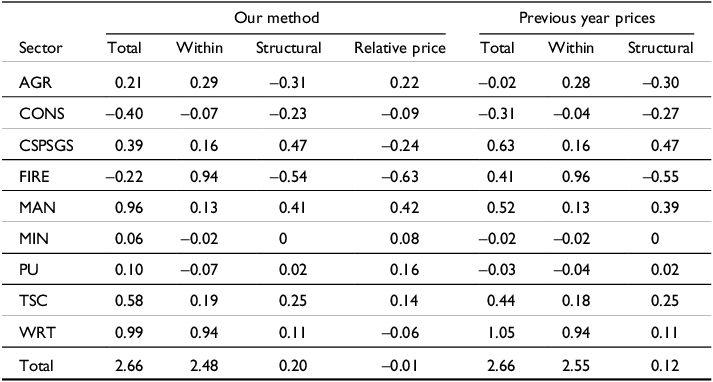
However, after reviewing sector-level contribution details, we observe some differences. Table 2 highlights sectoral contributions in the most recent period, comparing our method with the previous-year-price approach. For example, manufacturing contributes 0.96 pp in our method, whereas it is 0.52 pp in the previous-year-price approach. The difference is driven by relative price changes, reflecting shifts in the manufacturing sector’s share of total real value added. Similarly, the finance and real estate sector shows a negative overall contribution in our method (–0.22 pp), primarily due to a relative price effect (–0.63 pp), whereas the previous-year-price method yields a positive total of 0.41 pp. This indicates that ignoring relative price changes can misrepresent whether sectors are contributing positively or negatively to overall productivity growth. The differences are also evident in services: community, social, personal, and government services appear as a stronger contributing sector in the previous-year-price method (0.63 pp) than in our approach (0.39 pp), again highlighting the impact of relative price adjustments. This demonstrates that our additive decomposition offers a clearer and more accurate view of sectoral dynamics than the previous-year-price approach, as it tracks the change in sectors’ weights within the economy’s output, along with productivity changes and resource reallocation across sectors.
Comparison of sectoral contributions to labor productivity growth regarding different methods: focus on the 2018–2023 period

AGR, agriculture, hunting, forestry, and fishing; CONS, construction; CSPSGS, community, social, personal, and government services; FIRE, finance, insurance, real estate, and business services; MAN, manufacturing; MIN, mining and quarrying; PU, public utilities – electricity, gas, and water; TSC, transport, storage, and communications; WRT, wholesale and retail trade, hotels and restaurants.
Source: Authors’ calculations using Turkstat data
Conclusion
In this study, we decompose the overall labor productivity growth in Turkey into three components – within change, structural change, and sectoral relative price change – over the period 1999–2023. The last component does not appear in the conventional labor productivity decomposition, which uses real output at constant prices, because it is attributed to the use of chain-linked GDP as real output. While relative price changes cancel out at the aggregate level, they shape both the magnitude and direction of sectoral contributions to total labor productivity growth.
Yearly average contributions indicate that structural change has, on average, contributed slightly more to aggregate labor productivity growth than within-sector improvements. However, these contributions vary substantially over time. During the crisis periods of 1999–2001 and 2008–2009, structural change made a positive contribution, while the within component contributed negatively, resulting in overall negative labor productivity growth in those years. Focusing on the non-crisis periods – 2002–2007, 2010–2017, and 2018–2023 – reveals a pronounced and sustained slowdown in aggregate labor productivity growth in the latter two periods. Although both within and structural changes contributed to this decline, the weakening of the structural-change component has been more persistent and pronounced, reaching nearly zero in the final period.
Sectoral decomposition highlights the main drivers of this slowdown. The decline in construction comes from both within-and structural-change components; in finance and real estate, from structural change; in community, personal, and government services, primarily from relative price effects; and in transport and communication, mainly from within-sector productivity losses. The contribution of manufacturing remained quantitatively stable but changed in composition: while it was previously driven by within-sector productivity, in the most recent period structural and relative price changes became more influential, whereas the within-sector contribution nearly disappeared – an issue which needs further investigation at the firm level. On the other hand, the rising within-sector contribution of trade across these three periods and that of finance and real estate in the last period mitigated an even sharper decline in the aggregate within component. Averaging across the full twenty-five-year period, trade emerges as the largest contributor to aggregate labor productivity growth (through both within-and structural-change), followed by community, personal, and government services (through relative prices), manufacturing (through within-change), transport and communication (through within-change), and finance and real estate (through structural change).
Methodologically, our decomposition method and Diewert (Reference Diewert2015) produce similar results for the entire period and sub-periods at both the aggregate and sector levels. However, the findings from the shift-share method using the chained-volume GDP series differ from those obtained through the exactly additive decomposition method. These differences become more noticeable when relative price changes are significant. Conversely, we observe similar results with the previous-year-price-based labor productivity growth decomposition at the aggregate level, including sector contributions through within-and structural-change components. Nevertheless, our method offers a more comprehensive view of sectoral dynamics by allowing the tracking of relative sectoral price changes. As a result, our method is more effective at analyzing how changes in sectors’ weight in the aggregate output contribute to overall labor productivity growth alongside traditional components. Still, the main narrative at the aggregate level over the past twenty-five years remains consistent across all methods: the contribution of structural change is marginally higher than that of within-change, on average, during this period, although its influence has begun to decline since the 2010s. This underscores the urgent need for policy reforms that promote efficient resource allocation within sectors and across firms, as well as policies aimed at technological improvements.
Supplementary material
To view supplementary material for this article, please visit https://doi.org/10.1017/npt.2026.10082
Acknowledgments
The authors thank the editor and the anonymous referees for their valuable comments and suggestions, which greatly improved the paper. We are also grateful to Erol Taymaz and Emin Tatar for their constructive feedback, which helped improve the exactly additive decomposition method proposed in this study. We further thank the participants of the thirtieth Turkish Economic Association (TEA) Conference and the seminar participants at Marmara University and MEF University for their valuable comments and insights.
Competing interests
None.


 Open access