


Introduction
Communities can be loosely defined as a set of locally co-occurring species that can potentially interact. Several years ago, the study of these coexisting species, or community ecology, was deemed to be a mess of contingencies, with each system apparently following local rules and no way of predicting with any confidence what assembly and interaction rules a new, previously unstudied community would follow (Lawton, Reference Lawton1999). The lack of universal laws or predictable patterns seemed like an insurmountable obstacle towards understanding how species interact and coexist over time. Since then, however, much theoretical progress has been achieved to explain the various structuring forces acting to shape natural communities and determine their diversity and stability (Morin, Reference Morin2011; Vellend, Reference Vellend2017; Leibold and Chase, Reference Leibold and Chase2018). Similarly, the community ecology of host–parasite interactions has also long sought to identify general underlying patterns and associated processes. On the scale of parasite species coexisting within the same host individual or the same host species, predictable gradients in parasite diversity or in the importance of interspecific interactions among parasites have long been known to exist (Esch et al., Reference Esch, Bush and Aho1990). However, at the larger scale of the entire host community including all their unique and shared parasites, generalizations have proven to be more elusive (Poulin, Reference Poulin2007), hindering progress in our understanding of host–parasite coevolution and parasite-mediated maintenance of biodiversity.
The use of network analysis has greatly remedied this, by providing a holistic tool for the study of host–parasite interactions within local communities (Poulin, Reference Poulin2010; Runghen et al., Reference Runghen, Poulin, Monlleó-Borrull and Llopis-Belenguer2021). Network analysis considers hosts and parasites as interconnected entities, thus capturing not only all species in a system, but also the interactions themselves, or links, between species. By treating hosts and parasites as 2 mutually interacting sets of species in a bipartite network, one can use a range of whole-network metrics to explore various structural aspects of the network, as well as species-level metrics to evaluate the role of individual species within the network.
At the whole-network level, the 3 most widely used and informative metrics are connectance, nestedness and modularity (Delmas et al., Reference Delmas, Besson, Brice, Burkle, Dalla Riva, Fortin, Gravel, Guimarães, Hembry, Newman, Olesen, Pires, Yeakel and Poisot2019). Connectance, which is simply the proportion of all possible links that are realized, may be an important determinant of the stability of the network and its resilience to species loss (Delmas et al., Reference Delmas, Besson, Brice, Burkle, Dalla Riva, Fortin, Gravel, Guimarães, Hembry, Newman, Olesen, Pires, Yeakel and Poisot2019). Nestedness provides a measure of the heterogeneous distributions of links among species (Bascompte et al., Reference Bascompte, Jordano, Melian and Olesen2003). In a highly nested network, specialist parasites infect a subset of the host species infected by generalist parasites, whereas host species with few parasites harbour parasite species that form subsets of those infecting hosts with richer parasite faunas. Finally, modularity measures the extent to which the network is divided into groups of species, or modules, having many interactions among themselves but few interactions with the members of other modules (Delmas et al., Reference Delmas, Besson, Brice, Burkle, Dalla Riva, Fortin, Gravel, Guimarães, Hembry, Newman, Olesen, Pires, Yeakel and Poisot2019). Highly modular networks may indicate the existence of several distinct host–parasite coevolutionary units within the broader community. Nestedness and modularity are not totally independent of each other (Fortuna et al. Reference Fortuna, Stouffer, Olesen, Jordano, Mouillot, Krasnov, Poulin and Bascompte2010), and they both tend to covary with connectance (Delmas et al., Reference Delmas, Besson, Brice, Burkle, Dalla Riva, Fortin, Gravel, Guimarães, Hembry, Newman, Olesen, Pires, Yeakel and Poisot2019), however, they each capture different aspects of network architecture.
At the level of individual species, several metrics measure the importance, position or role of particular species within the network, as a way of quantifying how each species influences the community by maintaining its cohesion and connecting other species (Delmas et al., Reference Delmas, Besson, Brice, Burkle, Dalla Riva, Fortin, Gravel, Guimarães, Hembry, Newman, Olesen, Pires, Yeakel and Poisot2019). Among the most widely used are centrality measures. For example, betweenness centrality measures the proportion of times a species serves as a bridge on the shortest path connecting all other pairs of species within the network (Martín González et al., Reference Martín González, Dalsgaard and Olesen2010; Newman, Reference Newman2018). Closeness centrality, in contrast, measures the average proximity of a species to all other species in the network. Several other approaches exist to quantify the most influential species within a network (e.g. Salavaty et al., Reference Salavaty, Ramialison and Currie2020), each considering slightly different aspects of network topology to derive a measure of species importance.
Fish communities and the parasites they harbour have been the subject of several network analyses (e.g. Bellay et al., Reference Bellay, de Oliveira, Almeida-Neto, Pereira Lima, Takemoto and Luque2013, Reference Bellay, de Oliveira, Almeida-Neto, Mello, Takemoto and Luque2015). Many of these earlier studies consider only 1 or a few networks. Furthermore, the network-level or species-level metrics they use are based on different algorithms or computed with different criteria, and are therefore not easily comparable (Pellissier et al., Reference Pellissier, Albouy, Bascompte, Farwig, Graham, Loreau, Maglianesi, Melián, Pitteloud, Roslin, Rohr, Saavedra, Thuiller, Woodward, Zimmermann and Gravel2018; Xing and Fayle, Reference Xing and Fayle2021). Yet, a synthetic look at these fish–parasite networks can shed light on several key drivers of parasite community structure. For instance, at the whole-network level, do fundamental network properties such as connectance, nestedness and modulary vary along a latitudinal gradient? Given the generally higher species richness in tropical ecosystems (Willig et al., Reference Willig, Kaufman and Stevens2003) and the tendency for consumers to be more specialized at low latitudes (Vázquez and Stevens, Reference Vázquez and Stevens2004; Krasnov et al., Reference Krasnov, Shenbrot, Khokhlova, Mouillot and Poulin2008), we might expect variation in fish–parasite network properties as a function of latitude (see Guilhaumon et al., Reference Guilhaumon, Krasnov, Poulin, Shenbrot and Mouillot2012). At the species level, does the taxonomic affiliation of given parasite species, or their basic traits such as mode of transmission, determine their position within the network, measured as their centrality? Results from Bellay et al. (Reference Bellay, de Oliveira, Almeida-Neto, Pereira Lima, Takemoto and Luque2013, Reference Bellay, de Oliveira, Almeida-Neto, Mello, Takemoto and Luque2015) suggest they might, as does an analysis of parasite species roles in whole food webs (Poulin et al., Reference Poulin, Krasnov, Pilosof and Thieltges2013).
Here, following earlier studies by Bellay et al. (Reference Bellay, de Oliveira, Almeida-Neto, Pereira Lima, Takemoto and Luque2013, Reference Bellay, de Oliveira, Almeida-Neto, Mello, Takemoto and Luque2015), we assembled a dataset comprising all publicly available host–parasite bipartite interaction networks involving fish and metazoan parasites, and subjected them to standardized analyses in order to obtain comparative data. Specifically, we address the following simple and basic questions: (i) while controlling for network size, do connectance, nestedness and modularity of fish–parasite networks vary with latitude? and (ii) do taxonomy and transmission mode explain the centrality of parasite species within fish–parasite networks? Our study illustrates the power of network analysis to reveal key structuring forces shaping parasite communities. Along with the findings from other studies on fish–parasite networks, they shed further light on the ecology and evolution of host–parasite associations.
Methods
Network data compilation
A topic search of the Web of Science database was conducted in December 2021 using the search string: fish* AND (parasit* OR endoparasit* OR ectoparasit* OR helminth*) AND (network*). The 211 publications retrieved by the search were checked individually to identify those that provided a dataset, either available as Supplementary material or from a public repository, on fish–parasite bipartite interaction networks. We considered only networks involving metazoan parasites, from either freshwater or marine systems. If a few non-metazoan parasites were included in a network, we excluded them but still retained the network for further analysis. Some publications provided data from multiple networks, whereas some networks were re-used in more than 1 publication; we used each unique network only once in our analysis. When different versions of the same network were available, we only used the most complete one, i.e. the one with the most host and parasite species included. Here, we define a network as a set of fish and parasite species that co-occur in space and that can therefore potentially encounter each other and physically interact. In other words, we consider only local communities (e.g. a lake, a river stretch, a defined coastal area) as networks, and excluded all studies that assembled networks from continent-wide occurrence data (e.g. Braga et al., Reference Braga, Araújo and Boeger2014; Cruz-Laufer et al., Reference Cruz-Laufer, Artois, Smeets, Pariselle and Vanhove2021). Finally, all networks were unweighed (providing only presence or absence of each parasite species on each host species), and treated as such in analyses. In the end, our set of networks was almost the same as that compiled by Bellay et al. (Reference Bellay, de Oliveira, Almeida-Neto, Pereira Lima, Takemoto and Luque2013, Reference Bellay, de Oliveira, Almeida-Neto, Mello, Takemoto and Luque2015).
For each network, we recorded the following whole-network properties: the number of host species, the number of parasite species, the number of host–parasite links and the latitude of the network locality (estimated using Google Maps if not given in the original study). Additionally, each parasite species in each network was classified by (i) mode of infection, either via trophic transmission or by contact with external surfaces (whether or not tissue penetration ensued), and by (ii) higher taxon, i.e. myxozoans, hirudineans, molluscs, branchiurans, isopods, copepods, monogeneans, larval trematodes, adult trematodes, cestodes, nematodes and acanthocephalans. Larval and adult trematodes were classified separately because of their different mode of transmission: larval cercariae attach to and penetrate fish skin to settle as metacercariae within fish tissue, whereas adult trematodes are acquired by ingestion of infected intermediate hosts.
Network analyses
All analyses were carried out in R (R Core Team, 2022). For each network, using the package bipartite v. 2.16 (Dormann et al., Reference Dormann, Gruber and Fründ2008), we computed connectance, nestedness and modularity. Connectance and nestedness were calculated using the networklevel function, whereas modularity was calculated using the computeModules function. Connectance can vary between 0 and 1 (when all possible links are realized). Nestedness was measured as Weighted Nestedness based on Overlap and Decreasing Fill, or WNODF (Almeida-Neto and Ulrich, Reference Almeida-Neto and Ulrich2011); values can range between 0 (not nested) and 100 (fully nested). Modularity was estimated using the Q measure proposed by Newman and Girvan (Reference Newman and Girvan2004), which ranges from 0 (prevalent links among modules) to 1 (most links within modules). Since WNODF and Q values are influenced by network size (total number of host and parasite species), they cannot readily be compared among networks. Instead of attempting to standardize them, we simply included network size as a predictor in the analyses (see below), to directly control for its influence on the estimates of nestedness and modularity.
We confirmed that the 3 network properties are not fully independent and covary with each other using pairwise Pearson's correlation coefficients: connectance vs nestedness: r = 0.898; connectance vs modularity; r = −0.608; nestedness vs modularity: r = −0.510 (all P < 0.005). We then tested for latitudinal gradients in these network properties, while controlling for variation in network size. For this, we used generalized linear models, 1 for each of the 3 network properties as response variables, with both latitude (absolute value, regardless of north or south) of the network and its size (sum of host and parasite species) as predictors. For these analyses, a gamma distribution was fitted to the connectance and nestedness data, whereas a Gaussian distribution was fitted to the modularity data.
Species-level analyses
Again using the package bipartite, we used the species level function to calculate both the betweenness centrality and the closeness centrality (defined in the Introduction) values of each parasite species in each network. Centrality measures are widely used to assess species importance to the structure of host–parasite networks. They identify the species that maintain the cohesion of the network by connecting or linking host species (Martín González et al., Reference Martín González, Dalsgaard and Olesen2010). Parasite species with a disproportionate number of host interactions or that connect otherwise unconnected groups of parasite species into the network have higher centrality values and represent connectors; in contrast, parasite species with little or no importance for the cohesiveness of the network have values close to or equal to 0, and represent peripheral parasites (Martín González et al., Reference Martín González, Dalsgaard and Olesen2010).
The 2 main predictors, i.e. parasite higher taxon and mode of transmission, that we are investigating are confounded, because for most higher parasite taxa the mode of transmission is the same for all species. Therefore, we tested their effects in separate analyses. With these 2 predictors tested separately on 2 response variables (betweenness centrality and closeness centrality), we therefore ran 4 generalized linear mixed models (GLMMs) fitted with a gamma distribution using the lme4 package (Bates et al., Reference Bates, Mächler, Bolker and Walker2015). The predictor ‘higher parasite taxon’ had multiple levels (12 higher taxa), whereas the predictor ‘transmission mode’ only had 2 levels (trophic transmission or skin contact). In the analyses of closeness centrality, the relatively few 0 values were replaced with 0.000001, which allowed using a gamma distribution without biasing the results. In contrast, for the analyses of betweenness centrality, we excluded all parasite species with a value of 0, which corresponds to species interacting with a single host species in their network, because there were too many of them. In all GLMMs, we also (i) included the number of host species used by a parasite as an additional predictor, to account for the influence of host specificity on the estimates of centrality, and (ii) included network identity as a random factor, to account for the non-independence of parasite species from the same network.
Results
In total, we included data from 31 fish–parasite interaction networks (Table 1). These spanned almost 90° of latitude from north to south (most are from the Northern Hemisphere), and comprised from 6 to 91 fish species, from 14 to 420 parasite species and from 31 to 1085 host–parasite interaction links. Across networks, the numbers of host and parasite species covaried strongly (Pearson's correlation coefficient: r = 0.820, N = 31, P < 0.0001). The 31 networks also showed much variation in structure based on their basic properties (Fig. 1). Both the network-level and parasite species-level datasets are available in Supplementary material.
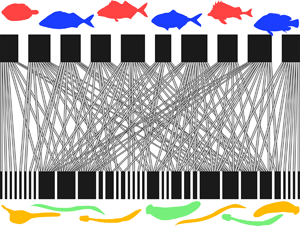
Examples of fish–parasite bipartite networks, with the fish hosts (top) and the parasites (bottom) represented by black rectangles, and the links between them indicated by connecting lines. (A) Two networks with similar numbers of fish hosts but very different connectance (Middle Parana River = 54 fish species, low connectance; Lake Alūksnes = 48 fish species, high connectance). (B) Two networks with identical numbers of fish hosts but very different nestedness (Lake St. Clair = 13 fish species, low nestedness; Tres Palos Lagoon = 13 fish species, high nestedness).

Fish–parasite interaction networks considered here, along with their basic properties

The networks are listed in descending order based on the number of fish species they include. The reference given is the one from which data matrices were obtained, and not necessarily the one where the data were first presented.
Network-level patterns
Across networks, values of both connectance and nestedness decreased with increasing network size, whereas modularity was independent of network size (Table 2). Therefore, larger interaction networks consisting of more species of fish and parasites have disproportionally fewer host–parasite links (Fig. 2) and tend to be less nested. We also found that of the 3 network properties considered here, only modularity covaried significantly with latitude (Table 2). Modularity values decreased with increasing latitude (Fig. 3), indicating that fish–parasite networks at higher latitudes tend to be less modular, while those closer to the equator are more modular, with most links occurring within distinct subsets of interacting species. The latitudinal gradient would be even clearer if 2 data points, corresponding to 2 Mexican lagoons (in lower left portion of Fig. 3), were excluded.
Connectance of fish–parasite interaction networks as a function of their size (sum of the numbers of host and parasite species).

Modularity value of fish–parasite interaction networks as a function of their latitude (regardless of north or south).

Results of generalized linear models testing the effects of latitude and network size (sum of host and parasite species) on 3 key network properties: connectance, nestedness and modularity

Species-level properties
Treating each species from a given network as unique (i.e. not accounting for the same species actually occurring in more than 1 network), the analysis comprised 3488 parasite species. The generalized linear mixed models found no evidence that a parasite's mode of transmission (trophic transmission vs skin contact) had any impact on its role within the interaction network as measured by either closeness or betweenness centrality (Tables 3 and 4). The number of host species used by a parasite, i.e. its host specificity, emerged as the main determinant of its centrality within the network. However, independently of the effect of the number of hosts used, there were differences in betweenness centrality among higher taxa of parasites (Table 4). Branchiurans, acanthocephalans and larval trematodes generally had higher centrality values than other parasite taxa (Fig. 4). In the analyses of betweenness centrality, species with a centrality value of 0, corresponding to species interacting with a single host species, were excluded. Since the proportion of species with a centrality value of 0 was lower among branchiurans, acanthocephalans and larval trematodes than among other parasite taxa (46 vs 67%), the greater betweenness centrality of species in these 3 taxa is actually even more pronounced than suggested by Fig. 4.
Betweenness centrality values (median and interquartile range) of parasite species within interaction networks with fish hosts, shown separately by parasite higher taxon. Only taxa with more than 20 species are shown; species with a centrality value of 0 are excluded. The number of species included is given in parentheses after each taxon's name.

Analysis of variance table summarizing the results of the GLMMs with closeness centrality of parasite species within interaction networks as the response variable, showing the effects of the main predictors

Analysis of variance table summarizing the results of the GLMMs with betweenness centrality of parasite species within interaction networks as the response variable, showing the effects of the main predictors

Species with a centrality value of 0 were excluded from the analyses.
Discussion
Treating communities of hosts and their parasites as interacting networks provides a comprehensive view of community structure, with the same analytical framework capable of addressing questions ranging from the species level to the assemblage level (Poulin, Reference Poulin2010; Delmas et al., Reference Delmas, Besson, Brice, Burkle, Dalla Riva, Fortin, Gravel, Guimarães, Hembry, Newman, Olesen, Pires, Yeakel and Poisot2019; Runghen et al., Reference Runghen, Poulin, Monlleó-Borrull and Llopis-Belenguer2021). Network analysis is proving a powerful tool to identify constraints and drivers of community assembly, as well as predict the responses of communities to perturbations (Poisot et al., Reference Poisot, Stouffer and Kéfi2016). Here we used this approach to determine whether basic properties of fish–parasite interaction networks show a latitudinal gradient after controlling for network size, and whether the position of individual parasite species within networks is associated with their taxonomy or transmission mode. Our analysis illustrates the usefulness of network analysis for investigations of host–parasite community structure and its determinants.
At the whole-network level, some of our findings support earlier ones. Across networks, the numbers of host and parasite species were strongly correlated, a pattern almost universally observed in comparisons across communities (Kamiya et al., Reference Kamiya, O'Dwyer, Nakagawa and Poulin2014). We also found that connectance decreases exponentially with increasing network size (number of species in the network), a result already found previously by Bellay et al. (Reference Bellay, de Oliveira, Almeida-Neto, Pereira Lima, Takemoto and Luque2013) on almost the same network dataset, as well as by other comparative studies of host–parasite networks (e.g. Mouillot et al., Reference Mouillot, Krasnov, Shenbrot and Poulin2008). Furthermore, as observed in most types of bipartite interaction networks in ecology (Delmas et al., Reference Delmas, Besson, Brice, Burkle, Dalla Riva, Fortin, Gravel, Guimarães, Hembry, Newman, Olesen, Pires, Yeakel and Poisot2019), we found that connectance correlates positively with nestedness and negatively with modularity.
More interestingly, we found that after accounting for variation in network size, fish–parasite networks at higher latitudes were only weakly modular, while tropical ones were more distinctly modular. We observed no latitudinal trend for either connectance or nestedness values. There have been very few attempts to find latitudinal gradients in the properties of antagonistic interaction networks (e.g. Guilhaumon et al., Reference Guilhaumon, Krasnov, Poulin, Shenbrot and Mouillot2012), and to our knowledge, this is the first to report a latitudinal gradient in modularity. The modularity vs latitude relationship we observed is even stronger when 2 data points are excluded (see Fig. 3, lower left portion). These correspond to 2 lagoons in Mexico (Violante-González and Aguirre-Macedo, Reference Violante-González and Aguirre-Macedo2007; Violante-González et al., Reference Violante-González, Aguirre-Macedo and Mendoza-Franco2007), the only 2 networks among the ones considered here composed of a mixture of freshwater and marine species. It is possible that the disparate origins of hosts and parasites in these lagoons created incompatibilities (e.g. inability of freshwater parasites to infect marine hosts) that weakened the network's modularity. Alternatively, the low host specificity of many species of larval trematodes in these lagoons may have also contributed to reducing modularity. Strongly modular networks, in which most host–parasite links occur within distinct subsets of species, are essentially compartmentalized. Strong modularity is thought to promote community stability, because the impacts of perturbations such as extinctions are contained within a module and unlikely to spread to the rest of the community (Stouffer and Bascompte, Reference Stouffer and Bascompte2011). Strong modularity at low latitude may be the result of host–parasite associations being more likely to form small coevolutionary units, i.e. small groups of host and parasite species that evolve in tandem more or less independently of the rest of the community, in these species-rich environments (Delmas et al., Reference Delmas, Besson, Brice, Burkle, Dalla Riva, Fortin, Gravel, Guimarães, Hembry, Newman, Olesen, Pires, Yeakel and Poisot2019). Therefore, not only are tropical host–parasite networks generally characterized by higher species richness (Willig et al., Reference Willig, Kaufman and Stevens2003) and greater consumer specialization (Vázquez and Stevens, Reference Vázquez and Stevens2004; Krasnov et al., Reference Krasnov, Shenbrot, Khokhlova, Mouillot and Poulin2008), but also their more distinct modular structure may influence their ecological persistence and the evolutionary trajectory of their species.
At the species level, generalist parasites, that is, those that use many host species, not surprisingly emerged as occupying central positions within networks. When accounting for the influence of the number of host species used, transmission mode had no effect on species' centrality measures. Instead of splitting parasites based on their mode of transmission, Bellay et al. (Reference Bellay, de Oliveira, Almeida-Neto, Pereira Lima, Takemoto and Luque2013) divided them based on whether they used a fish as an intermediate host (larval parasite) or as a definitive host (adult parasite), whereas Bellay et al. (Reference Bellay, de Oliveira, Almeida-Neto, Mello, Takemoto and Luque2015) divided them based on their site of infection (ecto vs endoparasites). Bellay et al. (Reference Bellay, de Oliveira, Almeida-Neto, Pereira Lima, Takemoto and Luque2013) found that parasite species occurring at larval stages within a network are involved in more links with hosts and in more among-module links, indicating greater centrality. In line with those findings, we found that larval trematodes have greater betweenness centrality values than adult trematodes. Independently of how many host species they use, we found that certain taxonomic groups, namely branchiurans, acanthocephalans and larval trematodes, have higher betweenness centrality values than other taxa of parasites. Since species with high betweenness centrality values are generally module connectors that contribute to whole-network cohesion (Delmas et al., Reference Delmas, Besson, Brice, Burkle, Dalla Riva, Fortin, Gravel, Guimarães, Hembry, Newman, Olesen, Pires, Yeakel and Poisot2019), this may reflect the ability of parasites in those 3 groups to infect host species that are phylogenetically distant. There is indeed evidence that generalist species in these 3 groups infect not only many host species, but distantly related hosts (Poulin and Mouillot, Reference Poulin and Mouillot2003; Poly, Reference Poly2008), resulting in their more influential role in shaping network structure. The role or position of a species in a network is not determined solely by its taxonomic affiliation, however; a large-scale analysis of helminth–vertebrate interactions indicates that a parasite species' role is not conserved across networks (Dallas and Jordano, Reference Dallas and Jordano2021), suggesting that the local community context also influences the patterns of species interactions.
Several recent studies have highlighted the usefulness of network analysis to explore various aspects of fish–parasite community interactions and evolution. For example, a network approach can be used to assess the vulnerability of different types of parasites to local host extinction (Bellay et al., Reference Bellay, de Oliveira, Almeida-Neto and Takemoto2020), or identify the host species most essential for the maintenance of local parasite diversity (Dallas and Cornelius, Reference Dallas and Cornelius2015). Network analysis can also provide insights into the impact of invasive fish species on host–parasite community structure (Llopis-Belenguer et al., Reference Llopis-Belenguer, Blasco-Costa, Balbuena, Sarabeev and Stouffer2020). As with all approaches, however, the reliability of the results obtained through network analysis depends on the quality of the data. Most fish–parasite network datasets available at present have been assembled based exclusively on the morphological identification of parasite species. Cryptic species are frequently found when gene markers are used to distinguish among morphologically similar helminths (Pérez-Ponce de León and Poulin, Reference Pérez-Ponce de León and Poulin2018). As a consequence, both network-level and species-level metrics are likely to change when host specificity and host–parasite associations are re-assessed with molecular data (Poulin and Keeney, Reference Poulin and Keeney2008). Also, most existing fish–parasite networks probably have many ‘missing links’, i.e. host–parasite associations not yet observed and thus not included in the network dataset. Solutions to this problem exist (e.g. Farrell et al., Reference Farrell, Elmasri, Stephens and Davies2022) but are yet to be widely implemented. Nevertheless, considering host–parasite communities as bipartite interaction networks remains the most holistic approach currently available to tackle not only unresolved questions about the structure of particular communities (Runghen et al., Reference Runghen, Poulin, Monlleó-Borrull and Llopis-Belenguer2021), but also to identify the main drivers of variation in key properties across different communities (Pellissier et al., Reference Pellissier, Albouy, Bascompte, Farwig, Graham, Loreau, Maglianesi, Melián, Pitteloud, Roslin, Rohr, Saavedra, Thuiller, Woodward, Zimmermann and Gravel2018; Xing and Fayle, Reference Xing and Fayle2021). The lack of universal rules that has long impeded progress in parasite community ecology (Poulin, Reference Poulin2007) may be over, with network analysis increasingly uncovering general and predictable patterns in how host–parasite associations are organized across within and among communities.
Supplementary material
The supplementary material for this article can be found at https://doi.org/10.1017/S0031182022000944.
Data availability
All network data files used in this study are available in the Supplementary material.
Acknowledgements
We thank Bahram Dezfuli and Tomáš Scholz, guest editors of this special thematic collection, for inviting us to contribute this article. We also thank 3 anonymous reviewers for useful and constructive comments on an earlier version.
Author contributions
R. P. conceived the study; C. M. compiled the network data, analysed it and prepared the figures with input from R. P. at all stages; R. P. wrote the manuscript, with input from C. M.
Financial support
C. M. was supported by a Summer Research Bursary from the Department of Zoology, University of Otago.
Conflict of interest
None.
Ethical standards
Not applicable.


 Open access