





Impact statement
Dust storms are an important but poorly understood environmental hazard in California, with consequences that extend beyond episodic air quality degradation. This review synthesizes current understanding of the causes, impacts and future trajectory of dust storms in the state, highlighting how climate change, water management, and land use are reshaping dust emissions and community exposure. By integrating research across multiple disciplines, this article provides a holistic assessment of the wide-ranging impacts of dust storms, including effects on human health, public safety, agricultural productivity, renewable energy generation, water resources and ecosystem function. This review documents how dust disproportionately impacts vulnerable and underserved communities, raising critical environmental justice concerns and underscoring the need for inclusive, community-informed mitigation and adaptation strategies. It also identifies key gaps in knowledge that currently limit effective responses to dust storms, with particular emphasis on limitations in forecasting dust events and their associated impacts. Using California as a case study, this review offers actionable insights for researchers, state agencies, community organizations and decision-makers seeking to reduce dust-related risks to the state’s population and environment. While focused on California, the processes, impacts and management challenges discussed here are broadly relevant to dryland regions worldwide, making this work applicable to efforts aimed at improving resilience to dust storms under a changing climate.
Introduction
When strong winds sweep across deserts, fallow fields and other landscapes prone to erosion, they can lift tiny soil particles – commonly known as dust – into the atmosphere. Dust is nominally defined as solid, rock-derived soil particles that are suspended in the atmosphere (Shao, Reference Shao2000; Kok et al., Reference Kok, Parteli, Michaels and Karam2012), and the phenomenon of the lifting of these particles into the overlying air, known as wind-blown erosion, escalates into a dust storm when it occurs on a sufficiently large and sustained scale (McTainsh and Pitblado, Reference McTainsh and Pitblado1987). Smaller-scale dust events, such as dust devils, can last minutes to hours and affect areas as small as a few square meters (Gillette and Sinclair, Reference Gillette and Sinclair1990; Neakrase et al., Reference Neakrase, Balme, Esposito, Kelling, Klose, Kok, Marticorena, Merrison, Patel and Wurm2016), whereas major dust storms can last for hours to days and transport material thousands of kilometers from the initial sites of emission. Both smaller and larger dust events can result in millions of dollars in damage, adversely affect human health (Bhattachan et al., Reference Bhattachan, Okin, Zhang, Vimal and Lettenmaier2019; Livingstone and Warren, Reference Livingstone and Warren2019; Jones and Fleck, Reference Jones and Fleck2020), and exert an influence on climate, weather, water resources, ecosystems and human health (Field et al., Reference Field, Belnap, Breshears, Neff, Okin, Whicker, Painter, Ravi, Reheis and Reynolds2010).
Typically, large-scale dust events are initiated by synoptic-scale weather systems, such as a cold front that results in strong turbulent winds driving dust emissions (Duniway et al., Reference Duniway, Pfennigwerth, Fick, Nauman, Belnap and Barger2019), while local-scale dust events are commonly the result of smaller circulations, such as convective weather systems, which can produce downdrafts that result in strong surface winds (Middleton, Reference Middleton1986). Dust storms typically occur in semi-arid and arid regions and preferentially in locations like topographic lows, since they are oftentimes devoid of vegetation and contain suitable amounts of fine material available to be lofted into the air (Prospero et al., Reference Prospero, Ginoux, Torres, Nicholson and Gill2002). However, anthropogenic influences, such as water diversion (Micklin, Reference Micklin2007) and agricultural activity (D’Odorico et al., Reference D’Odorico, Rosa, Bhattachan, Okin, D’Odorico, Porporato and Wilkinson Runyan2019; Adebiyi et al., Reference Adebiyi, Kibria, Abatzoglou, Ginoux, Pandey, Heaney, S-H and Akinsanola2025), can result in changes to the landscape significant enough to create new source regions for dust storms to occur. Furthermore, planetary warming from increasing the atmospheric concentration of greenhouse gases might also have contributed to increased dust emissions through enhanced aridity and soil exposure in many drylands (Kok et al., Reference Kok, Storelvmo, Karydis, Adebiyi, Mahowald, Evan, He and Leung2023). At the same time, elevated atmospheric CO2 can stimulate vegetation growth in some regions by reducing plant water losses (Smith et al., Reference Smith, Reed, Cleveland, Ballantyne, Anderegg, Wieder, Liu and Running2016), thereby decreasing bare soil cover and thus dust emissions (Mahowald and Luo, Reference Mahowald and Luo2003). As such, the net effect of climate change on dust emissions remains uncertain and likely varies regionally (Kok et al., Reference Kok, Storelvmo, Karydis, Adebiyi, Mahowald, Evan, He and Leung2023). It is estimated that at present, globally, approximately 2 billion tons of PM10 dust (particulate matter with an aerodynamic diameter < 10 μm) is emitted and transported every year (Shao et al., Reference Shao, Wyrwoll, Chappell, Huang, Lin, McTainsh, Mikami, Tanaka, Wang and Yoon2011; Kok et al., Reference Kok, Adebiyi, Albani, Balkanski, Checa-Garcia, Chin, Colarco, Hamilton, Huang, Ito, Klose, Leung, Li, Mahowald, Miller, Obiso, Pérez García-Pando, Rocha-Lima, Wan and Whicker2021).
Given the pervasive nature of dust storms and the natural and human factors that are causing changes in these events over time, quantifying and addressing the wide array of dust impacts on humans and the environment requires a holistic assessment. This review represents an attempt to generate such an assessment specific to the state of California. California is an amenable study region in multiple dimensions: first, the state’s geography is highly varied, including coastal, montane, semi-arid and arid regions, which allows us to consider a diversity of landscapes that emit dust and that are broadly representative of large swaths of the globe. Second, California has been a policy laboratory for dust mitigation for many years (e.g., Owens Lake), and features an important and growing source region of active policy interest (Salton Sea). Finally, the state has a large, diverse population exposed to dust storms and dust transport more broadly, and is the epicenter of public health research on important dust-vegetation related health hazards like Valley fever. Furthermore, to meet the federal National Ambient Air Quality Standards, the State Implementation Plan includes a specific emphasis on addressing windblown dust as a major component of particulate matter. California is thus a state eager to understand the sources, impacts and mitigation options for dust with much greater detail and precision to design better and more equitable remediation strategies.
This review attempts to present a comprehensive summary of the current state of knowledge of dust storms in California, including: (i) where dust storms occur, (ii) the features contributing to their geographic distribution, (iii) factors driving historical and likely future changes in dust, (iv) the impact dust storms have on human health, the economy and environment and (v) an assessment of what is needed to mitigate or adapt to those impacts. The purpose of this review is to be a resource to scholars, community-based organizations, state agencies and policymakers on dust storms in California. The information here is intended to help guide future adaptation and mitigation efforts while also identifying the knowledge gaps that impede those efforts. This review can also provide a framework for generating similar assessments for other regions.
This review article is organized as follows: In “Sources of Dust in the State” section, we provide a description of how dust storms are generated, historical changes in dust in California and the human activities that have affected the amount of dust emitted within the state. In “Impacts of Dust Storms” section, we discuss the broad range of impacts of dust storms on the state’s natural and human environments. This is followed in “The Future of Dust in California” section by an assessment of the drivers of likely future changes in dust, including the effects of global warming and direct anthropogenic changes to the landscape. We conclude this review with a discussion of dust mitigation and adaptation strategies that includes a framework for implementing dust forecasting and an early warning system as a cost-effective strategy to minimize the adverse impacts of dust storms.
Sources of dust in the state
Dust is generated from a variety of arid to semi-arid, sparsely vegetated landscapes with erodible or disturbed soils composed of fine-grained particles that experience strong winds. This includes large parts of California (Figure 1): the valleys to the east of the Sierra range, which includes Owens and Mono Lakes (yellow), the San Joaquin Valley (orange), the vast swath of the Mojave Desert that covers much of the southern half of the state (blue), and the far eastern portion of the Sonoran Desert (green), which includes the Salton Trough, a north–south oriented rift valley containing the rapidly desiccating Salton Sea (pink). These regions where dust storms occur encompass an area greater than 55,000 square miles and are home to nearly 5 million Californians. To put these numbers in perspective, this is an area and a population greater than nearly half of the states in the US.
Regions of the state where dust storms occur. Highlighted are regions of California where significant dust storms have been reported either in peer-review publications or the media or have been observed by the report authors in-situ or via satellite imagery.

Figure 1. Long description
The map displays five color-coded regions overlaid on a topographical map of California.
* The San Joaquin Valley is highlighted in orange, forming a large, elongated vertical corridor through the center of the state, stretching from Stockton in the North down to Bakersfield in the South.
* The Owens-Mono Lakes region is highlighted in yellow, located East of the Sierra Nevada Mountains in the East-Central part of the state.
* The Mojave Desert is highlighted in light blue, covering a vast area in the Southeast, including Lancaster, Victorville, and the Mojave National Preserve.
* The Sonora Desert is highlighted in light green, situated in the extreme Southeast corner of the state, East of the Salton Sea.
* The Salton Trough is highlighted in pink, located in the South, encompassing the area around the Salton Sea and extending toward the Southern border.
The Northern half of the state and the coastal regions West of the San Joaquin Valley are shown with topographical green shading but are not highlighted as primary dust-producing regions.
Landscapes that give rise to dust emission
The primary sources of dust emission in California (Figure 2) are arid - defined as receiving less than 250 mm of annual precipitation - open landscapes that experience strong winds (Bullard et al., Reference Bullard, Harrison, Baddock, Drake, Gill, McTainsh and Sun2011; Kolesar et al., Reference Kolesar, Schaaf, Bannister, Schreuder and Heilmann2022). Playas, which are oftentimes dry lakebeds, are responsible for the majority of dust emissions from these landscapes (Gillette et al., Reference Gillette, Ono and Richmond2004; Maffia et al., Reference Maffia, Dinuccio, Amon and Balsari2020). Sand dunes and active sand fields contain much less fine sediment and hence make a smaller contribution (Huang et al., Reference Huang, Kok, Martin, Swet, Katra, Gill, Reynolds and Freire2019); landforms that consist of loose erodible material, such as dry fluvial (stream erosion) and alluvial (stream deposition) systems, contain large amounts of erodible material and are some of the most productive sources of dust emission (King et al., Reference King, Etyemezian, Sweeney, Buck and Nikolich2011; Kolesar et al., Reference Kolesar, Schaaf, Bannister, Schreuder and Heilmann2022).
Typical landforms that emit dust in California. Shown are (clockwise from top-left) the Owens (dry) lake (source: Brian Russell and the Great Basin Unified Air Pollution Control District), a dry wash in the Imperial Valley, sand dunes and fallow cropland.

Figure 2. Long description
A multi-panel set of four photos.
* Top-left panel: A wide-angle view of Owens dry lake. A massive, dense white dust plume rises from the flat lake bed, driven by wind toward the right under a dark, cloudy sky. Dark mountain ranges are visible in the background.
* Top-right panel: A ground-level view of a dry wash in the Imperial Valley. The sandy ground is covered in fine ripples, with sparse desert shrubs lining the edges of the path. Light dust or sand is blowing across the surface.
* Bottom-right panel: A close-up of sand dunes. Fine grains of sand are being whipped off the crest of a large dune by high winds, creating a hazy, ethereal veil of dust against the shadowed side of the dune.
* Bottom-left panel: A view of fallow cropland. The foreground shows parallel tilled furrows in the soil. A thick, low-hanging haze of dust obscures the horizon, where a few distant trees are barely visible through the brown air.
An example of the types of landscapes that give rise to dust emission in California is the Owens Dry Lake, which, prior to mitigation efforts, was estimated to have generated 72,000 metric tons of PM10 throughout the 2000–2001 windy season (Ono, Reference Ono2006). There are additional regions in California that, as a result of shifting precipitation patterns and/or changes in water flow diversion, are vulnerable to generating similar events in the years to come, including the Salton Sea and Tulare Lake Basin (Chow et al., Reference Chow, Watson, Ashbaugh and Magliano2003; King et al., Reference King, Etyemezian, Sweeney, Buck and Nikolich2011). Thus, it is of critical importance to better understand the mechanisms and drivers of dust emission in California, as well as how dust emission in California has changed throughout the last century.
Anthropogenic dust emissions
In addition to identifying the natural sources of dust emission, it is also of critical importance to ascertain and quantify California’s anthropogenic sources of dust emission, some of which could be reduced or mitigated by changes in policies or management practices (Ginoux et al., Reference Ginoux, Prospero, Gill, Hsu and Zhao2012). There are two general categories of anthropogenic dust emissions: emissions resulting from anthropogenic changes in land cover, land use, and surface water flows and emissions resulting from anthropogenic changes to the climate (Zender et al., Reference Zender, Miller and Tegen2004).
There are both natural and human-impacted sources of dust in the state, each having unique types of activities that affect their dust emission potential (Figure 3). For example, natural grasslands and shrub grasslands are some of the least emissive landscapes in the state’s arid regions, whereas dry playas are very effective sources of dust into the atmosphere. Agriculture, off-road vehicles (ORV) and wildfire all produce changes to the landscape that reduce the cover of native vegetation and increase its emission potential. Fallowing and water diversion also increase susceptibility to wind erosion.
A conceptual diagram illustrating the various sources of dust in California, their dust emission potential and the frequency of soil disturbance. Adapted from Webb and Pierre (Reference Webb and Pierre2018).

Figure 3. Long description
The diagram uses three axes to plot various dust sources. The vertical Y-axis represents Soil Disturbance Frequency. The horizontal X-axis represents Dust Emission Potential. A third Z-axis, extending into the background, represents Vegetation Cover.
Sources with high vegetation cover are positioned in the foreground on the left. These include three green pillars of increasing height: Natural Grassland (lowest disturbance), Shrub Grassland, and Shrubland (highest disturbance in this group).
Sources with low vegetation cover are positioned in the background on the right. These include:
- Fallow Fields: A short yellow pillar with low disturbance and moderate emission potential.
- Playas: A short yellow pillar with low disturbance but higher emission potential than fallow fields.
- Water Diversion: A medium-height blue pillar with moderate disturbance and high emission potential.
- Commercial Agriculture: A tall olive-green pillar with high disturbance and moderate emission potential.
- Off Roads: A tall dark blue pillar with high disturbance and high emission potential.
- Wildfire: The tallest orange pillar, located at the furthest point of the axes, representing the highest soil disturbance frequency and highest dust emission potential.
Environmental engineering
One of the primary anthropogenic drivers of dust emission within California is the diversion of flowing water for agricultural and urban development (Pelletier, Reference Pelletier2006). Water diversion has occurred throughout the state at various locations, such as the Owens Valley-Mono Basin (Owens Valley) (Gillette et al., Reference Gillette, Ono and Richmond2004; Ono et al., Reference Ono, Kiddoo, Howard, Davis and Richmond2011), Salton Sea (King et al., Reference King, Etyemezian, Sweeney, Buck and Nikolich2011; Jones and Fleck, Reference Jones and Fleck2020) and Tulare Lake (Chow et al., Reference Chow, Watson, Ashbaugh and Magliano2003). There has been some initial success during the 21st century in reducing dust emission from these regions (Gutrich et al., Reference Gutrich, Gigliello, Gardner and Elmore2016), although more recent data indicate that dust emission in the Owens Valley is increasing again as a result of the ongoing and increasing aridity of the region (Borlina and Rennó, Reference Borlina and Rennó2017).
Shifts in plant community composition
Arid landscapes, which are the primary dust-emitting regions within the state of California, have also started to experience shifting vegetation patterns due to anthropogenic activities, such as the development of infrastructure and agriculture, as well as due to the effects of climate change (Finch, Reference Finch2012; Webb and Pierre, Reference Webb and Pierre2018). There are projections that many of California’s deserts, such as the Mojave, are expected to experience an expansion of scattered woody vegetation (shrubs) at the expense of relatively more continuous grass cover, as the climate continues to warm, atmospheric CO2 continues to increase and precipitation becomes increasingly irregular (Bachelet et al., Reference Bachelet, Ferschweiler, Sheehan and Strittholt2016). As these landscapes become increasingly dominated by sparse woody vegetation, the amount of bare soil susceptible to wind events increases, which is expected to result in an overall increase in dust emission throughout these regions (Ravi et al., Reference Ravi, Breshears, Huxman and D’Odorico2010; Bestelmeyer et al., Reference Bestelmeyer, Peters, Archer, Browning, Okin, Schooley and Webb2018).
Agriculture
Agricultural fields are a prominent source of anthropogenic dust that has ecological implications for the environment as well as serious medical consequences for local community members (Cahn and Phillips, Reference Cahn and Phillips2019; Wang et al., Reference Wang, Chen, Luo, Moran, Grieneisen and Zhang2019). California is home to the San Joaquin Valley, where over 340,000 people work in the agriculture industry, which produces more than $24 billion in annual revenue (Escriva-Bou et al., Reference Escriva-Bou, Hanak, Cole and Medellín-Azuara2023). However, the San Joaquin Valley is also home to the most polluted air within the United States (Billings et al., Reference Billings, Tran, Nolen, Moseley, Jump and Rappaport2016), which results in excessive rates of respiratory and cardiovascular diseases (such as asthma, atherosclerosis, myocardial infarction and various forms of cancer) (Meng et al., Reference Meng, Rull, Wilhelm, Lombardi, Balmes and Ritz2010; Mills et al., Reference Mills, Dodge, Bush, Thompson and Shah2019). In a 2014–2015 survey of community members within the San Joaquin Valley, 91.8% of respondents were concerned with the air quality there (Veloz et al., Reference Veloz, Gonzalez, Brown, Gharibi and Cisneros2020). Dust emission is expected to intensify as the region continues to become increasingly arid and the amount of water available for irrigation decreases (Williams et al., Reference Williams, Cook and Smerdon2022). The San Joaquin Valley is also facing the possibility of fallowing approximately 900,000 acres (17.7% of the San Joaquin Valley’s agricultural fields) of cropland by 2040 as a result of shifting climatic conditions and the Sustainable Groundwater Management Act, which will likely increase the amount of dust emitted from agricultural fields (Escriva-Bou et al., Reference Escriva-Bou, Hanak, Cole and Medellín-Azuara2023; Adebiyi et al., Reference Adebiyi, Kibria, Abatzoglou, Ginoux, Pandey, Heaney, S-H and Akinsanola2025). These changes in land use and land cover have resulted in the development of new dust sources in California that previously were less susceptible to aeolian processes (Ayres et al., Reference Ayres, Kwon, Collins and Morales2022).
The activities surrounding the maintenance and development of agricultural fields are also a critical source of dust emission in arid and semi-arid environments such as California (Tanner et al., Reference Tanner, Katra, Haim and Zaady2016). Arid agricultural soils can emit up to six times more PM10 than if left undisturbed in their natural state, due to the disturbances that are necessary for the maintenance of agricultural systems (Katra, Reference Katra2020). These activities can have significant implications for the health of the agricultural workers that are maintaining these fields and to the members of the surrounding communities (May et al., Reference May, Romberger and Poole2012; Wall et al., Reference Wall, Nielsen and Six2015).
Vehicles
In the United States, ORV driving is one of the fastest-growing recreational activities, and California is the largest ORV market in the country, accounting for 10% of sales nationally (Global Market Insights, 2019). ORV driving results in extensive damage to the landscape (soil, flora and fauna) and is one of the most destructive uses of land (Goossens et al., Reference Goossens, Buck and McLaurin2012). The damage from ORVs can require decades without disturbance to recover, and that is if recovery is even possible (Ploughe and Fraser, Reference Ploughe and Fraser2022). The ORV market is projected to see sustained annual growth of almost 6% (Global Market Insights, 2019), which will likely result in increasing ORV activity as well as a greater amount of soil susceptible to aeolian dust emission.
In addition, ORVs are capable of producing large amounts of dust, particularly at the local scale, where it can pose a significant hazard to human health (McKenna Neuman et al., Reference McKenna Neuman, Boulton and Sanderson2009; Candeias et al., Reference Candeias, Vicente, Tomé, Rocha, Ávila and Célia2020). Research has shown that dust concentrations around an ORV can be up to 10,000 times (up to 1,000,000 μg m−3) higher than ambient dust levels (Goossens and Buck, Reference Goossens and Buck2009). The soil particles that ORVs emit frequently contain components that would otherwise remain attached to the soil surface and not become suspended, even during strong wind events (Ploughe and Fraser, Reference Ploughe and Fraser2022). This can be particularly dangerous if the soil is contaminated with chemical or organic compounds (Goossens et al., Reference Goossens, Buck and McLaurin2012).
Other direct disturbance of the surface
Other non-agricultural land-use disturbances can increase fugitive dust emissions wherever they remove vegetation or crusts, expose fine sediment and add repeated vehicle disturbance. Oil and gas development is one plausible source pathway (Adgate et al., Reference Adgate, Goldstein and McKenzie2014), especially in the San Joaquin Valley/Kern County and the Los Angeles Basin, where oil and gas activity is concentrated in California. Other disturbances, such as those associated with aggregate mining/earth moving facilities, geothermal projects and other forms of construction, have the potential to emit fugitive dust and are therefore subject to air quality management (e.g., BAAQMD 2023).
Wildfire
California’s climate is becoming increasingly vulnerable to the effects of climate change and fire suppression practices, and one of the consequences has been an intensification in both the frequency and intensity of wildfires (Khorshidi et al., Reference Khorshidi, Dennison, Nikoo, AghaKouchak, Luce and Sadegh2020). Over the last four decades, over 8.5 million ha have burned throughout California, and these fires have been growing in size and severity over time (Xu et al., Reference Xu, Westerling, Notohamiprodjo, Wiedinmyer, Picotte, Parks, Hurteau, Marlier, Kolden, Sam, Baldwin and Ade2022). In addition to the immediate ecological impacts and human cost, there is a significant and immediate effect on air quality and dust emission as a result of wildfires (Sankey et al., Reference Sankey, Glenn, Germino, Gironella and Thackray2010; Bowman et al., Reference Bowman, Williamson, Abatzoglou, Kolden, Cochrane and Smith2017; Schlosser et al., Reference Schlosser, Braun, Bradley, Dadashazar, MacDonald, Aldhaif, Aghdam, Mardi, Xian and Sorooshian2017).
Wildfires leave a completely altered and disturbed landscape with reduced vegetation. Since vegetation acts as a windbreak and covers the surface (Duniway et al., Reference Duniway, Pfennigwerth, Fick, Nauman, Belnap and Barger2019), fire-affected landscapes are often more vulnerable to aeolian and fluvial erosion (Ravi et al., Reference Ravi, D’Odorico, Zobeck, Over and Collins2007b; Duniway et al., Reference Duniway, Pfennigwerth, Fick, Nauman, Belnap and Barger2019). Wildfires also have the potential to modify both the physical and chemical properties of soil, which can induce soil-water repellency and decrease the threshold wind velocity needed for wind-driven dust emission to occur (Ravi et al., Reference Ravi, D’Odorico, Wang, White, Okin, Macko and Collins2009, Reference Ravi, D’Odorico, Breshears, Field, Goudie, Huxman, Li, Okin, Swap and Thomas2011). Finally, increased intensity of recent wildfires is associated with a longer “disturbance window” before ecosystems recover and when post-fire soils are therefore more susceptible to mobilization as dust (Sankey et al., Reference Sankey, Wallace and Ravi2013; Yu and Ginoux, Reference Yu and Ginoux2022). As such, there is a significant increase in dust emission following wildfires, suggesting an increase in dust emission as climate change continues to increase fire risk (Wagenbrenner et al., Reference Wagenbrenner, Germino, Lamb, Robichaud and Foltz2013; Yu and Ginoux, Reference Yu and Ginoux2022).
Drought
Since the beginning of the 21st century, California has experienced unprecedented drought conditions that have resulted in the driest period (2000–2021) the state has experienced over the last 1,200 years (Williams et al., Reference Williams, Cook and Smerdon2022). Current forecasts are that this drying trend will continue throughout the state and the southwest as a whole (Seager and Vecchi, Reference Seager and Vecchi2010; Ting et al., Reference Ting, Seager, Li, Liu and Henderson2018). This increase in overall aridity, as well as the corresponding decrease in soil moisture, has already contributed to a significant (240%) increase in aeolian activity since the 1990s throughout the southwestern US (Tong et al., Reference Tong, Wang, Gill, Lei and Wang2017). As the region continues to experience increasing levels of aridity, there will likely be corresponding increases in aeolian activity and wind-driven dust emission (Neff et al., Reference Neff, Ballantyne, Farmer, Mahowald, Conroy, Landry, Overpeck, Painter, Lawrence and Reynolds2008; Field et al., Reference Field, Belnap, Breshears, Neff, Okin, Whicker, Painter, Ravi, Reheis and Reynolds2010; Webb and Strong, Reference Webb and Strong2011).
Dryland vegetation-dust interactions
Deserts exhibit a distinctive patchy landscape with a mosaic of vegetated areas interspersed with bare ground across various spatial scales, often tied to specific microtopographic features. This patchiness reflects a close interplay among vegetation distribution and surface transport processes of water, water-borne sediment and wind-blown soil and dust, highlighting important interactions between geomorphic processes and dryland vegetation (Ravi et al., Reference Ravi, D’Odorico, Breshears, Field, Goudie, Huxman, Li, Okin, Swap and Thomas2011). Thus, understanding the complex interactions among wind erosion, vegetation dynamics and soil processes is crucial for the effective management and conservation of arid and semi-arid ecosystems, as well as addressing desertification challenges and predicting changes in dust sources and dust emission rates.
Vegetation and recurrent aeolian landforms
In grasslands, bare and grassy patches alternate over small distances, especially on sloping terrain, creating a stepped topography (Parsons et al., Reference Parsons, Abrahams and Wainwright1996; Dunkerley and Brown, Reference Dunkerley and Brown1999; Nash et al., Reference Nash, Jackson and Whitford2004). Similarly, in shrublands, patchiness extends over a few meters, with bare swales and vegetation-covered mounds. Larger shrubs and trees contribute to a landscape characterized by alternating concave-upward intergroves and flatter groves (Berg and Dunkerley, Reference Berg and Dunkerley2004). In some cases, on sandy soils, vegetated patches are associated with more elevated geomorphic features consisting of soil mounds, typically at most 1–2 m tall. Often known as “coppice dunes” or “nebkas” (Figure 4), these landforms are induced by the ability of shrubs to trap aeolian sediment and therefore are preferential sites for dust deposition and accumulation (Ravi et al., Reference Ravi, D’Odorico and Okin2007a). These features can be observed across the arid and semiarid landscapes of California in the southeastern part of the State.
Coppice dunes in southeastern California. Suspended dust is visible in the background.

Vegetation and bare soil connectivity
Bare soil patches play a crucial role in aeolian erosion and dust emission (Li et al., Reference Li, Okin, Alvarez and Epstein2007; Okin, Reference Okin2008), water erosion rates (Wainwright et al., Reference Wainwright, Parsons, Schlesinger and Abrahams2002) and biogeochemical processes (Schlesinger et al., Reference Schlesinger, Reynolds, Cunningham, Huenneke, Jarrell, Virginia and Whitford1990). Furthermore, bare soil patches typically form a network of conduits (or “streets”), allowing for the movement of water, soil and dust, via wind or waterborne processes (Okin et al., Reference Okin, Parsons, Wainwright, Herrick, Bestelmeyer, Peters and Fredrickson2009). The dependence of dust emissions on vegetation cover is only incompletely captured by the fraction of ground surface area covered by vegetation because it also strongly depends on patch size, orientation of bare soil “streets” with respect to wind direction, as well as vegetation height (Okin et al., Reference Okin, Parsons, Wainwright, Herrick, Bestelmeyer, Peters and Fredrickson2009). Studies suggest that changes in functional and structural connectivity due to rapid vegetation shifts can lead to dryland degradation, with accelerated erosion and dust emission rates. Such rapid changes in vegetation composition have historically occurred as an effect of exotic grass invasions or native shrub encroachment induced by climatic variations or human activities (Van Auken, Reference Van Auken2000; D’Odorico et al., Reference D’Odorico, Okin and Bestelmeyer2012).
Shrub encroachment
Shrub encroachment is occurring worldwide, including the coastal and inland arid grasslands of California (Huang et al., Reference Huang, Anderegg, Dawson, Mote and D’Odorico2020) and has been related to global drivers (such as climate warming, nitrogen deposition, increased atmospheric CO2 concentration) as well as local land use practices (e.g., grazing and fire management) (Van Auken, Reference Van Auken2000; Turnbull et al., Reference Turnbull, Wainwright and Brazier2008; D’Odorico et al., Reference D’Odorico, Okin and Bestelmeyer2012). Indeed, woody plant encroachments in drylands typically occur with the replacement of a relatively continuous grass cover with scattered shrub vegetation bordered by bare soil patches. The larger fraction of bare soil typically observed in shrub-encroached landscapes (with respect to the grasslands they have replaced) allows for an increase in dust emissions and wind erosion, a phenomenon often known as “land degradation” because of the loss of nutrient-rich fine soil particles (D’Odorico et al., Reference D’Odorico, Okin and Bestelmeyer2012).
Erosion and deposition of nutrient-rich soil
Both wind and water erosion play crucial roles in maintaining the spatial heterogeneity of vegetation cover and soil resource distribution in arid and semi-arid environments. Particularly, wind erosion can remove nutrient-rich particles from the soil surface, irrespective of relief features (Larney et al., Reference Larney, Cessna and Bullock1999; Ravi et al., Reference Ravi, D’Odorico, Wang, White, Okin, Macko and Collins2009, Reference Ravi, Breshears, Huxman and D’Odorico2010) and plays a crucial role in the formation and dynamics of patchy distributions of vegetation and soil resources (Okin et al., Reference Okin, Murray and Schlesinger2001). Indeed, it has been observed (Charley and West, Reference Charley and West1975; Schlesinger and Pilmanis, Reference Schlesinger and Pilmanis1998) that shrub encroachment is associated with the formation of nutrient-rich shrub patches (known as “fertility islands”) bordered by nutrient-poor bare soil areas. The transition from relatively uniform grass cover to a heterogeneous shrub-dominated landscape with fertility islands is partially driven by wind-borne transport of nutrient-rich fine aeolian sediment from bare soil to vegetated patches, where it settles and remains sheltered by vegetation (Figure 5). These dynamics have an inherent positive feedback, whereby bare soil areas become increasingly nutrient-depleted, thus impeding vegetation growth therein and rendering them more susceptible to wind erosion, while shrubby patches accumulate and stabilize nutrient-rich soil particles (Okin and Gillette, Reference Okin and Gillette2001; Ravi et al., Reference Ravi, D’Odorico and Okin2007a; Graham et al., Reference Graham, Hirmas, Wood and Amrhein2008).
The role of aeolian processes in the transition from relatively grass cover to scattered shrub patches and coppice dunes (modified after D’Odorico et al., Reference D’Odorico, Okin and Bestelmeyer2012).

Figure 5. Long description
The flowchart consists of four panels labeled Roman numeral I through Roman numeral IV.
Panel I, titled Grassland, shows a continuous layer of low-lying grass across the ground surface. A downward arrow labeled Shrub Seed Dispersal leads to the next stage.
Panel II, titled Grassland with Scrubs, depicts two larger, branched shrub silhouettes emerging from the continuous grass cover. A downward arrow labeled Grazing, Fire Control, Warming leads to the next stage.
Panel III, titled Shrubland – ‘Fertility Islands’ and Bare Soil, shows the grass cover becoming fragmented. Two large shrubs are separated by a patch of bare soil. In the bare center, curved black arrows indicate Dust-producing Coarse sediment saltation. Red dots and a red upward arrow indicate Dust suspension. Yellow dashed arrows point downward toward the shrubs, labeled Deposition onto vegetated dunes. A downward arrow labeled Soil Erosion and Deposition leads to the final stage.
Panel IV, titled Shrub Duneland – Dust Emissions, shows the ground surface transformed into undulating mounds or coppice dunes. The shrubs now sit atop these raised mounds, while the area between them is a deep trough of bare soil. The same aeolian processes from Panel III are intensified: black arrows show sediment saltation in the troughs, red dots and arrows show dust suspension rising from the center, and yellow dashed arrows show continued deposition onto the vegetated mounds.
Enhanced wind erosion leads to the removal of organic carbon and nitrogen from the soil surface, altering soil fertility patterns and reinforcing landscape conditions that are suitable for wind erosion. These dynamics have been well-documented and explained by vegetation removal experiments in Southern New Mexico, where soils saw losses of nitrogen (up to 82% over a decade) and of plant available phosphorus (up to 62%) (Okin et al., Reference Okin, Gillette and Herrick2006). Other studies highlighted major losses of soil organic carbon, as well as of total soil nitrogen (Li et al., Reference Li, Okin, Alvarez and Epstein2007, Reference Li, Okin, Alvarez and Epstein2008, Reference Li, Okin, Alvarez and Epstein2009a, Reference Li, Okin and Epstein2009b).
Has the dust in California and the US Southwest increased?
Records of dust deposition from ice cores and other sedimentary records indicate that, globally, atmospheric dust increased by approximately 55% ± 30% since the pre-industrial period (the 1840s and 1850s) (Kok et al., Reference Kok, Storelvmo, Karydis, Adebiyi, Mahowald, Evan, He and Leung2023). In the southwestern US and California, dust emission likely increased with the arrival of settlers in the 19th century (Neff et al., Reference Neff, Ballantyne, Farmer, Mahowald, Conroy, Landry, Overpeck, Painter, Lawrence and Reynolds2008) and the significant rise in anthropogenic development and activities (Ngai, Reference Ngai2015; Olmstead and Rhode, Reference Olmstead and Rhode2017). Lake records in the Rocky Mountains in Colorado show an increase in dust emission that coincided with the accelerated settlement of the region, and the resulting dust emission was 500% higher than any other era during the last 5,000 years (Neff et al., Reference Neff, Ballantyne, Farmer, Mahowald, Conroy, Landry, Overpeck, Painter, Lawrence and Reynolds2008). More recently, data from the continuous aerosol ground observations from the Interagency Monitoring of Protected Visual Environments (IMPROVE) network show that the frequency of dust storms has increased substantially in the US Southwest and California since the late 1980s (Tong et al., Reference Tong, Dan, Wang and Lee2012, Reference Tong, Wang, Gill, Lei and Wang2017) (Figure 6). These increases in dust emission occurred during a relatively wet period in comparison to the recent “mega drought” that California is facing (Williams et al., Reference Williams, Cook and Smerdon2022). This suggests that anthropogenic activities in an increasingly arid environment will result in enhanced dust emission throughout California during the 21st century (Achakulwisut et al., Reference Achakulwisut, Anenberg, Neumann, Penn, Weiss, Crimmins, Fann, Martinich, Roman and Mickley2019; East and Sankey, Reference East and Sankey2020).
Measurements at a network of 23 IMPROVE stations across California and the US Southwest show an increase in the number of dust storms (light blue line) having a trend of approximately 23 (
$ \pm $
 10) storms per decade (black dashed line). After (Tong et al., Reference Tong, Wang, Gill, Lei and Wang2017).

Figure 6. Long description
A line graph with the horizontal X axis labeled Year, ranging from 1988 to 2011, and the vertical Y axis labeled Number of Dust Records, ranging from 0 to 100.
* The data is represented by a light blue line with open circular markers at each yearly data point.
* Starting in 1988 at approximately 15 records, the data fluctuates between 10 and 35 records until 2001.
* A major peak occurs in 2002, reaching approximately 90 records, followed by a sharp decline to about 30 records in 2005.
* From 2005 to 2011, the records increase again, peaking at approximately 80 in 2009 and ending near 70 in 2011.
* A black dashed linear trend line starts at approximately 10 on the Y axis in 1988 and rises steadily to approximately 65 by 2011, indicating a positive correlation over time.
One of the primary drivers of increasing dust emission at the state level has been the general decrease in soil moisture content, which has resulted in drier soils that are more susceptible to wind-driven erosion (Duniway et al., Reference Duniway, Pfennigwerth, Fick, Nauman, Belnap and Barger2019). Atmospheric circulation patterns (such as the El Niño/La Niña-Southern Oscillation, ENSO and Pacific Decadal Oscillation, PDO) have also been identified as meteorological controlling factors of dust emission (Achakulwisut et al., Reference Achakulwisut, Shen and Mickley2017). In addition to local dust emissions, another prominent source of dust to California is cross-Pacific transport (CPT), where dust from Asia and North Africa is transported across the Pacific Ocean and deposited throughout the Pacific coast of the US (Huang et al., Reference Huang, Qian, Liu, He, Zheng, Zhang and Gkikas2022b).
Impacts of dust storms
Dust and dust storms create a range of hazards with far-reaching social and economic implications for California and its residents (Figure 7). These include impacts of dust on environmental services that support the state (i.e., water, agriculture) and on the state’s expanding solar photovoltaic infrastructure, which provides energy services to millions. More directly, dust storms create acute public safety hazards through reduced visibility, lead to reduced recreation and other avoidance behaviors that can have important economic and welfare consequences, and – most importantly – pose direct threats to human health through both inhalation of the particles themselves and increased exposure to toxins or pathogens that are lofted into the air along with soil particles. Here, we discuss these dust impacts as a first step towards quantifying the damages attributable to dust in California. This type of estimate forms the backbone of standard benefit–cost analyses, enabling policymakers to decide how to optimally deploy mitigation resources for maximum benefit.
Schematic indicating key dust storm impacts on the environmental, health and economic domains.

Direct effects of dust on the human environment
Human health
Airborne dust is transported over long distances and contributes to adverse health outcomes for populations near and far from its sources (summarized in Figure 8) (Morman and Plumlee, Reference Morman and Plumlee2013). Inhaled dust poses a significant health risk, as fine particulate matter penetrates deep into the lungs, and the smallest particles, those having a diameter less than 2.5 microns, can enter the bloodstream, causing oxidative stress, inflammation and immune response issues (Fussell and Kelly, Reference Fussell and Kelly2021; Lwin et al., Reference Lwin, Tobias, Chua, Yuan, Thawonmas, Ith, Htay, Yu, Yamasaki, Roqué, Querol, Fussell, Nadeau, Stafoggia, Saliba, Sheng Ng and Hashizume2023; Tong et al., Reference Tong, Gill, Sprigg, Van Pelt, Baklanov, Barker, Bell, Castillo, Gassó, Gaston, Griffin, Huneeus, Kahn, Kuciauskas, Ladino, Li, Mayol-Bracero, McCotter, Méndez-Lázaro, Mudu, Nickovic, Oyarzun, Prospero, Raga, Raysoni, Ren, Sarafoglou, Sealy, Sun and Vimic2023). Epidemiological evidence links dust exposure to respiratory illness (e.g., difficulty breathing, coughing, decreased lung function, exacerbated asthma, chronic obstructive pulmonary disease) and cardiovascular disease (e.g., heart attacks, strokes) (Kanatani et al., Reference Kanatani, Ito, Al-Delaimy, Adachi, Mathews and Ramsdell2010; Johnston et al., Reference Johnston, Razafy, Lugo, Olmedo and Farzan2019; Jones and Fleck, Reference Jones and Fleck2020;Khammar et al., Reference Khammar, Nouri, Saber, Miri, Vatani and Maleki Roveshdi2023; Lwin et al., Reference Lwin, Tobias, Chua, Yuan, Thawonmas, Ith, Htay, Yu, Yamasaki, Roqué, Querol, Fussell, Nadeau, Stafoggia, Saliba, Sheng Ng and Hashizume2023). Dust may also contribute to allergic and atopic conditions, including eye diseases, by acting as an allergic adjuvant and enhancing allergic responses (Khammar et al., Reference Khammar, Nouri, Saber, Miri, Vatani and Maleki Roveshdi2023; Lwin et al., Reference Lwin, Tobias, Chua, Yuan, Thawonmas, Ith, Htay, Yu, Yamasaki, Roqué, Querol, Fussell, Nadeau, Stafoggia, Saliba, Sheng Ng and Hashizume2023). Emerging research also associates dust exposure with adverse birth outcomes, potentially affecting infant health and development and contributing to increased infant mortality risk (Kanatani et al., Reference Kanatani, Adachi, Sugimoto, Noma, Onishi, Hamazaki, Takahashi, Ito, Egawa, Sato, Go, Kurozawa, Inadera, Konishi and Nakayama2014; Altindag et al., Reference Altindag, Baek and Mocan2017; Heft-Neal et al., Reference Heft-Neal, Burney, Bendavid, Voss and Burke2020; Jones, Reference Jones2020; Moreira et al., Reference Moreira, Linares, Follos, Sánchez-Martínez, Vellón and Díaz2020; Viel et al., Reference Viel, Michineau, Garbin, Monfort, Kadhel, Multigner and Rouget2020). It is important to note that a majority of studies linking dust exposure to adverse health outcomes have used data from populations in Asia, Africa and Europe, with few studies focusing on US or California populations. Epidemiological studies in California are needed to clarify the relevant health impacts of dust and identify the highest risk communities.
Conceptual overview of major dust sources in California, associated exposure pathways and downstream health impacts. Dust originates from multiple landscape and activity types. The composition of dust, dominant exposures and health impacts vary by dust source.

Figure 8. Long description
The flowchart is organized into three horizontal tiers connected by downward-pointing arrows.
1. Sources (Top Tier): Six panels show environmental origins of dust: Arid Landscapes (sand dunes), Dry Lakebeds (cracked earth), Agriculture (tractor tilling), Fallow Fields (hay bales), Recreational Vehicles (A T V in desert), and Wildfires (burning forest).
2. Exposures (Middle Tier): Four circular icons represent how dust affects humans:
* Particulate Matter: A person coughing in a dust cloud.
* Pesticides and Heavy Metals: Chemical symbols for P b (lead) and A s (arsenic) next to a sprayer.
* Biologic Species (virus, bacteria, fungi): Microscopic view of various pathogens.
* Poor Outdoor Visibility: A hazy view of a highway road.
3. Health Impacts (Bottom Tier): A central human silhouette with highlighted internal organs is surrounded by a list of conditions:
* Left side: Respiratory Disease, Cardiovascular Disease, and Allergic Disease.
* Center-left: Adverse Pregnancy Outcomes, Neurological Impairment, and Immune Dysfunction.
* Right side: Metabolic and Renal Disease, Valley fever (coccidioidomycosis), and Injury and death from vehicular accidents.
A key worry in California is that dust often contains more than geogenic minerals. Dust – particularly from sources heavily impacted by human activity – often carries chemicals, including neurotoxic pesticides and heavy metals like lead, arsenic and cadmium, that can lead to chronic toxicity, endocrine disruption and increased cancer risks (Kim et al., Reference Kim, Kabir and Jahan2017; Fu and Xi, Reference Fu and Xi2020). These contaminants can accumulate in the body, affecting neurological development, immune function, kidney health and blood cell production (Chen and Lippmann, Reference Chen and Lippmann2009; Mahurpawar, Reference Mahurpawar2015; Lentini et al., Reference Lentini, Zanoli, Granata, Signorelli, Castellino and Dellaquila2017; Jia et al., Reference Jia, Li and Wang2018; Sall et al., Reference Sall, Diaw, Gningue-Sall, Efremova Aaron and Aaron2020). In addition to metals, dust can carry biologic species (fungi, bacteria, viruses) that directly cause illness or lead to enhanced inflammatory responses that increase the risk of pulmonary disease (Chellam et al., Reference Chellam, McEwen and Das2023; Vergadi et al., Reference Vergadi, Rouva, Angeli and Galanakis2022; Yang et al., Reference Yang, Kim, Park, McDowell and Kim2020; Yarber et al., Reference Yarber, Jenkins, Singh and Diokhane2023). In California (and across similar climates in the US and Mexico), dust exposures drive incidence of coccidioidomycosis (Valley fever) (Johnson et al., Reference Johnson, Gaab, Sanchez, Bui, Nobile, Hoyer, Peterson and Ojcius2014; Weaver et al., Reference Weaver, Keeney, Head, Heaney, Camponuri, Collender, Bhattachan, Okin, Eisen, Sondermeyer-Cooksey, Yu, Vugia, Jain, Balmes, Taylor, Remais and Strickland2025). This infection is caused by inhaling dust containing the fungi Coccidioides spp. Although the majority of symptomatic cases resolve for individuals with robust immune systems, symptoms may last for many months. Moreover, 5%–10% of cases will develop chronic pulmonary disease and 1%–4% develop disseminated disease, the most severe outcome that is characterized by the infection spreading to other organs of the body, such as the nervous or skeletal systems CDC, 2021). Between 2000 and 2018, California reported more than 65,000 coccidioidomycosis (Coccidioides spp.) cases, an 8-fold increase in annual incidence over that period, with case counts reaching record highs of ~9,000 in 2019 and ~ 12,500 in 2024 (Sondermeyer Cooksey et al., Reference Sondermeyer Cooksey, Nguyen, Vugia and Jain2020; California Department of Public Health, 2024). In addition, the geographic range of the disease is spreading (California Department of Public Health, 2024), and more regions are expected to become endemic under a changing climate (Gorris et al., Reference Gorris, Treseder, Zender and Randerson2019; Head et al., Reference Head, Sondermeyer-Cooksey, Heaney, Yu, Jones, Bhattachan, Campo, Wagner, Mgbara, Phillips, Keeney, Taylor, Eisen, Lettenmaier, Hubbard, Okin, Vugia, Jain and Remais2022; Heaney et al., Reference Heaney, Camponuri, Head, Collender, Weaver, Sondermeyer Cooksey, Yu, Vugia, Jain, Bhattachan, Taylor and Remais2024; Partlow et al., Reference Partlow, Penney and Houten2024).
The Environmental Protection Agency (Region 9) has been working in California to identify the health risks associated with the distribution of naturally occurring asbestos (NOA) that is easily suspended in the air as dust. Asbestos is a known human carcinogen that causes cancers in the lungs and lining of internal organs, in addition to asbestosis and respiratory diseases that constrain lung function (Hanley, Reference Hanley2001). NOA are long, thin, separable fibers derived from asbestiform minerals in rocks and soil formed through natural geological processes in the coastal ranges and foothills of the Sierra Nevada mountains (Van Gosen and Clinkenbeard, Reference Van Gosen and Clinkenbeard2011). The subsequent mining of NOA throughout California has exacerbated the human-induced disturbance of NOA-containing soils and rocks, but the full range of NOA distribution and associated human health effects remains underrecognized.
Public safety
Beyond direct and mediated health impacts, dust is also an important contributor to broader public safety concerns in California (Tong et al., Reference Tong, Gill, Sprigg, Van Pelt, Baklanov, Barker, Bell, Castillo, Gassó, Gaston, Griffin, Huneeus, Kahn, Kuciauskas, Ladino, Li, Mayol-Bracero, McCotter, Méndez-Lázaro, Mudu, Nickovic, Oyarzun, Prospero, Raga, Raysoni, Ren, Sarafoglou, Sealy, Sun and Vimic2023). Airborne dust poses a significant risk to transportation safety by impairing visibility on highways (e.g., Figure 9), thereby increasing the risk of car accidents (Li et al. Reference Li, Kandakji, Lee, Tatarko, Blackwell, Gill and Collins2018; Van Pelt et al., Reference Van Pelt, Tatarko, Gill, Chang, Li, Eibedingil and Mendez2020). National Highway Traffic Safety Administration (NHTSA) records from 1994 to 2011 indicate that dust/blowing sand, soil or dirt contributed to 17% of weather-related US highway fatalities, which were themselves around 17% of total traffic fatalities (Ashley et al., Reference Ashley, Strader, Dziubla and Haberlie2015).
At left is a southwestward-looking image from an ALERTCalifornia camera located in California’s central valley at 15:56 local time on November 11, 2024. A southeastward traveling haboob can be seen in the upper right-hand side of the image, which is traveling towards Highway 65. At right is an image from the same camera, but 1 minute later, with the highway totally obscured by dust from the event.

In California, researchers linked public transportation incident records (from the Statewide Integrated Traffic Records System, SWITRS) with data on weather and visibility, and satellite observations of aerosol optical depth, and found that wind-related weather accidents have doubled the fatality rate of other weather related accidents, and are associated with low visibility and high dust optical depth, pointing to dust as a major contributor to road travel risk (Bhattachan et al., Reference Bhattachan, Okin, Zhang, Vimal and Lettenmaier2019). Literature exploring the relationship between dust and aviation or sea travel is more sparse, but reviews of aviation reports have revealed dust devils as a source of equipment damage (Lorenz and Myers, Reference Lorenz and Myers2005; Baddock et al., Reference Baddock, Strong, Murray and McTainsh2013).
Recreation
Recreation, opportunities for adventure and enjoyment in the natural environment, can sometimes be disrupted by atmospheric dust through its impacts on both the environment and the individuals engaging in recreational activities. The potential impacts on recreation vary depending on the amount of dust, its composition and the specific recreational activity involved (Griffin and Kellogg, Reference Griffin and Kellogg2004; Hand et al., Reference Hand, White, Gebhart, Hyslop, Gill and Schichtel2016; Jung et al., Reference Jung, Cho and Shin2019). Exposure to airborne dust can have a range of effects, from irritation of the eyes, nose and throat to more severe consequences, such as the exacerbation of respiratory conditions. Inhaling dust can lead to a range of respiratory symptoms that diminish the enjoyment of recreational activities like hiking, biking or picnicking, and individuals are less inclined to spend time in recreational activities when high concentrations of PM10 are present (Jung et al., Reference Jung, Cho and Shin2019). In addition to health impacts, anthropogenic dust emissions also have broader environmental repercussions that affect the overall recreational experience by disrupting the natural beauty of recreational landscapes. Haze from airborne dust can significantly reduce visibility, obstructing scenic vistas and natural landscapes, thereby detracting from the aesthetic appeal of outdoor recreational areas (Mace et al., Reference Mace, Bell and Loomis2004; Miri et al., Reference Miri, Ahmadi, Ekhtesasi, Panjehkeh and Ghanbari2009; Poudyal et al., Reference Poudyal, Paudel and Green2013). Furthermore, particle pollution of water bodies can carry contaminants in aquatic environments, compromising water quality and diminishing opportunities for recreational activities like fishing or swimming (Gokul et al., Reference Gokul, Kumar, Prema, Arun, Balaji and Faggio2023).
Indirect effects of dust on humans via ecosystem services
Snowpack
Mountain snowpack is a critical resource in the western US for the supply of freshwater to irrigation, urban areas and industrial developments. Despite recent years exhibiting record snow in the Sierra Nevadas (e.g., winter 2022/2023), there is a long-term decreasing trend in snowpack across the state (Mote et al., Reference Mote, Li, Lettenmaier, Xiao and Engel2018). One factor affecting the amount of mountain snowpack is the deposition of dust. Dust settling on snow surfaces influences a range of environmental processes and systems. Dust plays a role in shaping natural ecosystems and human environments, from altering albedo to affecting the water balance (Seidel et al., Reference Seidel, Rittger, Skiles, Molotch and Painter2016). Snow presents the highest albedo of any natural surface, but the presence of impurities, such as dust, decreases snow albedo, especially in the visible wavelengths, thereby increasing absorption of solar energy. The darkening effect of dust accelerates snowmelt, altering the montane hydrological and regional energy balances (Warren and Wiscombe, Reference Warren and Wiscombe1980; Conway et al., Reference Conway, Gades and Raymond1996; Painter et al., Reference Painter, Barrett, Landry, Neff, Cassidy, Lawrence, Mcbride and Farmer2007; Kaspari et al., Reference Kaspari, McKenzie Skiles, Delaney, Dixon and Painter2015; Seidel et al., Reference Seidel, Rittger, Skiles, Molotch and Painter2016). Moreover, snowmelt acceleration reduces the natural storage of winter precipitation in snowpack with important socioeconomic implications for regions reliant on snowmelt for agriculture, hydropower generation and municipal water supplies. In the case of California, snowmelt plays a crucial role in sustaining water availability during the rainless months of the growing season (Dettinger and Cayan, Reference Dettinger and Cayan1995; Harpold and Molotch, Reference Harpold and Molotch2015). Changes in the timing of snowmelt also disrupt ecosystems that rely on consistent water availability, change plant phenology, control forest fire regimes, alter wildlife habitat suitability, species migration and biogeochemical cycling, with important impacts on species distributions, community composition, biodiversity and ecosystem functioning and services (Westerling et al., Reference Westerling, Hidalgo, Cayan and Swetnam2006).
Agriculture
California is the nation’s largest agricultural producer, growing nearly 100% of some of the country’s most treasured fruit and nut crops and serving the state, country and beyond with its vegetable and dairy production. In addition to agricultural activities enhancing dust emissions, dust itself has myriad impacts on the agricultural sector (Farmer, Reference Farmer1993; Stefanski and Sivakumar, Reference Stefanski and Sivakumar2009; Ahmadzai et al., Reference Ahmadzai, Malhotra and Tutundjian2023). While dust transport can bring important minerals to agricultural regions (Prospero et al., Reference Prospero, Barkley, Gaston, Gatineau, Campos, Sansano and Panechou2020), and some research has shown that in very high irradiance environments, dust that deposits directly on leaves can act like a sunscreen and alleviate photoinhibition (Li and Mu, Reference Li and Mu2018, Reference Li and Mu2021), most of the reported impacts are negative. Dust storms can directly cause physical damage to plants, and in most cases, dust deposition on leaves negatively impacts photosynthesis, including by blocking chlorophyll from absorbing incoming radiation (Meravi et al., Reference Meravi, Singh and Prajapati2021). Even in the absence of direct damage or dust deposition, increased aerosol optical depth leads to reduced crop yields. This is the sum of several different effects: reduced downwelling direct radiation leads to reduced photosynthesis and is not offset by any benefits from increased scattering light use efficiency (Hemes et al., Reference Hemes, Verfaillie and Baldocchi2020) and surface temperature impacts (Burney and Ramanathan, Reference Burney and Ramanathan2014; Proctor et al., Reference Proctor, Hsiang, Burney, Burke and Schlenker2018; Lobell and Burney, Reference Lobell and Burney2021). Beyond crops, dust storms can injure and kill livestock, resulting in asset as well as income loss for producers (Middleton, Reference Middleton2024). Moreover, the health impacts of dust exposure are more acute for the agricultural labor force who work outdoors (Schenker, Reference Schenker2000; Schenker et al., Reference Schenker, Pinkerton, Mitchell, Vallyathan, Elvine-Kreis and Green2009; Rodriquez et al., Reference Rodriquez, Stoecklin-Marois, Bennett, Tancredi and Schenker2014; Stoecklin-Marois et al., Reference Stoecklin-Marois, Bigham, Bennett, Tancredi and Schenker2015). Furthermore, even at low levels of ambient pollution, small changes in PM exposure are associated with a reduction in agricultural labor productivity, suggesting that small dust events may exert a negative impact on California’s economy (Graff Zivin and Neidell, Reference Graff Zivin and Neidell2012; Chang et al., Reference Chang, Graff Zivin, Gross and Neidell2016).
Photovoltaic systems
Solar energy systems have experienced a notable rise in recent decades as a result of technological advancements, reduced costs and increased awareness of environmental concerns. In the United States alone, the US Energy Information Administration forecasted a 75% increase in solar power generation from 2024 to 2026 (US EIA, 2024). Many of these installations are situated in arid regions, as they are particularly suitable for solar energy production, mainly due to intense sunlight, clear skies and availability of unused land.
There is a growing interest in understanding the impacts of dust settling onto photovoltaic systems. Wind tunnel experiments and field data have demonstrated that dust deposition onto photovoltaic (PV) panels reduces cell performance (Goossens et al., Reference Goossens, Offer and Zangvil1993; Goossens and Kerschaever, Reference Goossens and Kerschaever1999). Laboratory studies have demonstrated that the reduction in PV output efficiency is approximately proportional to the dust mass deposition (Jiang et al., Reference Jiang, Lu and Sun2011), with modeling and observational work suggesting that the reduction in efficiency can be as high as 25% (Bergin et al., Reference Bergin, Ghoroi, Dixit, Schauer and Shindell2017). Measurements at a large commercial site suggest that even when averaged over long time periods, PV output in areas where dust storms occur can be reduced by approximately 10% due to deposition (Mejia et al., Reference Mejia, Kleissl and Bosch2014). Addressing dust deposition requires regular maintenance and cleaning of panels with water (Mani and Pillai, Reference Mani and Pillai2010), which is typically limited in these arid environments. Furthermore, the water requirements to address dust deposition onto PV panels may be so large that alternative forms of energy production, like biofuels, may be equally feasible in arid regions (Ravi et al., Reference Ravi, Lobell and Field2014).
Environmental justice
Dust impacts are not evenly distributed across the population of California (Figure 10). Sources of dust (e.g., exposed playa of the Salton Sea and Owens Lake, or fallow farmland in the Imperial and San Joaquin Valleys) tend to be more proximate to lower-income communities, communities with higher Hispanic/Latino population shares and greater fractions of undocumented immigrants (US Census Bureau, 2023). This is reflected in increased asthma aggravations nearby: for example, the Imperial Valley, which is in the southeastern corner of the state and is likely impacted by dust from the drying Salton Sea, has the highest rate of pediatric asthma hospitalization in California, and unlike other regions, demographics explain a small portion of this outcome; most of it is driven by dust (Goodyear, Reference Goodyear2015; Farzan et al., Reference Farzan, Razafy, Eckel, Olmedo, Bejarano and Johnston2019; Johnston et al., Reference Johnston, Razafy, Lugo, Olmedo and Farzan2019). Further afield, dust emissions and dust storms are more likely to impact southern and central California. Because outcomes from PM exposures have long been known to vary by income and access to health care, significant environmental justice concerns exist in the management of California dust emissions.
California dust climatology and environmental justice concerns. (a) Coarse distribution of annual average dust aerosol optical depth (AOD) over California, 2003–2019 (Pu and Ginoux, Reference Pu and Ginoux2018). (b) Median household income of California Census tracts from the American Community Survey (US Census Bureau, 2023). (c) Average dust levels in general rise with Asian, Black and Hispanic/Latino population shares across California census tracts. (d) Similarly, higher income quintiles are less likely to see high annual average dust levels.

Figure 10. Long description
A four-panel complex graphic labeled A through D.
Panel A is a geographical map of California showing Mean Dust A O D from 2003 to 2019. The color scale ranges from light yellow (0.01) to dark red (0.08). The highest dust concentrations are located in the Central Valley and Southeast desert regions.
Panel B is a geographical map of California showing Median Household Income based on A C S 2019 data. The map is divided into census tracts colored by income quintile from 0 (dark blue, low) to 4 (yellow, high). High-income areas are concentrated in the San Francisco Bay Area and coastal Southern California, while lower-income areas are prevalent in the Central Valley.
Panel C is a line graph titled Dust A O D versus Racial/Ethnic Share. The x-axis is Census Tract Population Share from 0.0 to 1.0. The y-axis is Relative Dust A O D from 0.9 to 1.3. Four lines with shaded confidence intervals show trends: N H Black (green), N H Asian (orange), and Hispanic/Latino (purple) all show a positive linear increase in relative dust as their population share increases. N H White (blue) shows a negative linear decrease.
Panel D is a box plot titled Dust A O D by Income Level. The x-axis shows five Median Household Income Quintiles from 7k-49k to 109k-250k. The y-axis is Dust A O D from 0.02 to 0.07. The median dust level and the overall range of the boxes decrease as income quintiles increase, with the highest income group having the lowest median dust exposure.
Within the San Joaquin Valley and Los Angeles Basin, occupational dust exposures likely put agricultural, construction and fieldworkers at high risk for coccidioidomycosis infection (Nicas, Reference Nicas2018), and solar energy field expansion puts solar panel construction workers at risk for dust exposures and Coccidioides infection (Wilken et al., Reference Wilken, Sondermeyer, Shusterman, McNary, Vugia, McDowell, Borenstein, Gilliss, Ancock, Prudhomme, Gold, Windham, Lee and Materna2015). Legislative efforts in California have mandated Coccidioides risk education and safety protective equipment for at-risk workers in endemic areas (e.g., the 2019 California Assembly Bill-203, Occupational safety and health: Valley fever). Disease impact is further complicated by the socioeconomic constraints of many field workers. In California’s SJV, Hmong and Latino minorities make up a large percentage of field workers and soil-based laborers (Struglia et al., Reference Struglia, Meyer and Meyer2003). These populations tend to fall into the lowest wealth bracket with little to no access to healthcare, thus representing those with the least availability and opportunity to seek medical care, and the most exposed to Coccidioides (Mobed et al., Reference Mobed, Gold and Schenker1992).
Moreover, we note that environmental justice consists of both exposure equities and procedural justice; that is, all community members, regardless of income or protected class status, should have equal access to environmental services as well as the ability to participate in the governance process. It has long been a concern that both proximate and more distant communities affected by dust have not had due input into the regulatory process. Increased effort by researchers and regulators to work with Californians to understand their own exposures, advocate for optimal mitigation strategies and remediation protocols and benchmark progress is critical to a more just future for our state.
The future of dust in California
The impacts of dust on health, agriculture, ecosystems, recreation and so on, will extend into the future with influence from climate change as well as land and water management policy. However, our understanding of how dust storms will change in the future remains limited due to the complex dynamics underlying dust generation and transport. Here, we discuss how environmental drivers and natural resource management are likely to shape dust in California over the coming years to decades.
Climate change
Climate change is expected to increase the number and severity of dust storms in the southwestern parts of the United States, including California (Achakulwisut et al., Reference Achakulwisut, Anenberg, Neumann, Penn, Weiss, Crimmins, Fann, Martinich, Roman and Mickley2019; Brey et al., Reference Brey, Pierce, Barnes and Fischer2020; White et al., Reference White, Elias, Thomas, Bradatan, Brunson, Chischilly, Enquist, Fisher, Froehlich, Koebele, Méndez, Ostoja, Steele, Vanos, Crimmins, Avery, Easterling, Kunkel, Stewart and Maycock2023). This is because dust emissions are affected by environmental drivers such as precipitation, soil moisture, surface temperature, relative humidity and surface winds, which are all projected to change as the planet continues to warm (Pu and Ginoux, Reference Pu and Ginoux2017; Zha et al., Reference Zha, Shen, Li, Wu, Zhao, Fan, Sun, Azorin-Molina and Deng2021), including within the state (Figure 11). For example, precipitation extremes are projected to intensify, along with more frequent and extreme dry-to-wet events, increasing the risk of both flood and drought in California (Diffenbaugh et al., Reference Diffenbaugh, Swain and Touma2015; Swain et al., Reference Swain, Langenbrunner, Neelin and Hall2018). Future drought conditions could result in changes in soil properties, such as reducing soil moisture, potentially leading to changes in dust emissions in California’s arid and semi-arid regions. For example, drought-induced changes in soil properties were attributed to recent increases in dust concentration around Owens Lake between 2013 and 2015 (Borlina and Rennó, Reference Borlina and Rennó2017). Flooding can enhance the transport of dust-sized sediment downstream and over dry lakes, which may increase the susceptibility of dust emissions after they become dry (Zender and Kwon, Reference Zender and Kwon2005). Elevated surface temperatures due to greenhouse gases can greatly amplify seasonal dryness and moisture loss in the atmosphere and soil, resulting in increased severity of drought conditions, degradation of protective desert soil crust and increases in associated dust activities (Cheng et al., Reference Cheng, Hoerling, AghaKouchak, Livneh, X-W and Eischeid2016; Dai, Reference Dai2013, Diffenbaugh et al., Reference Diffenbaugh, Swain and Touma2015; Kok et al., Reference Kok, Storelvmo, Karydis, Adebiyi, Mahowald, Evan, He and Leung2023). Changes in the near-surface wind speeds that drive dust emissions are projected to be small and variable, depending on the season and location (Wang et al., Reference Wang, Ullrich and Millstein2020).
Shown in (a) are historical (black) and climate model projections of the annual mean daily maximum temperature for California for two greenhouse gas scenarios, RCP 4.5 and RCP 8.5, and their uncertainties (shading). Also shown is the percent change in the wettest day of the year for the state (b) and the percent change in the annual mean relative humidity (c), both for the RCP 8.5 scenario. The differences in (b) and (c) are the differences in means for the 2070–2100 time period and the historical period of 1976–2005. After (Pierce et al., Reference Pierce, Kalansky and Cayan2018).

Figure 11. Long description
Panel a is a line graph of annual mean daily maximum temperature in Celsius from 1950 to 2100. The x-axis is Year and the y-axis ranges from 20 to 28. A black line shows historical data until 2005. Two projections follow. R C P 4.5 in blue shows a steady increase to approximately 24.5 degrees. R C P 8.5 in red shows a steeper linear increase reaching approximately 27 degrees by 2100. Shaded regions around lines indicate uncertainty.
Panel b is a map of California showing the percent change in the wettest day of the year for the R C P 8.5 scenario. The color scale ranges from 0 percent in white to 40 percent in dark green. The entire state shows green shading, with the highest concentrations of 30 to 40 percent increase located in the Northern and Central regions. City markers include R D D, Reno, S A C, O A K, S F O, Las, L A X, and S A N.
Panel c is a map showing the percent change in annual mean relative humidity for R C P 8.5. The scale ranges from negative 9 percent in brown to positive 9 percent in purple. Most of the state is covered in light to dark brown, indicating a decrease in humidity of 3 to 7 percent, particularly in the Southeast and Central Valley. Small areas of light purple indicating a slight increase are visible along the far North coast.
Shifts in global-to-regional circulation patterns caused by the changing climate are also likely to influence dust emission in the future. For example, the increasing frequency of strong El Niño/Southern Oscillation events due to the warming climate (Cai et al., Reference Cai, Borlace, Lengaigne, Van Rensch, Collins, Vecchi, Timmermann, Santoso, McPhaden, Wu, England, Wang, Guilyardi and Jin2014) is likely to result in more frequent periods of below-average rainfall across the Western US that are associated with La Niña-like conditions, and thus an increase in dust in the year following these dry periods (Okin and Reheis, Reference Okin and Reheis2002). In southeastern California, projections of a weakening North American Monsoon (Pascale et al., Reference Pascale, Boos, Bordoni, Delworth, Kapnick, Murakami, Vecchi and Zhang2017) imply a potential reduction in summertime dust storms there, although these results are seemingly in contradiction to historical increases in the intensity of monsoonal precipitation (Luong et al., Reference Luong, Castro, Chang, Lahmers, Adams and Ochoa-Moya2017), suggesting a high level of uncertainty in the connections among climate change, regional circulation patterns and dust.
Landscape disturbance
In addition to the environmental factors that may dominate future dust emissions from natural desert sources (i.e., playas, dry washes), human-induced factors may also influence dust emissions from so-called anthropogenic sources, such as construction, off-road vehicle use and agriculture. The California Air Resources Board’s California Emissions Projection Analysis Model (CEPAM) (California Air Resources Board, 2019) projects that dust from anthropogenic sources will increase by approximately 45% in 2050, relative to the 2017 baseline (Figure 12). This increase in dust emission is expected to mostly come from construction, demolition and resuspension from paved roads. In contrast, CEPAM suggests that dust emissions from unpaved roads, fugitive windblown dust from croplands and pasturelands and farming operations, such as tilling and harvest, will remain approximately the same or decrease by less than 7% in the coming decades. Because the future dust emission projections depend on the 2017 base year emission inventory and emission factors model (Propper et al., Reference Propper, Wong, Bui, Austin, Vance, Alvarado, Croes and Luo2015), they are subject to substantial uncertainties. While CEPAM may project minimal changes in anthropogenic dust from agricultural croplands, historically, poor agricultural management and practices have been linked to major wind-blown dust or dust storms. For example, the dust event of November 1991 that led to a collision of 164 vehicles and 17 fatalities on Interstate 5 in the San Joaquin Valley was thought to be wind-blown dust from agricultural sources, likely aided by inadequate land management (Pauley et al., Reference Pauley, Baker and Barker1996). Therefore, changes in agricultural land management and practices could alter future changes in anthropogenic dust emissions, especially in California’s Central Valley, where a majority of the state’s agricultural sources are located (Ginoux et al., Reference Ginoux, Prospero, Gill, Hsu and Zhao2012). Changes in tillage, fallowing and grazing could also expose vast swathes of farm cropland to wind erosion and contribute to desertification and dust production (Zobeck et al., Reference Zobeck, Baddock and Van Pelt2013), echoing some of the conditions that led to the Dust Bowl (Lee and Gill, Reference Lee and Gill2015). Understanding the large uncertainties in the projection of anthropogenic dust emission is key to estimating the future of dust in California, given that the contribution to dust emission from anthropogenic sources is likely substantial (Huang et al., Reference Huang, Tong, Lee, Pan, Tang, Stajner, Pierce, McQueen and Wang2015; Adebiyi et al., Reference Adebiyi, Kibria, Abatzoglou, Ginoux, Pandey, Heaney, S-H and Akinsanola2025).
Percentage change in state-wide summer dust emission from the California Air Resources Board’s California Emissions Projection Analysis Model. Dust emission is approximated as the coarse particulate matter (PM), which is the difference between PM10 and PM2.5 (particulate matter with aerodynamic diameters less than 10 μm or 2.5 μm, respectively) for dust emission sources. Bars indicate the average percent change for the decade indicated relative to 2017. Positive values reflect an increase in dust emission from the respective emission source.

Figure 12. Long description
The x-axis represents the percent change in dust emission per 2017 baseline, ranging from negative 10 to positive 50. The y-axis lists seven categories. Each category contains four bars colored brown for 2020, light green for 2030, blue for 2040, and yellow for 2050.
* CONSTRUCTION: Shows a significant positive trend, starting at approximately 10 percent in 2020 and increasing to nearly 45 percent by 2050.
* PAVED ROAD: Shows a positive trend, increasing from roughly 2 percent in 2020 to 18 percent by 2050.
* UNPAVED ROAD: Shows a slight negative trend, with values decreasing from near 0 in 2020 to approximately negative 2 percent by 2050.
* TILLING: Shows a negative trend, decreasing from negative 1 percent in 2020 to negative 6 percent by 2050.
* HARVEST: Shows a negative trend, decreasing from negative 1 percent in 2020 to negative 8 percent by 2050.
* FUGITIVE: Shows a slight negative trend, ending at approximately negative 2 percent in 2050.
* ALL: The aggregate category shows a strong positive trend, mirroring the construction sector, rising from approximately 9 percent in 2020 to nearly 48 percent by 2050.
Other changes in natural resources management
Changes in government policies can also influence agricultural land-use management practices with direct consequences for wind erosion. A report from the Public Policy Institute of California suggested that to achieve the goals of the state’s 2014 Sustainable Groundwater Management Act, instituted to bring groundwater basins into balance in the next two decades, between 0.5–1 million acres of irrigated land will need to be fallowed (Hanak et al., Reference Hanak, Escriva-Bou, Gray, Green, Harter, Jezdimirovic, Lund, Azuara, Moyle and Seavy2019). Such fallowed cropland could become new dust sources that may increase dust emission and surface concentrations, particularly in the Central Valley. Additionally, Southern California is susceptible to climate-change-driven policies in water transfer and storage. For example, global warming is contributing to the long-term decline in Colorado River levels by aridifying the basin’s snowpack regions (Bass et al., Reference Bass, Goldenson, Rahimi and Hall2023), and climate models project that this drying will intensify toward the end of this century (AghaKouchak et al., Reference AghaKouchak, Cheng, Mazdiyasni and Farahmand2014). Such changes in water availability may exacerbate pressure on agricultural users, who consume more than two-thirds of California’s Colorado River allocation, to increase fallowing and to reduce irrigation (Richter et al., Reference Richter, Lamsal, Marston, Dhakal, Sangha, Rushforth, Wei, Ruddell, Davis, Hernandez-Cruz, Sandoval-Solis and Schmidt2024). Both actions tend to increase dust emission. Irrigation runoff has been the only source of water to the Salton Sea since the Quantification Settlement Agreement of 2003 ended the direct transfer of Colorado River water to the Sea in 2017 (Cohen, Reference Cohen2014). The Sea’s level has since transitioned from a period of gradual decline to a new era of rapid decline that is estimated to expose about 40% of the year 2000 lakebed to wind erosion by 2030, reaching about 100,000 acres of exposed lakebed by 2050, when levels may stabilize. Dust deflated from the exposed playa may increase PM10 in the surrounding region by about 10% by 2030, and by much more in localized source areas (Parajuli and Zender, Reference Parajuli and Zender2018).
A projected increase in dust emissions in the state is expected to also have significant impacts on the Sierra Nevada snowpack and associated water resources. As previously discussed, dust deposition onto the Sierra Nevada snowpack can accelerate snowmelt by reducing surface albedo (Huang et al., Reference Huang, Qian, He, Bair and Rittger2022a), particularly in spring and summer, when dust activities are high across major sources that transport dust to the Sierra Nevada (Huang et al., Reference Huang, Qian, Liu, He, Zheng, Zhang and Gkikas2022b). Such a decrease in Sierra Nevada snowpack could, in turn, exacerbate California’s water scarcity, negatively impacting crucial water reservoirs that feed into the state’s water supply system, particularly during future drought years. In addition, an increase in future dust storms can significantly degrade air quality by elevating fine particulate matter concentrations that could trigger more respiratory illnesses and increase hospital admissions for asthma and chronic obstructive pulmonary disease, especially for underserved communities in California’s Central Valley (see the Impacts of Dust Storms Section of this report for more detail). Understanding future changes in sources, transport pathways and composition of dust aerosols will be crucial for mitigating impacts on Sierra Nevada snowpack, air quality and regional climate across California.
Future mitigation and adaptation
Reducing emission of – and exposure to – windblown dust represents a unique challenge, since emissions tend to be less consistent, predictable and controllable than other common sources of atmospheric particulates. Windblown dust emissions in California have increased over time because of these challenges, even as other anthropogenic particulates have seen reductions over time. Thus, developing effective strategies to minimize the negative impacts of dust in California, including adaptation and mitigation, is imperative. Here we present strategies that have proven to be useful in other locations and discuss implementation challenges.
Dust source mitigation
In cases where the sources of dust are anthropogenic in nature, direct mitigation is an effective approach to minimize dust emission, and where dust emissions from anthropogenic sources cause exceedances of regulated air pollutants (e.g., PM10), such mitigation may be required. Dust source mitigation strategies generally aim to increase surface roughness over target areas, therefore slowing surface winds and reducing the likelihood of dust particle suspension, or modifying surface properties such as soil moisture or erodibility to reduce emissions. There is a large body of literature on mitigation techniques designed to minimize erosion in croplands and pasturelands in arid regions, as well as dune stabilization (Middleton and Kang, Reference Middleton and Kang2017), which includes short-term strategies like preserving crop residues (Presley and Tatarko, Reference Presley and Tatarko2009; Sharratt et al., Reference Sharratt, Wendling and Feng2010) and longer-term strategies like planting windbreaks (Wang et al., Reference Wang, Zhang, Hasi and Dong2010). Dust source mitigation also requires continuous landscape management to minimize disturbances to the surface (i.e., off-highway vehicle use), which can render efforts ineffective and cause irreversible damage to the environment (Goossens et al., Reference Goossens, Buck and McLaurin2012; Duniway et al., Reference Duniway, Pfennigwerth, Fick, Nauman, Belnap and Barger2019).
One relevant example of anthropogenic dust source mitigation is Owens Lake, which lies just east of the Sierras and was desiccated due to water diversion during the 20th Century (Figure 2). Billions of dollars have been spent implementing a variety of dust emission control measures on the now dry lakebed over the last 25 years, including surface roughening, controlled flooding and vegetation enhancement, although the effectiveness of each specific measure is variable (Owens Lake Scientific Advisory Panel, 2020). Another example of an anthropogenic dust source is the Salton Sea, which is a large lake in the southeastern corner of the state that is rapidly drying due to water diversion. Dust source management activities, like those implemented at Owens Lake, are currently being tested on the exposed playa, again with projected costs of mitigation into the billions of dollars (CNRA, 2020). The long-term efficacy of these management techniques is not easy to assess, since environmental changes like drought may render some techniques ineffective or unfeasible (Borlina and Rennó, Reference Borlina and Rennó2017).
Dust impacts mitigation: forecasting improvements
While efforts to mitigate dust emissions sources can be helpful for scenarios where emissions are predominantly coming from known, consistent and spatially limited sources (e.g., unpaved roadways or active construction sites), such work is generally only applied to a small subset of dust events. For most dust storms, robust and reliable forecasting and communication tools can help to minimize impacts and have been a focus of air pollution research and policy in dust-impacted areas around the world (Niu et al., Reference Niu, Gong, Zhu, Liu, Hu, Zhou and Wang2008; Walker et al., Reference Walker, Liu, Miller, Richardson and Westphal2009; Westphal et al., Reference Westphal, Curtis, Liu and Walker2009; Stajner et al., Reference Stajner, Davidson, Byun, McQueen, Draxler, Dickerson, Meagher, Steyn and Trini Castelli2011; Huang et al., Reference Huang, Tong, Lee, Pan, Tang, Stajner, Pierce, McQueen and Wang2015). Although PM10 forecast products for various regions of the state exist, their usefulness appears to be limited. For example, 5-day forecasts of air quality from PM10 for the Imperial Valley, a region frequently impacted by dust storms, have been available via the Imperial County Air Pollution Control District. Preliminary work conducted by the report authors has identified three main challenges associated with this forecast: (1) the forecast only provides a daily average PM10 air quality index (e.g., healthy, unhealthy, extremely unhealthy, etc.) but does not indicate how poor the air quality will be at a given time or the duration of the unhealthy air quality, (2) the forecast shows little skill in actually forecasting unhealthy air quality (Figure 13) and (3) as a result, informal polling of community members in the Imperial Valley indicates that this forecast product is not widely used by the people most impacted by dust. We note that nearly identical results were obtained when repeating this analysis for PM10 forecasts generated for the Coachella Valley, an area of southeastern California also impacted by dust. Providing accurate, high spatiotemporal resolution dust forecasts to impacted communities is an urgent task; a trustworthy forecast can generate community confidence, adoption and thus actionable information.
Evaluating Daily PM10 Forecasts for the Imperial Valley. Shown is an evaluation of daily PM10 forecasts for the Imperial Valley for days when the air quality is unhealthy for sensitive groups (panel A.) and unhealthy for all groups (panel B.). The horizontal axis represents the number of days prior to the event that the forecast was issued, where a forecast day of zero indicates a forecast generated on the day of the unhealthy air quality. The vertical axis represents the Critical Success Index, which measures the fraction of observed dust events that are correctly predicted, while penalizing both missed events and false alarms.

Figure 13. Long description
Two side-by-side line graphs show the Critical Success Index for P M 10 forecasts. Both graphs share a horizontal axis labeled Forecast Day ranging from 0 to 5 and a vertical axis labeled Forecast Success percentage ranging from 0 to 20.
* Left Panel: Titled Unhealthy For Sensitive Groups. The data shows a downward trend starting at approximately 11 percent on day 0. It plateaus at 9 percent between days 1 and 2, then decreases steadily to approximately 3 percent by day 5.
* Right Panel: Titled Unhealthy For All Groups. The data shows significantly lower success rates. It starts at approximately 1 percent on day 0, remains near 1 percent on day 1, and drops to 0 percent for days 2, 3, 4, and 5.
Previous modeling work has shown that uncertainties related to surface properties associated with dust emissions are likely a major contributor to overall model error (Evan et al., Reference Evan, Porter, Clemesha, Kuwano and Frouin2023), making the development and evaluation of models that correctly reflect the relation between surface properties and dust emissions a high priority for dust forecast improvement. Integrated surface measurements and remote sensing data products have been used previously to identify especially emissive locations, or hotspots, allowing for improved dust event intervention strategies (Li et al. Reference Li, Kandakji, Lee, Tatarko, Blackwell, Gill and Collins2018). Using the same approach, dust emissive hotspots in California could be identified. Around California’s Salton Sea region, an area of increasing concern for windblown dust levels due to a shrinking lake footprint (Parajuli and Zender Reference Parajuli and Zender2018), measurement efforts have also included direct surface observations of emissivities, providing valuable data on surface properties themselves and the relationship between wind speeds and resulting dust emissions (Dickey et al., Reference Dickey, Schreuder, Schmid and Yimam2023). These long-term local measurements and focused field campaigns are important steps towards understanding regional dust emissions and identifying areas where further data are needed to answer key air quality questions related to dust emissions and transport. However, since soil surface properties and related dust emissions are highly variable in space, it is necessary to expand the coverage of dust measurements, including agricultural lands. Furthermore, ongoing assessments of surface conditions and evaluation of forecast model performance are needed since the environmental conditions that give rise to dust storms are dynamic. Coupled comprehensive modeling and measurement efforts are necessary to identify not only how robust and representative current surface property datasets and emissions inventories may be, but also how to continue to improve them.
Dust impacts mitigation: early warning of dust events
With windblown dust source regions often distributed over large areas of remote, unmanaged land, reducing the negative impacts of dust events should also include real-time forecasting of significant events when they occur. Timely communications with affected communities play a crucial role in reducing dust exposure and are considered part of the success of real-time dust forecasts (Henry et al., Reference Henry, Mozer, Rogich, Farrell, Sachs, Selzer, Chikani, Bradley and Comp2023). For example, between 2007 and 2011, 72% of all vision-obscured fatal crashes occurred when no visibility advisory was in effect (Ashley et al., Reference Ashley, Strader, Dziubla and Haberlie2015). For real-time warning of dust events, a separate but related modeling strategy must be developed that can produce forecasts on time scales of minutes. Furthermore, developing an application for mobile devices that allows for the communication of immediate risks and for the public to report and monitor dust events based on their locations is a reasonable strategy to mitigate the adverse impacts of dust storms in affected communities.
Awareness of dust impacts and outreach
Efforts to raise awareness about dust-related health concerns in California face several challenges, including limited and inconsistent funding, difficulties in reaching rural communities, and the complexities of engaging with diverse populations across the state (Ayres et al., Reference Ayres, Kwon, Collins and Morales2022). Language and cultural barriers, along with distrust of researchers and Western medicine, further hinder outreach (Ramírez et al., Reference Ramírez, Estrada and Ruiz2017; Rodriguez et al., Reference Rodriguez, Hewage and Periyakoil2023). To address these issues, it is essential to promote and facilitate research on climate and health disparities that specifically target rural and vulnerable communities (Cushing et al., Reference Cushing, Faust, August, Cendak, Wieland and Alexeeff2015). Vulnerable populations – including immigrants, undocumented individuals, and those of low socioeconomic status – are especially difficult to reach for both data collection on dust exposure and the distribution of health information.
High dust exposure, a major factor exacerbating the health of rural communities, is not typically included in the health and risk assessments at the State level. The regions of California most affected by dust storms also tend to house the most vulnerable populations, making it crucial to tackle long-standing environmental inequalities in these underserved areas (Schwartz and Pepper, Reference Schwartz and Pepper2009; Kodros et al., Reference Kodros, Bell, Dominici, L’Orange, Godri Pollitt, Weichenthal, Wu and Volckens2022). Achieving success by reducing airborne dust and dust-related health impairments will require collaboration between affected communities, researchers, and policy makers, particularly in the San Joaquin, Imperial and Coachella Valleys. These communities are acutely aware of the risks they face and possess valuable local expertise that can enhance efforts to mitigate dust exposure.
A comprehensive strategy encompassing awareness, prevention and restoration is needed to address the challenges posed by dust in recreational areas. Adopting land management practices that can reduce dust emissions is a crucial step toward mitigating the impact of anthropogenic dust emissions on both human health and the environment; otherwise, outdoor recreational activities may witness a “silent spring,” one without the “beauty of bird songs” (Carson et al., Reference Carson, Wilson, Lear, Darling and Darling1962). Bridging the gap between local concerns and the goals of scientific and policy efforts is key to creating effective, sustainable solutions (Fernandez-Bou et al., Reference Fernandez-Bou, Ortiz-Partida, Classen-Rodriguez, Pells, Dobbin, Espinoza, Rodríguez-Flores, Thao, Hammond Wagner, Fencl, Flores-Landeros, Maskey, Cole, Azamian, Gamiño, Guzman, Alvarado, Campos-Martínez, Weintraub, Sandoval, Dahlquist-Willard, Bernacchi, Naughton, DeLugan and Medellín-Azuara2021).
Conclusions
Dust storms are pervasive across much of California, and many sources of dust within the state are both directly and indirectly affected by human activity and climate change, including via water diversion, altering vegetation cover and type, agriculture, off-road activity, wildfire and drought. However, mapping the total extent of dust storms within the state, and the environmental and human drivers of past and future change, remains challenging due to a limited observational network.
There are a myriad of adverse impacts of dust on both the human and natural environment. The dust impacts described here represent an important but non-comprehensive list, as many plausible impact pathways have not been estimated due to the relative paucity of data. The impacts addressed above nevertheless clearly illustrate that dust is closely connected with human health and welfare in California. Because dust emissions impact key ecosystems that mediate human health and directly negatively affect morbidity and mortality through physical, pathogenic and mental health pathways, it is a prime target for cross-sector policy innovation. There are likely large co-benefits to human wellbeing from effective and efficient mitigation of dust emissions within the state, particularly when the state’s environment and climate sustainability goals into the future are considered.
Understanding the physical characteristics and impacts of dust in the state is critical, as dust storms are likely to become more widespread as the climate changes. This is because common environmental drivers that influence dust emission, such as precipitation, soil moisture, surface temperature and surface winds, are all projected to change in a way that is likely to drive an increase in dust emissions. In addition, changes in land use management and government policies may also have indirect impacts on future dust emission in California. In particular, water management initiatives, including California’s 2014 Sustainable Groundwater Management Act, could necessitate the fallowing of millions of acres of irrigated land, potentially creating new, albeit temporary and dust sources. Overall, understanding the complex dynamics behind dust generation and the likely occurrence of new emission sources is crucial for developing effective mitigation strategies.
Given the pervasiveness, impacts and likely future changes in dust storms in the state, developing effective adaptation and mitigation strategies to minimize dust impacts needs to be prioritized. The locations in the state with some of the highest concentrations of dust in the air are also home to some of the most vulnerable and underserved populations here. Strategies and actions to reduce the various negative impacts of airborne dust include increasing public awareness of dust’s effects on human safety and health through outreach, providing accurate and high spatiotemporal dust event forecasts, broadcasting dust events to impacted communities in real-time and targeted dust emission mitigation work. Research and measurements are the foundations of these strategies and actions, as the rest are extended from these two components. Therefore, they are the backbones of the reduction of negative dust impacts. However, the feedback and interactions between these strategies and actions are critical to the success of these dust adaptation and mitigation strategies.
Open peer review
For open peer review materials, please visit https://doi.org/10.1017/dry.2026.10041.
Data availability statement
No new data was generated.
Acknowledgments
The authors thank the anonymous reviewers and the journal’s editorial staff for their helpful comments on an earlier version of this manuscript.
Author contribution
All authors contributed equally to writing the manuscript.
Financial support
Funding for this project was provided by a grant from the UC Multicampus Research Programs and Initiatives (award #M23PL5960).
Competing interests
The authors declare no competing interests.
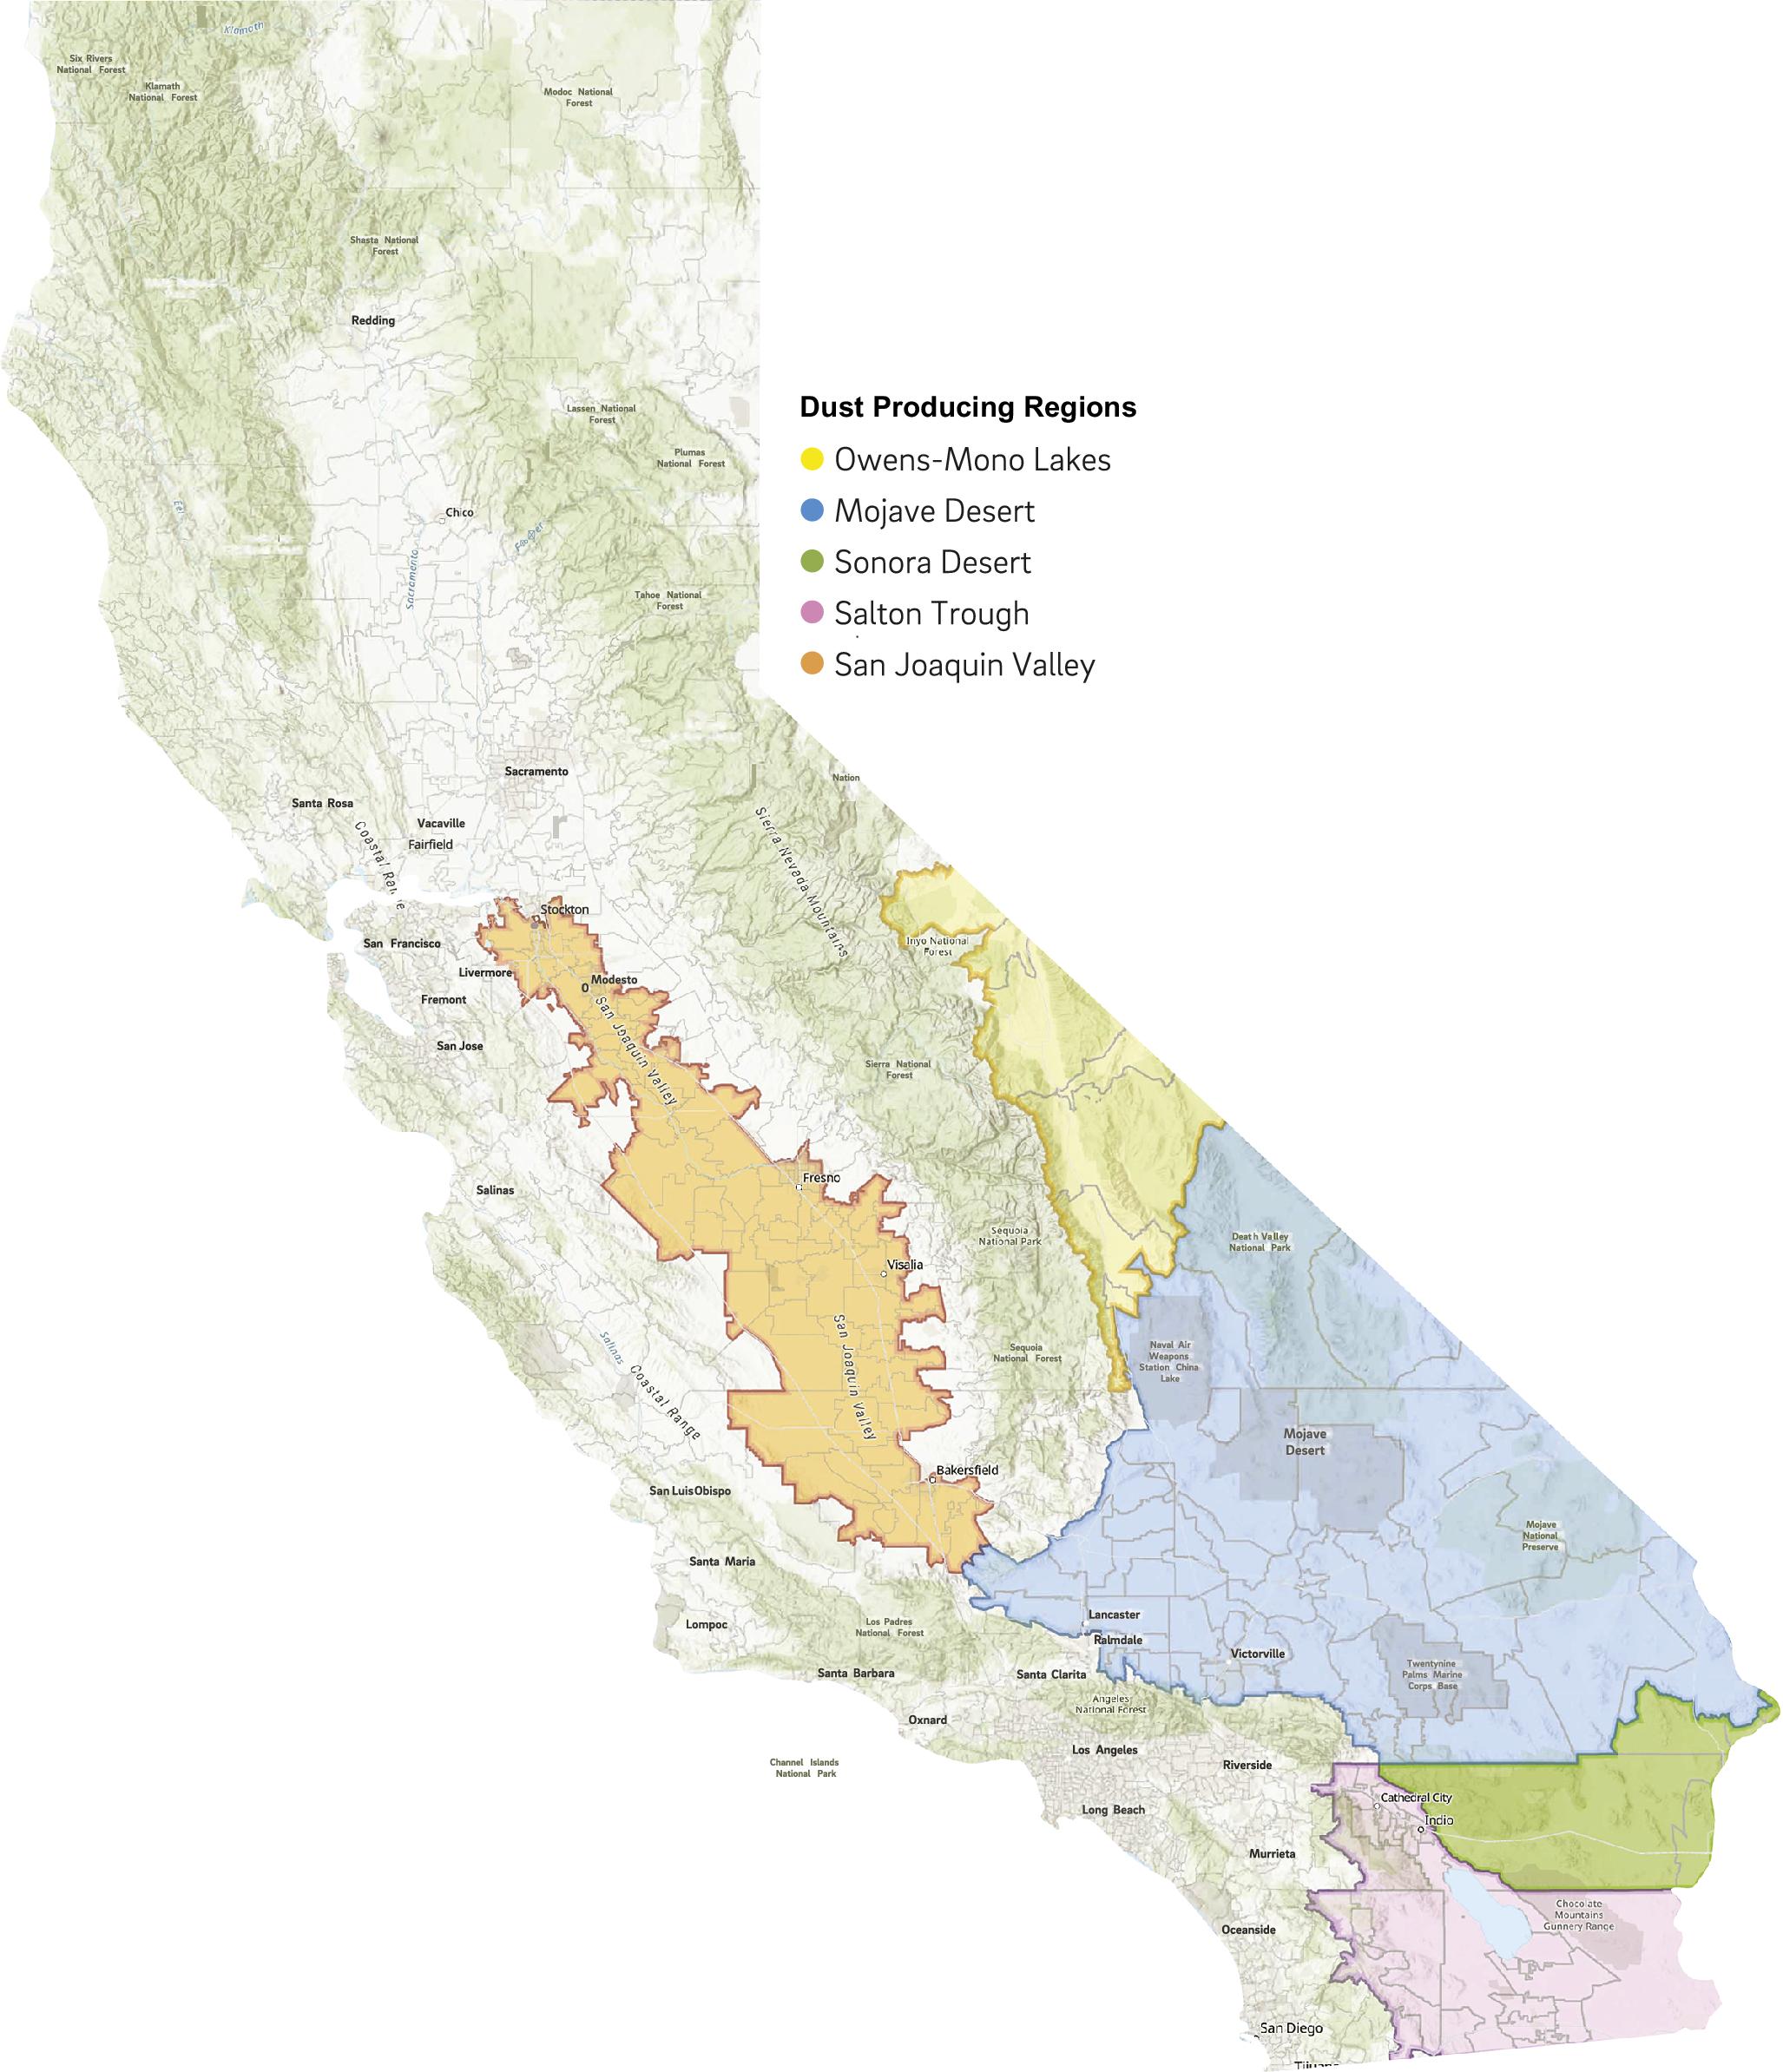
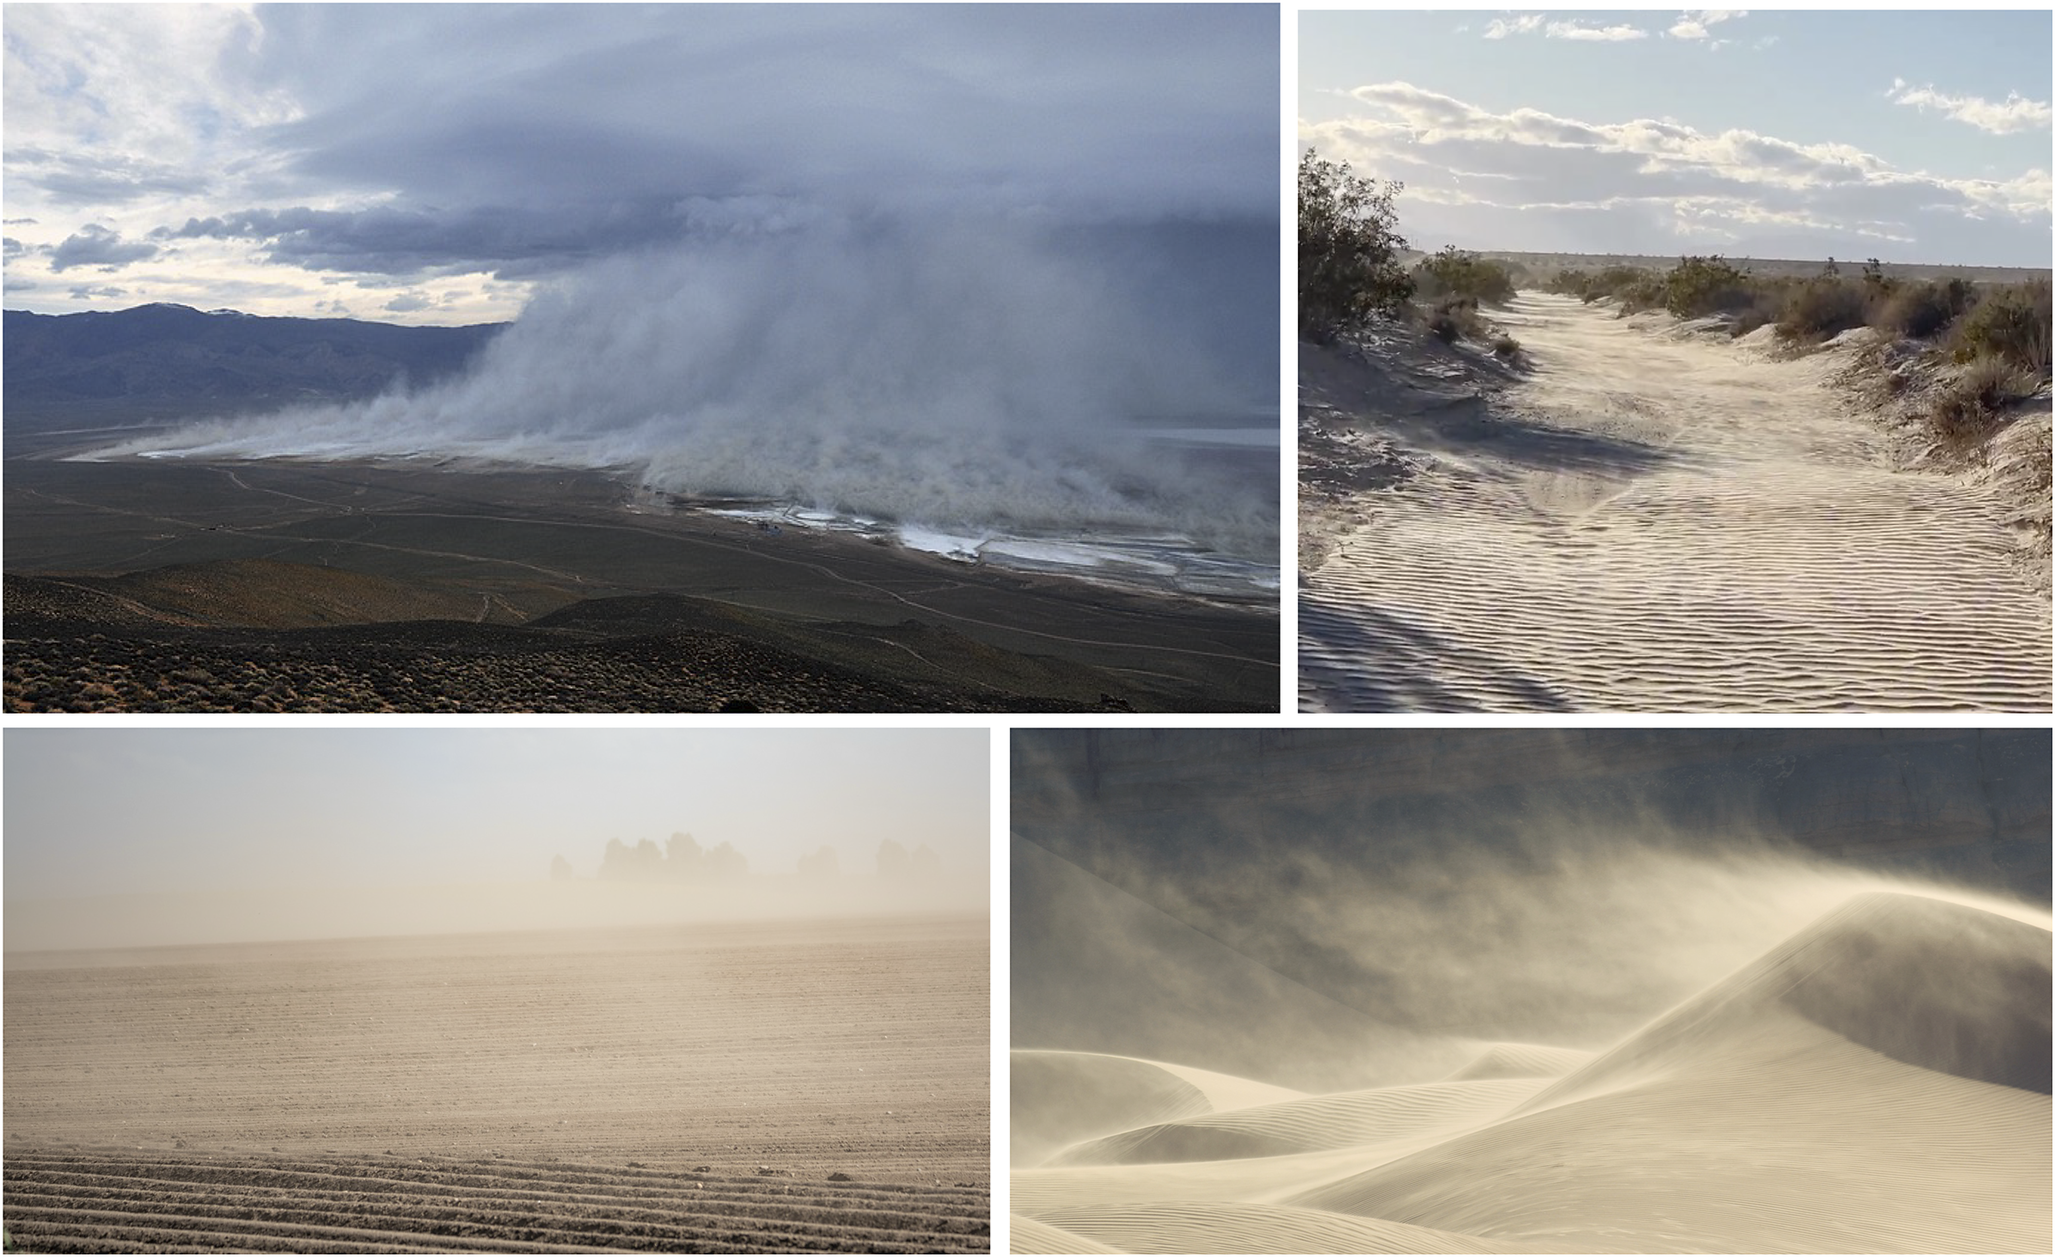
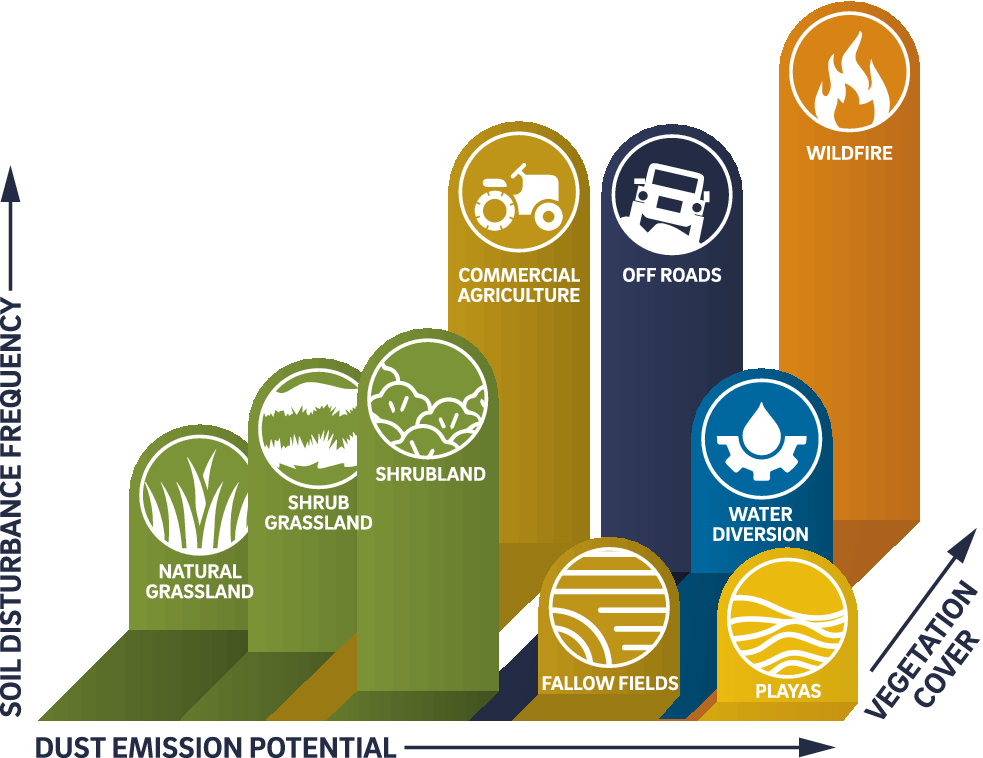
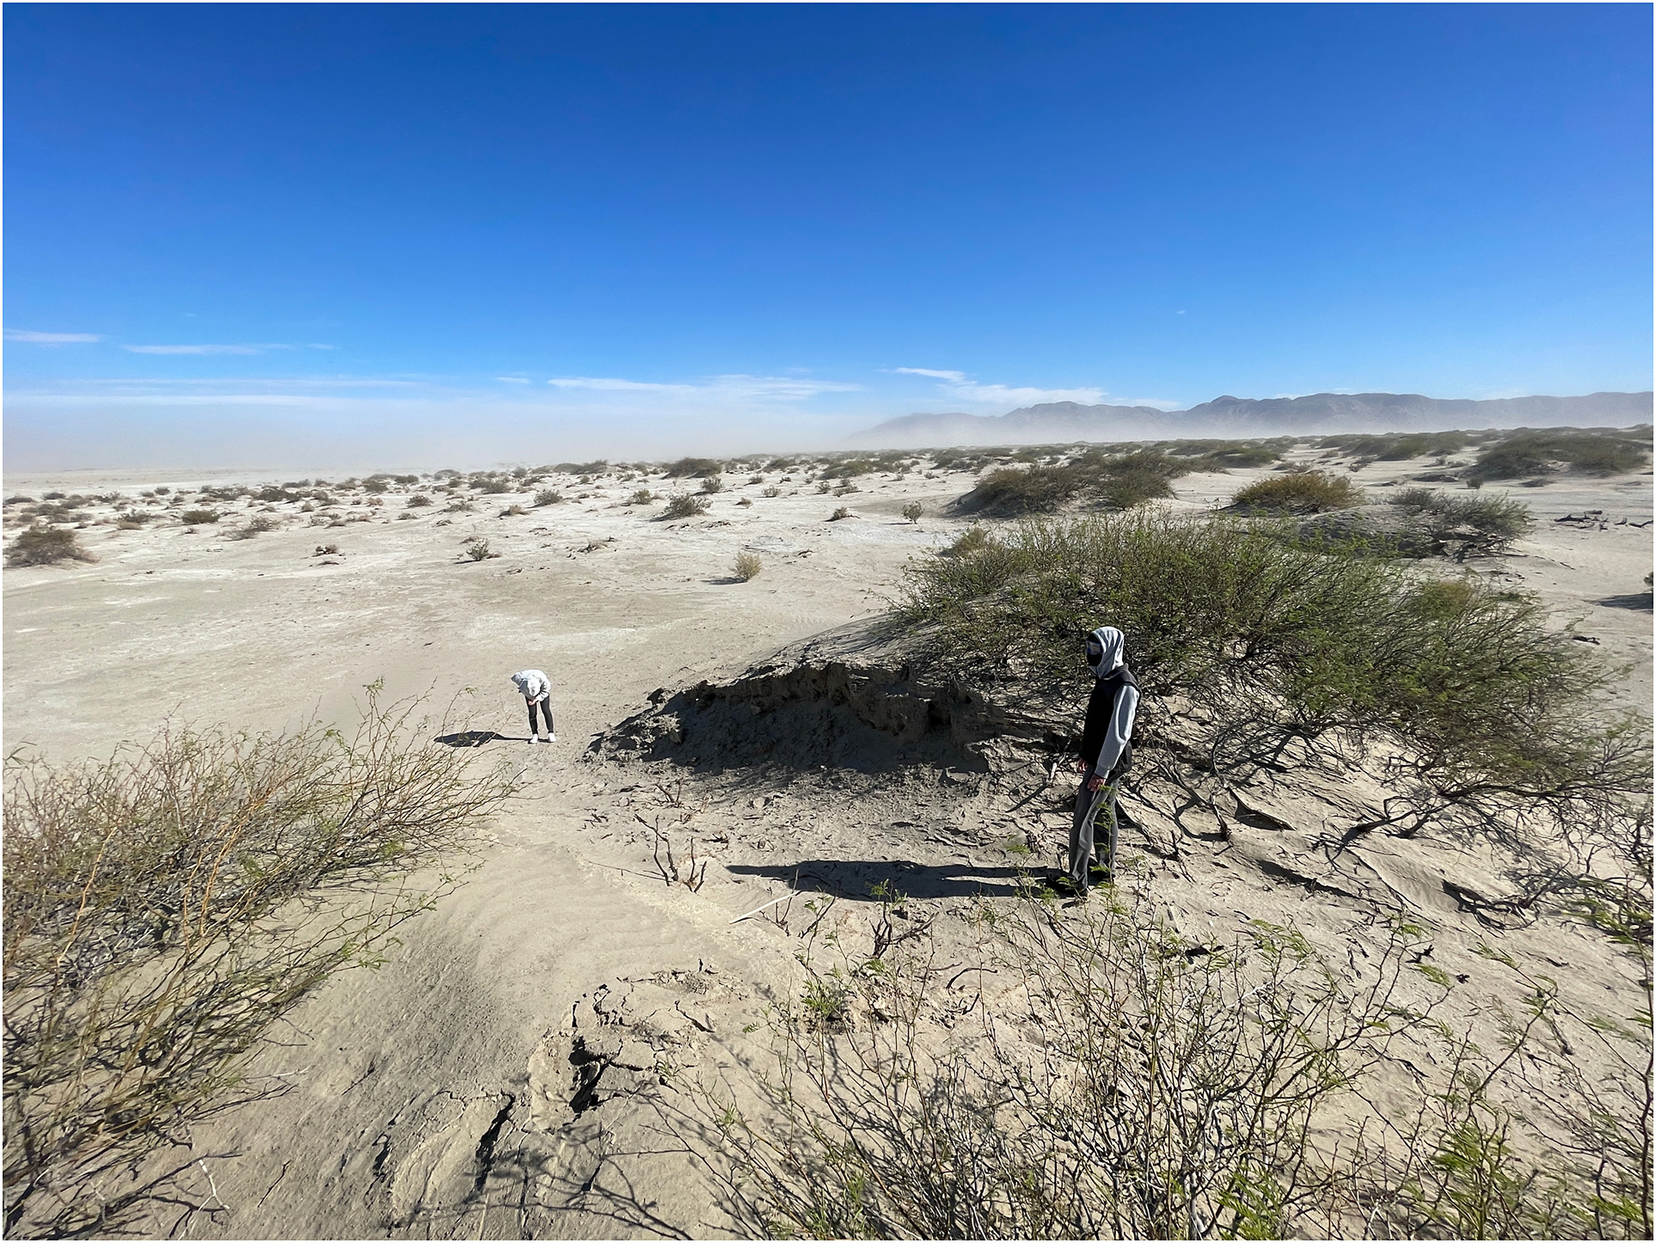
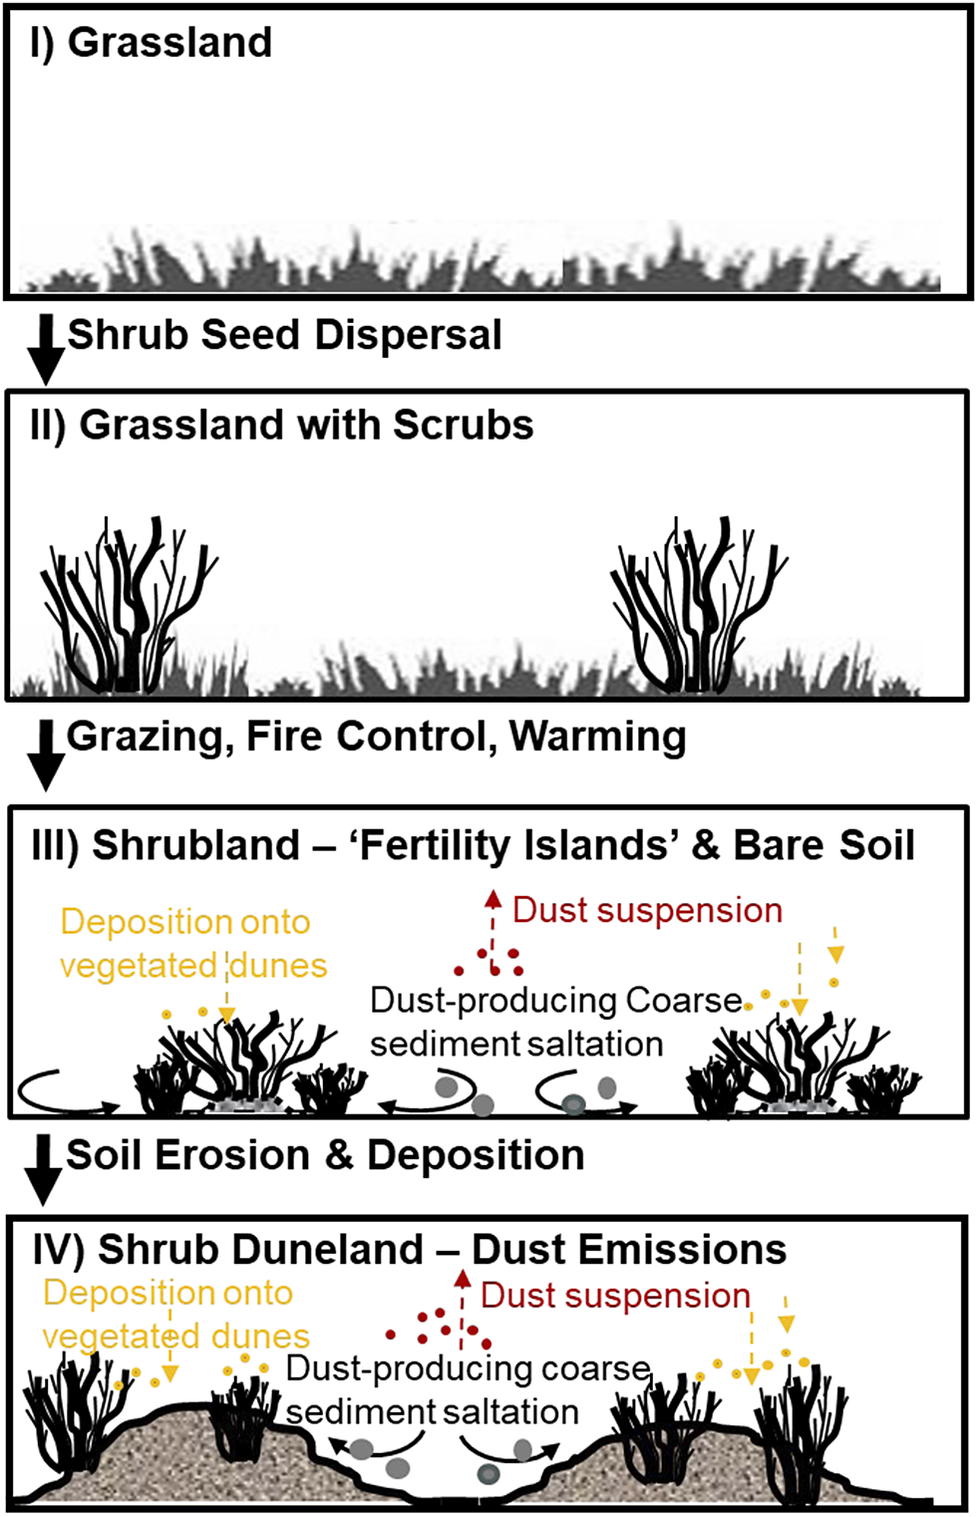
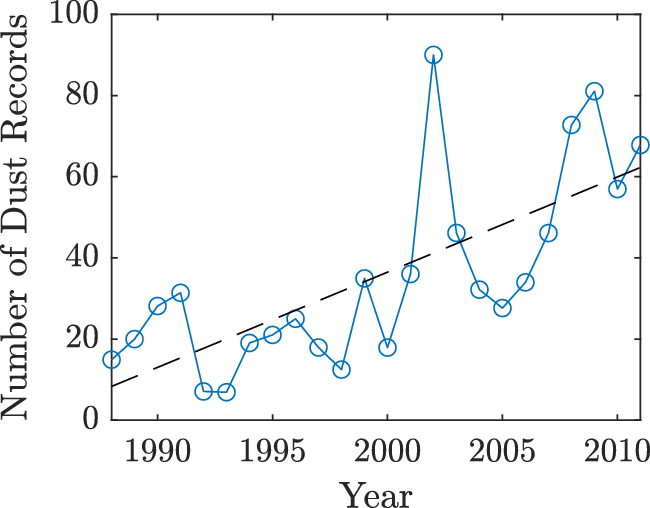

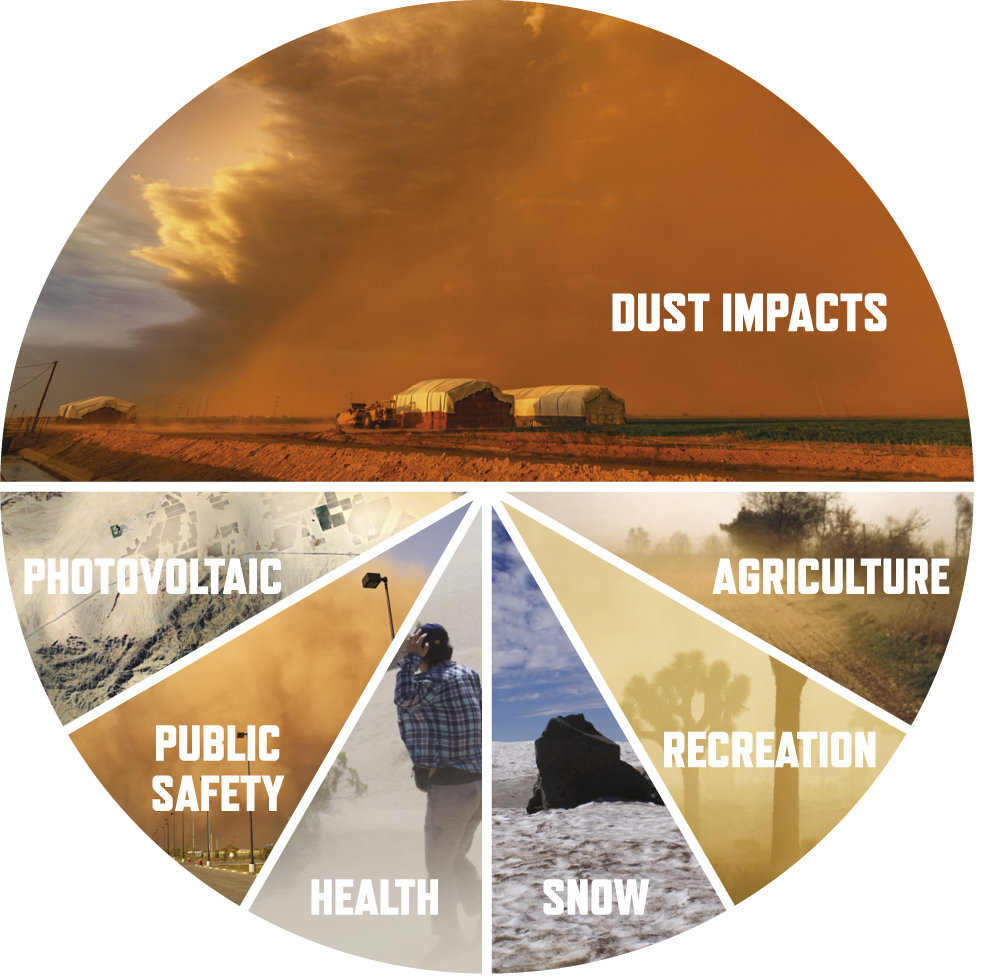
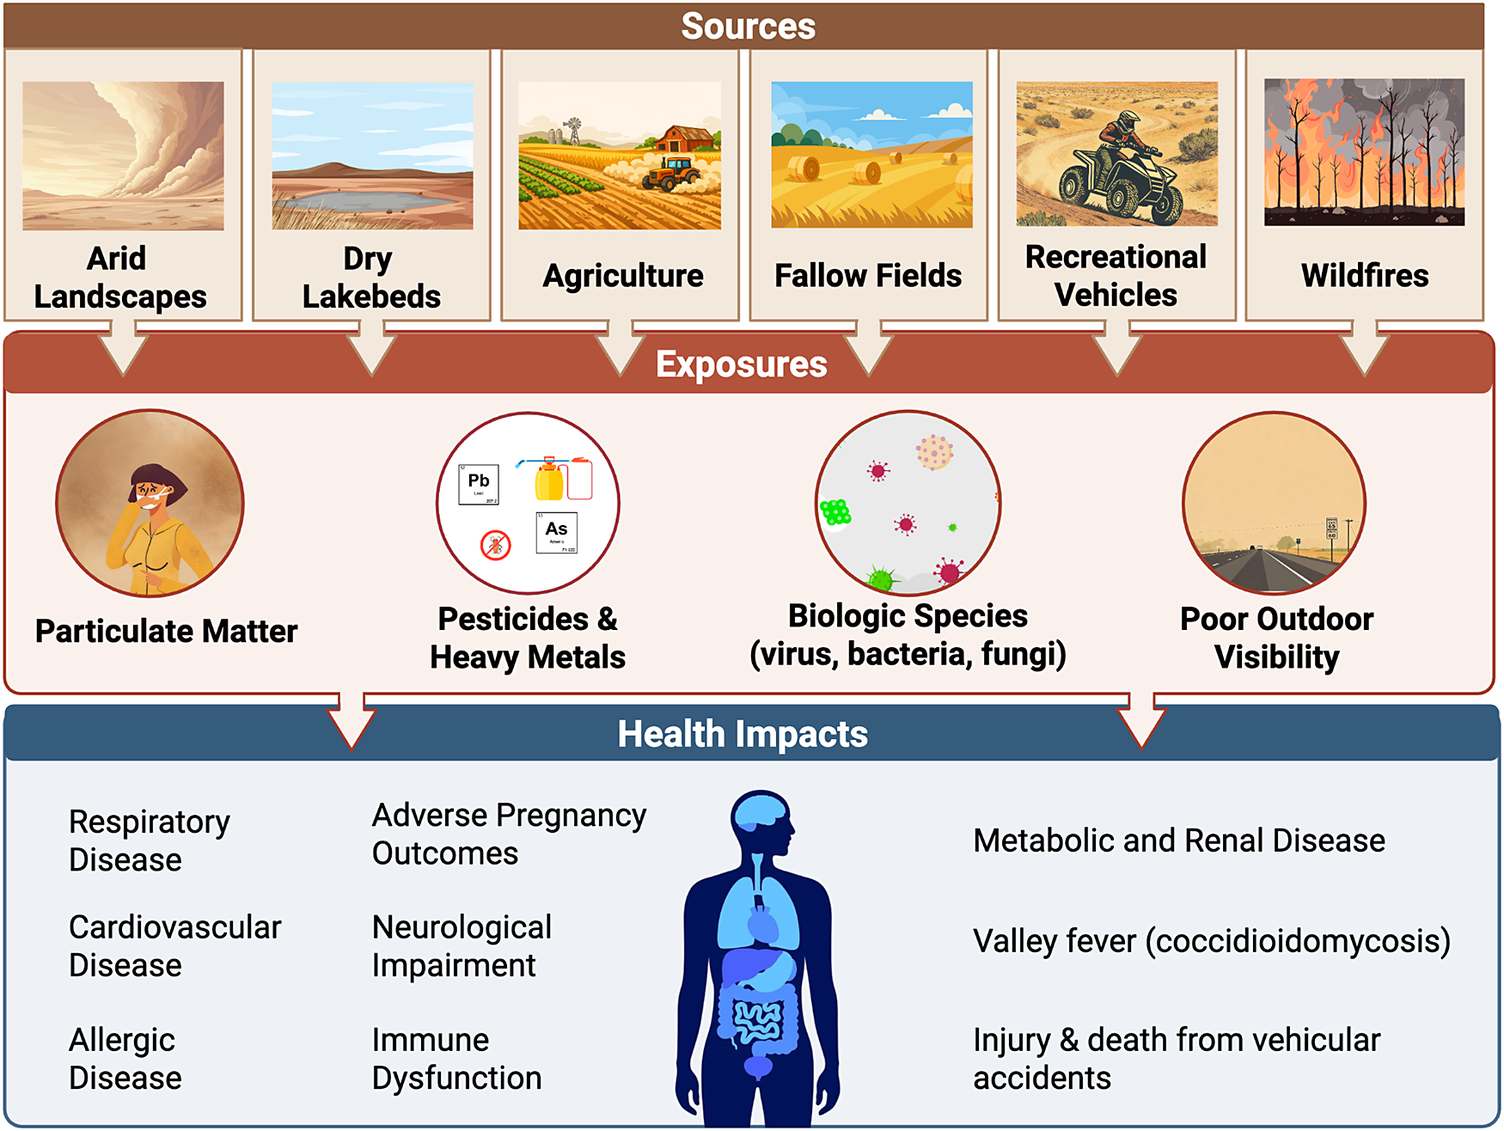
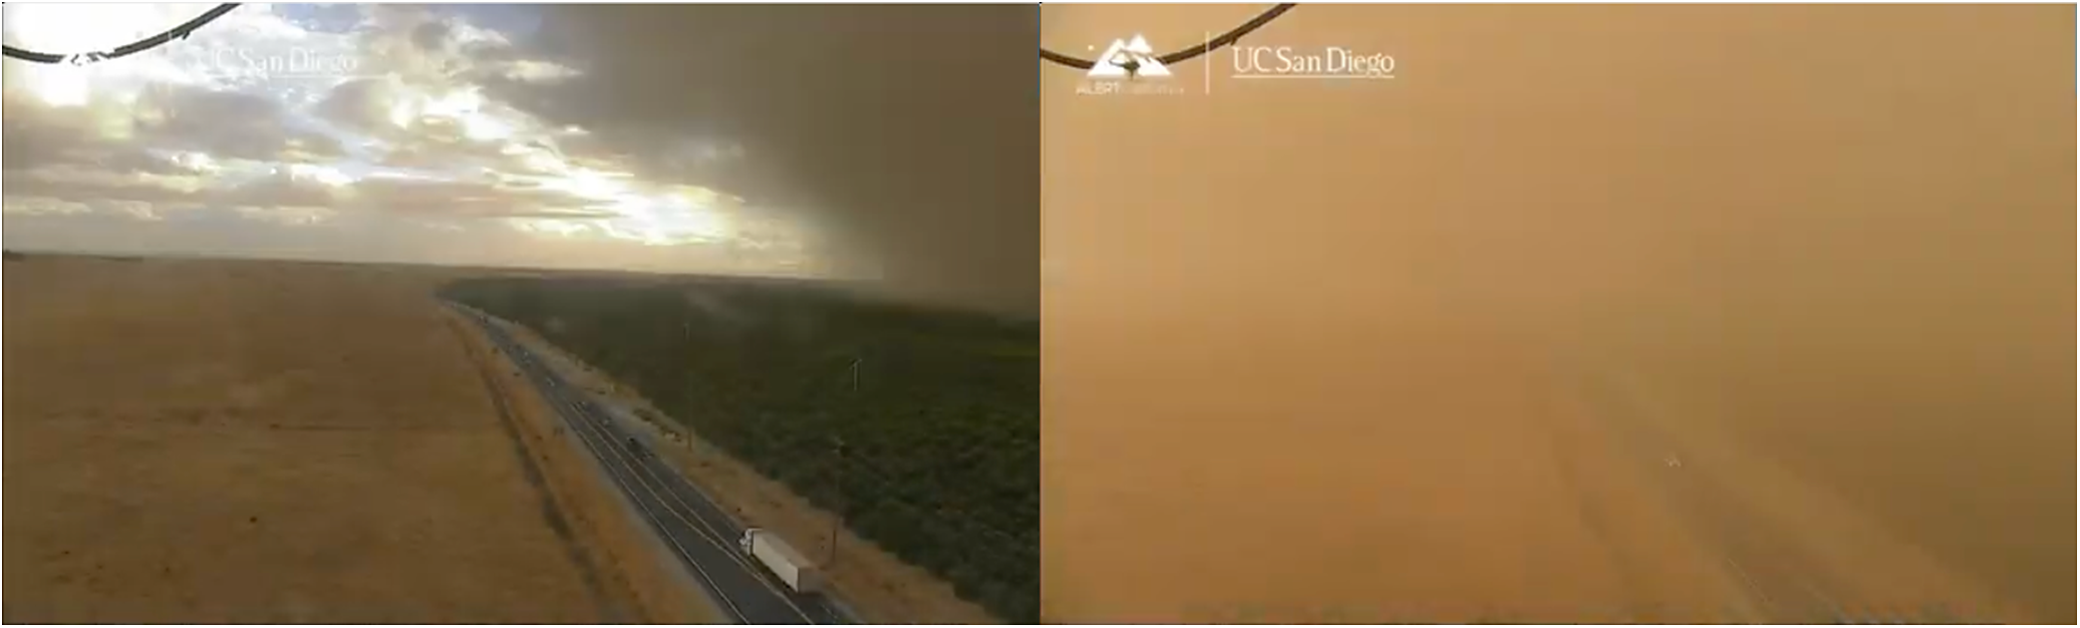
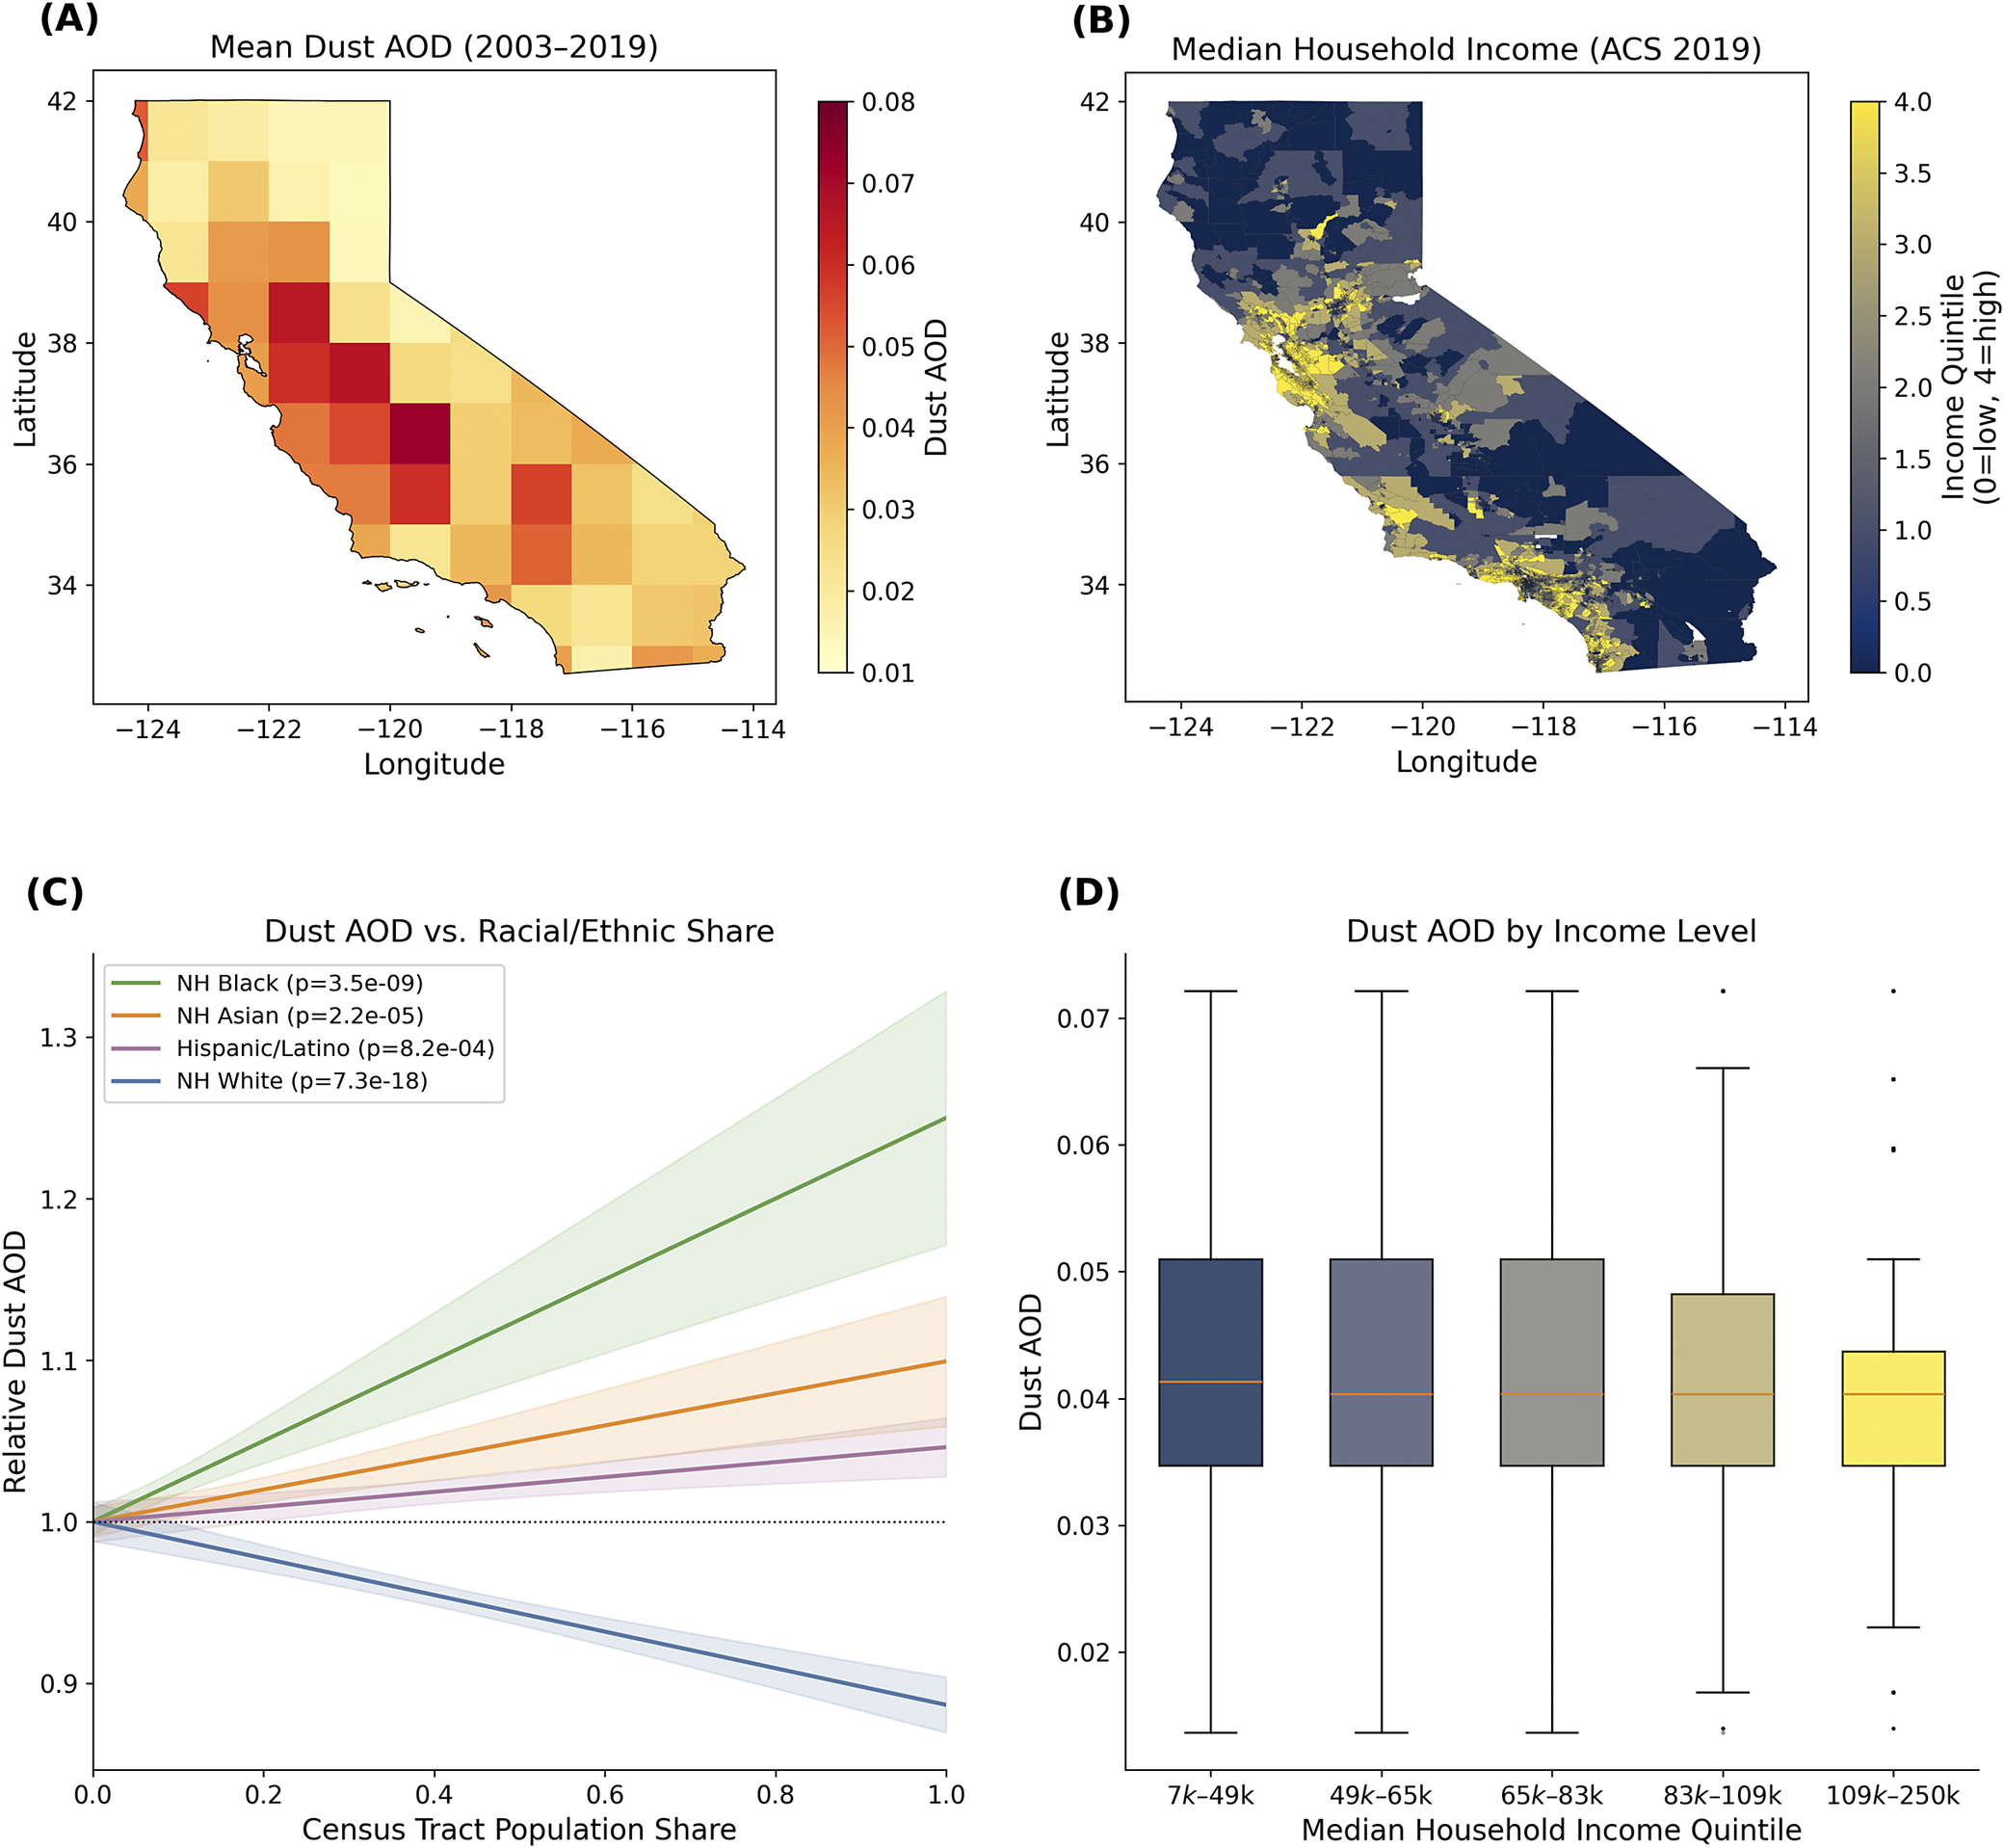
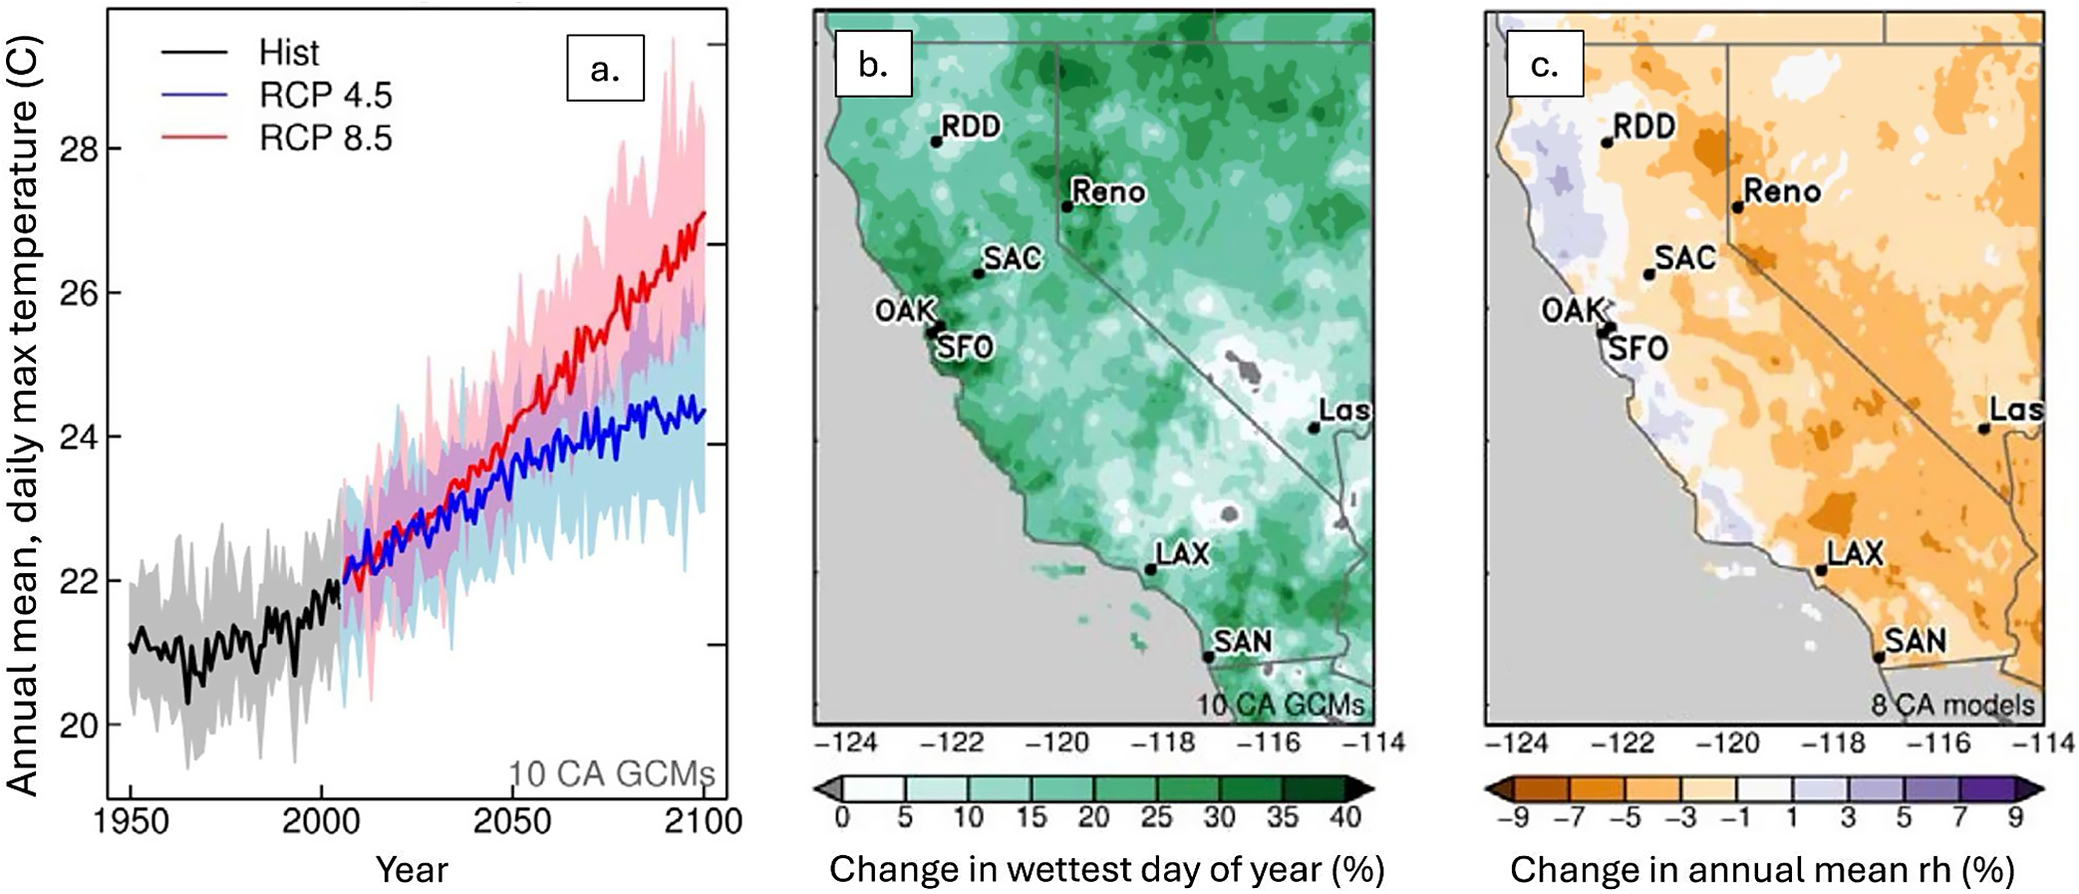
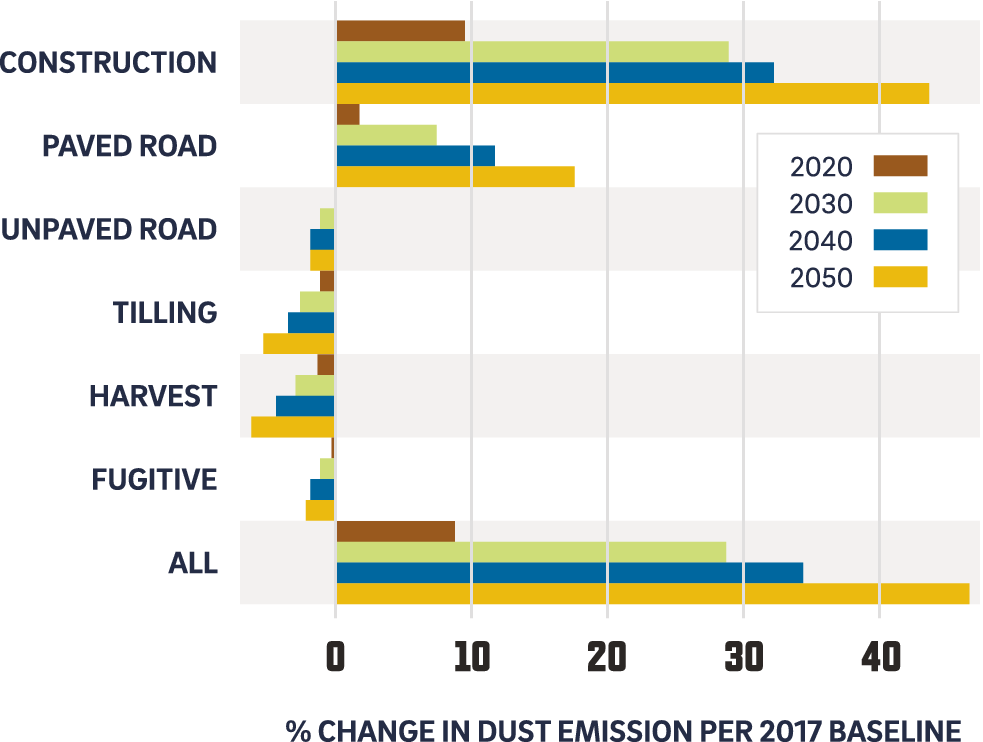
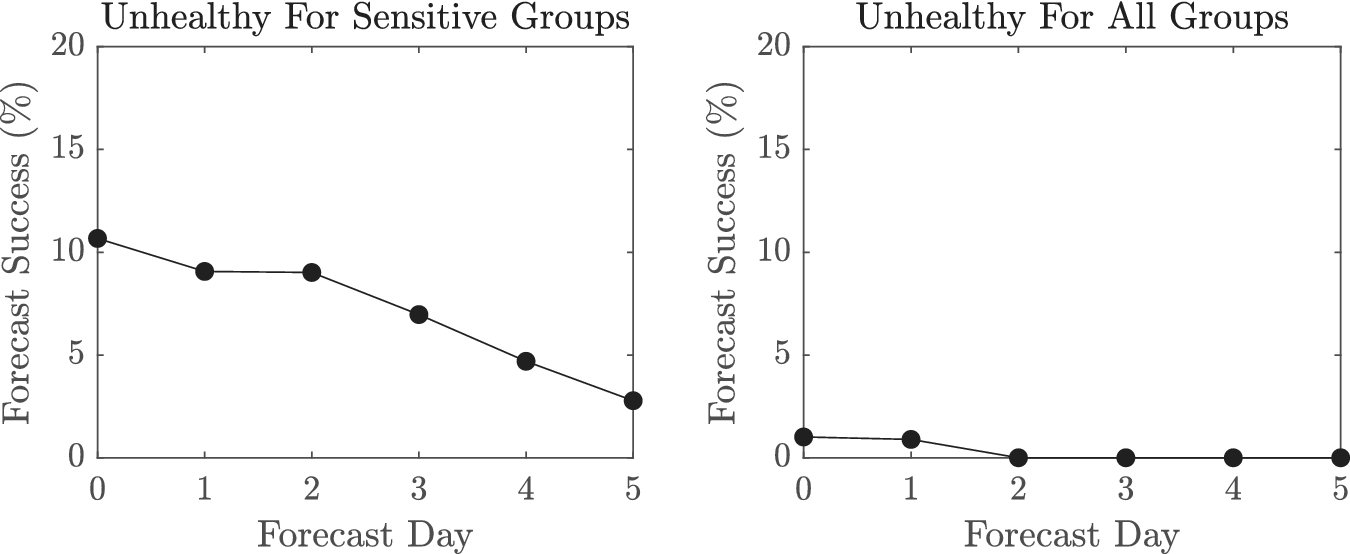

 Open access


Comments
Dear Prof. Maestre Gil and Editors of Drylands,
Please find attached our manuscript entitled “Causes, Impacts, and Future of Dust Storms in California” for consideration as a Review Article in Drylands.
As discussed in prior correspondence, this article provides a comprehensive, interdisciplinary synthesis of dust processes across California’s drylands, spanning land-surface processes, atmospheric dynamics, biogeochemical cycling, vegetation feedbacks, human health impacts, environmental justice, and policy responses. While geographically focused on California, the environmental mechanisms, management challenges, and climate-change links examined here are broadly applicable to other dryland regions.
This review integrates current knowledge on (i) dust sources and drivers of emissions/emission variability, (ii) dust impacts on health, economy, and the environment, (iii) projected future changes under climate and land-use pressures, and (iv) mitigation, forecasting, and adaptation strategies. We aim for this work to serve as a resource for researchers, policymakers, and community stakeholders confronting increasing dust risks in arid and semi-arid regions.
We appreciate your encouragement to submit this work and thank you for your consideration. Please let us know if any additional information is needed.
Sincerely,
Amato T. Evan
(on behalf of all co-authors)
Scripps Institution of Oceanography
University of California San Diego