


Introduction
The collapsed pingos or lithalsas of west Wales (Fig. 1) (Watson, Reference Watson1971; Watson and Watson, Reference Watson and Watson1974; Gurney, Reference Gurney1995; Ross and others, Reference Ross, Harris, Brabham and Sheppard2011) are frequently cited in periglacial geomorphology textbooks (e.g. Ballantyne and Harris, Reference Ballantyne and Harris1994; French, Reference French1996; Ballantyne, Reference Ballantyne2017). The landforms (hereafter referred to using the non-genetic term ‘ramparted depressions’) have been used to: (i) constrain the limits of glaciation (Watson, Reference Watson1972); (ii) estimate last glacial palaeo-temperatures for the British Isles (e.g. Washburn, Reference Washburn1980); (iii) reconstruct late-glacial to Holocene climate (e.g. Handa and Moore, Reference Handa and Moore1976; Walker and James, Reference Walker, James, Walker and McCarroll2001); and (iv) interpret landforms on Mars (Burr and others, Reference Burr, Soare, Wan and Emery2005). The mechanisms and processes responsible for the formation of ramparted depressions in Wales are far from certain, however, with the features having been interpreted as collapsed pingos (Watson, Reference Watson1971), collapsed lithalsas (Gurney, Reference Gurney1995; Ross and others, Reference Ross, Harris, Brabham and Sheppard2011), or formed by the melt-out of ice in the proglacial environment (Ross and others, Reference Ross, Harris and Brabham2007, Reference Ross, Harris, Brabham and Sheppard2011). This uncertainty of origin limits the use of these landforms as palaeoenvironmental proxies and as analogues for Martian landforms. Similar landforms to those in Wales, and also described as ramparted depressions and interpreted as relict ground-ice mounds, have been reported in Ireland, eastern England, Belgium, the Netherlands and Scandinavia (Pissart, Reference Pissart2003).
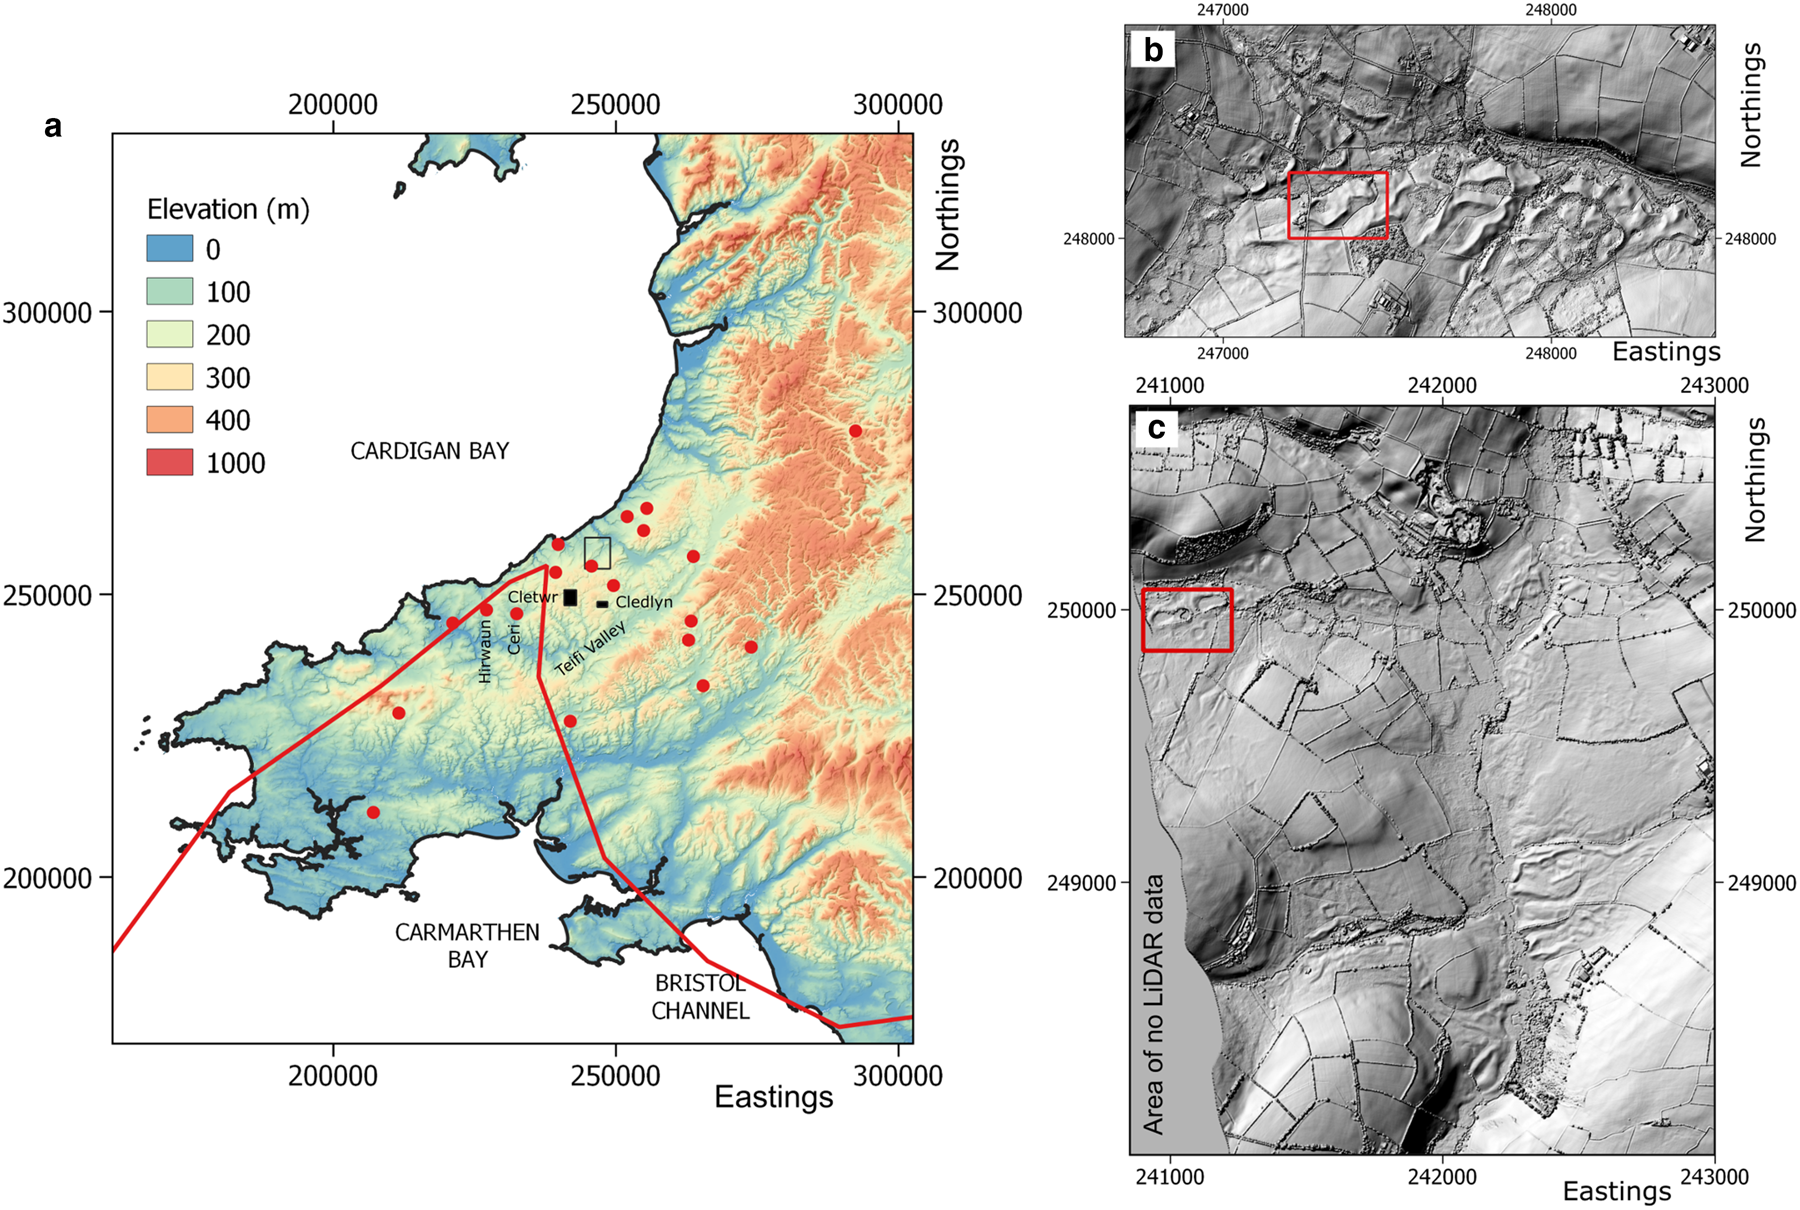
(a) Location map of clusters of ramparted depressions in Wales previously interpreted as relict ground-ice mounds (red dots). Locations of Cledlyn and Cletwr valley study sites, and extents of Figures 1b and 1c (black filled and labelled rectangles), are shown. Elevation data are from the OS Panorama digital terrain model ( Crown Copyright/database right 2019. An Ordnance Survey/(Datacentre) supplied service). Coastline (black line) from Open Street Map (OSM) https://www.openstreetmap.org. Extent of Figure 9 is shown (black outlined rectangle). Red line is 23 ka BP ice limits (Clark and others, 2012); (b) Hillshaded digital surface model (DSM) showing the geomorphology of the Cledlyn Valley derived from airborne LiDAR surveying (Contains Natural Resources Wales information Natural Resources Wales and Database Right. All rights Reserved). Extent of Figure 6a is shown (red box); (c) Hillshaded digital surface model (DSM) showing the geomorphology of the Cletwr Valley derived from airborne LiDAR surveying (Contains Natural Resources Wales information Natural Resources Wales and Database Right. All rights Reserved). Extent of Figure 2a is shown (red box). All maps use the British National Grid reference system. Illumination of hillshades is from NW.
(a) Hillshaded digital surface model (DSM) of ramparted depression ‘Pingo’ 3 at Rhos Llawr Cwrt, Cletwr Fawr derived from airborne LiDAR surveying (Contains Natural Resources Wales information Natural Resources Wales and Database Right. All rights Reserved). Locations of boreholes (red dots), electrical resistivity tomograms (red lines) and seismic refraction survey lines (blue line) are shown. Coordinate reference system is British National Grid. Illumination of hillshade is from NW; (b) Photograph of ‘Pingo’ 3, Rhos Llawr Cwrt, Cletwr Fawr showing peat-filled basin and surrounding rampart.

Early models for formation of ramparted depressions and their associated landforms were predominantly based on geomorphic evidence (e.g. Watson, Reference Watson1971), with some limited insight of internal structure and sub-surface materials gleaned from augering (Watson, Reference Watson1972; Watson and Watson, Reference Watson and Watson1974) and sedimentary sections (Watson, Reference Watson1971, Reference Watson and Watson1975; Gurney, Reference Gurney1995). In order to gain understanding of their deeper sedimentary composition and structures, we undertook invasive drilling and trial pitting, combined with non-invasive near-surface geophysics. We report geophysical and sedimentological investigations of two sites in the Cletwr and Cledlyn valleys of west Wales (Fig. 1). These results challenge the long-prevailing hypothesis that the ramparted depressions of west Wales are of periglacial origin.
Background
Existing interpretations of ramparted depressions in Wales
Landforms that we would describe as ‘ramparted depressions’ have been reported across many parts of central and west Wales (Pissart, Reference Pissart1963; Watson, Reference Watson1971, Reference Watson1972; Watson and Watson, Reference Watson and Watson1974) (Fig. 1). These landforms comprise a range of morphologies with deep (up to 4 m) peat-filled basins impounded by elongated curvilinear to circular ridges of minerogenic sediments, with relief of up to 7 m (Fig. 2). These landforms were initially interpreted as the collapsed forms of open system pingos (Pissart, Reference Pissart1963; Watson, Reference Watson1971), ground-ice mounds formed by the injection and subsequent freezing of groundwater in permafrost. More complex forms were attributed to repetitive pingo formation over extended periods at (hydro-)geologically favourable sites (Watson and Watson, Reference Watson and Watson1974). Later, however, many researchers reinterpreted these landforms as collapsed lithalsas (Pissart and Gangloff, Reference Pissart and Gangloff1984; Gurney, Reference Gurney1995; Worsley and others, Reference Worsley, Gurney and Collins1995; Matthews and others, Reference Matthews, Dahl, Berrisford and Nesje1997; Pissart, Reference Pissart2000, 2003) ground-ice mounds formed in permafrost conditions by the growth of segregation ice within fine-grained frost-susceptible sediments such as lake silts (Calmels and others, Reference Calmels, Delisle and Allard2008). This reinterpretation was predominantly based on the argument that unlike lithalsas (Pissart, Reference Pissart2000), open system pingos do not typically occur in tightly packed clusters (Matthews and others, Reference Matthews, Dahl, Berrisford and Nesje1997). In addition, observations of fine-grained lake sediments within the Cledlyn valley were consistent with a model of lithalsa development (Gurney, Reference Gurney1995).
Although the lithalsa model has many characteristics that can address the limitations of the open system pingo model, frost-susceptible fine-grained glaciolacustrine sediments do not provide or infer a periglacial mechanism. Such sediments are common and widespread in modern-day polar and alpine environments undergoing active temperate maritime deglaciation where lithalsas have not been recorded (e.g. Iceland, Alaska), and there are alternative glacial processes that are consistent with the form, location and internal structure of ramparted depressions in west Wales (Ross and others, Reference Ross, Harris, Brabham and Sheppard2011). Supraglacial and subglacial landforms of the last Laurentide and Fennoscandian ice sheets (e.g. Gravenor and Kupsch, Reference Gravenor and Kupsch1959; Stalker, Reference Stalker1960; Aartolahti, Reference Aartolahti1974; Lagerbäck, Reference Lagerbäck1988) may provide alternative analogues for the ramparted depressions of Wales. Previous studies have not evaluated such possibilities however.
Glacial history of west Wales and the Irish Sea basin
When ramparted depressions were first investigated (i.e. Watson, Reference Watson1971, Reference Watson1972; Watson and Watson, Reference Watson and Watson1974), it was thought that west Wales had remained unglaciated during the last glacial cycle (Watson, Reference Watson and Lewis1970, Reference Watson1972). This concept has now been refuted (Etienne and others, Reference Etienne, Hambrey, Glasser, Jansson, Lewis and Richards2005, Reference Etienne2006; Clark and others, Reference Clark, Hughes, Greenwood, Jordan and Petter Serjup2012; Glasser and others, Reference Glasser2018), and there is clear glacial geological evidence that the coastal parts of west Wales were influenced by ice masses flowing from both the Welsh Mountains (Welsh Ice Cap) and the Irish Sea basin (Irish Sea Ice Stream) during the last glacial cycle (Waters and others, Reference Waters, Davies, Wilson and Prigmore1997; Davies and others, Reference Davies, Sheppard, Waters and Wilson2006; Clark and others, Reference Clark, Hughes, Greenwood, Jordan and Petter Serjup2012; Patton and others, Reference Patton2013; Hughes and others, Reference Hughes, Clark and Jordan2014; Glasser and others, Reference Glasser2018). This poses an interesting question – as the region was glaciated during the last glacial cycle, is it possible that the ramparted depressions of west Wales are of glacial rather than periglacial origin? If the answer to this question is yes, then these landforms are a significant overlooked resource that can provide insight into the properties, behaviour, dynamics, limits and potential interactions of both the Welsh Ice Cap and the Irish Sea Ice Stream during the last glacial cycle. At present there are limited constraints as to the timing of glacial events in this area, whether the two ice masses interacted, or whether they overrode the area at different times.
Methods
Electrical resistivity tomography (ERT)
We applied electrical resistivity tomography (ERT) to determine: (i) hydrogeological context; (ii) the electrical properties of the superficial sediments; and (iii) the depth to bedrock (‘rockhead’). ERT measurements were acquired using an IRIS Instruments SYSCAL Junior Switch 72. This system uses a multi-channel switching unit to control up to 72 steel electrodes to induce current into the subsurface and record the voltage response. Electrodes were inserted into the ground at regular spacings of 3–4 m, depending on the resolution and depth of survey required. Measurements were made using the Wenner-Schlumberger array (Loke, Reference Loke2004). Due to saturated clay- and silt-rich superficial deposits at all our field sites, electrode-ground contact was good, so there was little electrical noise associated with the data. Processing and inversion of the resistivity measurements used Res2DINV (Loke and Barker, Reference Loke and Barker1995; Loke, Reference Loke2004).
Seismic refraction
Seismic refraction data were acquired using a Bison 9000 24-channel seismograph. A spread of 24 Geosource 100 Hz geophones were used to record the data, at a spacing of 2 m, resulting in refraction lines 46 m in length. The seismic source was generated by between five and eight stacked sledgehammer blows on a metal plate. Shot points were located at various distances on and off the geophone spread. To determine the depth and dip of the refractors, multiple offset shot points were positioned in both forward and reverse directions (reversed profile refraction technique) so that multiple shots were recorded for each spread. Processing of the seismic data was performed in Reflexw, with the first arrival times (first negative deflection on the seismogram) for each geophone picked. Direct and refracted events were identified from travel-time graphs and arrivals were assigned to the direct wave and specific refracting horizons. Best-fit lines were produced for each velocity segment by linear regression. Processing used the Common Receiver Method (Hagedoorn, Reference Hagedoorn1959). The aim of the seismic data acquisition was to determine: (i) sub-surface sediment (acoustic) properties; and (ii) depth-to-rockhead. In addition, the seismic data were used to calibrate the ERT measurements of rockhead, which were easier and quicker to acquire, particularly over peaty waterlogged basins. Details on the processing of both the seismic and resistivity data are available in Ross (Reference Ross2006).
Coring and sedimentology
An Atlas Copco Cobra vibro-coring system was utilised to drill boreholes for sedimentological analysis. Cores were logged in the field through the open windows of the core barrels, using a Munsell chart to describe the colour of the sediments. Representative disturbed samples were collected for laboratory grain-size analysis. The aim of the sedimentological observations was to constrain geophysical measurements and to determine near-surface sediment properties directly. Trial pits of depth 1–2 m were excavated using a mini-digger (Figs 6a and b).
Topographic surveying
At sites where high-resolution LiDAR data were not available at the time of field survey (i.e. 2004–2005), topographic surveys utilising a Topcon EDM theodolite were undertaken to measure the topography of the geophysical survey lines. Accuracy is estimated to within ±50 mm, limited by repeatability in target location rather than instrument error. The EDM surveys and the locations of boreholes, trial pits and geophysical survey lines were georeferenced using a handheld Garmin GPS (nominal horizontal accuracy ±5 m). Hillshade maps of topography (e.g. Figs 2 and 9) were derived from airborne LiDAR elevation grids at 1–2 m cell size provided by the Natural Resources Wales (https://lle.gov.wales/catalogue/item/LidarCompositeDataset/).
Cletwr – survey description
One landform was investigated at Rhos Llawr Cwrt (British National Grid 241100.249900) in the Cletwr valley (Fig. 1c). This subdued ramparted depression corresponds to ‘Pingo’ 3 investigated by Watson and Watson (Reference Watson and Watson1974). It is situated on the north-facing slope of the Bwdram valley, a tributary of the Cletwr Fawr, at an altitude of approximately 195 m Ordnance Datum (Fig. 2). Three boreholes were drilled at this site, supplemented by two electrical resistivity surveys (Cletwr-2 and Cletwr-3) and a seismic refraction line (Fig. 2).
Cledlyn – description of survey
A single ramparted depression (‘Pingo Q’ of Watson, 1971) (British National Grid 247300.248100) was investigated in the Cledlyn valley (Fig. 1b). Located on the southern slopes of the Cledlyn valley, ‘Pingo’ Q is a peat-filled basin enclosed by a large rampart on its upslope side that extends west from ‘Pingo’ N and by a subdued rampart downslope (Fig. 6). Three trial pits were excavated along a transect (Fig. 6a), across the enclosing ridge of the landform. Two resistivity lines (Cledlyn-Q1 and Cledlyn-Q2) were also acquired. Topographical profiles were measured in association with the resistivity profiles.
Results
Cletwr – sedimentology
The upper 4–4.5 m of borehole 1 and borehole 3 (Fig. 3) were dominated by poorly sorted, well-graded, compact, non-calcareous gravelly silt to silty gravel diamictons (Fig. 3b). The gravels comprised subangular to rounded mudstone and sandstone clasts, with long axes up to 7 cm in length. Underlying these upper sediments, more than 0.5–1 m of non-calcareous clayey silt was found beneath 4.75 m in borehole 1 and 3.91 m in borehole 3 (Figs 3c and d). This lower unit was characterised, in parts, by very fine, faint laminations (e.g. BH3 4.5–5 m) and occasional small clasts (e.g. BH1 5–5.5 m). The total thickness of this unit of clayey silt is unknown as neither of the boreholes penetrated through it. Borehole 2 (Fig. 3a), located just inside the inner edge of the rampart, was characterised by 2 m of peat underlain by more than 1 m of silty, sandy, clayey gravel, with clasts up to 4–5 cm. The physical properties of the dominant sediment in boreholes 1 and 3 (i.e. poorly sorted diamict with subangular to rounded clasts) (Figs 3a and b) are consistent with a glacial till (Evans and others, Reference Evans, Phillips, Hiemstra and Auton2006).
(a) Fence diagram of boreholes 1–3, vertically adjusted for land surface topography, ‘Pingo’ 3, Rhos Llawr Cwrt, Cletwr Fawr; (b–d) representative photographs of sedimentary facies within the boreholes: (b) silty sandy gravel (borehole 3, 1–2 m); (c) clayey silt with occasional clasts (borehole 1, 5–5.5 m); (d) finely laminated clayey silt (borehole 3, 4.5–5 m).

Cletwr – electrical resistivity
The subsurface in the Cletwr valley is characterised by three distinct zones of resistivity (Fig. 4). A thin, near-surface high resistivity (> 230 Ωm) zone (Zone RLC-1) is identified in the rampart and to the north of the landform, where Zone RLC-1 reaches its greatest thickness. Zone RLC-1 is not apparent or is very thin (< 2 m) in the area beneath the central basin of the landform and in the eastern-most parts of Line Cletwr-3. Beneath Zone RLC-1 is a 6–12 m thick zone of low to intermediate resistivity (80–230 Ωm) (Zone RLC-2). The contact between these uppermost zones is sharp with an abrupt change in resistivity (400–150 Ωm) over < 2 m. Zone RLC-2 is laterally continuous, extending from beyond the margins of the landform, beneath the ramparts, and through the central basin in both resistivity profiles. There is an apparent decrease in resistivity of Zone RLC-2 from south to north (Fig. 4a) and west to east (Fig. 4b). Resistivity values in Zone RLC-2 increase with depth. The third, lowermost resistivity zone (Zone RLC-3) has intermediate to high resistivity values (230–500 Ωm) and extends to depths > 25 m. The contact between this zone and the overlying Zone RLC-2 is gradational in nature with resistivity values increasing over a vertical distance of 2–4 m. This contact is characterised by a marked south to north dip (Fig. 4a), with the 230 Ωm contour dipping from a depth of 6–14 m. The resistivity of Zone RLC-3 shows little lateral variability, but an increase in resistivity is apparent with depth.
Electrical resistivity tomograms ‘Pingo’ 3, Rhos Llawr Cwrt, Cletwr Fawr. (a) Cletwr ERT 2; (b) Cletwr ERT 3. The 230 Ωm resistivity contours are marked on the resistivity profiles by black dashed lines. Coordinates of start and ends of line given in British National Grid format. Locations, and depths, of boreholes 1–3 are shown, as are intersection points of the two profiles. Data are plotted with the same colour scale as Figure 8.

Cletwr – seismic refraction
Three distinct P-wave first break velocity segments (i.e. direct wave and two refracted waves) were recognised in both the forward and reverse directions of the travel-time graph (Figs 5a and b). The average P-wave velocity of the direct wave was 1000 ms−1. The P-wave velocity of the first refracted wave had an average of 1830 ms−1, whilst the second refracted wave had a velocity of 3150 ms−1 (Fig. 5).
Seismic refraction measurements, ‘Pingo’ 3, Rhos Llawr Cwrt, Cletwr Fawr. The seismic refraction profile ran perpendicular to Cletwr ERT 2, intersecting it at the location of borehole 1; (a) seismic refraction traveltime graph; (b) traveltime graph of selected seismic refraction shots, demonstrating the direct, first refracted and second refracted waves observed; (c) Seismic refractor depths and morphology, derived using the Common Receiver Point method.

‘Pingo’ Q, Cledlyn valley. (a) Hillshaded digital surface model (DSM) derived from LiDAR airborne surveying (Contains Natural Resources Wales information ©Natural Resources Wales and Database Right. All rights Reserved), with locations of trial pits and electrical resistivity surveys shown. Coordinate reference system is British National Grid. Illumination of hillshade is from NW; (b) Photograph of the peat-filled basin of ‘Pingo’ Q. Note the subdued rampart downslope (left of photograph) compared to the large upslope rampart (right of photograph). Resistivity line Cledlyn 2 ran eastwards from the point where the photograph was taken, through and beyond the EDM station in the rampart in the far distance. Location of trial pit 3 is marked by mini-digger.

The observation of two refracted waves from the first break data at Rhos Llawr Cwrt indicates a three-layer model (Fig. 5c). The average depth to the first refracted horizon is 4.01 m, but the morphology of the refractor varies from a depth of 3.02 to 6.18 m, with significant variation between 30 and 40 m (Fig. 5c). The average depth to the lower refracted horizon is 21.78 m, with a range of 19.54–23.31 m.
Cletwr – results synthesis
The geophysical results demonstrate that the Cletwr site is characterised by: (i) a 4–5 m thick uppermost near-surface unit of unsaturated superficial sediments with resistivity > 230 Ωm (ERT Zone RLC-1) and a seismic velocity of 1000 ms−1; (ii) a lower unit of saturated superficial sediments with resistivity 80–230 Ωm (ERT Zone RLC-2), a seismic velocity of 1830 ms−1 and a maximum thickness of 18 m; and (iii) bedrock with resistivity of 230–500 Ωm (ERT Zone RLC-3) and a seismic velocity of 3150 ms−1. These geophysical results are consistent with the borehole data, which we interpret to represent a 4–5 m thick near-surface unit of glacial diamict, underlain by at least 0.5 m of glaciolacustrine deposits.
Cledlyn – sedimentology
Trial pits excavated into the rampart of ‘Pingo’ Q were dominated entirely by a homogenous, hard and compact 2.5Y 5/3 light olive brown, orange mottled, well-graded, poorly sorted matrix-supported silty sandy clayey gravel diamict (Figs 7a–d). The diamicton contained subangular to subrounded, highly striated clasts of fine sandstone and mudstone, and occasional subangular clasts of quartz (Figs 7e and f). This material is directly comparable to sediments recovered from boreholes drilled through the rampart of ‘Pingo’ U (Ross, 2006) and in exposures elsewhere within the Cledlyn valley (Watson, Reference Watson1971; Gurney, Reference Gurney1995). The properties of the trial pit sediments (i.e. a poorly-sorted matrix-supported diamict, including occasional subangular to rounded highly-striated clasts) are consistent with the interpretation of these sediments as a glacial till (Evans and others, Reference Evans, Phillips, Hiemstra and Auton2006).
Photographs of sediments and clasts observed in trial pit excavations of the rampart of ‘Pingo’ Q, Cledlyn valley. (a) Trial pit 1; (b) trial pit 2; (c) matrix-supported diamict, trial pit 2, with compass clinometer for scale; (d) matrix-supported diamict, trial pit 2; and (e–f) striated clasts from rampart of ‘Pingo’ Q, black scale bar is 5 cm.

Cledlyn – electrical resistivity tomography
The subsurface in the Cledlyn valley is characterised by three zones of distinct resistivity (Fig. 8). In both survey lines (Cledlyn-Q1 and Cledlyn-Q2) there is a near-surface (including the ramparts and the central basin) 2–7.5 m thick zone of intermediate resistivity (125–300 Ωm) (Zone CL-Q1). Beneath the near-surface zone there is a thick (15–20 m), laterally continuous, zone of low-to-very-low resistivity (30–230 Ωm, though predominantly 30–100 Ωm) (Zone CL-Q2). In Line Cledlyn-Q1 (Fig. 8a), between 110 and 134 m, this zone extends upwards to the ground surface. At the base of both resistivity profiles, underlying Zone CL-Q2, the resistivity increases to higher (intermediate-to-high resistivity) values (230–600 Ωm) at depths of 25–30 m below the ground surface (Zone CL-Q3). The boundary between Zones CL-Q2 and CL-Q3 is gradational in nature, though the resistivity of Zone CL-Q3 increases rapidly with depth. The boundary between Zones CL-Q2 and CL-Q3 has a slight north-northeastward dip in Line Cledlyn-Q1 (Fig. 8a), but is horizontal in Line Cledlyn-Q2 (Fig. 8b), with no lateral change in resistivity apparent.
Electrical resistivity tomography data from ‘Pingo’ Q, Cledlyn valley, (a) Cledlyn Q1; (b) Cledlyn Q2. The 125 Ωm contours in the upper parts of the profiles, and the 230 Ωm contours near the base of the profiles are marked by black dashed lines. Coordinates of start and ends of line given in British National Grid format. Data are plotted with the same colour scale as Fig. 4.

Cledlyn – results synthesis
The geophysical results demonstrate that the Cledlyn site is characterised by: (i) a < 7.5 m thick near-surface unit of unsaturated superficial sediments with resistivity 125–300 Ωm (ERT Zone CL-1); (ii) a 15–20 m thick lower unit of saturated superficial sediments with resistivity 30–230 Ωm (ERT Zone CL-2); and (iii) bedrock with resistivity of 230–600 Ωm (ERT Zone CL-3). These geophysical results are consistent with the trial pit data, which evidence a near-surface unit of subglacial diamict. These new measurements, and interpretation, are consistent with those of Harris (Reference Harris, Walker and McCarroll2001) and unpublished borehole observations compiled in Ross (Reference Ross2006).
Discussion
Sediment properties and thicknesses in west Wales
Our sedimentological and geophysical data demonstrate that the Cletwr and Cledyn valleys are characterised by thick (> 20 m) sequences of superficial deposits dominated by a mixture of fine-grained silts and compact and overconsolidated diamict. The compact nature of the latter, and the common presence of heavily striated clasts within it, indicates that this deposit is till (Evans and others, Reference Evans, Phillips, Hiemstra and Auton2006), with components that have undergone transport at the base of an ice mass. We do acknowledge that under permafrost conditions mass movement by slope processes is enhanced, often leading to the production of sediments similar in nature to glacial till (Benn, Reference Benn1994; Harris, Reference Harris1998). However, the gently-sloping hills that characterise the interfluves of these valleys, and the physical properties of the material, suggest that emplacement of this sediment was directly by glaciation, and not by landscape-scale slope modification of older glacial deposits followed by deformation by massive ground-ice (e.g. Watson and Watson, Reference Watson and Watson1974). Our interpretation of the fine-grained silts is that they are glaciolacustrine sediments deposited in localised and/or valley-scale water bodies, most likely in proglacial or supraglacial environments associated with glacier margin retreat and/or stagnation. Such an interpretation is consistent with recent models of glaciation in west Wales (e.g. Glasser and others, Reference Glasser2018).
Existing mapping and observation in west Wales (e.g. Lear, Reference Lear1986; Waters and others, Reference Waters, Davies, Wilson and Prigmore1997; Davies and others, Reference Davies, Waters, Wilby, Williams and Wilson2003, Reference Davies, Sheppard, Waters and Wilson2006; Etienne and others, Reference Etienne, Hambrey, Glasser, Jansson, Lewis and Richards2005; Wilby and others, Reference Wilby2007; Glasser and others, Reference Glasser2018), and our own observations (Ross, Reference Ross2006) suggest that the thick valley infills of glacial sediments we evidence have restricted lateral extents, with thin or absent superficial cover on interfluves (e.g. between the Cletwr and Cledlyn valleys). Other geophysical and borehole data suggests that this is typical of the small buried bedrock valleys in this region, which are often plugged with thick superficial sediment, yet have relatively low-lying interfluves free of sediment (Waters and others, Reference Waters, Davies, Wilson and Prigmore1997; Harris, Reference Harris, Walker and McCarroll2001; Etienne and others, Reference Etienne, Hambrey, Glasser, Jansson, Lewis and Richards2005; Ross, Reference Ross2006; Ross and others, Reference Ross, Harris, Brabham and Sheppard2011). We assume, though we have no geophysical data, that thicknesses of sediments comparable (i.e. 10–30 m) to those that we evidence in the Cletwr and Cledlyn valleys are also present in the Hirwaun, Ceri and Grannell valleys (Watson, Reference Watson1972), and beneath other parts of the coastal plain north of the north-bank interfluve of the Teifi Valley (Fig. 1a). Here, the coastward-draining valleys are characterised by ‘pingo groups’ (Watson, Reference Watson1972), underlain by glacial till (Waters and others, Reference Waters, Davies, Wilson and Prigmore1997; Davies and others, Reference Davies, Waters, Wilby, Williams and Wilson2003; Wilby and others, Reference Wilby2007) (Figs 1 and 9).
Our sedimentological investigations were unable to identify significant thicknesses of laterally extensive glacio-lacustrine silts in the Cledyn valley necessitated by the lithalsa model (e.g. Gurney and Worsley, Reference Gurney and Worsley1996). Although our resistivity data, and that of Harris (Reference Harris, Walker and McCarroll2001), suggest highly conductive materials beneath the Cledlyn landforms, it is not possible from the geophysical data alone to define lithology. Though they could be consistent with a thick sequence of glacio-lacustrine silts, the resistivity values are equally interpretable as water-saturated glacial tills with a silty-clayey matrix (Reynolds, Reference Reynolds2011), a material which we directly evidenced extensively in our trial pits and in boreholes from the Cledlyn valley (Ross, Reference Ross2006). We did observe fine-grained glacio-lacustrine material at depth beneath the ramparted feature investigated in the Cletwr valley, and nearby exposures suggest that this unit is, at least locally, laterally extensive, though its full thickness is unknown. The presence of this frost-susceptible unit could be conducive to formation of ground-ice and ground heave (cf. Ross and others, Reference Ross, Harris, Brabham and Sheppard2011), which may have permitted lithalsa development in that part of the Cletwr valley. However, given the balance of evidence, that is not our preferred interpretation of these landforms.
A glacial model for the formation of ramparted depressions: analogues from North America and Scandinavia
The geomorphological data extracted from the LiDAR-derived DEMs (Figs 1, 2, 6 and 9) demonstrate that tributary valleys of the Afon Teifi and Cardigan Bay-draining valleys, identified by Watson (Reference Watson1972) as containing clusters of collapsed Pleistocene-age pingos, are not characterised solely by ramparted depressions. Instead, these valleys typically have a chaotic surface topography comprising a mixture of basins, ramparts and linear ridges. In North America and Scandinavia, complex till-cored hummocky topography, including a variety of ice-contact hummocks, rims, ridges and moraine, interspersed with dead-ice hollows (kettle holes), have been reported from areas glaciated during the Late Pleistocene (Hoppe, Reference Hoppe1952; Gravenor and Kupsch, Reference Gravenor and Kupsch1959; Stalker, Reference Stalker1960; Parizek, Reference Parizek1969; Aartolahti, Reference Aartolahti1974; Clayton and Moran, Reference Clayton, Moran and Coates1974; Lundqvist, Reference Lundqvist1981; Mollard, Reference Mollard, Teller and Clayton1983, Reference Mollard2000; Lagerbäck, Reference Lagerbäck1988; Eyles and others, Reference Eyles, Boyce and Barendregt1999; Menzies and Shilts, Reference Menzies, Shilts and Menzies2002; Knudsen and others, Reference Knudsen, Larsen, Sejrup and Stalsberg2006). Of this collection of unequivocally glacial landforms, perhaps those most comparable to the most circular ‘end-member’ landforms found in west Wales are circular ‘closed disintegration ridges’ (Gravenor and Kupsch, Reference Gravenor and Kupsch1959) or ‘rimmed kettles’ (Parizek, Reference Parizek1969). These ring-, or doughnut-shaped ridges range from 10 to 300 m in diameter, are 1–7 m in height, and impound central depressions 0.5–3 m deep (Gravenor and Kupsch, Reference Gravenor and Kupsch1959; Mollard, Reference Mollard2000). Such dimensions are directly comparable to the ramparted depressions of Wales, and demonstrate that glacial processes, not just periglacial ones, can form large ramparted depressions (Figs 6 and 9).
Curvilinear, often SW-NE trending, ridges and ramparted depressions, near the villages of Mydroilyn, Oakford and Llwyncelyn southwest Wales. Landforms are apparent in the hillshaded map of topography derived from airborne LiDAR measurements. Red arrows indicate locations of most obvious landform clusters. Landforms are located only in low-lying areas of the topography, in locations where thick (i.e. > 10 m) sequences of superficial sediments are likely. Contains Natural Resources Wales information ©Natural Resources Wales and Database Right. All rights Reserved. Coordinate reference system is British National Grid. Illumination of hillshade is from NW.

Two mechanisms by which glacial ramparted depressions can develop have been proposed: (i) supraglacial model – the irregular mass movement of supraglacial debris (flow tills) into crevasses and sinkholes around wasting ice blocks during the meltout of stagnant dead ice (Gravenor and Kupsch, Reference Gravenor and Kupsch1959; Parizek, Reference Parizek1969; Clayton and Moran, Reference Clayton, Moran and Coates1974); and (ii) subglacial model – the squeezing of saturated, plastic, subglacial till into basal crevasses and cavities during the stagnation and disintegration of glacier ice resting on fine-grained, water-saturated deformation till (Gravenor and Kupsch Reference Gravenor and Kupsch1959; Hoppe, Reference Hoppe1952; Stalker, Reference Stalker1960; Eyles and others, Reference Eyles, Boyce and Barendregt1999; Boone and Eyles, Reference Boone and Eyles2001). As stagnating ice melts out, small supraglacial lakes can develop, and fine-grained sedimentation in these lakes (dammed both by ice and by ridges of sediment) can result in the formation of a till ridge ring surrounding a basin filled with glaciolacustrine clays (Eyles and others, Reference Eyles, Boyce and Barendregt1999; Clayton and other, Reference Clayton2008; Curry and other, Reference Curry2010). No direct analogy between such landforms and the landforms of west Wales has previously been made, but the similarities in terms of the depositional environments indicated by their sedimentological composition (till and glaciolacustrine sediments) and their morphology (form, density, etc.) means that they offer a plausible analogue for the landforms of the Cledlyn and Cletwr. We therefore propose that the glacial processes outlined above were responsible for the vast majority, if not all, of the landforms in coastal west Wales. Such a model is as convincing, and as consistent with existing observations, as any periglacial model.
The Afon Teifi-Cardigan Bay area: a landsystem of glacier stagnation?
Supraglacial landforms and sediments are frequently associated with escarpments, where ice flow becomes compressional due to some topographic obstruction (Paul, Reference Paul and Eyles1983; Eyles and others, Reference Eyles, Boyce and Barendregt1999; Johnson and Menzies, Reference Johnson, Menzies and Menzies2002; Livingstone and others, Reference Livingstone, Evans, O'Cofaigh and Hopkins2010). The coastal hills of Ceredigion around Cardigan Bay (Fig. 1) are conducive for compressional flow and ice stagnation because both the Irish Sea and Welsh ice flowed uphill into this area from lower ground to the north and the east respectively, though perhaps at different times (Etienne and others, Reference Etienne, Hambrey, Glasser, Jansson, Lewis and Richards2005). During deglaciation it is highly unlikely that any ice that had flowed onto the higher elevation area would have retreated actively. Instead, parts of the ice masses probably became isolated, with in situ stagnation and downwasting taking place, particularly within the upland valleys. The Irish Sea Ice Stream would have been strongly affected by this process, as the ice mass flowed, perhaps surged, inland over the steep cliffs of what is now the current coastline and up the steep rise in topography from the coast (a vertical relief of up to 300 m, when subsea relief is accounted for) (Fig. 1). Similar palaeoglaciological evidence for the over-extension and stagnation of surging or streaming ice lobes has been reported from the Laurentide Ice Sheet margin (Patterson, Reference Patterson1997; Jennings, Reference Jennings2006) and Patagonia (Darvill and other, Reference Darvill, Stokes, Bentley, Evans and Lovell2017).
Once deglaciation began, ice surface lowering, and stagnation and burial of ice, leading to the emplacement and meltout of supraglacial and subglacial debris, would have produced the thick sequences of superficial sediments, and the formation of the ridges, hummocks and depressions in the area of the Afon Teifi-Cardigan Bay watershed (Watson, Reference Watson1972; Watson and Watson, Reference Watson and Watson1974; Ross, Reference Ross2006). Where the stagnating ice rested on saturated unconsolidated materials, subglacial sediments could have been deformed and remobilised by differential overburden pressures, causing the development of ‘squeeze-up structures’ analogous to the processes inferred to have formed ring-ridges in North America and Scandinavia (Hoppe, Reference Hoppe1952; Stalker, Reference Stalker1960; Eyles and others, Reference Eyles, Boyce and Barendregt1999). Elongate NE-SW oriented ridges (e.g. Fig. 9) would also be likely due to marginal and subglacial processes such as sediment squeezing into basal crevasses to form crevasse-squeeze ridges (e.g. Sharp, Reference Sharp1985).
Though existing observations and data do not allow us to confirm whether Irish Sea or Welsh ice was responsible for landform formation, the orientation of most of the ridges (e.g. Fig. 9 and in the Cletwr and Hirwaun valleys) suggests sediment deposition and landform generation by ice flowing, or potentially surging, south. This points to Irish Sea ice, and/or deflected Welsh ice, being responsible. Though calcareous till within ramparted features in the Hirwaun and Ceri valleys (Watson, Reference Watson1972) and reports of far travelled erratics (Davies and others, Reference Davies, Sheppard, Waters and Wilson2006) are consistent with deposition by onshore flowing Irish Sea ice, sediments analysed from beneath the Cledlyn and Cletwr valley floors during this project were devoid of calcium carbonate, based on contact with hydrochloric acid.
Basin infill of the ramparted depressions
As well as being consistent with the available field evidence, a glacial origin for many ramparted depressions in the Afon Teifi-Cardigan Bay watershed area provides an elegant solution to the apparently intractable problem of the origins and significant thickness (~9 m) of fine-grained silty-clays infilling the basins of some ramparted depressions in the Cledlyn valley (Watson, Reference Watson1972; Watson and Watson, Reference Watson and Watson1972). Although Gurney (Reference Gurney1994, Reference Gurney1995) and Gurney and Worsley (Reference Gurney and Worsley1996) believe that these sediments were deposited in an extensive proglacial lake prior to landform (lithalsa) formation, there is no sedimentological evidence for a thick sequence of such sediments in trial pits or boreholes beyond the confines of the central depressions of the landforms. Thick sequences of fine-grained silts and clays deposited under quiet-water conditions are characteristic of areas of hummocky moraine in North America and Scandinavia however (e.g. Stalker, Reference Stalker1960; Eyles and others, Reference Eyles, Boyce and Barendregt1999; Mollard, Reference Mollard2000). Many rim-ridge landforms in those areas are infilled with thick (up to tens of metres) accumulations of glaciolacustrine sediments (Stalker, Reference Stalker1960; Lagerbäck, Reference Lagerbäck1988; Eyles and others, Reference Eyles, Boyce and Barendregt1999; Mollard, Reference Mollard2000), and stratified lacustrine sediments more than 7 m thick are associated with the De Kalb mounds of Illinois (Flemal and others, Reference Flemal, Hinkley and Hesler1973; Flemal, Reference Flemal1976; Menzies and Shilts, Reference Menzies, Shilts and Menzies2002; Iannicelli, Reference Iannicelli2003; Clayton and other, Reference Clayton2008; Curry and other, Reference Curry2010). The current evidence for the distribution of glaciolacustrine sediment in the Cledlyn valley is therefore more consistent with a model of localised deposition associated with stagnation of glacier ice, than a model of widespread proglacial deposition, followed by lithalsa formation.
The basin infills of the landforms do pose one potential issue for the ice stagnation model proposed. Within the basins there is an apparent absence of Lateglacial interstadial (14.7–12.9 ka BP) organic deposits within the central depressions of any ramparted depressions (Watson, Reference Watson1972; Watson and Watson, Reference Watson and Watson1972; Handa and Moore, Reference Handa and Moore1976; Walker and James, Reference Walker, James, Walker and McCarroll2001). This may appear to contradict the glacial model, as it could be interpreted that infill of the central depressions began no earlier than the end of the Younger Dryas (12.9–11.5 ka BP). If the landforms were formed by glacial processes during the last glaciation, then their central depressions should contain organic deposits dating to the interstadial. There are several reasons why this might not be the case however (Ballantyne and Harris, Reference Ballantyne and Harris1994): (i) the survival of subsurface ice during the early parts of the interstadial; (ii) the non-accumulation of interstadial organic deposits; and (iii) the burial of interstadial deposits beneath minerogenic sediments during the Younger Dryas. In southwest Norway, the infill of some glacial moraine rim ridges (Veiki or Pulju moraines) contain full Lateglacial sequences, whilst adjacent landforms contain only organic-rich gyttja, believed to be Holocene in age, indicating that the absence of Lateglacial sediments does not necessarily preclude a glacial origin for ramparted depressions (Knudsen and others, Reference Knudsen, Larsen, Sejrup and Stalsberg2006). It may be that sediments of interstadial age exist within the ramparted depressions of west Wales, but that they have not yet been recovered.
Implications for the glaciation of Wales and the Irish Sea basin
The interpretation that the ramparted landforms of the Cledlyn, Cletwr and surrounding valleys of West Wales are of glacial, rather than periglacial, origins has broader implications for the glaciation of Wales and the Irish Sea. For example, if these landforms represent last glacial maximum ice marginal conditions in west Wales, how can such ice margins be reconciled with more expansive limits associated with surging of the Irish Sea Ice Stream to the Scilly Isles (e.g. Smedley and others, 2017)? If the Irish Sea Ice Stream did extend to the Scilly Isles, but was relatively thin with a low-angled surface profile, then our observations and interpretation of landforms in west Wales are consistent with this model. The Irish Sea Ice Stream must have been several 100 m thick to deposit sediments where it did in west Wales (e.g. the Hirwaun valley) (Etienne and others, Reference Etienne, Hambrey, Glasser, Jansson, Lewis and Richards2005; Glasser and others, Reference Glasser2018). When this ice reached the present west Wales coast, the bed conditions changed markedly, from soft marine bed conditions, to a mixed bedrock-sediment or bedrock bed in association with a rising topography. The rising topography, combined with a shift in bed conditions and the possible presence of local Welsh ice (Glasser and others, Reference Glasser2018), may have produced a significant topographic barrier and a marked increase in basal resistance, inhibiting ice flow southwards in this part of the Irish Sea. Where the Irish Sea Ice Stream was not constrained by local Welsh ice and/or the rising topography, its flow south was unimpeded, thereby allowing limited ice extents in west Wales (Glasser and others, Reference Glasser2018), as well as an ice lobe extending to the Scilly Isles (Smedley and others, Reference Smedley2017). Therefore, the glacial geomorphology and geology of the coastal valleys of west Wales could be critical for reconstructing the ice thickness, and therefore the palaeoglaciology, of the Irish Sea glacier. Our site-specific investigations in the Cletwr and Cledlyn valleys are broadly consistent with the ice limits of the integrated geomorphological and deglaciation model for the Welsh Ice Cap and Irish Sea Ice Stream presented by Glasser and others (Reference Glasser2018).
Conclusions
Based on the LiDAR-derived geomorphology, and characterisation of sediment properties and thickness from sedimentology and geophysics, we propose a new model for ramparted depression formation in west Wales. Our investigations have revealed: (a) in situ subglacial till; (b) glaciolacustrine sediments at depth; (c) thick (i.e. > 25 m) sedimentary sequences; and (d) lineation of landforms. We use these new observations to develop a new model, grounded in Pleistocene-age analogues for these landforms. We argue that the presence of frost-susceptible sediments alone does not provide unequivocal evidence that the landforms are the remains of lithalsas. Given that this area was glaciated during the last glacial cycle (Glasser and others, Reference Glasser2018), invoking periglacial processes for these landforms seems overly complex. We argue that the simplest explanation for these landforms is that they are glacial in origin, and formed by processes associated with ice margin stagnation, and the meltout of debris-rich buried ice. These findings have broader implications for the palaeoglaciology of the broader Irish Sea basin, as these landforms provide an extensively overlooked resource of glacial conditions relating to both the Irish Sea and Welsh ice masses during the last glacial cycle. We acknowledge that our interpretation presents a bold hypothesis, that requires future field investigations. However, for the first time such field investigations can proceed with an ice-stagnation hypothesis to test. What is unequivocal is that there is much remaining to be discovered about the glacial history of west Wales and the south eastern coastal regions of the Irish Sea basin. Future work should investigate: (a) the deep sedimentary fill within the valleys of west Wales; (b) comparison of these regionally widespread landforms with modern landforms produced by glacier surging and related processes; (c) the spatial relationship between Welsh and Irish Sea ice; and (d) targeting the peat-filled central basins of ramparted depressions for Lateglacial sediments.
Acknowledgments
This work was undertaken when NR was in receipt of a Cardiff University/Countryside Council for Wales studentship. A British Geological Survey-NERC funded commissioned research project (UCAC grant 2K03E024 – Geological Mapping Solutions for Quaternary Ground Ice Systems) provided funding for part of the fieldwork. The authors would like to thank: Stewart Campbell and Huw Sheppard for their input into the project; Terradat for the loan of their resistivity meter; Natural Resources Wales and the Environment Agency for acquiring and providing LiDAR data; the landowners for permitting access to the sites; and Andrew George for his assistance in the field. We are grateful to Brandon Curry and an anonymous reviewer for their detailed reviews, which substantively improved this manuscript. Chris Clark and Louise Callard are thanked for sharing ice limit GIS files and information on offshore bathymetry respectively. NR would like to thank the QGIS Geographic Information System (Open Source Geospatial Foundation: http://qgis.org), used to produce the maps in this manuscript. This free software has substantively reduced his GIS-related stress levels over the last 5 years, for which he is exceedingly grateful.


 Open access