

Down syndrome (DS) is a major genetic disorder caused by trisomy of chromosome 21, leading to recognisable physical and facial features and several chronic disorders. The prevalence of this disorder is approximately one in 660 live births( Reference Devlin and Morrison 1 ), and it increases with maternal age( Reference Newberger 2 ). DS is the leading cause of genetically defined intellectual disability and congenital birth defects.
In the UK, one to two children with DS are born every day, and they present a much higher risk of developing leukaemia, diabetes, heart disease, premature ageing and dementia, and Alzheimer's disease (AD)-like pathology at the age of 30–40 years( Reference Harman 3 , Reference Zigman and Lott 4 ) when compared with non-affected children. Early onset of AD has been causally related to the overexpression of β-amyloid precursor protein, which is one of the triple genes in DS( Reference Mehta, Capone and Jewell 5 , Reference Schupf, Patel and Pang 6 ).
Another gene located on chromosome 21 is the superoxide dismutase (SOD-1) gene. Its overexpression leads to a dramatic increase in SOD-1 enzyme activity( Reference Muchová, Sustrová and Garaiová 7 , Reference Ordonez, Rosety-Plaza and Rosety-Rodriguez 8 ). This consequence is thought to disturb the natural antioxidant enzyme balance in individuals with DS, inducing oxidative stress( Reference Schweber 9 , Reference Lott and Head 10 ). Increased levels of oxidative stress have been detected in children with DS( Reference Jovanovic, Clements and MacLeod 11 ), and concomitantly higher activities of other antioxidant enzymes, including glutathione peroxidase (GPx) and catalase, have also been reported to be increased( Reference Percy, Dalton and Markovic 12 , Reference Pastor, Sierra and Doladé 13 ).
The brain is particularly vulnerable to lipid peroxidation( Reference Yavin, Brand and Green 14 ) due to its high content of oxidisable PUFA, especially DHA (22 : 6n-3), which is a major plasma membrane fatty acid (FA) component, essential for brain development, signal transduction and synaptic function( Reference Sinclair and Crawford 15 ). Increased lipid peroxidation has been suggested as a mechanism leading to AD( Reference Liu, Smith and Avilá 16 ), and even more specifically, chronic losses of DHA are thought to contribute to AD( Reference Bazan 17 , Reference Lukiw and Bazan 18 ). Furthermore, low levels of EPA (20 : 5n-3), one of the precursors of DHA, are considered as a predictor of dementia risk( Reference Samieri, Féart and Letenneur 19 ). Moreover, neuroprotectin D1, a derivative of DHA, has been reported to preserve neuronal systems from oxidative stress and potentially protect from neurodegeneration as in AD( Reference Palacios-Pelaez, Lukiw and Bazan 20 ), but only very little information is available about the status of PUFA in people with DS.
Cell membrane lipid composition is directly influenced by environmental variables, particularly diet, and abnormalities of membrane lipid composition and metabolism have been implicated in type 2 diabetes( Reference Bakan, Yildirim and Kurtul 21 ), obesity( Reference Younsi, Quilliot and Al-Makdissy 22 ) and AD( Reference De Franceschi, Olivieri and Corrocher 23 ). It is not known yet whether the cell membrane FA composition is altered in children with DS, or whether any alteration in their cell membrane lipids might be related to the increased risk of developing diabetes, obesity, early mental decline and AD. Nutrition has been suggested as an interventional strategy aiming to prevent or reduce glycoxidation damage that appears to play a role in cognitive deterioration and the early onset of dementia in people with DS( Reference Thiel and Fowkes 24 ); however, no data are available about the influence of PUFA supplements on the well-being of people with DS.
The aim of the present study was to investigate whether the extra copy of chromosome 21 has an influence on the FA composition of phospholipids (PL) in the erythrocyte membrane of children with DS, when compared with their non-affected siblings. TLC, GC and electrospray ionisation/tandem MS (ESI-MS/MS) were employed to study the possible changes in the PUFA profile and intact PL molecular species. Our data provide evidence that the FA profile of PL in erythrocyte membrane and plasma is significantly modified in children with DS. While PUFA and plasmalogen species are markedly reduced, the content of SFA and MUFA is dramatically increased.
Subjects and methods
Subjects
A total of twenty-five families with children with DS and their non-affected siblings volunteered for the present study conducted at the Holloway Mother and Baby Clinic (HMBC), at London Metropolitan University, through advertisement posted on the Down Syndrome Research Foundation website. We aimed to compare children with DS with their unaffected siblings to help control for family backgrounds, dietary patterns and social status, which could interfere with the outcomes of the study. The present study was conducted according to the guidelines laid down in the Declaration of Helsinki, and all procedures were approved by the Ethics Committee of London Metropolitan University, and endorsed by the Down Syndrome Research Foundation. Written informed consent was obtained from the parents, and verbal consent was obtained from the children, witnessed and formally recorded.
Diet analysis
A 7 d food diary was obtained from all the participants before the interview, sent by post to the State Registered Dietitian, and analysed. The records were analysed by the dietitian using the software/database FOODBASE version 3.1, which is based on ‘McCance and Widdowson's The Composition of Foods’ and its ten accompanying supplements( Reference McCance, Widdowson and Holland 25 ), and enhanced FA data produced by the Institute of Brain Chemistry and Human Nutrition. The food diary and nutrition software has been validated previously( Reference Wynn, Wynn and Doyle 26 ). The diet provided thorough data on nutrient intake and, particularly, each member of the n-6 and n-3 FA classes.
Subsequent to the food diary, the families were invited by the dietitians (N. B. and M. M. N.) for an interview at the HMBC. Dietetic advice was given to the families based on the diet analysis, and particular attention was paid to diet habits, details that might have been under- or over-reported in the diaries, and the use of nutrient supplements. Children who were taking vitamins or food supplements, even sporadically, were excluded from the present study, as well as children who were taking food supplements up to 2 months before the appointment. A number of children were consuming fish oil or other nutritional supplements; consequently, both the child with DS and the non-affected sibling were excluded. Only the results for nine families are reported in the present study.
Blood collection
A non-fasting 3 ml venous blood sample was collected in EDTA tubes at the HMBC by a locum nurse after the interview. The blood sample was immediately taken to the Institute of Brain Chemistry and Human Nutrition laboratory, centrifuged, and plasma, buffy coat and erythrocyte fractions were obtained. Erythrocytes were washed three times with Dulbecco's PBS (Sigma). All aliquots were flushed with oxygen-free N2 and frozen at − 80°C until analysis.
Lipid extraction and fatty acid analysis
Total lipids were extracted from erythrocytes and plasma by the method of Folch et al. ( Reference Folch, Lees and Sloane Stanley 27 ), and FA analysis was performed according to standard procedures as reported previously( Reference Bueno, Ghebremeskel and Bakheit 28 ). Briefly, erythrocyte samples (1 ml) were homogenised in 45 ml chloroform–methanol (2:1, v/v) containing 0·01 % butylated hydroxytoluene under oxygen-free N2. Ethanolamine, choline, serine phosphoacylglycerols (PtdEtn, ChoGpl and PtdSer) and sphingomyelin (CerPCho) were separated with chloroform–methanol–methylamine (65:35:15, by vol.) on 20 × 20 cm2 silica gel TLC plates (VWR International) at room temperature. Plasma samples were extracted and separated in the same manner. The plasma neutral lipids cholesterol esters and TAG were scraped from the plasma TLC plates, washed with petroleum ether–diethyl ether (50:50, v/v) and separated with petroleum ether–diethyl ether–formic acid–methanol (85:15:2·5:1, by vol.) on TLC plates at room temperature. The lipid bands were detected by spraying with 2,7-dichlorofluorescein (0·01 %, w/v) in methanol, visualised under UV light and compared with authentic standards (Sigma). FA methyl esters were obtained by heating the PL fractions scraped from the TLC plates with 15 % acetyl chloride in dry methanol in a sealed tube at 70°C for 3 h under oxygen-free N2. The reaction was stopped by the addition of 5 % NaCl solution at room temperature, and FA methyl ester were extracted by washing three times with petroleum ether containing 0·01 % butylated hydroxytoluene. FA methyl ester were separated by GC (HRGC MEGA 2 series; Fisons Instruments) fitted with a capillary column (BPX70; Thames Restek). Peak areas were quantified (EZChrom Chromatography Data System; Scientific Software, Inc.), values are expressed as the percentage of total FA, and the calculation of area percentage was assumed to be equivalent to weight percentage.
Enzyme activity determination
Erythrocyte SOD (U/ml; where one unit is defined as the amount of enzyme needed to exhibit 50 % dismutation of the superoxide radical), GPx (nmol/min per ml) and catalase (nmol/min per ml) were analysed by commercially available ELISA kits (Cayman Chemicals), according to the instructions of the manufacturer.
Electrospray ionisation-MS/MS
ESI-MS/MS measurements were performed on a Q-TOF Micro hybrid quadrupole time-of-flight mass spectrometer (Waters Corporation), as described previously( Reference Brand, Crawford and Yavin 29 ). Briefly, erythrocyte lipids were extracted with a mixture of hexane–isopropanol (3:2, v/v) containing 0·01 % butylated hydroxytoluene. The samples were washed with chloroform–methanol–water (2:1:1, by vol.). After low-speed centrifugation, the organic layer was isolated, evaporated to dryness and lipids partitioned again in the chloroform layer of a chloroform–methanol–water solution (8:4:3, by vol.). The chloroform layer containing the crude lipid extracts was evaporated to dryness and dissolved in methanol–chloroform (2:1, v/v) to a concentration < 5 pmol/ml and infused directly into the ESI chamber at a flow rate of 5–8 μl/min. Typically, a 1–2 min period of signal averaging was employed for each spectrum. The capillary was operated at − 2·5 kV in the positive-ion mode. Desolvation temperature was maintained at 180°C. MS data were processed with MassLynx 4.0 software (Waters Corporation) to produce peak list files. The identities of all indicated molecular species were confirmed by ESI-MS/MS. To acquire suitable product-ion spectra, collision energies were varied between 25 and 35 eV. 13C isotope effects were corrected by determining the individual type II 13C isotope correction factor, as described previously( Reference Han and Gross 30 ). For positive-ion analyses and identification of positively charged PL species, aliquots of lipid extracts were treated with CHCl3–CH3OH–50 mm-NH4Cl (2:1:1, by vol.) in order to minimise the contributions of metal ions allowing the formation of [M+H]+ adducts, thus simplifying ESI-MS/MS spectra. Subsequently, LiOH (final concentration 2 mm) was added to the samples to allow the formation of [M+Li]+ adducts and facilitate informative fragmentation by MS/MS. These samples were not used for quantification as alkaline treatment might induce some PL hydrolysis.
Statistical analysis
Results are presented as means and standard deviations. For the analysis of PL molecular species, we tested for differences between children with DS and their non-affected siblings by the Mann–Whitney U test. For the other analysis, Student's t test was used. Differences were considered statistically significant at P< 0·05. Details about sample sizes are given in the individual table and figure legends.
Results
A total of twenty-five families with children with DS and their non-affected siblings volunteered for the present study; however, not all children were able to participate fully in the study. The analysis of a 7 d food diary for each child revealed significant differences in their n-9, n-6 and n-3 FA intake due to PUFA-containing food supplements in various concentrations, from various suppliers. Hence, children who were taking any fish oils, vitamins or other supplements, even sporadically, were excluded from the present study, as well as those who had taken supplements, up to 2 months before the appointment and blood sampling. Thus, only children from nine families were included in the present study. The average age for healthy siblings was 9·2 (sd 4·4) years, and for children with DS was 5·9 (sd 3·7) years (statistically similar). The study contained four boys and seven girls in the healthy sibling group, and five boys and four girls in the DS group (Table 1). The average intakes of energy and nutrients, specifically n-3, n-6 and n-9 FA, were similar between children with DS and their unaffected siblings (data not shown).
Age and sex of children with Down syndrome (DS) and their healthy siblings (HS) (Mean values with standard deviations, n 11 for HS and n 9 for DS)
Lipid analysis
Blood samples were collected and lipid extracts were prepared from erythrocytes and plasma. Following separation of the various PL fractions by TLC, GC analysis revealed the changes in the FA profile of PL fractions in erythrocyte membrane, as well as changes in PL and neutral lipid fractions in plasma. The major PL classes, i.e. the aminophosphoacylglycerols (PtdEtn and PtdSer) which are rich in PUFA, and the rather SFA-rich PL (ChoGpl and CerPCho) of erythrocyte membrane were analysed, as well as plasma ChoGpl, TAG and CE.
In the erythrocyte membrane PtdEtn of children with DS, the amount of the major SFA 16 : 0 was increased by 14 %, causing the total amount of SFA to be elevated when compared with the samples of healthy siblings (Table 2). The amount of the major MUFA 18 : 1n-9 was increased by 7·3 %, and that of a minor MUFA, 18 : 1n-7, was elevated by 16 %. In contrast to the other PL classes, PtdEtn is rather rich in a particular group of phosphoacylglycerols measurable by GC analysis as fatty aldehyde dimethylacetals (DMA). DMA species are the cleavage products of 1-alkenyl 2-acyl phosphoacylglycerol species, also known as plasmalogens. Plasmalogens consist of an aldehyde in the sn-1 position, giving rise to a single vinyl ether double bond and a long-chain hydrocarbon containing a carboxyl group esterified to the sn-2 position of the glycerol moiety possessing between two to six double bonds. The amount of 18 : 0 DMA, reflecting the major plasmalogen PtdEtn species in erythrocyte membrane, was reduced by more than 20 % in children with DS.
Fatty acid (FA) composition of erythrocyte ethanolamine (PtdEtn) and serine phosphoacylglycerols (PtdSer) in children with Down syndrome (DS) when compared with their healthy siblings (HS) (Mean values and standard deviations of total FA (%), n 11 for HS and n 9 for DS)

DMA, fatty aldehyde dimethylacetals.
Mean value was significantly different from that of the HS group: * P< 0·05, ** P< 0·01, *** P< 0·001.
Of the n-6 PUFA families, the amounts of two n-6 FA (18 : 2n-6 and 22 : 4n-6) were found to be altered in the erythrocyte membrane PtdEtn of children with DS. The amount of dietary essential FA linoleic acid (18 : 2n-6) was increased by 15 %, while its metabolic elongation and desaturation product 22 : 4n-6 was decreased by 18 %. Consequently, the ratio 18 : 2n-6/20 : 4n-6 was increased and the ratio 22 : 4n-6/22 : 5n-6 was decreased. There were no statistically significant changes in the distribution of n-3 PUFA (Table 2) in this PL fraction.
Analysis of the FA profile in erythrocyte membrane PtdSer, the second PUFA-rich PL class, revealed no significant differences in the amounts of SFA, MUFA or n-3 and n-6 PUFA. However, the amount of 18 : 0 DMA, a minor species in PtdSer since plasmalogens are not as prominent in PtdSer as in PtdEtn, was reduced on average by 68 % in children with DS compared with their healthy siblings.
ChoGpl represents the major PL class in erythrocyte membrane as well as in plasma. In the erythrocyte membrane ChoGpl of children with DS, the amount of the major SFA 16 : 0 was increased from 33 to 36 % of the total ChoGpl FA, while that of 18 : 0 was decreased from 12 to 11 %, resulting in an elevated amount of SFA when compared with the samples of unaffected siblings (Table 3). A similar trend could be found in plasma ChoGpl, although the numbers were less significant (Table 3). While the major MUFA (18 : 1n-9) in erythrocyte membrane and plasma ChoGpl remained unchanged, its isomer 18 : 1n-7 was increased from 1·5 to 1·8 % (a 20 % increase), and from 1·3 to 1·7 % (a 31 % increase), in erythrocyte membrane and plasma ChoGpl, respectively. In addition, another n-7 FA, palmitoleic acid (16 : 1n-7), was significantly elevated in plasma ChoGpl.
Fatty acid (FA) composition of erythrocyte and plasma choline glycerophospholipids in children with Down syndrome (DS) when compared with their healthy siblings (HS) (Mean values and standard deviations of total FA (%), n 11 for HS and n 9 for DS)

DMA, fatty aldehyde dimethylacetals.
Mean value was significantly different from that of the HS group: * P< 0·05, ** P< 0·01, *** P< 0·001.
Plasmalogen species are less abundant in ChoGpl when compared with PtdEtn. However, the amounts of 16 : 0 DMA and 18 : 0 DMA were significantly reduced in the erythrocyte membrane of children with DS, causing an approximately 24 % decrease in total DMA. Changes in plasma ChoGpl plasmalogens were not statistically significant.
The amounts of total n-6 FA were reduced in the erythrocyte membrane ChoGpl of children with DS, mainly due to a 13 % reduction in the amount of 20 : 4n-6. The amount of 20 : 5n-3 in the erythrocyte membrane and plasma ChoGpl of children with DS was statistically similar to that found for their healthy siblings; however, it showed a very strong tendency towards reduction (P= 0·060 for erythrocytes and P= 0·067 for plasma; Table 3).
The fourth PL fraction analysed in erythrocyte membrane samples was CerPCho (Table 4). Overall, a tendency of the increase in palmitic acid (16 : 0) values in the erythrocytes of children with DS was observed (P= 0·067), but no significant differences in the total amounts of SFA were found. The total amount of MUFA was significantly increased, but no change in any individual MUFA reached statistical significance. The ratio 18 : 0/MUFA decreased, and this result is consistent in nearly all the fractions studied. The total amount of DMA tended to be lower in the erythrocyte membrane CerPCho of children with DS, but there was no increase in the amount of individual DMA FA, and this result was repetitive in nearly all the fractions studied. There were no statistically significant differences in the amount of n-6 or n-3 PUFA (Table 4).
Fatty acid (FA) composition of erythrocyte sphingomyelin (CerPCho) and plasma cholesterol esters (CE) in children with Down syndrome (DS) when compared with their healthy siblings (HS) (Mean values and standard deviations of total FA (%), n 11 for HS and n 9 for DS)

Mean value was significantly different from that of the HS group: * P< 0·05, ** P< 0·01, *** P< 0·001.
CE represent a major lipid fraction in plasma. GC analysis revealed only minor changes in cholesterol esters SFA. As in erythrocyte membrane and plasma ChoGpl, the amount of 18 : 0 was decreased in children with DS. The amount of 18 : 1n-7 was increased by 20 % in plasma cholesterol samples of children with DS, but the values did not reach statistical significance as in other fractions. No differences were found for DMA or n-6 and n-3 PUFA. The amount of 20 : 5n-3 in children with DS was not statistically different from that found in their healthy siblings, but similarly to erythrocyte and plasma ChoGpl data, it showed a strong tendency towards reduction (P= 0·064; Table 4). No differences were found in the FA composition of plasma TAG (data not shown).
Antioxidant enzymes
Enzyme activities of erythrocyte SOD, GPx and catalase were determined. Erythrocyte SOD activity (U/ml) was found to be increased by 25 % in the blood samples of children with DS (P= 0·02; Fig. 1). GPx activity (nmol/min per ml) was increased by 40 %. No differences were found for catalase activities (data not shown).
Activities of erythrocyte superoxide dismutase (SOD: Down syndrome (DS, ![]() ), n 8; healthy siblings (HS), n 7) and glutathione peroxidase (GPx: DS, n 9; control (
), n 8; healthy siblings (HS), n 7) and glutathione peroxidase (GPx: DS, n 9; control (![]() ), n 7) in children with DS when compared with their HS. Values are means, with their standard errors represented by vertical bars. * Mean value was significantly different from that of the HS group (P< 0·05). One unit of SOD is defined as the amount of enzyme needed to exhibit 50 % dismutation of the superoxide radical.
), n 7) in children with DS when compared with their HS. Values are means, with their standard errors represented by vertical bars. * Mean value was significantly different from that of the HS group (P< 0·05). One unit of SOD is defined as the amount of enzyme needed to exhibit 50 % dismutation of the superoxide radical.

Phospholipid molecular species analysis
PL molecular species in erythrocyte membrane were analysed by MS (ESI/quadrupole time-of-flight) analysis. This technique allows the resolution of intact PL in their native form directly from crude lipid extracts without prior chromatographic separation or derivatisation. Identification of all signals was carried out by the product-ion tandem MS/MS method based on characteristic fragmentation spectra for all peaks. Fig. 2(a) shows a section of the positive-ion ESI-MS/MS spectrum of a crude lipid extract of erythrocyte membrane from children with DS. The major ChoGpl molecular species and the peak assignment are shown in Fig. 2(a).
Changes in choline phosphoacylglycerol (PC) molecular species in the erythrocyte membrane lipids of children with Down syndrome (DS, ![]() ) when compared with their healthy siblings (HS). (a) Section of a representative positive-ion electrospray ionisation-MS/MS spectrum of erythrocyte membrane PC from a healthy sibling
) when compared with their healthy siblings (HS). (a) Section of a representative positive-ion electrospray ionisation-MS/MS spectrum of erythrocyte membrane PC from a healthy sibling ![]() . The spectrum shows [M+H]+ adducts only (see the ‘Subjects and methods’ section for details). (b) Palmitic acid (16 : 0)-containing PC species are expressed as the percentage of total erythrocyte membrane PC species. Values are means (HS, n 5; DS, n 5), with standard deviations represented by vertical bars. * Mean value was significantly different from that of the HS group (P< 0·05). m/z, mass:charge ratio; FA, fatty acid.
. The spectrum shows [M+H]+ adducts only (see the ‘Subjects and methods’ section for details). (b) Palmitic acid (16 : 0)-containing PC species are expressed as the percentage of total erythrocyte membrane PC species. Values are means (HS, n 5; DS, n 5), with standard deviations represented by vertical bars. * Mean value was significantly different from that of the HS group (P< 0·05). m/z, mass:charge ratio; FA, fatty acid.
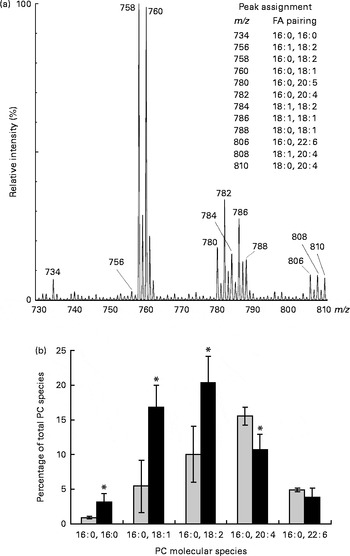
Palmitic acid (16 : 0) is one of the major SFA in various erythrocyte membrane PL (5–35 % of total FA) and plasma ChoGpl and CerPCho (28 and 22 % of total FA, respectively) (Tables 2–4). In the erythrocyte membrane ChoGpl of children with DS, significant changes in the distribution among 16 : 0-containing molecular species were found. ChoGpl species containing shorter-chain and less unsaturated FA in the sn-2 position (i.e. 16 : 0, 18 : 1 and 18 : 2) were more than doubled (total increase from 16 to 40 % of all choline phosphoacylglycerol species), while molecular species containing arachidonic acid (20 : 4n-6) were significantly reduced. A relevant reduction was observed in species containing DHA (22 : 6n-3), but it did not reach statistical significance. The last two species (16 : 0, 20 : 4n-6 and 16 : 0, 22 : 5n-3) combined corresponded to 21 % of all species in healthy siblings, but only 15 % in children with DS (Fig. 2(b)).
Discussion
A child with DS is at a higher risk of diabetes, obesity, CVD, dementia and early onset of AD. Although lipids are considered to play a role in the aetiology of all these disorders, little is known as to whether or not there is a disturbance in membrane lipids in DS. The double expression of SOD in DS is thought to be a risk factor by promoting oxidative stress conditions. The brain is especially rich in highly unsaturated FA( Reference Crawford, Sinclair, Elliot and Knight 31 ), which are susceptible to peroxidation( Reference Yavin, Brand and Green 14 ). Therefore, the aim of the present study was to assess the status of membrane FA in children with DS compared with their unaffected siblings. There were no differences in age or sex among the children included in the study, and dietary analysis revealed that the average intakes of energy and nutrients were similar between siblings. Particular attention was paid to fat intake, and it was found to be statistically similar.
Chromosome 21 contains several genes that have been implicated in neurodegenerative mechanisms. These include Cu/ZnSOD (SOD-1), E26 transformation-specific sequence (Ets-2) transcription factors, DS critical region 1 (DSCR1) stress-inducible factor, and the amyloid precursor protein (APP) genes. The accumulation of Aβ plaques is progressive across the lifespan in DS( Reference Lott, Head and Doran 32 ). SOD-1 activity is found elevated in DS, which also occurs in conditions of oxidative stress, and is associated with a compensatory increase in GPx activity( Reference Meguid, Kholoussi and Afifi 33 ). Enhanced free radical generation and anti-oxidative imbalance have been suggested to contribute to accelerated ageing and the prevalence of the neuropathology of AD observed in these individuals. In particular, erythrocyte GPx has been found to significantly correlate with deficits in memory function among adults with DS( Reference Brugge, Nichols and Saitoh 34 ).
The present results demonstrate that already in young children, antioxidant enzyme activities of erythrocyte SOD and GPx were significantly elevated. Reynolds( Reference Reynolds 35 ) found that antioxidant supplementation did not improve the development of children with DS. Interestingly, a study assessing total serum antioxidant activity levels, but in contrast to previous reports, has found no significant difference between control individuals and those with DS( Reference Varga, V Oláh and Oláh 36 ). However, increased serum concentrations of lipid peroxidation products, i.e. malondialdehyde, have been detected in blood samples from individuals with DS( Reference Muchová, Sustrová and Garaiová 7 ), suggesting that enhanced oxidative stress conditions might affect membrane lipid composition and, in particular, the PUFA profile of PL.
Detailed analysis performed by using a combination of TLC and GC techniques revealed significant changes in the FA profile of PL fractions in erythrocyte membrane, as well as PL and neutral lipid fractions in plasma. The first specific finding was that shorter-chain (sixteen or eighteen carbons) and less unsaturated (none, one and two double bonds) FA (i.e. 16 : 0, 18 : 0, 18 : 1 and 18 : 2n-6) were increased in most lipid fractions analysed, while longer-chain (twenty and twenty-two carbons) and highly unsaturated (four and five double bonds) FA (i.e. 20 : 4n-6 and 22 : 4n-6) were reduced. The amount of 20 : 5n-3 was not significantly reduced, but presented a strong tendency towards a reduction in erythrocyte membrane ChoGpl (P= 0·060), plasma ChoGpl (P= 0·067) and plasma cholesterol esters (P= 0·064). These perturbations might be a consequence of increased oxidative stress conditions in which highly unsaturated FA are oxidised and destroyed, and shorter-chain and less unsaturated dietary precursor FA are compensated for the loss in erythrocyte membrane or plasma lipids.
To corroborate the aforementioned suggestion, more evidence was found based on the changes in the erythrocyte plasmalogen content of children with DS. Plasmalogens consist of an aldehyde in the sn-1 position, giving rise to a single vinyl ether double bond and a long-chain hydrocarbon containing a carboxyl group esterified to the sn-2 position of the glycerol moiety possessing anywhere between two and six double bonds. It is the interplay between these two side chains that creates a powerful antioxidant system that resides in the hydrophobic domain to scavenge free radicals. Thus, plasmalogens have been proposed as natural antioxidants following oxidative stress insults based on their ability to scavenge reactive oxygen species, such as peroxyl radicals and singlet oxygen, as well as to chelate potentially harmful metal ions( Reference Zoeller, Lake and Nagan 37 – Reference Spiteller 39 ). Furthermore, oxidation of the vinyl ether bond has been suggested to prevent the oxidation of adjacent PUFA, thus protecting PUFA from the consequences of free radical attacks and the resulting epoxide, being a relatively stable molecule( Reference Zommara, Tachibana and Mitsui 40 , Reference Engelmann 41 ). In the present study, erythrocyte membrane plasmalogen species detected mainly as 18 : 0 DMA were significantly reduced in the erythrocytes of children with DS, suggesting that chronic oxidative stress conditions may have targeted and destroyed these phosphoacylglycerols as a first line of defence. However, an increase in plasmalogen oxidation products can be harmful and may as well pose a problem in itself. Plasmalogen epoxides and α-hydroxyaldehydes (powerful nucleophilic reagents that can attack other biomolecules) are known to accumulate in all chronic diseases such as atherosclerosis and myocardial infarction, upon ageing as well as in AD and other neuropathological conditions( Reference Lessig and Fuchs 42 ). Plasmalogen deficiency has been described in other neurological disorders such as Zellweger syndrome( Reference Saitoh, Itoh and Takashima 43 ) and cerebral adrenoleukodystrophy( Reference Khan, Singh and Singh 44 ).
In addition to changes in the major FA profile, significant changes were detected for a minor FA that was found in all the fractions analysed. cis-Vaccenic acid (18 : 1n-7, 11-octadecenoic acid and asclepic acid) is an n-7 isomer of oleic acid (18 : 1n-9) and was elevated in the blood PL fractions of children with DS. While oleic acid is the major MUFA found in all cells and tissues, cis-vaccenic acid comprises only about 1 % of all FA in the blood. However, incorporation of cis-vaccenic acid into the erythrocyte membrane has been shown to enhance the rate of adenylate cyclase activation through the P-receptors. Adenylate cyclase catalyses the conversion of ATP to 3′,5′-cyclic AMP, an important second-messenger molecule involved in signal transduction( Reference Henis, Rimon and Felder 45 ). The present results show a small, but highly significant (P< 0·005) increase in cis-vaccenic acid in the blood samples of children with DS, possibly implicating a potential disturbance of 3′,5′-cyclic AMP-related signalling cascades.
While cis-vaccenic acid is a minor FA in erythrocyte membrane, it is a major component of cardiolipin, a PL found exclusively in bacterial and mitochondrial membranes. It amounts up to 20 % of the PL of the mitochondrial membrane, and its biological function in this organelle is clearly crucial( Reference Schlame, Brody and Hostetler 46 ). It is located mainly in the inner mitochondrial membrane, where it interacts with a large number of mitochondrial proteins. This interaction affects the functional activation of certain enzymes, especially those involved in oxidative phosphorylation. Cardiolipin is an important cofactor for cholesterol translocation from the outer to the inner mitochondrial membrane, which plays a specific role in the import of proteins into the mitochondria. It binds in a highly specific way to DNA in chromatin, and appears to have a functional role in the regulation of gene expression. As opposed to other PL, in cardiolipin, cis-vaccenic acid, not oleic acid, is the main octadecenoic acid present( Reference Wolff, Combe and Entressangles 47 ).
In the present study, we analysed blood samples only and did not collect any data about possible changes in cis-vaccenic acid in mitochondrial membranes. However, our data advocate the importance to study the contents of cis-vaccenic acid in other tissues. The erythrocyte membrane is a plasma membrane with a similar composition to vascular endothelial cells, which have the highest plasma membrane:cytosol volume ratio. An abnormality in erythrocyte membrane is likely to reflect vascular abnormality( Reference Crawford, Golfetto and Ghebremeskel 48 ).
The lipid composition of cell membranes is directly influenced by environmental variables, particularly diet, as well as endogenous metabolic abnormalities (e.g. oxidative stress). It is likely that the changes found in the erythrocyte membrane of children with DS will also be found in the lipid profile of other tissues. Hence, the changes in cis-vaccenic acid found in the blood samples of children with DS may reflect a similar increase in cis-vaccenic acid in mitochondrial membranes, which may have an effect on cellular energy metabolism, particularly in tissues with high energy consumption such as brain tissue.
In the present study, we used the ESI-MS/MS technique to study the molecular distribution of individual FA in their native form as intact PL, particularly because GC data revealed that ChoGpl of children with DS showed a highly significant increase in the amount of 16 : 0. We identified the pairing profile at the sn-1 and sn-2 positions within the intact PL molecules, a property that may underlie their mutual interaction with membrane proteins. ESI-MS/MS is an ionisation technique used for the mass spectrometric analysis of polar compounds that was initially developed by Fenn et al. ( Reference Fenn, Mann and Meng 49 ). The utility of selective ESI ionisation is based on the differential propensity of each lipid class to acquire either positive or negative charges under the source high voltage, thus lipid classes can be separated through their endogenous electric potential. Each class of lipids can be resolved in the ionisation source (intra-source separation), and individual molecular species can be further identified by MS and/or tandem MS (quadrupole time-of-flight).
Our data reveal profound changes in the distribution of FA among the 16 : 0-containing molecular species. ChoGpl species containing shorter-chain (eighteen carbons) and less unsaturated (one and two double bonds) FA were almost doubled, while molecular species containing long-chain PUFA were reduced in children with DS. Of note is the contrast between children with DS and their healthy siblings in terms of the 16 : 0, 20 : 4n-6 species of choline phosphoacylglycerols. In the unaffected siblings, the 16 : 0, 20 : 4n-6 species was greater than the same linoleic acid precursor species (16 : 0, 18 : 2n-6). However, in children with DS, the opposite was the case: 18 : 2n-6>20 : 4n-6.
These changes are much more specific than the overall increase in the amount of 16 : 0 ChoGpl detected by GC analysis and, of course, not noticeable in the GC data. The study of molecular species provides additional information about the conventional GC analysis on the percentage of FA, as it is a description of lipids as they occur in the cell membrane. As cell membrane PL are in intimate and functional contact with executive proteins, this method is likely to be more biologically representative of tissue status and so potentially useful diagnostically. Variations in the molecular species profile may cause modification in the interaction between PL and the proteins anchored in them, possibly influencing cell–cell interactions and cell signalling cascades.
The specific difference observed in linoleic/arachidonic acid molecular species suggests a metabolic defect in the conversion of linoleic to arachidonic acid, and/or specific functional defects in the incorporation of these FA into membrane PL. It is plausible that alteration of a specific membrane PL is bringing about a different protein profile.
Conclusion
Lipid analysis of PL in plasma and erythrocyte membrane revealed significant changes in the FA profile of children with DS when compared with their healthy siblings, which are not related to the differences in their diet intake. Moreover, lipid abnormalities in erythrocyte membrane cannot be considered as an isolated phenomenon, but are likely to reflect abnormal changes in the lipid profile of other cells and tissues as well. Thus, establishing variations in the PL profile of other organs is of utmost interest. Increased levels of SFA coinciding with decreased amounts of PUFA denote drastic changes in the membrane lipid profile and may cause alterations in membrane physical properties and function. In addition, membrane PL PUFA serve as a molecular cache for NEFA, i.e. arachidonic acid and DHA and their metabolites (e.g. PG and neuroprotectins), which are key players in signalling pathways regulating cell metabolism and stress response. Taken together, alterations in membrane lipids found in the present study may help to explain the increased risk of developing CVD, metabolic and neurodegenerative diseases in children and adults with DS.
Acknowledgements
The present study is dedicated to the memory of Mr Peter Elliott, who was the founder of the Down Syndrome Research Foundation, for his commitment to Down Syndrome Research.
The authors thank the many families who participated in the study and to Dr R. Lister and Dr J. Brierley for their support and encouragement.
The present study was supported by the Down Syndrome Research Foundation (UK), the Mother and Child Foundation (UK) and the Letten Foundation (Norway). A. B. is grateful to Gulton Foundation (USA) for support.
The food diary analyses and all the experimental analyses related to the study were conducted at the Institute of Brain Chemistry and Human Nutrition, the laboratory which was at that time located at London Metropolitan University.
The authors’ contributions are as follows: A. A. B., A. B., M. M. N., N. B. and M. A. C. designed the research, wrote the paper and had primary responsibility for the final content; C. L. assisted with the administration of the project; M. M. N. and N. B. recruited the families and analysed the food diaries; M. M. N., N. B. and M. A. C. conducted the interviews and liaison with parents and children; A. A. B. and A. B. conducted the research, analysed the data and performed the statistical analysis.
The authors have no conflict of interest to declare.


