Globally, an estimated 2·1 million cases of lung cancer and 1·8 million related deaths are recorded annually. Hence, lung cancer has been among the foremost causes of morbidity and mortality(Reference Bray, Ferlay and Soerjomataram1). Two types of lung cancer were characterised based on histological analysis, including small-cell lung cancer and non-small-cell lung cancer (NSCLC). More than 85 % of lung cancer cases fall into the NSCLC category. Moreover, most patients reached the advanced stage of the disease prior to diagnosis(Reference Pourhanifeh, Sharifi and Reiter2). Tyrosine kinase inhibitors and immunotherapy are promising interventions currently in use for NSCLC, and unprecedented survival benefits been recorded in treated patients. Despite these results, the overall cure and survival rates remained insignificant, as the 5-year based survival rate is currently below 20 %. Thus, more efficient therapeutic agents are urgently needed(Reference Hirsch, Scagliotti and Mulshine3). Moreover, an exhaustive understanding of the developed therapeutic agents’ action mechanism is significant from the clinical standpoint.
In this regard, a promising alternative could be Traditional Chinese Medicine. This is because Traditional Chinese Medicine has extensively been used in clinical practice, and its significant anti-cancer effects were highlighted in Chinese medicine formula PHY906(Reference Liu and Cheng4). Traditional Chinese Medicine had received growing attention for its immune system-boosting property, improving patients’ quality of life and decreasing chemotherapy’s adverse effects(Reference Zhai, Zhang and Han5).
Cuscuta chinensis Lam. (Convolvulaceae) is a typical Traditional Chinese Medicine used for a wide range of diseases and disorders, including female sterility, dysfunction of male reproductive system, chyluria and chloasma faciei. Further, it has been used as a liver and kidney tonic(Reference Donnapee, Li and Yang6). Pharmological studies have shown that it possesses anti-cancer activity in different cancer cell lines. For example, whole plant water extract of Cuscuta chinensis (CLW) showed cytotoxic effects on human Caucasian acute lymphoblastic leukaemia, and human lymphocyte cells were observed(Reference Suresh, Sruthi and Padmaja7). Also, stimulation of Cuscuta chinensis seed extracts on the proliferation of MCF-7 and T47D human breast cancer cell has been reported(Reference Umehara, Nemoto and Ohkubo8). Similarly, the viability of Hela, HT-29 and MDA-MB-468 cells was significantly reduced with the chloroform extracts of C. chinensis (Reference Jafarian, Ghannadi and Mohebi9). Besides, CLW can inhibit DMBA-induced tumour tissue growth in Swiss albino tumour mice(Reference Nisa, Akbar and Tariq10). Despite these studies, the anti-lung cancer activity and its detailed mechanistic pathways have yet to be described. Furthermore, advancements have been made in genomics which makes it prevalent for cancer research; however, its utilisation for understanding CLW effect on human lung cancer cells has yet to be explored. Thus, the current study aimed to investigate the anti-lung cancer activity of CLW by assessing its cell viability inhibition and cell cycle arrest on the A549 and H1650 human lung adenocarcinoma cell line compared with the normal lung epithelial cells and tumour tissue growth inhibition in A549 xenografts. Moreover, the profiles of global gene expression for lung cancer treated with CLW were explored in addition to the determination of the possible mechanism involved.
Materials and methods
Materials
Methanol, acetonitrile, water and 0·05 % formic acid of HPLC grade were obtained from TEDIA. Gefitinib and other chemicals were bought from Sigma Chemical Co.. The F-12K medium, RPMI 1640 medium, DMEM medium, fetal bovine serum, collagenase I, 3-(4, 5-dimethyl-2-thiazolyl)-2,5-diphenyl-2-tetrazoliumbromide (MTT), penicillin and streptomycin, plantium® SYBR® green qPCR superMix-UDG with ROX, dynabeads® mRNA purification kit, qubit®ssDNA Assay kit, qubit®dsDNA HSAssay kit and lipofectamine-RNAiMAX were procured from Invitrogen. The RNA Extraction kit was purchased from Takara Bio. The cell cycle detection kit was obtained from Keygen Biotech. Dimethyl sulfoxide and TRIzol reagents were bought from Life Technologies. RNase Zap hybrid solvent and nuclease-free water were purchased from Ambion. Agencourt RNAClean XP40 ml kit was purchased from Agencourt. Maxima H Minus Reverse Transcriptase reagent kit was purchased from Thermo Scientific. DNA analysis kit and Agilent high-sensitivity DNA kit were purchased from Agilent Technologies (GBSF). MGIEasy RNA LabChip kit, MGIEasy DNA Adapters-96 (plate) kit, MGIEasy magnetic beads, MGIEasy cyclisation module kit were purchased from Huada Manufacturer.
Cuscuta chinensis samples
Dried C. chinensis identified by Professor Linsen Shi of Zhejiang Chinese Medical University with a voucher specimen number TSC-YP-190223 was graciously donated by Xinjiang Ansaer Uyghur Medicine Pharmaceutical Co., Ltd.
Preparation of Cuscuta chinensis extracts
Preparation of C. chinensis extracts was carried out according to Maimaiti et al (Reference Maimaiti, Jing-Jing and Shi11). ‘A 20-kg sample was appropriately weighted and milled to a fine powder. Samples were extracted with 200 l of distilled water (80°C) for 2 h in a multifunctional extraction and concentration unit (Shanghai Dacheng DC-NSG-130). After extraction, samples were filtered with eight layers of medical gauze, and then the extracts were combined and concentrated at 80°C and 0·08 Mpa for 2 h using a rotary evaporator. The condensed sample extract was finally vacuum-dried at 80°C and smashed into powder. The extraction yield was 6·17 %. The deep brown powder was then passed over 50 mesh sifter and stored at room temperature until subsequent experiments’.
Liquid chromatograph-mass spectrometer (LC/MS) was conducted for the finger printing of phytochemicals in CLW. 100 mg/mL extracts were prepared using distilled water with the same extraction condition and were initially filtered through 0·22 μm membrane and submitted for analysis.
Cell culture
Human lung cancer cell lines (A549 and H1650) and human bronchial epithelial cells (BEAS-2B) were obtained from Shanghai Mingjin Biotechnology. All the cell culture media were procured from Invitrogen. A549 and H1650 cells were cultured in F-12K and RPMI 1640 media, while BEAS-2B cells were cultured in DMEM medium with 10 % heat-inactivated fetal bovine serum and 100 μg/mL of penicillin–streptomycin, respectively. All cultured cells were maintained in a humidified atmosphere with 5 % CO2 at 37 °C. CLW was dissolved in sterile distilled water, and all treatments were adjusted to different water proportions.
Cell viability assay
The different cells were initially plated in ninety-six well plates at 5000 cells/well (200 μl/well) density. The next day, the medium was changed, and subsequently, the cells were treated with CLW at different concentrations (0·195–3·125 mg/ml). Cell viability was measured by MTT colorimetric assay according to manufacturer’s instructions. ‘Briefly, after incubation for 24 h, 48 h and 72 h, the cells were further incubated with 0·5 mg/ml MTT at 37°C for 4 h, Thereafter, the media was carefully removed, and dimethyl sulfoxide (100 ml) was added to dissolve the formed formazan product following the procedure by Maimaiti et al (Reference Maimaiti, Aili and Kuerban12). The optical density was measured using a microplate reader (Thermo Fisher Scientific Inc) at a 570-nm wavelength and a reference wavelength of 655 nm to determine the amount of MTT formazan product’.
Apoptosis assay
This assay was carried out following the procedure by Maimaiti et al (Reference Maimaiti, Xingliang and Shi13) ‘Annexin V binding was identified by flow cytometry using an annexin V-FITC staining kit, following the manufacturer’s instructions (Biomiga). The A549, H1650 and BEAS-2B cells were exposed to CLW for 24 h. Thereafter, 1 × 10⁶ cells were collected by centrifugation. Cells were washed twice in PBS and resuspended cells in 500 µl solution using an annexin V binding buffer. A 5 µl each of annexin V-FITC and propidium iodide was added and incubated for 10 min at room temperature in the dark. Then, samples were analysed using a BD LSRFortessa flow cytometer’.
Cell cycle analysis
The cells at 2·5 × 105 cells/plate density were plated in the appropriate culture medium in 10 cm dishes. The following day the medium was changed, and the cells were treated with different CLW concentrations (0·78–3·125 mg/ml). The cells were washed with PBS and fixed overnight in 70 % ethanol at −20°C. The fixed cells were washed twice with cold PBS and stained for 30 min with propidium iodide /Triton X-100 staining solution (0·1 % Triton X-100, 2 mg/ml propidium iodide and 0·2 mg/ml DNase-free RNase). After that, flow cytometry analysis was conducted using a FC500 flow cytometer (Beckman Coulter).
RNA preparation and RNA-seq
TRIzol reagent was used for extracting the total RNA according to the manufacturer’s recommendations. Agilent 2100 Bioanalyzer (GBSF) with the Agilent High Sensitivity DNA kit was used to evaluate the quality of total RNA. Libraries for RNA-seq were prepared in MGIEasy RNA LabChip kit, MGIEasy DNA adapters-96 (plate) kit. MGIEasy magnetic beads and MGIEasy cyclisation module kit were sequenced using MGI-SEQ-2000RS High-throughput sequencing reagent kit to obtain 2 × 150-bp paired-end reads. The reads were compared with the reference genome and obtained alignments by Hisat software. Reference-based assembly of transcripts and prediction of expression were performed using StringTie. Bioconductor edgeR was used to conduct the ranking of genes based on the differential expression degree. Arbitrary identification of significant genes was made using P ≤ 1 × 10⁻⁵ cut-off values and fold change ≥ |2| in the mean expression(Reference Maimaiti, Xingliang and Shi13).
Functional and pathway enrichment analyses
To future analysis of biological properties and related signalling pathways of the above significantly regulated genes, Gen Ontology Biological Process (GOBP) and Kyoto Encyclopaedia of Genes and Genomes (KEGG) pathway enrichment analysis were performed using DAVID online platform (https://david.ncifcrf.gov). Both GOBP terms and KEGG pathways with P-values < 0·05 were considered significant enrichment, and visualisation was achieved by Srplot server (http://bioinformatics.c- om.cn).
Quantitative real-time PCR
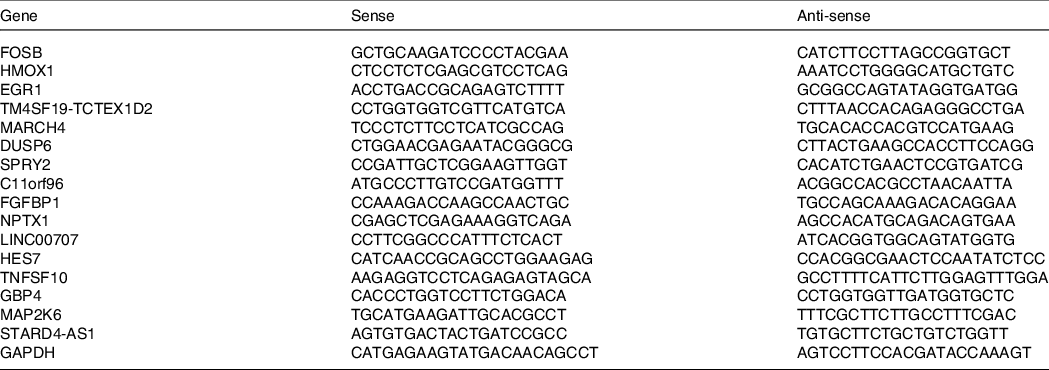
The total RNA of different cell lines was extracted using TRIzol reagent (Invitrogen). Using Maxima H Minus Reverse Transcriptase reagent kit (Thermo Scientific), mRNA was reverse-transcribed to cDNA. The PCR reaction was carried out using ViiATM quantitative real-time PCR (qRT-PCR) Analyzer (Life Technologies) and Plantium® SYBR® GreenqPCR SuperMix-UDG with ROX and PCR primer (Table 1). The GAPDH was normalised to determine each sample’s relative level of target genes. The analysis was carried out in triplicates.
Primer sequences
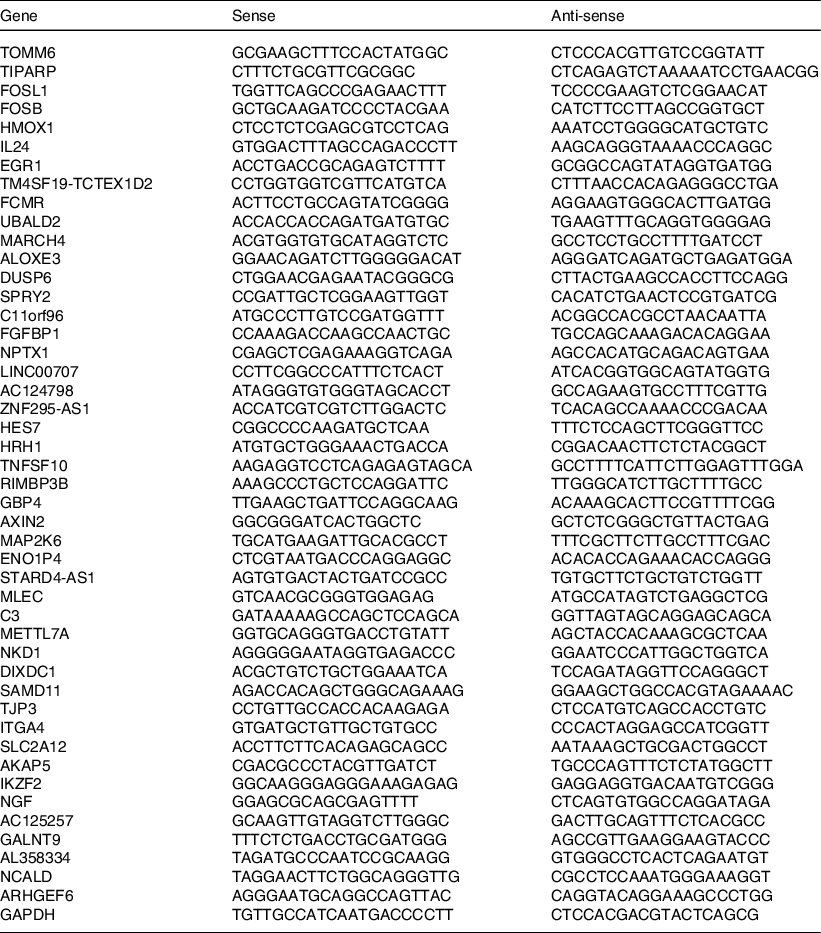
Primer sequences of differentially expressed common genes (consistently regulated and greater than two-fold) by CLW treatment in A549 and H1650 cells. The primer sequences were obtained using primer BLAST and Primer Premier5. CLW, Cuscuta chinensis water extract.
Tumour xenograft and tissue quantitative real-time PCR studies
In this study, the Ethical Committee for Animal Experimentation of Zhejiang Chinese Medical University approved animal handling and procedures. Male and female BALB/c nude mice (5–7 weeks of age) were purchased from Shanghai SLAC Laboratory Animal Co., Ltd (License number: SCXK, 2017–0005). The basic feed for the animals was provided by the Zhejiang Chinese Medical University. Animals were kept at room temperature, and other favourable conditions were provided. Each mouse was subcutaneously inoculated in its right flank with A549 cells (1 × 10⁷). Thereafter, the mice were randomly assigned to five treatment groups (n 6 for each group). The tumour-bearing mice received vehicle control (distilled water), Gefitinib (100 mg/kg), CLW (300 mg/kg), CLW (600 mg/kg) and CLW (1200 mg/kg) when tumours reached 80–100 mm3. The mice’s tumour volume and body weight for each group were monitored every 3 days. The tumour volume (mm3) was measured using the formula: volume = (shortest diameter)/2 × (longest diameter)/2. After 17 d of CLW treatment, the animals were killed. Then, tumour samples were harvested and weighed. Samples were divided into two parts. One part was frozen at −80°C, and the other was subjected to lysis buffer for RNA extract. qPCR was performed as described above. Briefly, Takara MiniBEST Universal RNA Extraction kit was used for extracting the total RNA. Then, mRNA was reverse-transcribed to cDNA using the Maxima H Minus Reverse Transcriptase reagent kit. The PCR reaction was carried out using ViiATM qRT-PCR Analyzer and Plantium® SYBR® GreenqPCR SuperMix-UDG with ROX and PCR primer (Table 2). The GAPDH was normalised to determine each sample’s relative level of target genes.
Primer sequences
Primer sequences of differentially expressed common genes (consistently regulated in vitro) by CLW treatment in tumour tissue. The primer sequences were obtained using primer BLAST and Primer Premier5. CLW, Cuscuta chinensis water extract.
Statistical analysis
Obtained results were presented as the mean of the replicate samples ± se. ANOVA, the Newman–Keuls test and Dunnett’s test were employed for further statistical analysis, with statistical significance obtained at P < 0·05.
Results
C. chinensis water extract effects on inhibition of human lung cancer cells viability
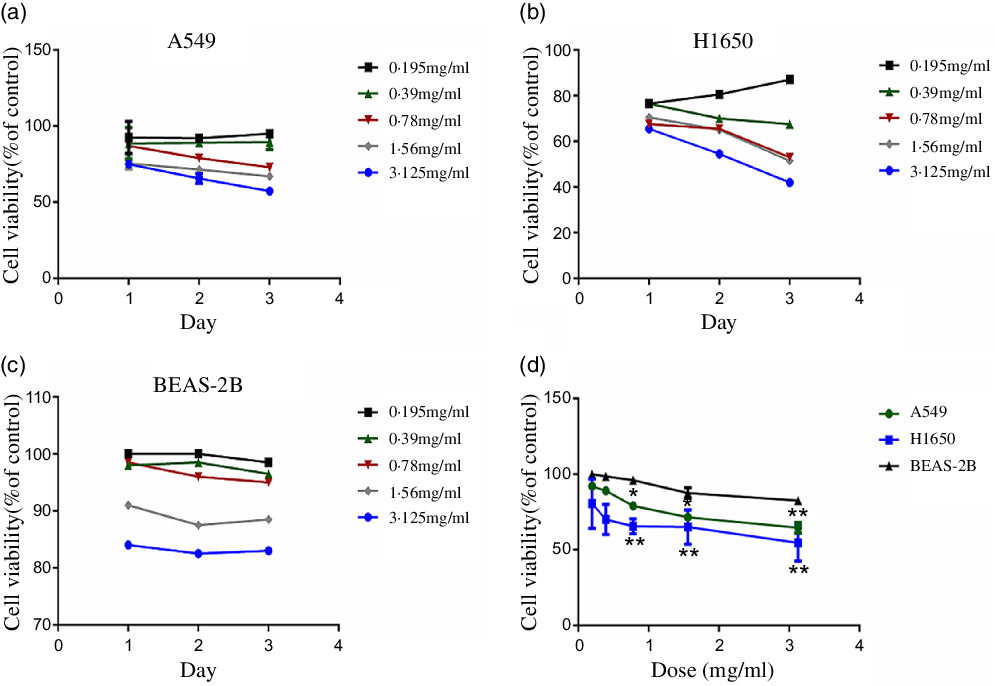
CLW effects on the cell viability of human lung adenocarcinoma A549 and H1650 cells were determined. A suitable growth medium was used to incubate the cells and then the cells were supplemented with increasing concentrations of CLW (0·195 mg/ml–3·125 mg/ml). Then, MTT assay was used to determine the cell viability following treatment with CLW for 24 h, 48 h and 72 h. The result obtained (Fig. 1(a) and (b)) showed a significant time and dose-dependent reduction in the proportion of viable cells of both A549 and H1650 cells. Also, BEAS-2B cells were treated with CLW under the same condition for comparison. Interestingly, less decrease in the percentage of viable cells was observed in the BEAS-2B cells than lung cancer cell lines after treatment of CLW (Fig. 1(c) and (d)). Overall, these results suggested that the CLW inhibitory effect is specific to lung cancer cells.
Inhibition of cell viability of CLW in lung cancer cell lines. (a) Cell viability of A549 cells treated with 0·195–3·125 mg/ml CLW for 24 h, 48 h and 72 h. (b) Cell viability of H1650 cells treated with 0·195–3·125 mg/ml CLW for 24 h, 48 h and 72 h. (c) Cell viability of BEAS-2B cells treated with 0·195–3·125 mg/ml CLW for 24 h, 48 h and 72 h. (d) The comparison of cell viability in A549, H1650 and BEAS-2B cells following treatment with CLW at 0·195–3·125 mg/ml concentration for 48 h. After 24 h, 48 h and 72 h, cell viability was determined and expressed as a percent of control cells using one-way ANOVA. Representative experiments, n 3, mean ± sd. *P < 0·05, **P < 0·01. CLW, Cuscuta chinensis water extract.
C. chinensis water extract induces cell cycle arrest but not apoptosis in lung cancer cells
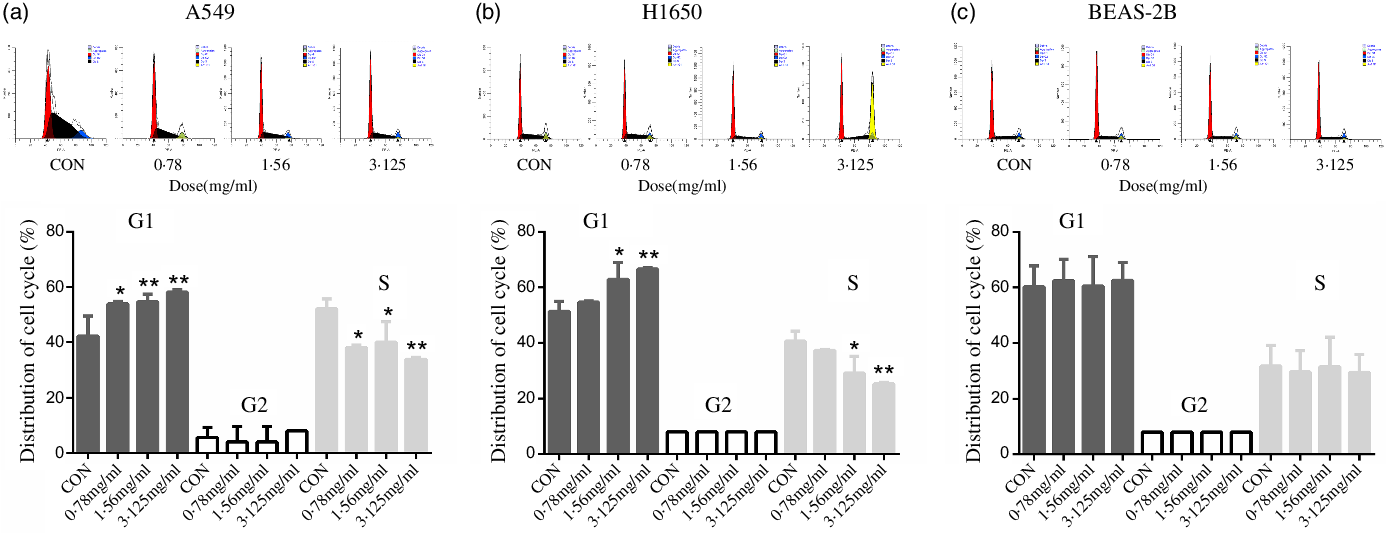
To discover the possible intrinsic mechanism for the decreasing number of viable cells treated with CLW, we measured the apoptosis and cell cycle phase distribution by flow cytometry analysis. The results showed that CLW had no significant effect on the number of annexin V stained cells in either of or both A549 and H1650 lung cancer cells or BEAS-2B cells at 24 h (online Supplementary Fig. S1). Interestingly, we found that CLW treatment dose-dependently induced G1 phase accumulation in both H1650 and A549 cells at 24 h when compared with the control group (Fig. 2(a) and (b)). In contrast, the G1 phase accumulation was not observed in the BEAS-2B cells treated with CLW under the same condition, suggesting that CLW specifically induced G1 arrest in lung cancer cells (Fig. 2(c)).
Inducement of cell cycle arrest by CLW in lung cancer cell lines. (a) Flow cytometric analysis of the cell cycle phase fractions of A549 cells treated with 0·78–3·125 mg/ml CLW for 24 h. (b) Flow cytometric analysis of the cell cycle phase fractions of H1650 cells treated with 0·78–3·125 mg/ml CLW for 24 h. (c) Flow cytometric analysis of the cell cycle phase fractions of BEAS-2B cells treated with 0·78–3·125 mg/ml CLW for 24 h. The percentage of cell cycle fractions was obtained using one-way ANOVA. Representative experiments, n 3, mean ± sd. *P < 0·05, **P < 0·01. CLW, Cuscuta chinensis water extract.
RNA-seq transcriptome analysis
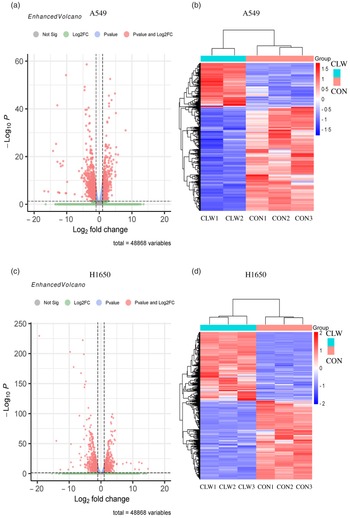
The effect of CLW treatment (3·125 mg/ml, 24 h) on H1650 and A549 cells gene expression was also determined. RNA-seq analysis was used to profile the gene expression, and the result was presented in Fig. 3(a)–(d) and Supplementary Tables S1–S4.
The global gene expression of lung cancer cell lines after CLW treatment. (a) The differentially expressed genes between CLW and control in A549 cells after treatment for 24 h. The blue dots represented genes without different expressions between the two groups, and the red dots represented different expressions between the two groups. (b) Hierarchical cluster analysis of significant differential expression genes in A549 cells after CLW treatment for 24 h. Red represented increasing in expression, and blue represented decreasing in expression. (c) The differentially expressed genes between CLW and control in H1650 cells after treatment for 24 h. The blue dots represented genes without different expressions between two groups, and the red dots represented different expressions between two groups. (d) Hierarchical cluster analysis of significant differential expression genes in H1650 cells after CLW treatment for 24 h. Red represented increasing in expression, and blue represented decreasing in expression. Representative experiments, n 3, mean ± sd. *P < 0·05, **P < 0·01, ***P < 0·001, ****P < 0·0001. CLW, Cuscuta chinensis water extract.
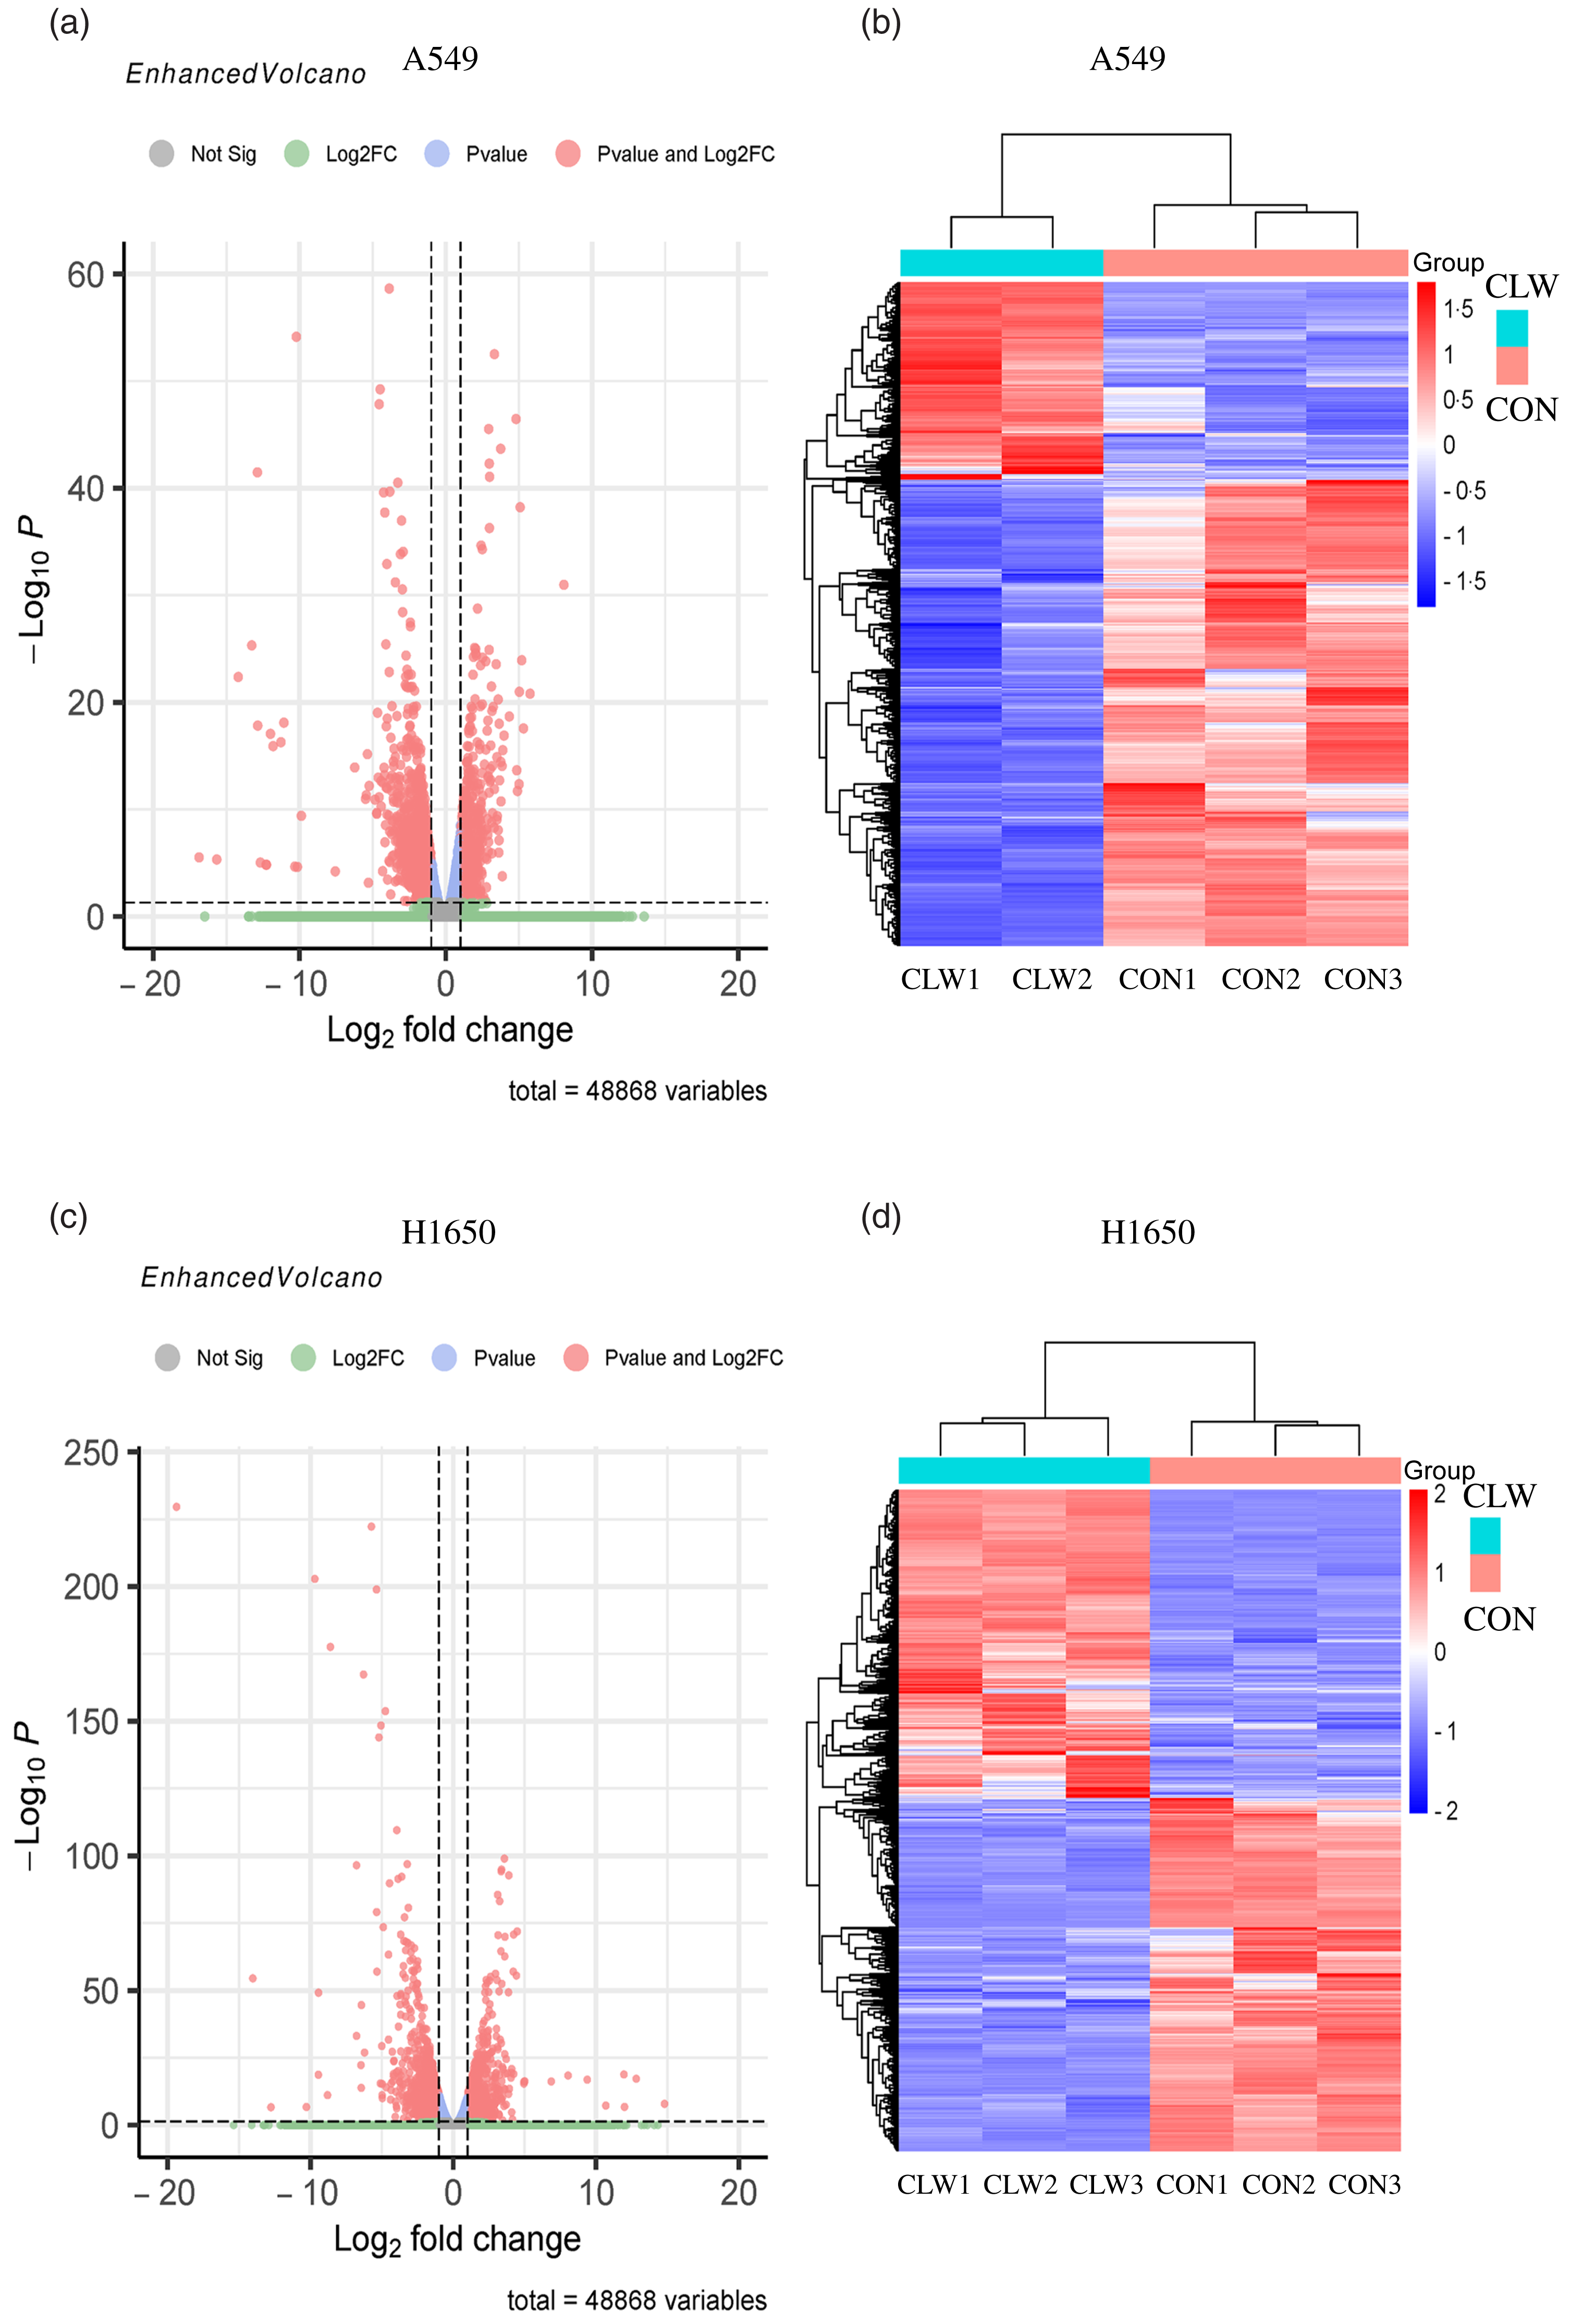
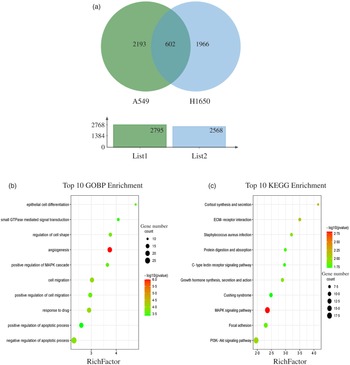
The results showed that 2795 and 2568 genes were differentially expressed in CLW-treated A549 and H1650 cells, respectively, compared with the control (P < 0·05). Among them, 602 genes were significantly (P < 0·05) altered in both A549 and H1650 cells under the CLW treatment (Fig. 4(a) and online Supplementary Table S5).
GO terms and KEGG pathways enriched by differentially expressed common genes. (a) Venn diagram analysis of global gene expression from lung cancer cells identified by RNA-seq. Genes having a significant change in expression were collected and classified. The number of significant differential expression genes from A549 and H1650 cells after CLW treatment for 24 h was 2795 and 2568, respectively. In two cell lines, 602 genes were commonly altered. (b) The ten top category terms of GO analysis. The y-axes correspond to the GO terms, and the x-axes show the enrichment factor. (c) The ten top signalling pathways of KEGG analysis. The y-axes correspond to the pathways, and the x-axes show the enrichment factor. The colour of the dot represents the P-value, and the size of the dot represents the number of common genes mapped to the reference. CLW, Cuscuta chinensis water extract, KEGG, Kyoto Encyclopaedia of Genes and Genomes; GO, Gene Ontology.

Biological significance and pathway analysis of the common genes
To obtain a better understanding of the biological function of CLW significantly altered genes in both A549 and H1650 cells, GOBP analysis of the 602 common genes was carried out using DAVID online platform (https://david.ncifcrf.gov). As a result, thirty-five Gene Ontology categories were found to be significantly enriched by common genes (P ≤ 0·05). Among them, common genes were mainly involved in angiogenesis, response to drug, cell migration, negative regulation of apoptotic process, regulation of cell shape, positive regulation of cell migration, epithelial cell differentiation, positive regulation of MAPK cascade, small GTPase mediated signal transduction and positive regulation of apoptotic process (Fig. 4(b) and online Supplementary Table S6). Besides, the enrichment of KEGG pathways in the common genes was also assessed with DAVID online platform. Twenty-four signalling pathways were significantly enriched in the KEGG analysis (P ≤ 0·05). According to p value less than 0·01, MAPK signalling pathway, Cortisol synthesis and secretion and ECM–receptor interaction were mainly involved (Fig. 4(c) and online Supplementary Table S7).
Quantitative real-time PCR analysis validates the RNA-seq data
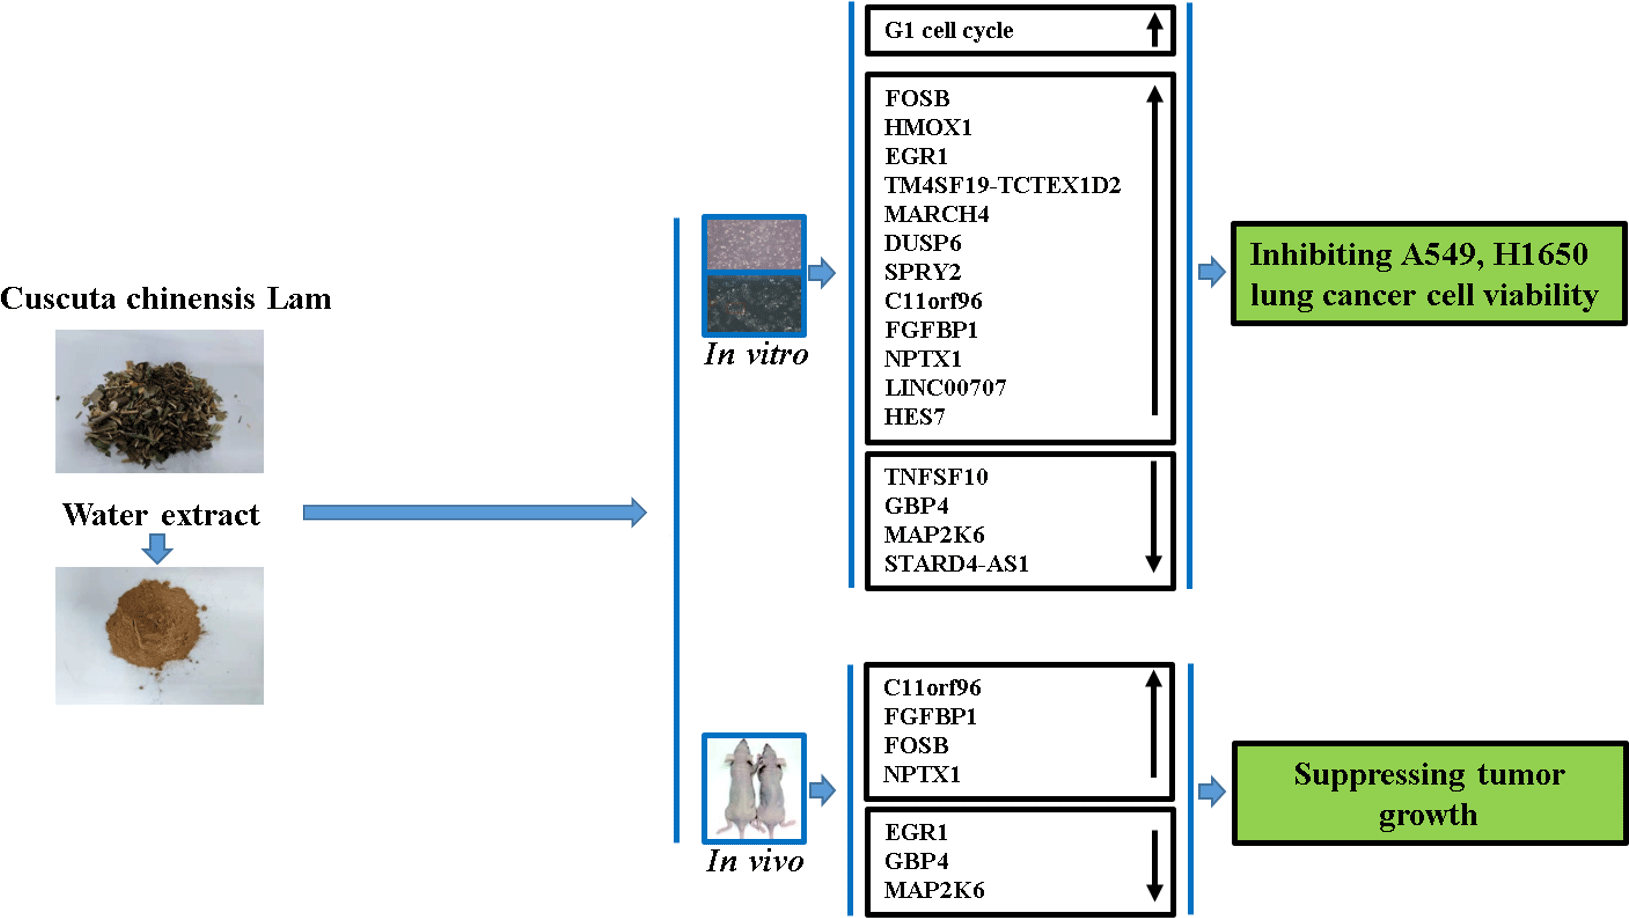
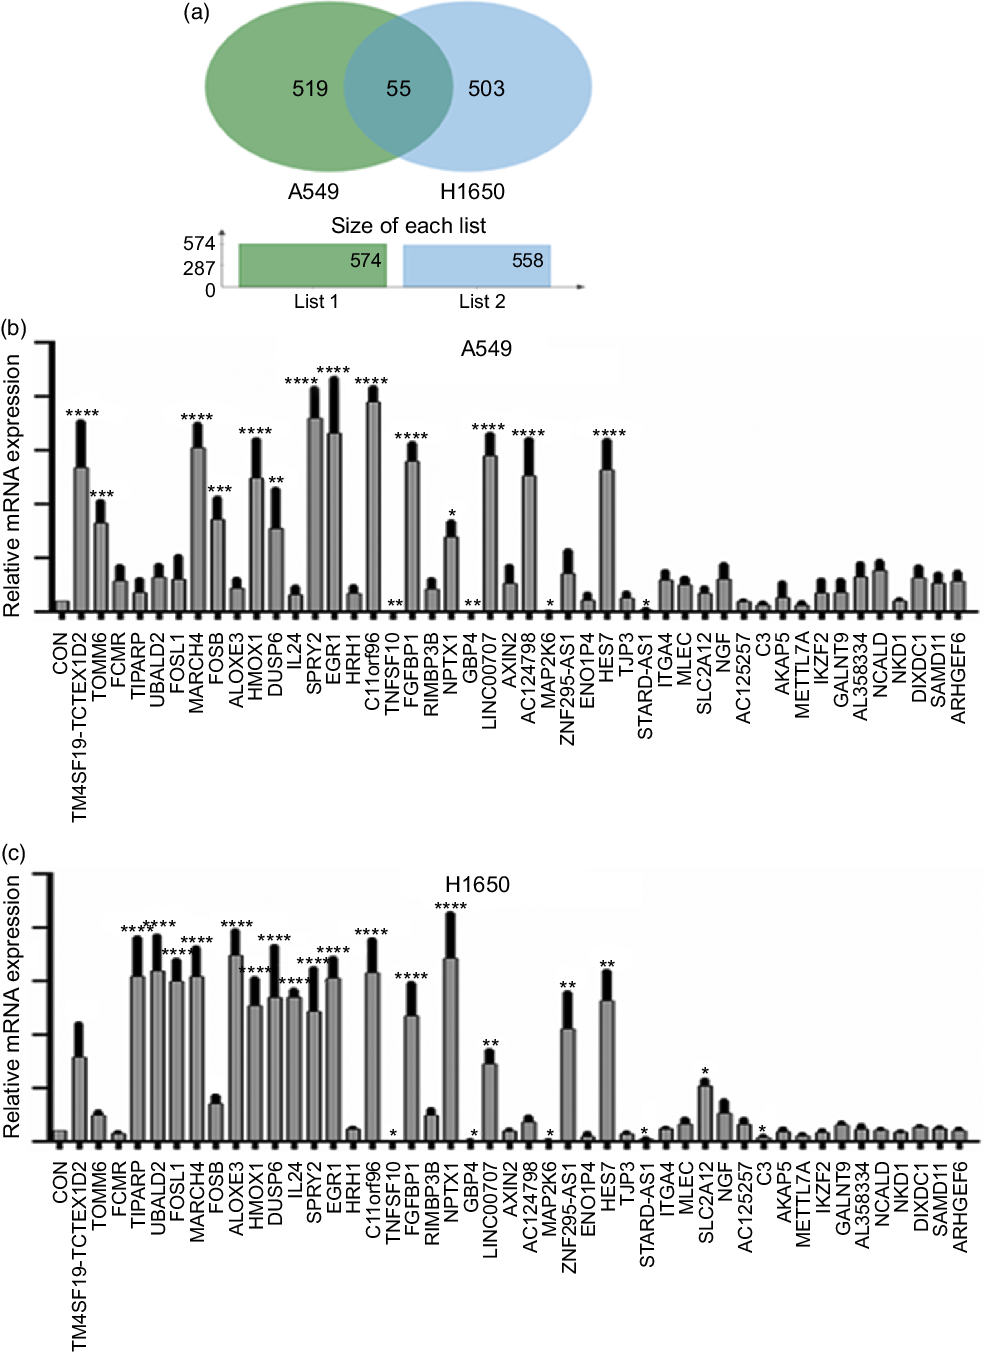
Next, identification was carried out on the number of significantly expressed genes in A549 and H1650 cells that were CLW-treated. The Venn diagrams analysis results showed that fifty-five genes (> 2-fold change) were commonly altered in both A549 and H1650 lung cancer cells. Among them, twenty-five genes were consistently up-regulated, and twenty-one genes were consistently down-regulated in both lung cancer cells under CLW treatment. However, seven genes were inconsistently expressed in A549 and H1650 cells under CLW treatment. Interestingly, different Gene ID of down-regulated AC093668 and AC00-6213 were observed in A549 and H1650 cells after CLW treatment (Fig. 5(a) and Table 3). Therefore, qRT-PCR analysis was conducted on all the common genes (forty-six consistently regulated genes, > 2-fold change) employing the same RNA samples used in RNA-seq. The purpose was to allow for further validation of the RNA-seq results. A total (forty-six consistently regulated genes, > 2-fold change) of 16 RNA-seq samples were confirmed by qRT-PCR in A549 and H1650 cells. Twelve genes (FOSB, HMOX1, EGR1, TM4SF19-TCTEX1D2, MARCH4, DUSP6, SPRY2, C11orf96, FGFBP1, NPTX1, LINC00707 and HES7) were up-regulated, and four genes (TNFSF10, GBP4, MAP2K6 and STARD4-AS1) were down-regulated in both adenocarcinoma cell lines (Fig. 5(b) and (c)).
The qRT-PCR validation. (a) Venn diagram analysis of global gene expression from lung cancer cells identified by RNA-seq. Genes having a significant (greater than two-fold) change in expression were collected and classified. The number of significant differential expression genes from A549 and H1650 cells after CLW treatment for 24 h was 574 and 558 (greater than two-fold), respectively. In two cell lines, 55 genes (greater than two-fold) were commonly altered. (b) A549 cells were incubated with or without CLW 3·125 mg/ml for 24 h. The expressions of common genes (46 consistently regulated genes) were determined by qRT-PCR. (c) H1650 cells were incubated with or without CLW 3·125 mg/ml for 24 h. The expressions of common genes (46 consistently regulated genes) were determined by qRT-PCR. The average relative gene expression changes compared with the control, calculated using GAPDH. The mRNA expression differences between the treated and control samples were determined using one-way ANOVA. Representative experiments, n 3, mean ± sd. *P < 0·05, **P < 0·01, ***P < 0·001, ****P < 0·0001. CLW, Cuscuta chinensis water extract; qRT-PCR, quantitative real-time PCR.
Differentially expressed common genes after Cuscuta chinensis Lam. treatment by A549 and H1650 cells (log2 ratio)
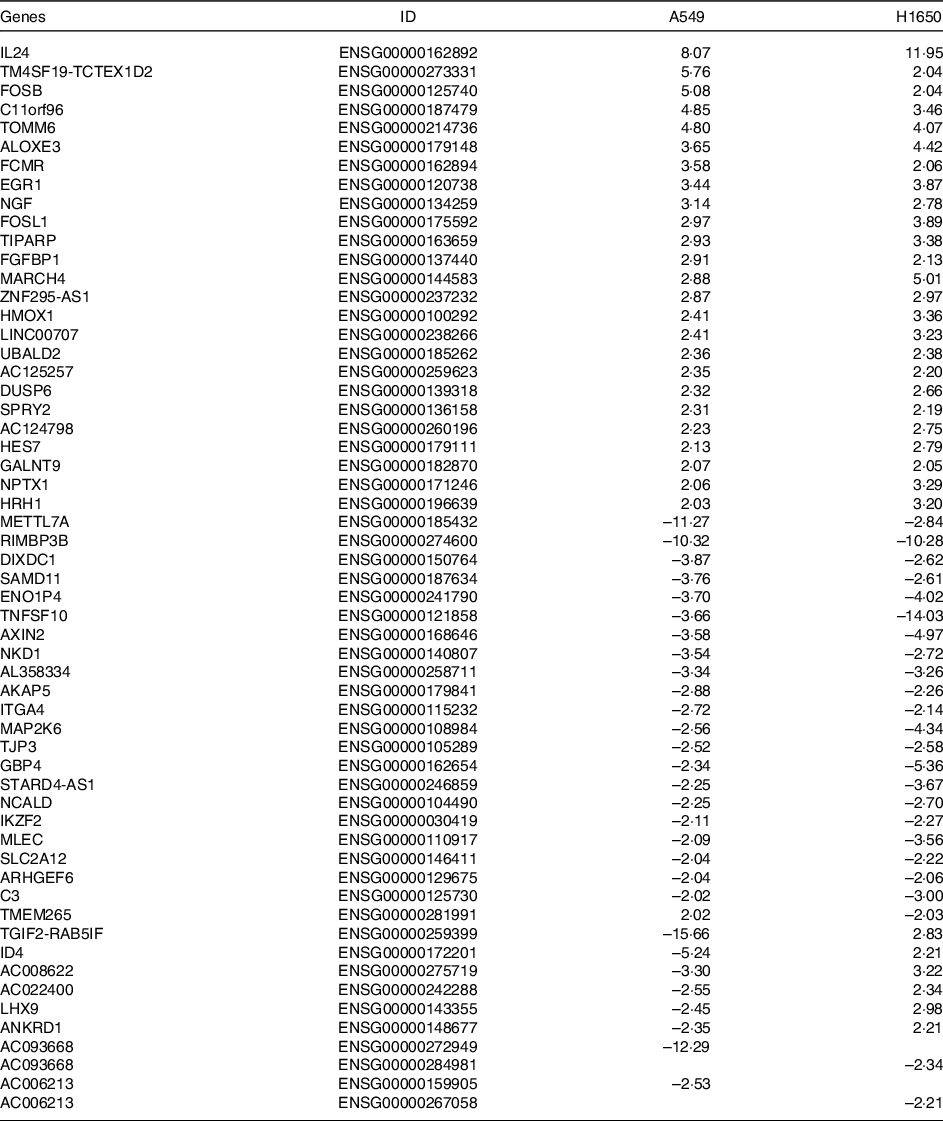
Differentially expressed common genes by CLW treatment in A549 and H1650 cells. Identification of significant genes was done using P ≤ 1 × 10⁻⁵ cut-off values and fold change (log2 ratio) ≥ |2| in the mean expression. CLW, Cuscuta chinensis water extract.
C. chinensis water extract inhibited tumour growth in vivo
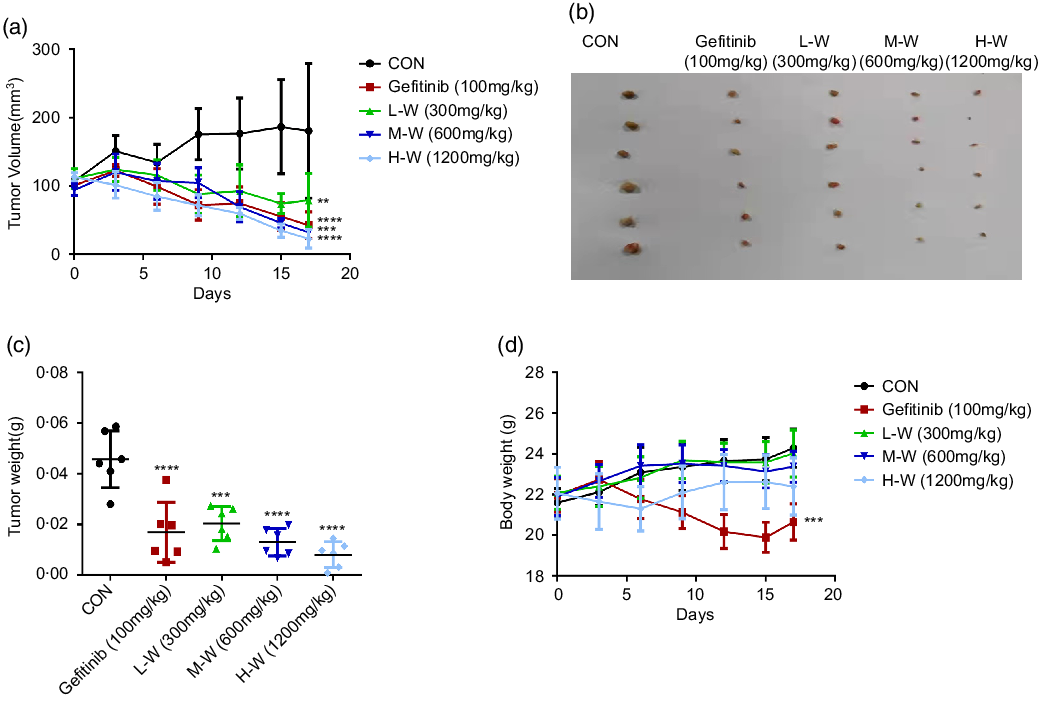
Based on MTT results showing significant inhibitory activities of CLW on A549 and H1650 lung cancer cell viability, a nude mouse xenograft model was used to evaluate the in vivo antitumour activities of CLW. As shown in Fig. 6(a) and (b), the tumour volume of A549 cell xenografts in nude mice was significantly suppressed by CLW compared with the control group for 17 d following three-level doses of drug exposure. CLW at different doses also showed a significant tumour weight reduction than control (Fig. 6(c)). In addition, the results depicted in Fig. 6(d) suggested that CLW treatment does not affect the body weights of mice. However, a slight decrease in body weight was observed with Gefitinib treatment group.
CLW suppresses xenograft tumour growth in mice. (a) Efficacy of CLW on tumour growth in nude mice injected with A549 cells. A549 cells were trypsinised and resuspended in F-12K media for subcutaneous inoculation into the right flank of nude mice, which were treated with the indicated concentrations of CLW. Relative inhibition rates of treatment groups compared to control mice (b) Images of xenograft tumours obtained from the mice (n 6 for each group). (c) The tumour weight of mice was recorded at the end of the experiments. (d) The body weight of mice was recorded on the last day. Data represent mean ± sd (one-way ANOVA), **P < 0·01, ***P < 0·001, ****P < 0·0001. v. control mice. CLW, Cuscuta chinensis water extract.
In vivo quantitative real-time PCR analysis
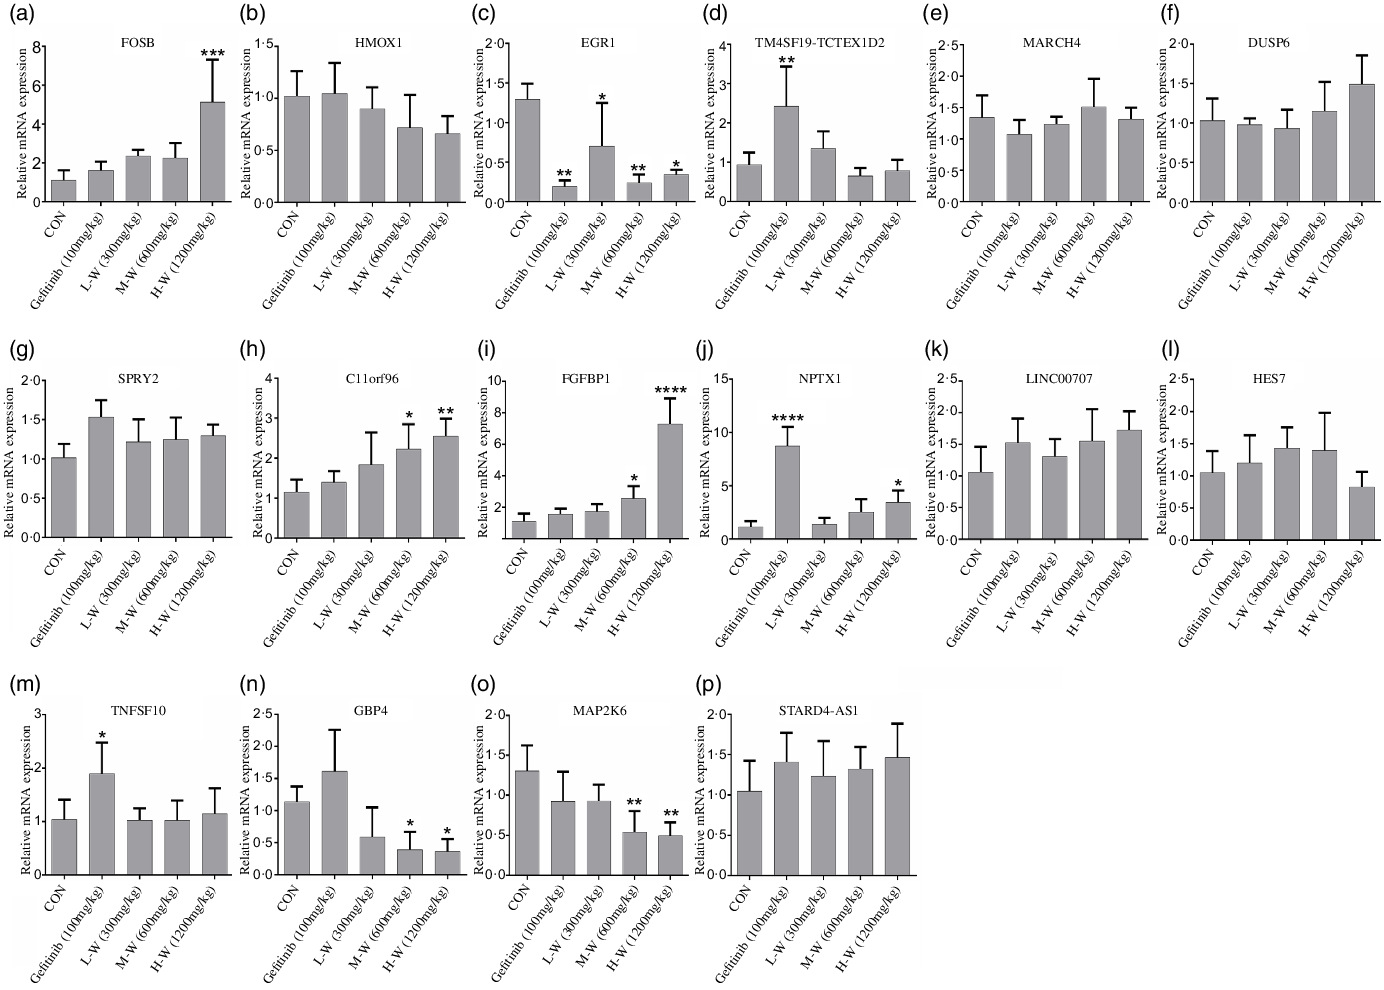
Since RNA-seq and qRT-PCR analysis indicates sixteen genes were regulated in A549 and H1650 cells under CLW treatment, we, therefore, investigated in vivo effect of CLW on the expression of the above genes. The qRT-PCR results showed four genes (C11orf96, FGFBP1, FOSB and NPTX1) were up-regulated (Fig. 7(a), (d), (e), (l)) and three genes (EGR1, GBP4 and MAP2K6) were down-regulated in tumour tissues compared with the control group (Fig. 7(c), (f), (j)). Interestingly, up-regulation of NPTX1, TNFSF10 and TM4SF19-TCTEX1D2 and the down-regulation of EGR1 were observed in Gefitinib group treated with 100 mg/kg compared with control (Fig. 7(c), (l), (o), (p)).
In vivo qRT-PCR validation. (a), (b), (c), (d), (e), (f), (g), (h), (i), (j), (k), (l), (m), (n), (o), (p) The expressions of common genes (sixteen consistently regulated genes in vitro) in A549 xenograft tumour tissues were determined by qRT-PCR. The average relative gene expression changes compared with the control mice were calculated using GAPDH. The mRNA expression differences between the treated and control samples were determined using one-way ANOVA. Representative experiments, n 6, mean ± sd. *P < 0·05, **P < 0·01, ***P < 0·001, ****P < 0·0001. qRT-PCR, quantitative real-time PCR.
Discussion
In China and many other Asian countries, C. chinensis is a common traditional medicine. Several diseases, including chyluria, chloasma faciei, female sterility and male reproductive system dysfunction are treated with CLW. Furthermore, it is used as a tonic for the liver and kidney(Reference Donnapee, Li and Yang6). Despite these myriad benefits, its efficacy in NSCLC has yet to be explored. In the present study, we demonstrated CLW could significantly inhibit NSCLC growth both in vitro and in vivo, and we showcased the possible mechanism involved for the first time.
Cell viability assay indicated that the CLW significantly inhibited the viability of lung adenocarcinoma cancer cells (A549 and H1650) in time- and dose-dependent manner. Furthermore, CLW is found to induce a dose-dependent G1 cycle arrest in A549 and H1650 cells. However, the apoptosis inducement in the lung cancer cells (A549 and H1650) was not observed under the CLW treatment, suggesting CLW induces cell cycle arrest but not apoptosis in both A549 and H1650 cell lines, leading to inhibition of cell viability.
With the development of a high-throughput technique, RNA-Seq has become widely used in cancer research. This allows for early detection of the disease and determining the pathological origin, defining the aberrant genes and molecular pathway dysregulation(Reference Hrdlickova, Toloue and Tian14,Reference Wang, Dean and Hornicek15) . Thus, to explore further the mechanism of CLW in regulating the cell viability of lung cancer cells, we used RNA-seq to analyse the gene expression profiles of CLW in A549 and H1650 lung adenocarcinoma cancer cells. Approximately 602 genes significantly regulated by CLW in A549 and H1650 cells were found. Moreover, Gene Ontology and KEGG pathways analysis(Reference Maimaiti, Abudoukeremu and Tie16) demonstrated that these genes are significantly associated with cell proliferation, cell migration and apoptosis. In addition, MAPK signalling pathway, cortisol synthesis and secretion and ECM–receptor interaction were mainly enriched in KEGG. Growing evidence proved that apart from cortisol synthesis and secretion, the MAPK signalling pathway and ECM–receptor interaction play important role in the regulation of lung cancer cell proliferation, migration and apoptosis(Reference Sun, Liu and Liu17,Reference Li, Yang and Zhao18) . Furthermore, forty-six common genes (> 2-fold change) regulated by CLW in A549 and H1650 cells were selected for further validation. Among them, we confirmed using the qRT-PCR test, the up-regulation of twelve genes (TM4SF19-TCTEX1D2, MARCH4, FOSB, HMO-X1, DUSP6, SPRY2, EGR1, C11orf96, FGFBP1, NPTX1, LINC00707 and HES7) and down-regulation of four genes (TNFSF10, GBP4, MAP2K6 and STARD4-AS1) in both cell lines. Thus, we next investigated lung cancer suppression and gene expression regulatory effect of CLW in vivo. CLW significantly reduced tumour volume and weight at all tested doses without affecting body weight. However, we did observe slight body weight loss after Gefitinib treatment. These results suggested that CLW might have strong anti-lung cancer activity and is relatively safer than Gefitinib. Furthermore, in vivo qRT-PCR results strongly confirmed that CLW up-regulated C11or-f96, FGFBP1, FOSB and NPTX1 genes expression and down-regulated GBP4 and MAP2K6 genes expression. Therefore, this study hypothesises that these genes may be potential targets for tumour suppressor activity of CLW on the NSCLC. Previous reports demonstrated that FGFBP1 is one of the FGFBP family members, an essential regulator in cancer(Reference Huang, Chen and Shang19,Reference Ray, Cabal-Manzano and Moser20) . FOSB, a FOS family member, plays an important role in lung cancer cells’ growth and survival(Reference Na and Kim21,Reference Ting, Lee and Wu22) . Another important gene NPTX1 may also be involved in cancer progression process(Reference Peng, Pan and Zhao23,Reference Zhou, Qin and Xie24) . GBP4 belongs to the GBP family found to express in various cancers(Reference Wang, Wang and Liang25). MAP2K6 belongs to the dual-specificity protein kinase family and its involvement in specific cellular processes, including carcinogenesis, stress-induced cell cycle arrest, transcription activation and apoptosis has been reported(Reference Li, Fu and Li26). As there is no scientific evidence indicating the cellular regulation and function of C11orf96, further studies are required to understand the specific role of this gene. Interestingly, down-regulation of EGR1 gene expression was observed following CLW and Gefitinib treatment in vivo. These results were inconsistent with RNA-seq and qRT-PCR data that CLW up-regulated EGR1 gene expression in the A549 and H1650 cells. EGR1 is an early response gene that is involved in growth, differentiation and apoptosis in various cancer(Reference Li, Ameri and Wang27). However, the controversial role of EGR1 in cancer progression was reported in several articles(Reference Li, Liu and Pei28). Our in vitro and in vivo results also contradict each other regarding the regulation of EGR1 gene expression. Hence, we suggest further elucidation of the potential regulatory mechanisms.
Conclusion
This study demonstrated that the water extract of C. chinensis exhibited strong anti-lung cancer activity in vitro and in vivo by inducing G1 cell cycle arrest, up-regulation of C11orf96, FGFBP1, FOSB and NPTX1 and down-regulation of EGR1, GBP4 and MAP2K6 gene expression. Additionally, compared with the first-line anti-lung cancer drug tyrosine kinase inhibitor Gefitinib, C. chinensis showed no effect on experimental nude mice’s body weight. Our findings supported that C. chinensis could help treat lung cancer and is a valuable resource for isolating novel active compounds for cancer treatment.
Acknowledgements
The Postdoctoral Project of Zhejiang Province (Grant number zj2019159) supported this study. Aikebaier Maimaiti: conceptualisation, methodology, visualisation, investigation, software, data curation, writing—original draft preparation, reviewing and editing. Juewen Xu: visualisation, investigation. Linsen Shi: supervision.
There has been no significant financial support for this work that could have influenced its outcome.
All authors agree to be accountable for all aspects of work, ensuring integrity and accuracy.
We wish to confirm that there are no known conflicts of interest associated with this publication.
Supplementary material
For supplementary material/s referred to in this article, please visit https://doi.org/10.1017/S0007114522003865