

Introduction
Languages of Africa represent one-third of the world’s linguistic diversity (Heine & Nurse, Reference Heine, Nurse, Heine and Nurse2000) but are underrepresented in linguistic research (Berghoff & Bylund, Reference Berghoff and Bylund2025), including in sociolinguistics. However, given that the social milieu of well-studied Western industrialized speech communities may differ from that of non-Western and/or non-industrialized ones, developing a robust theory of language variation and change necessitates examining understudied communities, such as those in Africa.
In this paper, we contribute sociophonetic data on vocalic variation in Twi, a dialect of Akan (Niger-Congo, Kwa) spoken in Ghana. Akan is the language spoken by the Akan ethnic group, which makes up 45.7% of Ghana’s population of over 30 million people (Ghana Statistical Service, 2021). The language is spoken primarily in southern Ghana, particularly in 8 out of the 16 regions, including the Ashanti Region. Akan has two main dialects, Twi and Fante, each with several subdialects (e.g., Asante Twi and Iguae Fante; see Kpogo & Lindsey, Reference Kpogo and Lindseyunder review). This study focuses on the Asante Twi dialect.
Twi is spoken by a broad spectrum of language users in Ghana. Apart from Akan-speaking regions, Twi serves as a lingua franca in non-Akan-speaking regions, including the Greater Accra Region where it is one of four major languages in use (Yankson, Reference Yankson2018:1-355). Although not native to Greater Accra, Twi is spoken there by many people who have migrated for reasons such as trade, education, and interethnic marriages and interact with non-Akan natives in Twi. These migrant Twi speakers often acquire additional languages indigenous to Accra (e.g., Gã and Dangme) and raise their children to be bilingual or multilingual. Accra is also home to people from diverse ethnolinguistic backgrounds who learn and use Twi as a second language (L2) (Essegbey, Reference Essegbey and McLaughlin2009). This diverse linguistic landscape has led some Akan scholars to propose the existence of a distinct variety of Twi known as “Accra Twi,” which differs significantly from varieties spoken in the traditional Akan-speaking regions (Abakah, Reference Abakah2016; Yankson, Reference Yankson2018:1-355).
Our goal in this study was to understand the social factors driving a sound change in vowel production reported among speakers of “Accra Twi,” one that involves a typologically less common feature known as Advanced Tongue Root (ATR). In the rest of the paper, we report a production study that tracked the trajectory of the Twi sound change in apparent time. We first introduce the sound change involving ATR vowel harmony in more detail and then review previous research concerning the influence of speaker age and gender on sound change. We present our research questions in connection with aspects of the social context of Twi speakers in different localities. Our results provide evidence that the three variables of speaker locality, age, and gender all play a significant role—and furthermore interact—in predicting the progression of the change, but not necessarily in the manner one might expect based on variationist research on English. In particular, the change is advanced primarily by urban men instead of women. We close the paper by discussing implications for sociolinguistic theory and future work on variation and change in understudied communities.
ATR harmony in Twi and the status of [æ]
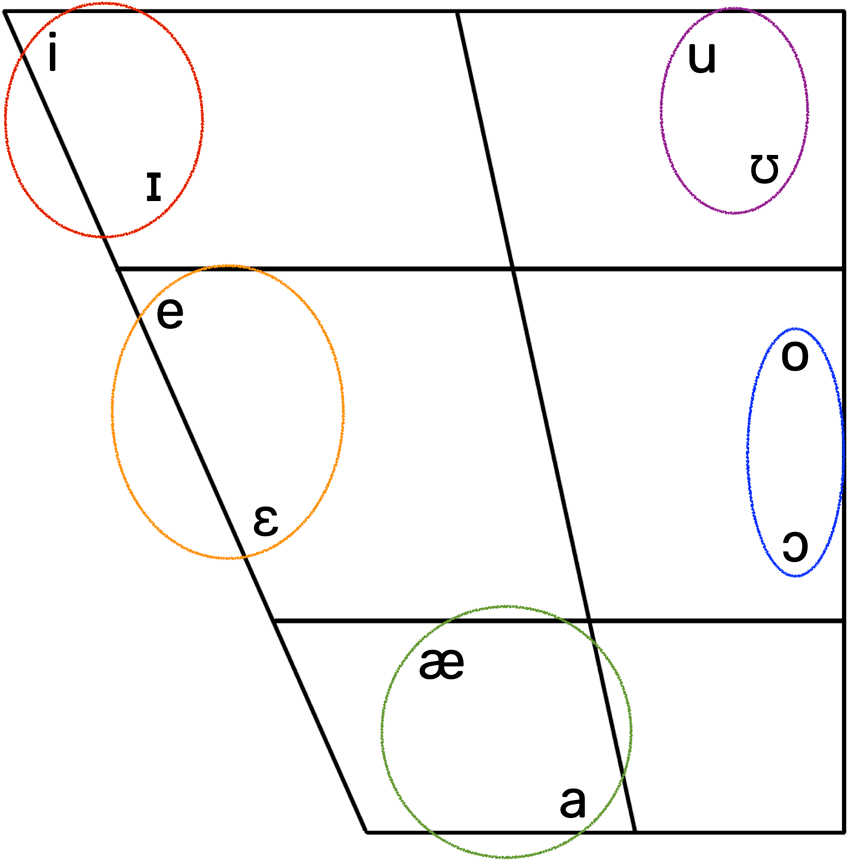
Twi exhibits vowel harmony with respect to the feature [ATR]. The vowel system includes [+ATR] vowels ([i u o e æ]) and [−ATR] vowels ([ɪ ʊ ɔ ɛ a]), which alternate with each other (see Figure 1). Previous analyses differ in terms of how many and which vowels are posited as phonemes (e.g., Berry, Reference Berry1957; Clements, Reference Clements1981; Dolphyne, Reference Dolphyne1988:1-199; Schachter & Fromkin, Reference Schachter and Fromkin1968; Stewart, Reference Stewart1967); we remain agnostic on this point, but assume a vowel system consisting of 10 allophones. Crucially, in a harmony-triggering context, such as when a [−ATR] vowel appears before a [+ATR] vowel or certain palatal consonants (e.g., /dʑ ɲ/) in a word, the [−ATR] vowel changes to its [+ATR] counterpart (Agyekum, Reference Agyekum2010:1-234; Casali, Reference Casali2012; Clements, Reference Clements1981; Dolphyne, Reference Dolphyne1988:1-199). For example, the phonemic form /a-du/ ‘has arrived’ is realized as [ædu], with ATR harmony between the stem and affix vowels. ATR contrasts are often transcribed with International Phonetic Association symbols indicating “tense” and “lax” vowels in languages such as English; however, they are phonologically and articulatorily distinct from tense-lax contrasts, although acoustically similar in terms of being reflected in vowel formants (Hudu, Reference Hudu2014; Kirkham & Nance, Reference Kirkham and Nance2017; Lindau, Reference Lindau1979; Olejarczuk et al., Reference Olejarczuk, Otero and Baese-Berk2019; Tiede, Reference Tiede1996).
The Twi vowel system, in terms of [±ATR] vowel pairs (circled; upper = [+ATR]).

Of particular interest in this paper is the [−ATR] vowel /a/. Traditional descriptions (e.g., Agyekum, Reference Agyekum2010; Lindau-Webb, Reference Lindau-Webb1987; Schachter & Fromkin, Reference Schachter and Fromkin1968; Stewart, Reference Stewart1967) suggest that /a/ is produced as [æ] before [+ATR] vowels /i u o/ and palatal segments followed by /a/, but recent evidence indicates that some speakers produce a different vowel in these [+ATR] contexts. For instance, based on impressionistic data, Yankson (Reference Yankson2018:1-355) identified regional variation in the production of /a/ in [+ATR] contexts. Indigenous Twi speakers (i.e., those residing in the traditional Twi-speaking areas such as Mpraeso and Dum-Anafo) predominantly produced [æ] (e.g., [ædu] ‘has arrived’), although some in Kumasi, “the seat of the Asante kingdom, where the Asante variety is spoken with all ‘purity’” (Yankson, Reference Yankson2018:227), produced [e] instead (e.g., [edu] ‘has arrived’). In contrast, second-generation urban Twi speakers, particularly in Accra, predominantly produced [e], suggesting a sound change from [æ] to [e]. This change was attributed to contact with the Fante dialect, which uses [e] instead of [æ] (Yankson, Reference Yankson2018:228).
Crucially, the vowel quality resulting from this change, [e], corresponds to a distinct phoneme /e/ in Twi, meaning that the [æ] > [e] change (hereafter, “[æ]-raising”) results in a vowel merger that obscures lexical distinctions. For example, in Casali (Reference Casali2012), a Twi speaker was observed to conflate /a/ with /e/ in [+ATR] compound words. This speaker assimilated /a/ to [e] instead of to the canonical [æ] (e.g., /da/ ‘day’ + /du/ ‘ten’ → [dedu] ‘ten days’); thus, either the raised variant of /a/, [æ], was raised further to [e], or harmony proceeded directly to [e] with no intermediate [æ]. Note that [e] and [æ] in Twi differ in terms of the source of their [+ATR] specification: [e] is underlyingly [+ATR] (i.e., corresponding to the phoneme /e/) or derived as the [+ATR] variant of [−ATR] /ɛ/ in a harmony-triggering context, whereas [æ] is only derived as the [+ATR] variant of [−ATR] /a/ (e.g., /adu/ → [ædu] ‘name of a person,’ cf. /edu/ → [edu] ‘ten’). Consequently, for the speaker in question, the lexical items /adu/ and /edu/ are both realized as [edu], implying that a lexical contrast has been erased. The same outcome arises for other word pairs as well (e.g., /ahu/ ‘have/has seen,’ /ehu/ ‘fear’; /adʑa/ ‘father,’ /edʑa/ ‘fire’; /asum/ ‘have/has supported,’ /esum/ ‘darkness’).
Although [æ]-raising is associated with ATR harmony, recent work on vocalic variation in Twi has shown that [æ]-raising does not perfectly coincide with the occurrence of ATR harmony for /a/. Rather than uniform [æ]-raising across harmony-triggering contexts, Kpogo (Reference Kpogo2024:1-222) observed contextual variation. ATR harmony and [æ]-raising were common before palatal consonants (i.e., /dʑ ɲ/) and the vowels /i u/, all specified by the feature [+high]. By contrast, the /o/ context did not consistently trigger ATR harmony; in fact, nonharmonized [a] was more common than harmony in this context. Even when harmony occurred in the /o/ context, [æ]-raising was inconsistent, yielding both [æ] and [e] variants.
Recent findings from Yankson (Reference Yankson2018:1-355) and Kpogo (Reference Kpogo2024:1-222) thus contradict the traditional description of Twi vowel harmony, suggesting that [æ] may be undergoing a change in its quality (i.e., [æ]-raising) and in the set of harmony-triggering contexts that result in its production. Without historical or apparent-time evidence, however, it is premature to claim a sound change per se (i.e., a diachronic category shift; e.g., Austen, Reference Austen2020; Pinget et al., Reference Pinget, Kager and Van de Velde2020). Therefore, in the current study, we seek to confirm that [æ]-raising constitutes a sound change with apparent-time data, with special attention to whether [æ] is merging with /e/.
Vocalic variation and the role of speaker age
Younger individuals are often observed to be at the forefront of vocalic innovations (Fridland, Reference Fridland2001; Gordon, Reference Gordon, Murray and Simon2006:63; Hay et al., Reference Hay, Warren and Drager2006; Labov, Reference Labov1994:9-112), including various types of changes in vowel quality (Jacewicz et al., Reference Jacewicz, Fox and Salmons2011), which may further result in a structural change, such as a merger of two vowel phonemes (Freeman, Reference Freeman2014, 2021). Young people may be the ones to lead linguistic innovations due to their close-knit social networks and their use of language to express identity within a community (Eckert, Reference Eckert1989; Freeman, Reference Freeman2021; Laitinen et al., Reference Laitinen, Fatemi and Lundberg2020).
However, there are two reasons to be cautious about assuming a vowel merger will be driven by younger speakers and will lag among older speakers. First, some studies showed variability within older adults. For example, in southwestern Vermont, some older adults, but not others, exhibited a merger in English low back vowels (Leddy-Cecere & Mendez, Reference Leddy-Cecere and Mendez2021). Second, sometimes a vowel merger shows no apparent age effects (Freeman, Reference Freeman2014; Li et al., Reference Li, Gut and Schützler2021), which could either indicate a completed change or reflect that a sound change never occurred.
The current study investigated the role of age in Twi [æ]-raising and merger with /e/ by comparing multiple speaker generations, including adolescents, younger adults, and older adults. This comparison allowed us to determine the current state of the merger (i.e., whether it is complete or still in progress), identify which age-groups are actively involved, and observe potential variation in its advancement, as older speakers may exhibit earlier stages of the change.
Vocalic variation and the role of speaker gender
Extensive sociolinguistic research has examined the role of gender in sound change, leading to the consensus that women typically play a leading role in driving linguistic innovation (Labov, Reference Labov2001:280-284; Shin, Reference Shin, Carvalho and Beaudrie2013). In fact, the evidence of women leading sound change is so robust that “any theory of the causes of change must deal with the general finding that in the good majority of linguistic changes, women are a full generation ahead of men” (Labov, Reference Labov2001:501).
Research on gender effects has presented various explanations for why women may lead men in linguistic changes and, furthermore, has shown interactions of gender with factors such as prestige. Some sociolinguists suggested that “women are using language more to construct social differences among themselves while men are avoiding extreme usages” (Eckert & McConnell-Ginet, Reference Eckert and McConnell-Ginet2003:302; cf. Labov, Reference Labov2001:366-384). In changes from above in patriarchal societies, where women generally have less economic power than men, women may adopt prestigious variants to access symbolic capital when tangible socioeconomic or political power is inaccessible (Eckert, Reference Eckert1989). Finally, some researchers suggested that women tend to have higher sensitivity to linguistic variation than men, supporting greater linguistic innovation (e.g., Chambers, Reference Chambers1995:136-137).
Male-led changes are also documented to a lesser extent. For instance, men led the centralization of English (ay) and (aw) on Martha’s Vineyard (Labov, Reference Labov1963) as well as certain changes in Philadelphia, such as [aɪ]-raising to [ə] (Labov, Reference Labov1990). Male-led changes were also found in Trudgill (Reference Trudgill1972), Milroy and Milroy (Reference Milroy and Milroy1985), and recent work on Seattle English (Freeman, Reference Freeman2021). Labov (Reference Labov1990) suggested that male-led changes may be influenced by exposure to advanced forms of speech from female caregivers during childhood, leading us back to women as the initial source of linguistic change.
Beyond English, on the one hand, there is evidence of women leading sound changes in Cairene Arabic, some of which may be related to the gendered nature of educational access and of occupations requiring regular use of Classical Arabic (Haeri, Reference Haeri1997:1-304; see also Brunelle, Reference Brunelle, Stanford and Preston2009 on a related gender effect in Eastern Cham). Along the same lines, women in the K’iche’ Mayan-speaking community of Guatemala used an innovative fricativized variant of /l/ more than men; this effect was attributed to men’s greater contact with speakers of other K’iche’ dialects and, therefore, greater awareness of the stigma associated with the innovative variant (Romero, Reference Romero, Stanford and Preston2009:92). On the other hand, among “Caipira” Portuguese-speaking migrants to urban Brasília, men adopted many new urban features faster than women, attributable to the men’s higher number of interactions in the city with local urban speakers and other immigrants and women’s staying within their kinship and neighbor network (Bortoni-Ricardo, Reference Bortoni-Ricardo1985:1-265). Similarly, among Yami speakers in Taiwan, older men were the early adopters of innovative raised diphthong variants, although younger women, with greater social mobility, have caught up and surpassed men in this change (Rau et al., Reference Rau, Chang, Dong, Stanford and Preston2009:268).
Finally, gender effects often interact with other social factors, such as social class and age (Cheshire, Reference Cheshire1982:1-142; Eckert, Reference Eckert1989; Labov, Reference Labov1990; Freeman, Reference Freeman2014).
The current study
In the current study, we examined the production of the Twi [æ] vowel by speakers of different ages, genders, and localities within Ghana. Contributing the first acoustic data on Twi [æ]-raising, this study allows us to test sociolinguistic generalizations, given that the social dynamics in non-Western communities pertaining to variables such as gender and age may not mirror those in Western communities such as the USA, the UK, and Canada (Rickford, Reference Rickford1986). In Ghana, traditional gender roles are rigidly enforced: Men are expected to assume leadership roles in the sociocultural life of the community and provide for their families, while women take care of the household and children even if they seek employment (Akotia & Anum, Reference Akotia, Anum, Safdar and Kosakowska-Berezecka2015; Nartey et al., Reference Nartey, Bahar and Nabunya2023). Ghanaian men are thus more mobile than women for both social and economic reasons (Orkoh & Stolzenburg, Reference Orkoh and Stolzenburg2020), and have more freedom to engage in social activities and discussions at community centers and in their social groups than women (Adinkrah, Reference Adinkrah2004; Akotia & Anum, Reference Akotia, Anum, Safdar and Kosakowska-Berezecka2015; Dako-Gyeke & Owusu, Reference Dako-Gyeke and Owusu2013; Nartey et al., Reference Nartey, Bahar and Nabunya2023). In essence, Ghanaian men’s social circles tend to be wider than women’s, implying greater societal engagement. Although Akan societies are matrilineal and have exhibited certain matriarchal characteristics (Awusabo-Asare, Reference Awusabo-Asare1990; Farrar, Reference Farrar1997; McGee, Reference McGee and Taylor2015), women’s influence functions within a broader sociopolitical system that prioritizes male authority, resulting in a social structure that remains fundamentally patriarchal (Adinkrah, Reference Adinkrah2012; Shin, Reference Shin2025). Furthermore, in Akan societies, age carries considerable weight. For example, whereas university students in the USA might be able to address their professors by first name regardless of age, this practice is not tolerated in Akan communities. That said, the concept of age encompasses not only chronological age but also social age, which includes “roles and social habits” (Birren & Renner, Reference Birren, Renner, Birren and Schaie1977:4-5).
According to the Principle of Sociolinguistic Distance (Mansfield & Stanford, Reference Mansfield and Stanford2017), if there is a significant sociocultural and linguistic gap between an understudied community and traditional sociolinguistic settings (e.g., industrialized Western cities such as Philadelphia), then research conducted in the understudied community is likely to pose theoretical challenges to current sociolinguistic principles. Consequently, it is critical to conduct variationist research in understudied languages, not only to understand linguistic universals but also to develop theories of language that are representative of other populations (Strong et al., Reference Strong, Lindsey and Drager2020). The current study of Twi contributes to this enterprise.
Our central question concerned three speaker variables in relation to the [+ATR] variant of Twi /a/: Do locality, age, and/or gender predict a speaker’s realization of /a/ in harmony-triggering contexts? The study hypothesis was guided by previous findings on [æ]-raising and on social differentiation in other linguistic innovations. Specifically, we predicted [æ]-raising in harmony-triggering contexts to be advancing in apparent time, with younger generations and female speakers in the urban locality leading the innovation (cf. Yankson, Reference Yankson2018:1-355).
Method
Participants
Participants included adolescent, younger adult, and older adult first language (L1) speakers of Asante Twi, ranging in age from 12 to 75 years. The participants were drawn from two different localities: a traditional Twi-speaking community and an urban (not traditionally Twi-speaking) community. The traditional community data were gathered from Asotwe and Fumesua, both located in the Ejisu Municipality of the Asante Region. Although Asotwe is rural and Fumesua is suburban, the linguistic behavior of participants from these two areas was similar (likely due to their close geographical proximity and the shared cultural belief that the Twi spoken in the Asante Region is pristine; see Yankson, Reference Yankson2018:1-355); therefore, they were analyzed together as representing the traditional community. The urban community data was gathered from Tema, the industrial city of Ghana in the Greater Accra Region. A total of 106 speakers participated in the study; however, data from one speaker were discarded due to unintelligible speech, leaving 105 speakers in the final sample. The data were collected in two waves. The first wave was in 2021 and targeted primarily younger adults, while the second wave was in 2022 and targeted the other two age-groups. Table 1 provides a breakdown of the participants’ demographic information, categorized by locality, age, and gender.
Participants’ demographic information by locality, age-group, and gender

To ensure the selection of suitable participants, we applied specific eligibility criteria via a screening questionnaire. All participants were required to (1) have spent most of their life in their respective community, and (2) report Asante Twi as their L1 or one of their L1s, with at least one parent also speaking Twi as their L1. Participants who were admitted into the study also completed a detailed language background questionnaire; this questionnaire as well as the initial screening questionnaire are publicly accessible at https://osf.io/ksgfy/. Based on questionnaire data, the urban speakers in all age-groups were mostly bilingual or multilingual (in languages such as English, Gã, and Dangme); in contrast, the traditional older adults were mostly monolingual, while the traditional younger adults and adolescents were bilingual (mostly in English). Most participants reported using Twi for at least 60% of their daily interactions. Overall, however, traditional speakers reported using Twi more (M = 76%, SD = 19; range 40-100) than urban speakers (M = 61%, SD = 18; range 20-100).
Materials
The items elicited in the production task comprised words that placed [−ATR] /a/ in harmony-triggering contexts (i.e., before the [+ATR, + high, −low] vowels /i u/ or palatal consonants) as well as words containing the [+ATR] phonemic /e/ to aid in diagnosing the merger of [æ] with /e/. For each participant, 35-36 items targeted /a/; two of these items (mako ‘pepper,’ afu ‘has/have grown’) were ultimately excluded due to multiple lexical variants or potential influence from a preceding vowel on the target vowel, leaving up to 34 items with /a/ per participant in the final analysis. The number of items containing the /i/ or /u/ context was higher than for other contexts, mainly because these words were more imageable. Seven items targeted /e/. We tried to match the consonantal context preceding or following the target vowels, although this could not be fully controlled. However, more than 80% of the target vowels were word-initial, minimizing potential coarticulatory effects, given that the word tokens submitted to analysis were uttered in isolation.
To elicit the target items, fill-in-the-blank sentences were constructed to create a context prompting production of the target item. The blank for the target item occurred either in the middle or at the end of the sentence, which was presented both visually and auditorily. Additionally, a picture prompt accompanied each sentence to maximize the likelihood that participants would understand what the target was. A full list of target items and lists of the sentence and picture prompts used to elicit each item are accessible at https://osf.io/ksgfy/.
There were some differences in the materials used in the two waves of data collection related to the targeted age-groups and COVID travel restrictions. First, 13 items used in the 2021 wave of data collection (e.g., apoo ‘fraud’) were replaced in the 2022 wave with 12 items that were more likely to be familiar to younger participants. Because our results remained overall the same regardless of whether or not we excluded the items that differed between waves, we report results that are based on the larger dataset per participant. Second, due to travel restrictions, the 2021 wave of data collection was not carried out by the first author as originally planned, but rather by a local research assistant, an urban Twi speaker who produces variable [æ]-raising. Therefore, to reduce the possibility of phonetic convergence to urban norms, we presented the sentence prompts auditorily via a set of audio files that were evenly divided between traditional and urban speakers; that is, all participants heard sentence prompts from both types of speakers at random. The 2022 wave of data collection was carried out locally by the first author, an L1 Twi speaker who does not produce [æ]-raising. Therefore, this wave was carried out according to the original plan, in which the researcher uttered the sentence prompt in real time. Crucially, because the first author is a non-raising speaker, any finding of [æ]-raising among speakers targeted in the 2022 wave of data collection (i.e., adolescents and older adults) represents a strong result that cannot be due to convergence.
Procedure
The study procedure was the same in both waves of data collection. Participants first completed a language background questionnaire and then an elicited production task. The production task was completed in a quiet room before a computer. Participants were given instructions for the task and the opportunity to ask any questions before they began the task. The instructions emphasized that participants would hear and see sentences in Twi with a blank, along with pictures; they were instructed to first fill in the blank (i.e., utter the target word on its own) and then repeat the entire sentence at a comfortable speaking level. However, only the first (i.e., isolated) productions were subjected to analysis. Audio was recorded at 44.1 kHz with 16-bit resolution, using a Zoom H4N recorder and an AKG C520 head-worn condenser microphone placed a few inches away from the mouth to the side.
To ensure that participants understood the task instructions, they completed two practice trials with non-test items before the main test trials. If a participant encountered difficulty in producing a target item, the researcher provided additional descriptions or definitions to prompt them. The task duration averaged 15-20 min depending on age-group. All participants were compensated with $15 for their participation.
Analysis
We coded five main linguistic and social variables and measured three acoustic properties of the target vowels. The full dataset is publicly accessible at https://osf.io/z268r/. The linguistic variables comprised vowel identity (/a/ or /e/) and the specific harmony-triggering segment within the word context, while the social variables comprised the speaker’s age, gender, and locality. Acoustic analyses were carried out in Praat (Boersma & Weenink, Reference Boersma and Weenink2022). The target vowels were manually annotated, and then vowel duration and the first two formants (F1, F2) at the midpoint of each vowel were measured using a Praat script. The maximum formant value was set at 5000 Hz for men and 5500 Hz for women, with a window length of 25 ms and a dynamic range of 30 dB. The formant values from the script were inspected for accuracy, and those that were more than two standard deviations from the respective mean (within formant, vowel, and speaker) were hand-corrected.
To facilitate meaningful comparisons of vowel productions across speakers, the Nearey2 (log mean) normalization method was applied to the raw (Hz) formant data in R (R Development Core Team, 2022) using the phonR package (McCloy, Reference McCloy2016). The Nearey2 method addresses the challenges posed by individual variation in raw formant ranges, which can obscure significant differences between speakers. This method is vowel-extrinsic, formant-extrinsic, and speaker-intrinsic and preserves sociolinguistic differences while neutralizing physiological differences between speakers (see Barreda & Nearey, Reference Barreda and Nearey2018).
To quantify the degree of similarity (i.e., overlap) between the distributions of the two vowels (/a/ and /e/), we used the Pillai–Bartlett statistic, popularly known as the Pillai score (Hay et al., Reference Hay, Warren and Drager2006). The Pillai score “is an output of a multivariate analysis of variance (MANOVA), which indicates a degree of distinction between distributions while taking into account two or more dependent variables simultaneously” (Freeman, Reference Freeman2021:64). Pillai scores range from zero to one, with higher scores indicating less similarity, or greater distinction, between distributions. Several studies have used this approach to understand vowel distributions (e.g., Hay et al., Reference Hay, Warren and Drager2006; Hall-Lew, Reference Hall-Lew2009:1-260; Freeman, Reference Freeman2021) and suggested that it may model degree of overlap/distinction better than other approaches (see Hall-Lew, Reference Hall-Lew2010; Kelley & Tucker, Reference Kelley and Tucker2020; Nycz & Hall-Lew, Reference Nycz and Hall-Lew2014). Note, however, that low Pillai scores reflect merged production specifically, which may or may not be reflected in a perceptual merger (see Austen, Reference Austen2020; Babel et al., Reference Babel, McAuliffe and Haber2013; Freeman, Reference Freeman2023; Zhang et al., Reference Zhang, Graham, Barlaz and Hualde2022).
Our descriptive and statistical analyses were done in R. To visualize vocalic overlap, we plotted vowel productions in Nearey-normalized F1 × F2 space. Furthermore, we conducted a MANOVA with the Nearey-normalized F1 and F2 values as dependent measures and vowel identity as the independent measure. This analysis allowed us to calculate two types of Pillai scores: group-level scores, which assessed the extent of merger within specific localities and age-groups by gender; and individual-level scores, which examined between-participant differences in the degree of merger. Finally, the individual-level Pillai scores were entered as the dependent measure in a generalized additive model (GAM). Built with the mgcv package (Wood, Reference Wood2011), the GAM included the independent variables Locality, Age, and Gender, enabling us to explore how these social factors were associated with the degree of merger. We provide further details about this model in the following section.
Results
Our results focus on the individual-level Pillai scores, which provided insight into inter-speaker variation in the degree of [æ]–/e/ merger across locality, age, and gender (for group-level results, see the appendix, also accessible at https://osf.io/z268r/). For these analyses, we treated age as continuous to capture the gradual trajectory of the merger over apparent time.
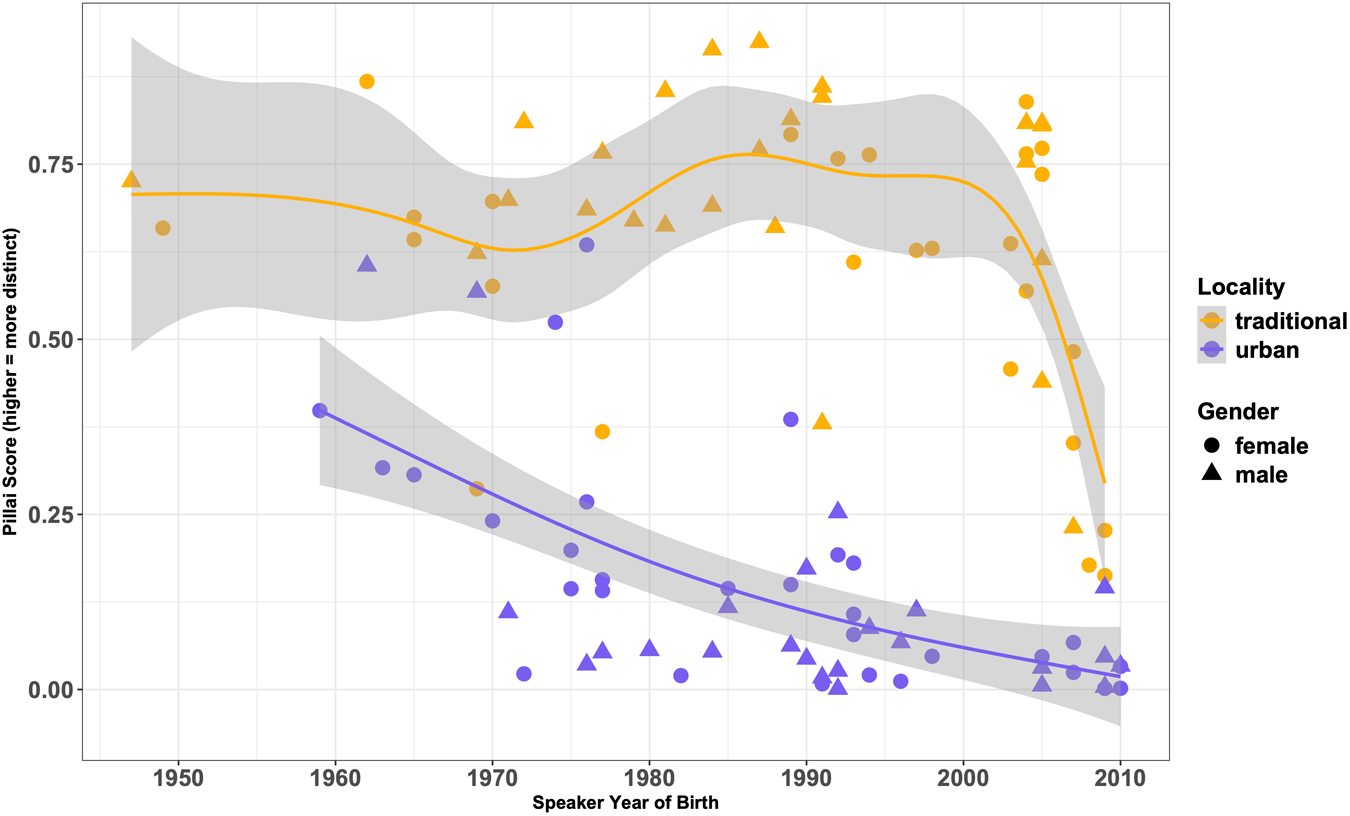
We first address the overall effect of locality. As shown in Figure 2, individual Pillai scores varied considerably, but much of this variation was clearly related to locality. With only a few exceptions, traditional speakers exhibited higher Pillai scores, indicating a phonetic distinction between [æ] and /e/. In contrast, most urban speakers showed Pillai scores approaching or reaching zero, indicating great overlap or outright merger of [æ] with /e/.
Scatterplot showing individual Pillai scores by year of birth, locality, and gender. Each point represents one speaker’s degree of phonetic overlap between allophonic [æ] and phonemic /e/. The smooths are locally estimated scatterplot smooths by locality showing a 95% confidence interval around the curve.

Age effects at the individual level
Turning to the effect of age, we observed different patterns in the urban and traditional localities. Among urban speakers, there was a semi-linear age effect: as age decreased (i.e., at later years of birth), Pillai scores tended to decrease. Thus, a higher proportion of younger speakers were found to be participating in the [æ]–/e/ merger, indicating an ongoing sound change. In addition, Figure 2 reveals differences among age-groups. The youngest speakers (born after the year 2000) all exhibited near-zero Pillai scores reflecting the greatest degree of merger, and most of the middle-aged speakers (born between 1970 and 2000) closely resembled the youngest speakers in having low Pillai scores. However, the oldest speakers (born before 1970) showed more variability, with some individuals displaying Pillai scores well below 0.5 and others Pillai scores above 0.5. Taken together, these findings suggest that the merger of [æ] with /e/ is occurring at different rates across the different ages in the urban locality, a clear indication of a change in progress. In particular, younger speakers are at a more advanced, and less variable, stage of the merger, signaling that the change is progressing rapidly and may be at its peak among adolescents.
There were four older urban speakers, all migrants to the urban locality, who displayed Pillai scores above 0.5, thereby patterning like traditional speakers. These speakers’ traditional-like behavior could be explained in terms of ties to the traditional community and language ideologies. For example, they reported making regular visits to their traditional hometowns for funerals and family gatherings. Moreover, they held an ideology of authentic ethnic identity being rooted in traditional speech norms while also disapproving of Accra Twi. For instance, when asked whether they would like it if someone said they spoke Accra Twi, all four emphasized that they do not speak Accra Twi but rather Twi kronkron (i.e., “pure” or “unadulterated” Twi) as spoken in Kumasi or the traditional localities. Crucially, these speakers’ language ideologies contrasted with those of most age-matched peers with Pillai scores below 0.5, who also proudly identified as Asante but were generally urban-born. These peers embraced a more flexible view of ethnic identity, one in which language form is not centered, and generally said they would be happy to be described as speaking Accra Twi.
Among traditional speakers, the age effect was clearly nonlinear. The oldest speakers (born before 1970) generally showed lower Pillai scores than middle-aged speakers (born between 1970 and 2000), but the oldest speakers’ scores were not as low as those of most of the youngest speakers born after 2000. Although group-level results (see the appendix) suggested that older speakers are actively involved in the [æ]–/e/ merger, many older adults do not participate in the merger; their Pillai scores are relatively high (0.6 or above), suggesting a distinction between [æ] and /e/. The group-level pattern primarily reflects the speech patterns of two outliers with lower Pillai scores that align more closely with urban speakers; in fact, one of these outliers falls within the smooth for urban speakers in Figure 2. Per their questionnaire data, these outliers were monolingual Twi speakers who had extensive contact with the urban community; hence, contact with urban speech may explain their unusual degree of merger vis-à-vis traditional norms. Of all age-groups in the traditional locality, the greatest variation was found among the youngest speakers (born after 2000). Out of the 20 speakers in this group, 12 exhibited high Pillai scores characteristic of the traditional locality, while eight resembled urban speakers, displaying very low Pillai scores. The fact that eight of the youngest speakers have adopted the merger suggests that the change has already spread to the traditional locality, contra previous findings of the traditional community’s conservatism toward this change (Yankson, Reference Yankson2018:1-355).
The linguistic shift observed among the youngest traditional speakers (born after 2006) may have been facilitated by several developments in Ghana in the decade before their birth, especially the expansion of radio and television in local languages (Asah-Asante & Brako, Reference Asah-Asante and Brako2014; Blankson, Reference Blankson2000:1-317; Boateng, Reference Boateng2009; Zachary, Reference Zachary2004) and the rise of digital communication, including social media (Amofah-Serwaa & Dadzie, Reference Amofah-Serwaa and Dadzie2015; Ayensu, Reference Ayensu2003:58-60; Markwei & Appiah, Reference Markwei and Appiah2016; Mingle & Adams, Reference Mingle and Adams2015). Bolstered by the privatization of electronic media and expanded press freedom and media diversity, radio and television programming in Ghanaian languages became increasingly accessible; however, because many of the early influential radio stations were based in Accra and Tema, the programming was often shaped by urban Twi varieties. In addition, the sharp rise in digital communication provided another way for young traditional speakers to be exposed to urban speakers. Thus, the growth of both Akan-language media and digital communication likely provided younger generations in traditional communities with more regular exposure to urban speech patterns during their developmental years than older generations received.
Gender effects at the individual level
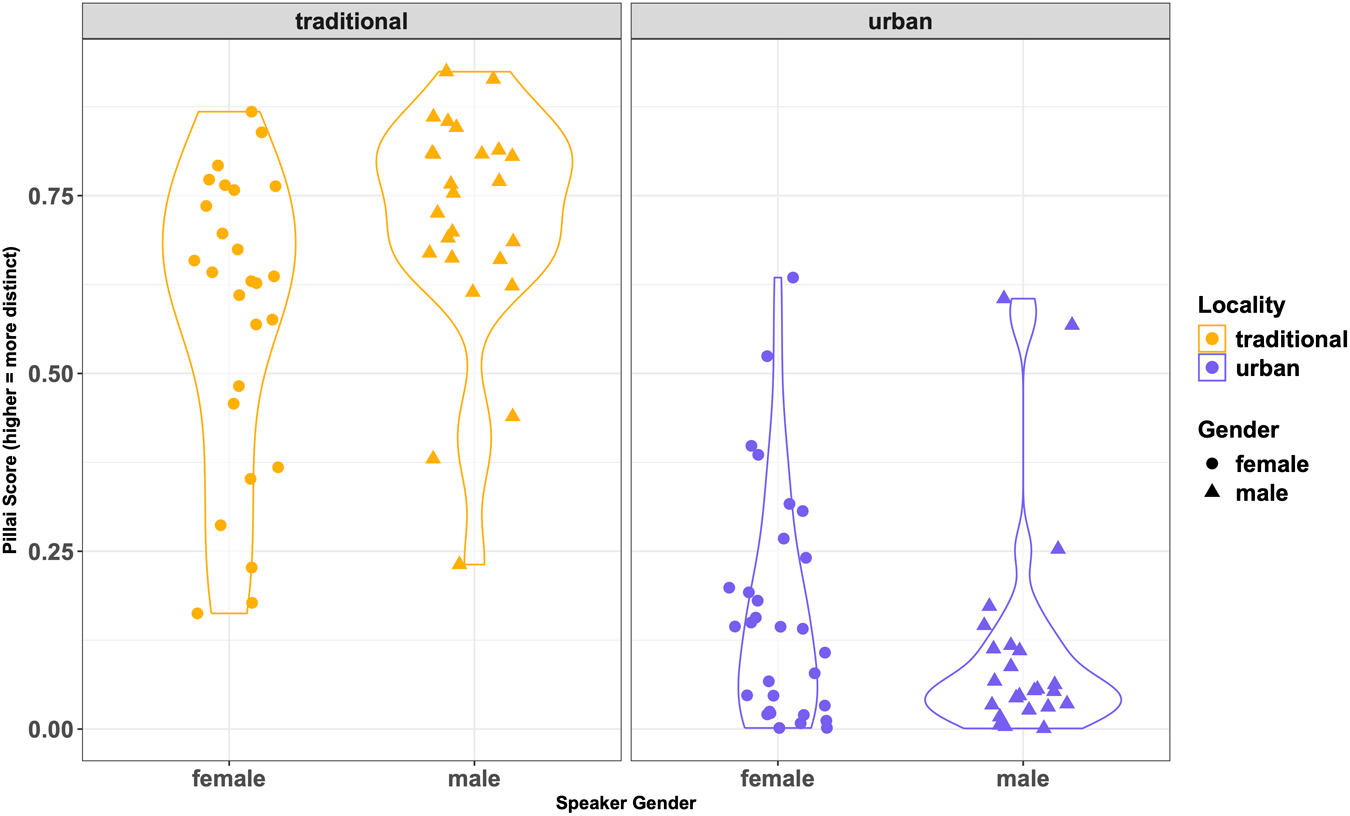
Shifting now to the effect of gender, we again observed different patterns between the urban and traditional localities, as shown in Figure 3. In the urban locality, both males (men and boys) and females (women and girls) participated in the [æ]–/e/ merger; however, males were ahead of females. Whereas almost all urban males had Pillai scores lower than 0.25, urban females showed greater variability, with several exhibiting Pillai scores higher than 0.25. Crucially, the male-led change in the urban locality is inconsistent with the preponderance of female-led changes reported in Western sociolinguistic studies (Labov, Reference Labov1990; Reference Labov2001:261-322; Shin, Reference Shin, Carvalho and Beaudrie2013, i.a.).
Violin plot showing individual Pillai scores by locality and gender. Each point represents one speaker’s degree of phonetic overlap between allophonic [æ] and phonemic /e/.

To explore why urban males appear to be ahead of urban females in the [æ]–/e/ merger, we examined their length of residence in the urban locality. As discussed earlier, the urban locality is not a traditional Twi-speaking community, meaning that L1 Twi-speaking residents either migrated from traditional Twi-speaking communities (first-generation speakers) or are the offspring of L1 Twi-speaking migrants (second-generation speakers), who are exposed to and interacting with other (L1 and L2) speakers in a multilingual environment. If, at the time of the study, males had lived longer in the urban locality than females, males would likely have had more exposure to a greater range of linguistic variation, potentially explaining their leadership in the change. A one-way analysis of variance on length of residence did not support this hypothesis, showing no significant difference between males and females [F(1, 52) = 0.531, p = 0.469]; in fact, on average, the males had lived in the urban locality for less time (M = 29 years) than the females (M = 31 years). Thus, length of residence cannot explain why urban males lead the change. We attribute this pattern instead to men’s greater societal engagement (as discussed in the Introduction section), but consider other possible predictors of gender disparities, including mobility, schooling, and social evaluation, in the Discussion section.
In the traditional locality, too, there was a gender difference in the [æ]–/e/ merger, but one that looked different from the gender difference in the urban locality. Some traditional females strongly differed from urban females, while others showed urban-like patterns. Of the 27 traditional females, 8 had Pillai scores below 0.5, most of whom were the youngest speakers shown in Figure 2. In contrast, only three traditional males aligned with urban males, showing Pillai scores below 0.5. Therefore, in the traditional locality, it is mostly females who participate in the merger. To further probe the social dynamics influencing gender differences in the traditional locality, we analyzed speakers’ self-reported levels of contact with urban speakers as well as with Fante speakers, who produce [e] where Twi speakers would canonically produce [æ]. Note that “contact” refers specifically to linguistic interactions and does not require physical presence in the other speaker’s locality (e.g., contact can occur via digital communication modes). Contact with Fante speakers did not reveal a gender difference that could help explain the above gender difference in merging: males and females both ranged from “none” to “a lot” of contact, and in fact females tended to report less contact than males. However, contact with urban speakers did provide some insight. Among traditional speakers who tended to merge (i.e., Pillai score < 0.5), females generally reported more contact with urban speakers than males did: only a minority (one of three, 33%) of the traditional males reported any contact, whereas the majority (six of eight, 75%) of the traditional females reported a lot of contact. Thus, traditional females who frequently interact with urban speakers—which could be by choice (see, e.g., Gal, Reference Gal1978)—may be driving the merger of [æ] with /e/ within the traditional locality, aligning with established sociolinguistic theory, which suggests that women typically take the lead as innovators during ongoing language changes, especially when the linguistic feature in question is not stigmatized (Labov, Reference Labov1990; Reference Labov2001:366-384).
Interaction of age, gender, and locality
Focusing on the urban data, we also examined the effects of age and gender in tandem to distinguish between speakers who initiated the merger and those who adopted and advanced it. As shown in Figure 2, among the oldest urban speakers (born before 1970), women had the lowest Pillai scores, while men had Pillai scores overlapping with those of traditional speakers. Although based on limited data (which contains especially few data points for older men), this disparity suggests that older urban women are ahead of age-matched urban men in the merger. In apparent time, however, men rapidly catch up with the change, as most urban men born in the 1970s showed lower Pillai scores than age-matched urban women. By the 1980s generation, virtually all urban speakers have adopted the change, with most Pillai scores below 0.15. Together, these patterns suggest that the oldest women may have initiated the merger in the urban locality, but slightly younger men adopted and advanced it. The initiation of the change in the urban locality by women is therefore consistent with the initiation pattern observed in the traditional locality (see Figure 3).
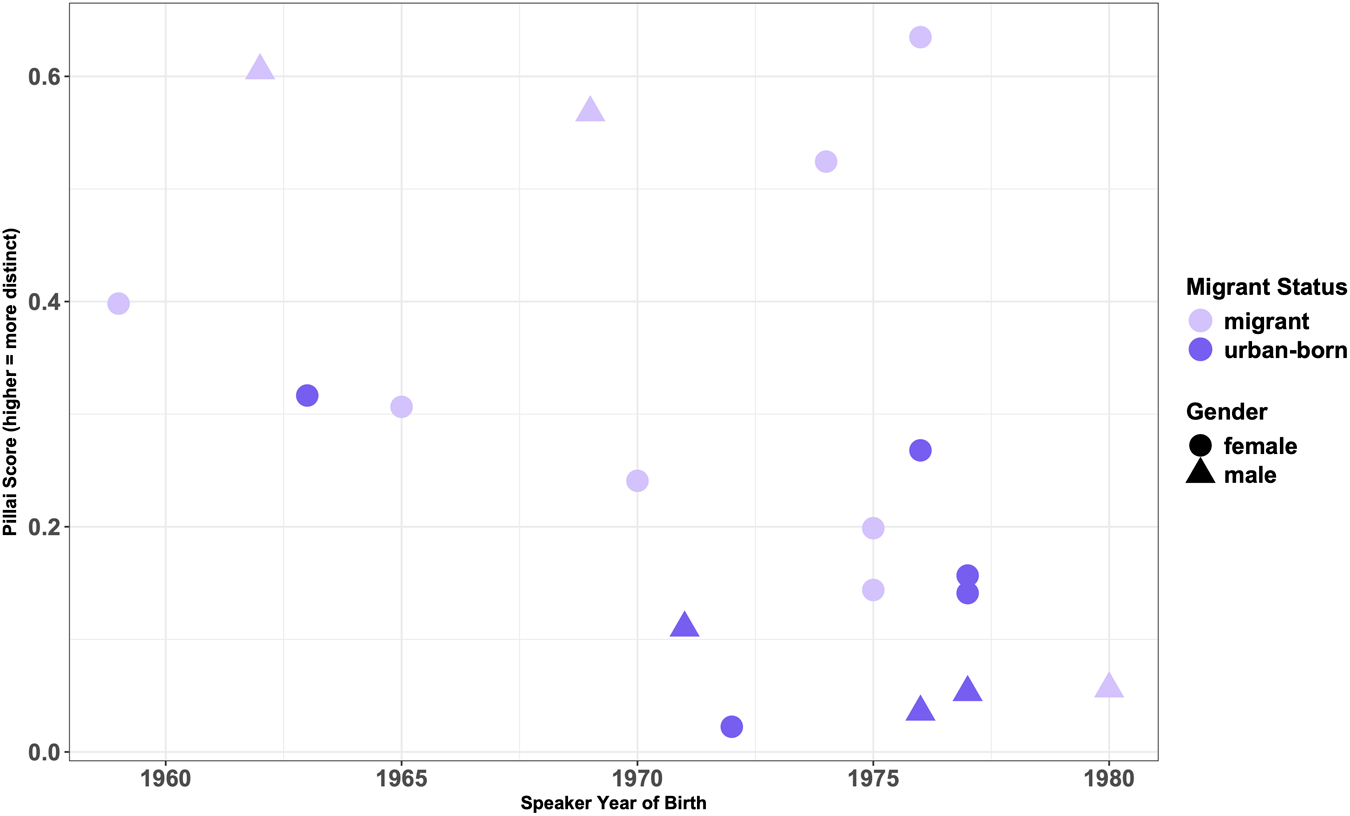
To better understand the background of the apparent initiators and advancers of the merger, we also delved into the migration patterns of older urban speakers (born before 1980). As shown in Figure 4, merging in the urban locality is already evident in the oldest speaker, a female migrant born in the late 1950s who showed a Pillai score below 0.5. Within the earlier cohort of speakers born between the 1950s and 1970, almost all are migrants, and the majority of the migrant speakers had Pillai scores below 0.5. One urban-born speaker in this cohort exhibited a similarly low Pillai score as well. Crucially, all female migrant speakers in this cohort showed Pillai scores below 0.5, whereas the male migrant speakers in this cohort showed Pillai scores above 0.5. In the later cohort of speakers born after 1970, most women and most men with Pillai scores below 0.5 were urban-born. Thus, although the data are limited by the paucity of urban-born speakers in the earlier cohort, these results are consistent with the view that the merger in the urban locality was initiated by migrant women and subsequently adopted and advanced by urban-born speakers.
Scatterplot showing individual Pillai scores for urban speakers born before 1980, by year of birth, migration status, and gender. Each point represents one speaker’s degree of phonetic overlap between allophonic [æ] and phonemic /e/.

Finally, we conducted a statistical analysis of the relationship of individual Pillai scores to the independent variables Age, Gender, and Locality in a GAM. The Age variable was centered (Age_c); hence, zero (represented in the intercept) denotes the mean age. In the GAM, a smooth function was employed to capture the nonlinear relationship between Age and Pillai score (see Figure 2), allowing flexibility to take into account potential curvatures in the data (see Winter, Reference Winter2020:1-326). The reference levels of the categorical predictors Locality and Gender were set to “traditional” and “female,” respectively. Furthermore, an interaction term was included to explore the relationship between the effects of Locality and Gender.
The parametric coefficients of the model, shown in Table 2, revealed that there were significant effects of all predictors. There was a significant, and nonlinear, effect of Age, with an effective degree of freedom (edf) of 6.006. Note that the edf represents the complexity of the smooth, with one corresponding to a straight line, two to a quadratic curve, and so on; thus, the higher the edf, the wigglier the curve in the data (see Chuang et al., Reference Chuang, Fon, Papakyritsis, Baayen and Ball2021). An edf of six therefore suggests that the Age effect has some complex smooths or curves, consistent with Figure 2. There was also a significant effect of Locality: as compared to the predicted Pillai score for traditional females, which was significantly higher than 0 [β = 0.581, p < 0.001], the predicted Pillai score for urban women was significantly lower [β = −0.423, p < 0.001], indicating a weaker distinction between [æ] and /e/. In addition, there was a significant effect of Gender: within the traditional locality, male speakers showed significantly higher Pillai scores than female speakers [β = 0.125, p = 0.008], suggesting that traditional women exhibited more merging than traditional men. Nevertheless, the negative urban effect was enhanced for males as compared to females [β = −0.158, p = 0.013]. This result suggests that the merger in the urban locality was particularly prevalent among males.
Coefficients in a generalized additive model of individual Pillai scores (n = 105; adjusted r 2 = 0.755)
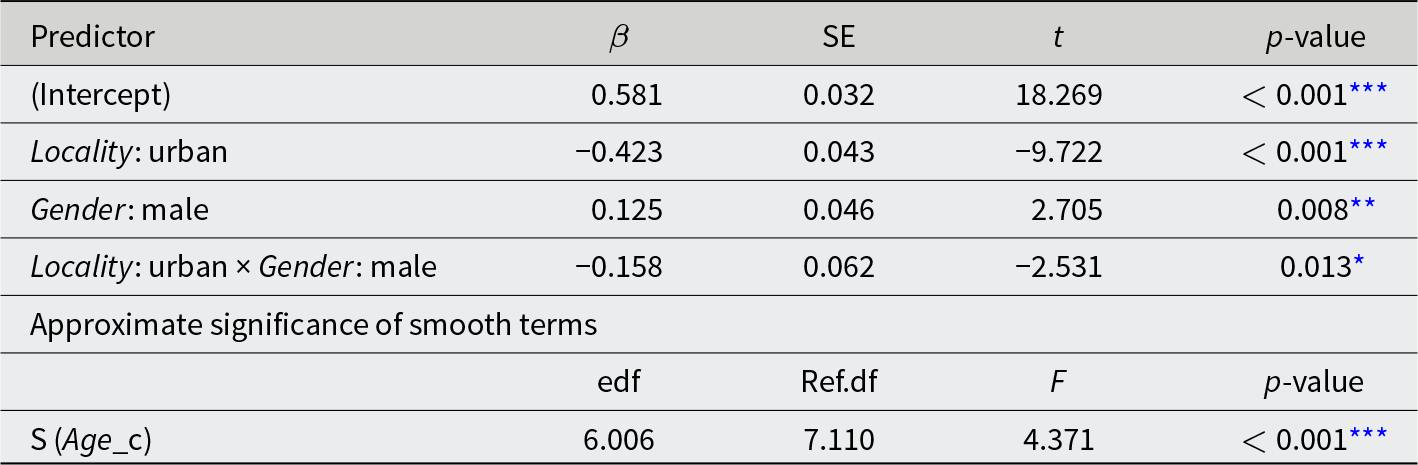
Model formula: PillaiScore ∼ s (Age_c) + Locality * Gender.
Significance codes:
* p < 0.05,
** p < 0.01,
*** p < 0.001.
To summarize, Twi speakers’ age, gender, and locality all help predict the extent of the [æ]–/e/ merger. Locality is arguably the strongest predictor of this sound change: the urban locality shows more participation in the change, whereas the traditional locality shows less participation, with convergence toward innovative variants observed primarily among the youngest speakers. Although the change is happening across all ages, particularly in the urban locality, there are clear age effects, and the youngest generation of speakers is the most advanced. These findings are consistent with previous evidence of younger speakers being at the forefront of linguistic innovation. Gender also plays a role in the change. In the urban locality, males tend to exhibit a higher degree of merger than females, suggesting males’ advancement of the change, while in the traditional locality, it is only a subset of the youngest women who participate in the change.
Discussion
The goal of this study was to investigate the role of social factors—specifically, speaker locality, age, and gender—in the raising and merger of allophonic [æ] with phonemic /e/ in two distinct Twi-speaking communities in Ghana: an urban community, Tema-Accra, and a traditional one, Fumesua and Asotwe. The findings of the study evinced complex interactions among the three social variables in influencing the Twi [æ]–/e/ merger.
First, regarding age effects in each locality, we found, consistent with Yankson (Reference Yankson2018:1-355), that the merger was more advanced among urban speakers than traditional speakers, with all age-groups in the urban locality participating. That said, there was still an age effect in the urban locality indicative of an ongoing sound change: as shown in Figure 2, the merger was less evident in the oldest urban speakers but nearing completion in the youngest generation, whose Pillai scores approached 0. In contrast, among traditional speakers, only a fraction of the youngest speakers approximated the urban change. These findings dovetail with previous research, indicating that younger speakers drive linguistic innovations, while older speakers are more conservative during changes in progress (Labov, Reference Labov2001:101-120; Fridland, Reference Fridland2001; Gordon, Reference Gordon, Murray and Simon2006; Hay et al., Reference Hay, Warren and Drager2006). However, while older urban speakers’ degrees of merger were lower than in younger urban speakers, most of them followed the younger urban speakers in showing evidence of merger, with Pillai scores below 0.5. Their behavior thus suggests that the merger has been occurring for a considerable amount of time. Indeed, the change is evident as early as a cohort of speakers born before 1970, who were mostly migrants to the urban locality. We later return to the role of migration patterns in this change.
Turning to the role of gender, we observed gender effects that were not entirely consistent with the prediction that female speakers in the urban locality would lead the merger. Although the merger was evident in the urban locality generally, urban males, especially younger urban men, were more advanced in the merger than urban females. This finding is at odds with the extensive evidence of female-led changes during linguistic innovations in Western communities (Labov, Reference Labov1990; Reference Labov2001:261-322; Shin, Reference Shin, Carvalho and Beaudrie2013) and some non-Western communities (Noglo, Reference Noglo, Stanford and Preston2009), but in line with findings of male-led changes in non-Western communities (see Bortoni-Ricardo, Reference Bortoni-Ricardo1985:1-265; Rau et al., Reference Rau, Chang, Dong, Stanford and Preston2009). Crucially, this pattern cannot be explained by length of residence in the urban locality. Instead, we interpret men’s advancement of the change as the product of the key differences in social roles between men and women in Ghana discussed in the Introduction section. These differences lead to men’s greater societal engagement, which, in turn, increases men’s chances of being exposed to and interacting with a diversity of Twi speakers in a multilingual community, including L1 speakers participating in [æ]-raising and L2 speakers with varying productions of [æ]. Thus, men may be more advanced in the merger because of more extensive exposure to diverse variants of [æ], especially considering that the urban locality is not a traditionally Twi-speaking community. Future research should endeavor to operationalize and measure different aspects of societal engagement to explore how they may correlate with the merger.
Because our finding of male-led advancement of the [æ]–/e/ merger in the urban locality converges with other evidence of men as linguistic innovators in urban Ghanaian communities, we argue that, far from being a fluke, this pattern may reflect a broader trend of variation and change in the Ghanaian context. For instance, studies on educated users of Ghanaian Pidgin English in urban universities showed that younger men drive innovation in this variety, which is primarily used for out-of-class communication (Dako, Reference Dako2002; Huber, Reference Huber1999:1-256; Rupp, Reference Rupp2013). The pattern of male-led innovations in the Ghanaian context may be related to a social stratification system that is relatively more male-dominated as compared to Western social contexts.
As for the gender effect in the traditional locality, we found that females, especially younger women, were more likely to participate in the merger than males. Most of the traditional speakers that showed evidence of merging were female. Furthermore, the majority of these females had extensive contact with urban speakers, suggesting that replication of the change in the traditional locality may be related to urban social ties. For example, the female speakers in question may have been exposed to merged production more as a result of more frequent interactions with relatives and friends residing in the urban locality, leading to adoption of the urban speech pattern. Such an interpretation converges with previous research on other understudied communities identifying a role for non-local social networks in sound change (Bortoni-Ricardo, Reference Bortoni-Ricardo1985:1-265; Romero, Reference Romero, Stanford and Preston2009). It is also consistent with sociolinguistic theories proposing that individuals with closer ties to innovative speech communities are more prone to adopting linguistic changes (Laitinen et al., Reference Laitinen, Fatemi and Lundberg2020; Milroy & Llamas, Reference Milroy, Llamas, Chambers and Schilling2013; Milroy & Milroy, Reference Milroy and Milroy1985). However, further research is needed to understand how traditional speakers’ urban social network contributes to the initiation and propagation of the merger in the traditional community, as well as whether the female bias we observed in young traditional speakers with extensive urban contact is accidental.
Given that the [æ]–/e/ merger appears to be an urban innovation, traditional female speakers’ participation may be characterized as an incoming change from above. The nature of their social contacts suggests this change originated outside the traditional speech community, and was adopted possibly to signal a connection to or affinity for urban life. According to Labov (Reference Labov1990), changes from above typically originate in socially dominant classes, and society is consciously aware of such changes, perceiving the new linguistic forms as prestigious; consequently, women tend to embrace these new forms more than men. Interestingly, some participants in both localities showed awareness of the merger, as reflected in questionnaire responses and debriefings (e.g., one traditional speaker mentioned hearing urban friends say [kweku] ‘male born on Wednesday’ instead of [kwæku]), laying the groundwork for associating merged production with prestige. Thus, traditional women may attribute a positive social value to the merger, adjusting their speech to sound more urban. This interpretation aligns with patterns observed in Western contexts where women were inclined to adopt prestigious variants, especially when a change came from outside their speech community (Eckert & McConnell-Ginet, Reference Eckert and McConnell-Ginet2003:1-332; Labov, Reference Labov2001:272-273; Kemp & Yaeger-Dror, Reference Kemp, Yaeger-Dror and Eckert1991). The behavior of traditional women therefore suggests that the Ghanaian context is, in some respects, similar to these Western contexts in terms of the dynamics of linguistic innovation. That said, we did not directly examine the perceived prestige or social meaning of the merger, leaving open future research avenues into its social meanings in Twi-speaking communities.
Apart from differences in urban contact in our participant sample, could there be other reasons why traditional females might participate in the merger more than traditional males? For example, could differences between localities in social structure, or differences between genders in sensitivity to linguistic variation (Chambers, Reference Chambers1995:136-137) or schooling, play a role? Disparities in social stratification are unlikely to explain the variation in gender effects, because social stratification across both localities is effectively the same with respect to gender: in each locality, men have greater societal engagement than women. The gender role differentiation observed in the urban locality is not weaker or absent in the traditional locality. A hypothetical male disadvantage in linguistic sensitivity is also an unlikely explanation, since this would put not only traditional males but also urban males in a relatively poor position to participate in the merger. In terms of schooling, none of our traditional participants received their education outside the Ashanti Region; in fact, the majority were enrolled in schools within the area of our traditional research sites, so disparities in school-based contact with urban centers are unlikely. Another potential factor is the role of women in Ghana’s marketplaces—vibrant spaces where women have typically been economically and socially dominant, often forming dense social networks facilitating the circulation of ideas, norms, and linguistic forms (Clark, Reference Clark1994:1-488; O’Neill, Reference O’Neill2016; Wrigley-Asante, Reference Wrigley-Asante2018). Although women now face competition from men in the local market economy (Overå, Reference Overå2007), such local networks support intense local interaction and shared linguistic norms (Milroy & Milroy, Reference Milroy and Milroy1992). Crucially, however, these networks are mainly local, meaning that they could do more for maintaining traditional forms than diffusing urban forms within the traditional locality.
All things considered, we believe a different factor is the most likely additional contributor to the gender effect in the traditional locality: linguistic pride. Previous research has shown that the group of speakers comprising non-mobile, old, rural men are often both resistant to language change and proud of their conservative dialects, which can carry covert or “heritage” prestige (Chambers & Trudgill, Reference Chambers and Trudgill1998:85-86; Kiesling & Wisnosky, Reference Kiesling and Wisnosky2003; Schreier, Reference Schreier and Hickey2013). Such linguistic pride may reflect a broader appreciation of traditional values and ways of life, which is also found among young rural men (Bye, Reference Bye2009). In the Asante Twi community, there is “a steadfast native language loyalty and a strong sense of Ashanti identity” (Nyamekye & Uwen, Reference Nyamekye and Uwen2024:1), reflecting a deep pride associated with the Twi language. At the same time, the expansion of education has significantly impacted traditional Ashanti practices, including related to marriage, resulting in the empowerment of Ashanti women to challenge conventional gender norms and assert greater independence in family decision-making (Owusu, Reference Owusu2024:24). Taken together, these facts suggest that traditional Ashanti men may be more inclined than women to uphold traditional values and, therefore, to take pride in speaking “pure” Twi, enacting the language-as-identity ideology discussed earlier.
Notably, linguistic pride and cultural ideologies would appear to counteract traditional men’s increased exposure to variation. According to a consultant we worked with in the traditional community, traditional men often travel back and forth to big cities (e.g., Accra) to trade. This mobility helps to explain why men were more difficult to recruit than women within the traditional locality, and suggests that traditional men may have regular ambient exposure to urban speech, even if not necessarily regular contact (i.e., interactions) with a diversity of urban speakers. In contrast, while traditional women may also travel to the urban locality, they are much less likely to do so regularly for trade reasons, meaning that they probably spend less time within the urban locality than traditional men. Thus, the amount of time spent in the urban locality probably favors traditional men, yet they still do not participate in the merger to the same degree as traditional women. Although we do not have data on time spent in the urban locality, the patterning of traditional men vs. women in our participant sample is consistent with the view that factors such as a lesser inclination to uphold traditional values and the use of linguistic variants to seek overt prestige, which favor traditional women, may override other factors such as the sheer amount of exposure to urban speech, which probably favors traditional men. We raise this possibility cautiously, however, because ultimately, we did not measure the above variables. Hence, future work should collect more granular data on the social profiles of traditional speakers (e.g., amount of time spent in the urban locality, social evaluation of merged production) to better understand the factors influencing the adoption of the [æ]–/e/ merger in the traditional community.
In closing, we revisit the interactions between age and gender illustrated in Figure 2 and between gender and migration status in Figure 4, in service of addressing the question of who initiates vs. who advances a sound change. Taken together, our findings on the Twi [æ]–/e/ merger suggest that this sound change was initiated by older urban women born between the late 1950s and 1970, primarily migrants to the urban locality. However, the change was adopted and advanced by slightly younger urban men born after 1970, mostly urban-born, likely through language acquisition as they observed the speech patterns of older speakers including their caretakers. This interpretation aligns with the apparent-time hypothesis, which posits that sound systems evolve and stabilize during adolescence (e.g., Labov, Reference Labov1963; Smith & Holmes-Elliott, Reference Smith and Holmes-Elliott2022; Tagliamonte & D’Arcy, Reference Tagliamonte and D’Arcy2009). The change in the urban locality is spreading to the traditional locality, where again female speakers appear to have initiated the change. However, it remains to be seen whether, as in the urban locality, men in the traditional locality will advance, or at least catch up with, the female-initiated change, facilitated by the extensive societal engagement of men in these communities.
Conclusion
Our findings on [æ]-raising and merger in the vowel system of Asante Twi provided support for well-documented effects in language variation and change: the leading role of urban speakers and the leading role of younger speakers. In addition, we demonstrated the variability and context-specificity of gender effects. In our case, female speakers were active in initiating, but male speakers played the leading role in advancing the sound change. Crucially, this gender disparity follows from the nature of the Ghanaian social context, which puts men in a better position to be exposed to linguistic variation than women. Thus, while some aspects of our results mirror patterns found in Western contexts, other aspects are unique to the Ghanaian context, underscoring the value of investigating language variation in non-Western contexts.
Although our discussion pointed out men’s greater societal engagement in the urban Ghanaian community as a contributor to their leading role in advancing the [æ]–/e/ merger, our account of this sound change also referred to several other social variables: urban contact, migration patterns, and language ideologies. Given the limitations of our data in respect to these variables, each merits further research to better understand its role in this change. For example, it would be insightful to examine whether, moving beyond our sample, it is typical for traditional girls and young women to interact with urban speakers more than traditional boys and men do (and, if so, why). A systematic gender bias in urban contact would strengthen the case that young traditional females’ greater degree of merger is due to gendered differences in social network. In addition, it would be useful to know whether the female bias and the migrant bias we observed among the oldest urban residents reflect larger demographic trends for the urban locality. If so, this would help explain why it is female migrants who appear to have initiated the merger in the urban locality, as opposed to urban-born, second-generation speakers. Finally, given that the present data come from highly controlled speech, future research should examine the generalizability of these results to natural speech using methods such as sociolinguistic interviews.
Looking forward, the current findings are thus consistent with Mansfield and Stanford (Reference Mansfield and Stanford2017) and suggest that we may make greater theoretical advances by turning our analytical lens to understudied social contexts in Africa and beyond. For example, given that this study found different gender effects on variation in a non-Western but still-patriarchal speech community, it would be insightful to study gender effects on language variation in societies that are less patriarchal or even matriarchal (Sanday, Reference Sanday2002:1-288; Banerjee, Reference Banerjee2015). Broadening the empirical focus of sociolinguistic studies in this way will not only make the research enterprise more inclusive but also deepen our understanding of how social factors may shape the form and evolution of language.
Supplementary material
The supplementary material for this article can be found at https://doi.org/10.1017/S0954394526100672.
Acknowledgements
We are thankful for funding from NSF (BCS-2214689) and Boston University, research assistance from Linda Otchere, Ebenezer Nketia, Dennis Nsafoah, and Okrah Oppong, logistical assistance from Tema Community 12 SDA Church, First Start Academy School, and the Fumesua and Asotwe Community Leaders, and helpful feedback from Kate Lindsey, Danny Erker, Jon Barnes, two anonymous reviewers, and audience members at ACAL 55, ASA 184, Brown, Georgia Tech, Ohio State, UNT Denton, UT Arlington, and University of Cape Coast.
Author contributions
Kpogo: Writing—review & editing, Writing—original draft, Visualization, Supervision, Project administration, Methodology, Investigation, Funding acquisition, Formal analysis, Data curation, Conceptualization; Chang: Writing—review & editing, Writing—original draft, Visualization, Validation, Supervision, Resources, Project administration, Funding acquisition, Formal analysis, Data curation.
Competing interests
The authors declare none.


 Open access