


Introduction
Chicken (Gallus gallus domesticus) is the most commonly consumed meat globally, and chicken consumption is growing faster than that of any other meat type (Bennett et al., Reference Bennett, Thomas, Williams, Zalasiewicz, Edgeworth, Miller, Coles, Foster, Burton and Marume2018). In recent years, consumer interest in animal welfare has generated minimum welfare standards and banned battery cages in high-income countries, such as the United States, United Kingdom, and Australia (Sossidou et al., Reference Sossidou, DAL BOSCO, Castellini and Grashorn2015; Scrinis et al., Reference Scrinis, Parker and Carey2017). This has also led to the growth of the ‘pasture-raised’ poultry market, defined as operations in which poultry have continuous access to pasture and are moved to fresh pasture regularly (Rothrock Jr et al., Reference Rothrock, Gibson, Micciche and Ricke2019). In addition to the perceived benefits to animal welfare, pastured poultry may also provide ecosystem services to production systems, including weed and insect pest suppression, and increased soil quality stemming from manure deposition (Clark and Gage, Reference Clark and Gage1996; Sossidou et al., Reference Sossidou, Dal Bosco, Elson and Fontes2011; Elkhoraibi et al., Reference Elkhoraibi, Pitesky, Dailey and Niemeier2017). At the same time, poultry raised in these farms gain access to pastured dietary resources, such as grasses and forbs, plant seeds, and insects (Clark and Gage, Reference Clark and Gage1996; Burbaugh et al., Reference Burbaugh, Toro and Gernat2010). This setting is generally perceived as an environment that not only improves bird health but produces eggs and meat of higher quality than those from conventional systems (Ponte et al., Reference Ponte, Rosado, Crespo, Crespo, Mourão, Chaveiro-Soares, Bras, Mendes, Gama and Prates2008b; Karsten et al., Reference Karsten, Patterson, Stout and Crews2010; Skřivan and Englmaierová, Reference Skřivan and Englmaierová2014; Hammershøj and Johansen, Reference Hammershøj and Johansen2016; Englmaierová et al., Reference Englmaierová, Skřivan, Taubner, Skřivanová and Čermák2021).
Chickens are omnivorous. There is some evidence that pastured poultry consumes sufficient pasture resources to have important ecological consequences for pasture plant and arthropod communities. Clark and Gage (Reference Clark and Gage1996) found free-range chickens and geese consumed a variety of insects, including pests, which were found in 75% of dissected digestive crops. Additionally, geese were able to reduce weed cover to less than 10%. In our past research, broilers grown for meat were found to have strong top-down effects on pasture plant biomass and plant-dwelling arthropods, in addition to having strong bottom-up effects on ground-dwelling arthropod communities (Garcia et al., Reference Garcia, Halmos, Thongjued, Dupuis and Gonthier2023). Pastures without broilers had 6 and 10 times more pasture plant biomass than did pastures with low and high broiler density, respectively. Further, pastures without broilers had at least three times more plant-dwelling Coleoptera, Hemiptera, and Hymenoptera relative to pastures with broilers (Garcia et al., Reference Garcia, Halmos, Thongjued, Dupuis and Gonthier2023), suggesting broilers do exert top-down effects on plant and plant-dwelling arthropod communities. However, these findings may not all be due to the direct consumptive effects of broilers on plant and arthropod communities, as broiler trampling of pasture vegetation may have accounted for significant reductions in pasture plant biomass and plant-dwelling arthropod abundance (Garcia et al., Reference Garcia, Halmos, Thongjued, Dupuis and Gonthier2023).
Despite significant access to pasture resources such as plants and insects, poultry growth and productivity in pastured poultry systems are dependent on supplemented feed. Surveys of pastured poultry growers suggest that the high cost of supplemented feed is one of the most important challenges to pastured poultry production (Hilimire, Reference Hilimire2012; Elkhoraibi et al., Reference Elkhoraibi, Pitesky, Dailey and Niemeier2017). While some research finds no differences in growth and feed-use efficiency between pasture-raised and conventional-confined broiler chickens (Sales, Reference Sales2014), others suggest that in a well-managed system, pasture foraging can substitute 5%–20% of a grain-based diet (Mattocks, Reference Mattocks2002; Burbaugh et al., Reference Burbaugh, Toro and Gernat2010), suggesting pastured environments could help offset feed costs. Thus, there is a clear need to understand which plants and insects make up poultry diets in pastured systems and which breeds and management practices can improve their feed-use efficiency.
The vast differences in foraging behavior across poultry breeds help explain some of the challenges in increasing pasture use. On one extreme, Junglefowl (G. gallus; the ancestor to modern-day chicken) are described as generalist omnivores consuming nuts, berries, leaf matter, and invertebrates (Mench, Reference Mench and Jensen2009). Akin to their ancestors, domesticated Junglefowl exhibit contrafreeloading behaviors where individuals preferentially select food that requires effort to obtain, even when identical food items are readily available (Lindqvist et al., Reference Lindqvist, Schütz and Jensen2002, Reference Lindqvist, Zimmerman and Jensen2006; Ferreira et al., Reference Ferreira, Simoni, Germain, Leterrier, Lansade, Collin, Mignon-Grasteau, Le Bihan-Duval, Guettier and Leruste2021). Some modern-domesticated layer-chicken breeds exhibit these behaviors and are often considered ideal breeds for pasture production (Lindqvist et al., Reference Lindqvist, Schütz and Jensen2002, Reference Lindqvist, Zimmerman and Jensen2006; Baxter, Reference Baxter2018; Ferreira et al., Reference Ferreira, Simoni, Germain, Leterrier, Lansade, Collin, Mignon-Grasteau, Le Bihan-Duval, Guettier and Leruste2021). On the other extreme, broiler breeds appear to adhere to optimal foraging theory, in which they maximize intake and minimize energy expenditures (Osborne, Reference Osborne1977) by concentrating effort on supplemented grain-based feed. For this reason, it is often hypothesized that broilers do not utilize many of the pasture resources available to them.
Nonetheless, there may be several management strategies that may increase pasture use by poultry, including broilers. For one, reducing the stocking density of poultry per area of pasture should theoretically increase the quantity of pasture plant and arthropod dietary resources available to each bird. Mild or short-term feed restrictions may also improve pasture use by forcing broilers to seek food items in pastures during the period of restriction. In pasture-raised broilers, Ponte et al. (Reference Ponte, Prates, Crespo, Crespo, Mourão, Alves, Bessa, Chaveiro-Soares, Gama and Ferreira2008a) found that restricting the intake of a cereal-based feed (25%–50%) throughout the finishing period (36 days) led to increased consumption of leguminous pasture plants and thus significantly affected bird weight gain, feed conversion, and meat quality traits (Ponte et al., Reference Ponte, Prates, Crespo, Crespo, Mourão, Alves, Bessa, Chaveiro-Soares, Gama and Ferreira2008a, Reference Ponte, Rosado, Crespo, Crespo, Mourão, Chaveiro-Soares, Bras, Mendes, Gama and Prates2008b). Likewise, Englmaierová et al. (Reference Englmaierová, Skřivan, Taubner, Skřivanová and Čermák2021) found that a cereal diet restriction of 20% in pasture-raised broilers led to significant increases in nutritional value metrics compared to broilers raised in conventional systems (Englmaierová et al., Reference Englmaierová, Skřivan, Taubner, Skřivanová and Čermák2021). Additionally, for some fast-growing broiler breeds, the slowing of growth through mild or short-term feed restriction can reduce leg disorders and mortality due to metabolic diseases (Yu and Robinson, Reference Yu and Robinson1992; Khurshid et al., Reference Khurshid, Khan, Banday, Ganai, Khan, Choudhary, Adil, Manzoor, Afzal and Untoo2019; Bordin et al., Reference Bordin, Pilotto, Pesenatto, de Mendonça, Daroit, Rodrigues, Dos Santos and Dickel2021).
One of the challenges of measuring pasture use by poultry is the difficulty in quantifying which plant and animal species are consumed by poultry. Metabarcoding, a DNA-based method for identifying multiple species in a sample, has revitalized research into animal diets (Leray et al., Reference Leray, Yang, Meyer, Mills, Agudelo, Ranwez, Boehm and Machida2013; Moorhouse-Gann et al., Reference Moorhouse-Gann, Dunn, De Vere, Goder, Cole, Hipperson and Symondson2018; Paprocki et al., Reference Paprocki, Blair, Conway, Adams, Nerkowski, Kidd and Waits2024). It involves massively parallel sequencing of short DNA fragments from a mixed sample, such as feces, stomach contents, or regurgitates. By comparing these sequences to a reference database, the specific species present in the sample could be accurately identified. This is especially useful for studying organisms whose prey is hard to identify from remains like stomach contents or scat. Metabarcoding’s ability to promisingly identify species has provided new insights into dietary habits in many avian systems (Valentini et al., Reference Valentini, Miquel, Nawaz, Bellemain, Coissac, Pompanon, Gielly, Cruaud, Nascetti and Wincker2009; Ando et al., Reference Ando, Setsuko, Horikoshi, Suzuki, Umehara, Inoue-Murayama and Isagi2013; Crisol-Martínez et al., Reference Crisol-Martínez, Moreno-Moyano, Wormington, Brown and Stanley2016; Cabodevilla et al., Reference Cabodevilla, Mougeot, Bota, Mañosa, Cuscó, Martínez-García, Arroyo and Madeira2021, Reference Cabodevilla, Ortiz-Santaliestra, Fernández-Tizón, Zurdo, Madeira, Giralt, Sardà-Palomera, Fernández-Benéitez and Mougeot2024; Snider et al., Reference Snider, Bonisoli-Alquati, Pérez-Umphrey, Stouffer and Taylor2022; Höhn et al., Reference Höhn, Masello, Kümmel, Griep, Goesmann and Quillfeldt2024; Paprocki et al., Reference Paprocki, Blair, Conway, Adams, Nerkowski, Kidd and Waits2024), including poultry systems (Thongjued et al., Reference Thongjued, Garcia, Scott, Gonthier and Dupuis2024), and provides high resolution for diverse diets compared to traditional morphological or molecular cloning approaches (Ando et al., Reference Ando, Setsuko, Horikoshi, Suzuki, Umehara, Inoue-Murayama and Isagi2013; Gong et al., Reference Gong, Ning, Han, Zhao, Tian, Li, Xiao and Liu2019). Notably, metabarcoding studies focusing on omnivorous birds have been relatively rare, making this approach valuable for understanding the complex dietary patterns of these species (Spence et al., Reference Spence, Wilson Rankin and Tingley2022; Thongjued et al., Reference Thongjued, Garcia, Scott, Gonthier and Dupuis2024).
In this study, we employed DNA metabarcoding-based diet analysis to investigate the dietary habits of pasture-raised broilers in an organic system over a 3-year period. Our research had two primary objectives. First, we aimed to document the full spectrum of diet items consumed by pastured broilers, providing a comprehensive understanding of how these birds utilize available pasture resources. This exploratory approach offers valuable insights into the foraging behavior of broilers in pasture-based systems. Second, we examined the effects of various poultry management strategies—including stocking density, breed selection, sex, and feed restriction—on the diversity of pasture plants and arthropods in the broilers’ diet. This aspect of our study was driven by the hypothesis that certain management techniques could increase dietary diversity, potentially leading to improved feeding efficiency and overall bird performance. By investigating these relationships, we sought to identify management practices that could optimize both pasture utilization, broiler productivity, feed use efficiency in small-scale, organic, pasture-raised systems.
Materials and methods
Animal welfare
The research was approved and conducted under the permission of Institutional Animal Care and Use Committee (IACUC): protocol number 2020-3446. This study utilized pasture-raised broilers under practices adherent to organic standards for three consecutive years (2020–2022). All birds were raised on pasture in the fall growing season of each year. This project was part of a larger poultry–crop integration study that followed a spring vegetable, summer cover crop, fall pastured poultry rotational system (Garcia et al., Reference Garcia, Halmos, Thongjued, Dupuis and Gonthier2023). See Table 1 for a summary of the rotation details.
Summary of vegetable-cover crop-poultry rotation scheme
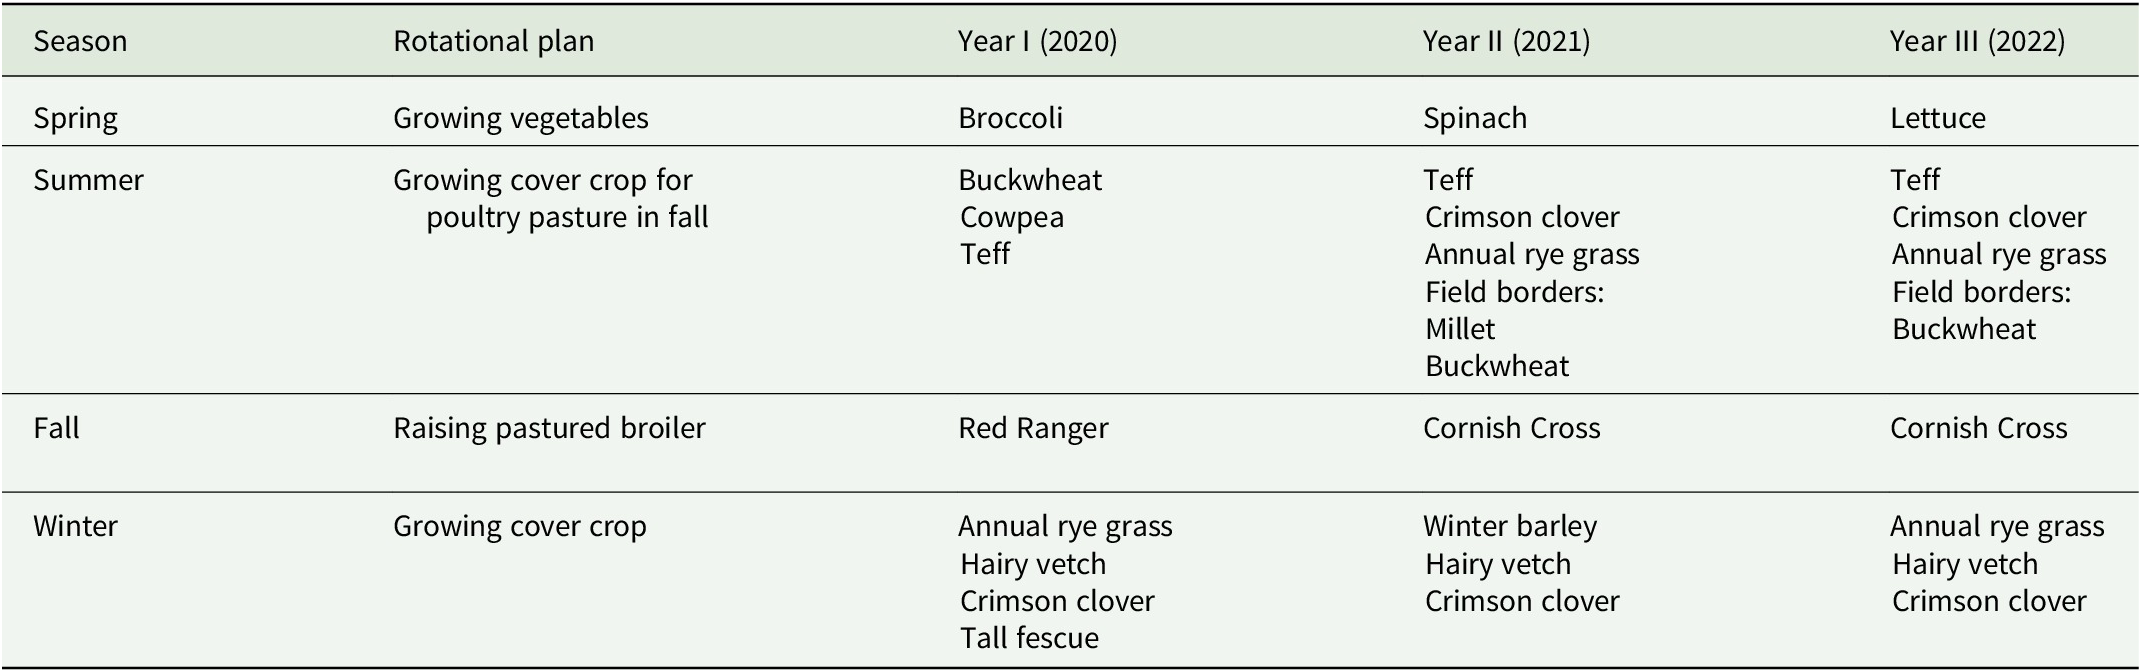
Note: Spring corresponds to mid-March–May, summer corresponds to June–July, fall corresponds to August–October, and winter corresponds to November–February.
Brooding care
Day-old chicks were ordered from commercial hatcheries. In total, 400 birds were used across the experiment including 120 Red Freedom Ranger breed birds that were used in 2020 (Mt. Healthy Hatcheries, Cincinnati, OH) and 160 and 120 Cornish Cross breed birds (hybrid between Cornish and White Rock breeds) that were used in 2021 and 2022 (Murray McMurray Hatchery, Webster City, IA), respectively. Upon arrival to the farm, the chicks were given water to drink and were immediately placed in brooders (CQB20 Chick and Quail Brooder Brower®) in 2020 and 2021, and oval galvanized-steel stock tanks (0.91 m × 0.61 m × 2.43 m (3 ft × 2 ft × 8 ft), 1135.62 liters (300 gallons, CountyLine) in 2022. The brooder room was equipped with portable air conditioning and heat lamps. Brooder temperatures were controlled to approximately 35 °C (95 °F) during the first week of brooding, and temperatures were reduced by 5 °F or more each week depending on the growth rate of chickens, which varied by breed. Chicks were fed with an organic broiler starter 23% (KOFFI 211, Kentucky Organic Farm and Feed, Inc.) for the first 3 weeks of life and then switched to an organic broiler grower 20% feed for the rest of the experiment (KOFFI 210, Kentucky Organic Farm and Feed, Inc.). The starter and grower feed was composed of corn, soybean, oat, and alfalfa pellets.
Experimental setup
Chicks were brooded until they were covered with adequate feathers to tolerate outdoor temperatures (at 3–4 weeks of age.) and were then moved to the pasture. On pasture, the birds were housed in floorless movable pens (‘chicken tractors’ hereafter) as shown in Supplementary Fig. S3, constructed in accordance with Skelton et al. (Reference Skelton, Jacob and Pescatore2012). These floorless chicken tractors allowed the birds access to vegetation and insects that were present in the environment. The chicken tractors were made from a looped cattle panel that created a dome-like structure on a 2.43 m × 2.43 m (8 ft × 8 ft) frame. Each tractor was equipped with a door to allow caretakers to do regular checks. Tarps were used to cover each tractor to provide chickens with protection from precipitation and aerial predators, and tarps were manipulated to provide adequate ventilation based on weather conditions. Each tractor was affixed with motion sensor lights to ward off nocturnal predators. Two perimeters of electric fencing were set up to protect chickens from ground predators.
In this study, ~9.75 m × 9.75 m (32 ft × 32 ft) pastures were assigned to two stocking-density treatments using randomized block design. Stocking density was defined by the area of pasture per individual broiler with high density pastures hosting 20 broilers (22 birds in 2021) with ~4.75 m2 (51.2 ft2) of pasture per broiler. Low density pastures hosting 10 broilers with 9.51 m2 (102.4 ft2) of pasture per broiler. A third treatment (vegetation only) was assigned as a nonchicken control. Each of these three treatments was randomly assigned within four blocks. See Supplementary Fig. S2 for experimental design.
We were able to compare different broiler breeds and sexes across years, though cover crop composition differed between years (Table 1). In 2020, we were only able to obtain straight-run Red Rangers (anticipating a 50:50 male-to-female ratio) due to limited supply during the COVID-19 pandemic. The sex of the birds was determined at 4 weeks by examining their sexual characteristics, such as comb development and overall size. Subsequently, individuals of both sexes were selected in equal numbers and leg banded to serve as experimental subjects. In 2021 and 2022, we ordered only male Cornish Cross birds anticipating a 90:10 male-to-female ratio (the hatchery guarantees only 90% accuracy). Despite the anticipated sex ratio of Cornish Cross birds, sexual size dimorphism became evident at the age of 3 weeks. Consequently, both relatively smaller birds and those of optimal size were allocated to each tractor and leg banded. Chromo Helicase DNA-binding gene amplification was later employed to verify the sex of the birds. Utilizing this technique, 47.36%, 66.67%, and 56.25% of the experimental birds were identified as male in Years 2020, 2021, and 2022, respectively.
The tractors were moved throughout the pasture approximately every other day during the first 2 weeks and every day after that. In 2020, the Red Ranger broilers were maintained on pasture for 9 weeks and were harvested at 12 weeks of age. The Cornish Cross birds were harvested at around 8 weeks of age in 2021 and 6 weeks of age in 2022 (approximately spent 5 and 3 weeks on pasture, respectively). See Supplementary Fig. S4 for tractor moving plan used in this study. To assess pasture use and broiler growth, we collected excreta (see the Section ‘Excreta sample collection’) samples from all banded birds on a weekly basis. We also weighed all birds per flock and measured the amount of supplemental feed consumed to estimate the feed conversion ratio (FCR) of each flock. As this research was part of a larger integrated vegetable-cover crop-poultry rotation study, each year the pastures was rotated with spring vegetables and summer cover crop establishment (Table 1). Each fall the summer cover crop was utilized as a pasture for poultry, before being rotated back to spring vegetables the following year (Table 1).
Feed restriction experiment
To assess the impact of a short-term feed restriction on broiler diet diversity, we initiated an experiment in 2022. Due to issues with metabolic disease in the Cornish Cross raised in 2021, a short-term feed restriction was initiated across all of the high- and low-density Cornish Cross pastured flocks in 2022. All feeders were raised out of reach of flocks for 4 h (between 12 and 4 pm) but allowed broilers access to supplemental feed for 20 h per day. On the 13th, 17th, and 19th of September 2022, half of the experimental flocks were given full access to supplemental feed for 24 h while the remaining half of the flocks were maintained with the short-term feed restriction. On the 14th, 18th, and 20th of September 2022, the feed access and restriction treatments were reversed such that flocks given full 24-h access were given a short-term feed restriction and vis-a-versa. Pasture use diet diversity was assessed via excreta sampling on these experimental days to assess the impact of a short-term feed restriction.
Excreta sample collection
Chicken excreta samples were collected from experimental birds every week starting in their first week on pasture. To collect excreta samples, individual birds were placed in an 18 gallon-tupperware tub (68.14 liters) lined with clean plastic-coated butcher paper. To allow for proper ventilation while chickens were in the tub, we drilled several holes in the tub and its lid. Sampling occurred generally in the first half of the day with a minimum of 1–2 h of light (and feeding behavior) before sampling commenced. Each bird was placed in the tub and then surveilled for defecation for up to 30 min (surveilled time varied depending on ambient temperature and bird behavior, as described in the IACUC protocol). If the bird had not defecated within 30 min, it was placed back in a tractor. Freshly defecated excreta were immediately collected using sterile, disposable polypropylene spatulas. For each excreta sample, we documented the bird’s band number, the tractor’s current location within the plot, and the collecting date. Samples were stored in plastic bags on ice and transferred to a −20 °C freezer for long-term storage until DNA extraction.
DNA extraction
Before conducting DNA extraction, each excreta sample (excluding urate and liquid portions of the excreta) was homogenized to ensure sample community uniformity. We homogenized samples in 50 mL sterile tubes with 5 mL of TE buffer and three 3.5 mm diameter glass beads (BioSpec, Cat. No. 11079135) for 3 min at maximum speed (Mini-BeadBeater-96 Homogenizer, Cole-Parmer). From the homogenized excreta (paste-like consistency), we measured 200–220 mg as input for QIAamp PowerFecal Pro DNA Kits (QIAGEN) and followed the manufacturer’s instructions. The only adaptation was that we used a bead-beating machine for 10 min at maximum speed (Mini-BeadBeater-96 Homogenizer, Cole-Parmer) for cell lysis instead of a vortex adapter. DNA was quantified using a Thermo Scientific™ NanoDrop™ One C Spectrophotometer and stored at −20 °C. DNA quality and quantity measurements can be found in Supplementary Table S1. In addition, positive controls for successful amplification of Internal Transcribed Spacer (ITS2) and Cytochrome c oxidase subunit I (COI) were included in every batch of PCR amplification. DNA of positive control samples were extracted from fresh store-bought broccoli (Brassicaceae: Brassica oleracea) and flash-frozen mourning cloak butterfly (Lepidoptera: Nymphalidae: Nymphalis antiopa) using QIAGEN DNeasy Blood and Tissue kits and QIAGEN DNeasy Plant Pro kits, respectively.
DNA amplification and library preparation
Illumina libraries were constructed using a two-step PCR approach. In the first step, PCRs used locus-specific primers (COI for arthropods and ITS2 for plants, following recommendations of Thongjued et al. (Reference Thongjued, Garcia, Scott, Gonthier and Dupuis2024)) containing overhanging Illumina adapter sequences, and in the second step, individual-specific i5 and i7 Illumina indices were used in a step-out PCR (see Supplementary Table S2 for primer details). PCRs were prepared in 25 μL reactions containing 2 μL (10–100 ng/μL) of DNA template, 0.5 unit of KAPA HiFi DNA polymerase (Kapa Biosystems), 0.5 μL of 10 mM dNTPs, 5 μL of 5X KAPA HiFi Buffer, 1.25 μL of 10 μM each forward and reverse primer, and 14.9 μL PCR grade water. PCR cycling used initial denaturation at 95 °C for 3 min, followed by 35 cycles of 95 °C for 30 s, 53 °C for 30 s, and 72 °C for 30 s, and a final extension of 72 °C for 10 min. For all PCR reactions, positive and negative controls (B. oleraceae/N. antiopa and DNA-free water, respectively) were included to verify amplification success and test for DNA contamination, respectively. PCR products were visualized on a 1.5% agarose gel. Twenty microliters of successfully amplified products were purified using Sera-Mag™ Magnetic SpeedBeads™ (GE Healthcare Life Sciences) (Rohland and Reich, Reference Rohland and Reich2012), cleaned libraries were quantified using a Qubit dsDNA BR Assay Kits with Qubit4 Fluorometer (Invitrogen, USA), and equal-molar pooling of libraries followed the guide for Illumina 16S Metagenomic Sequencing Library Preparation for the Illumina MiSeq system. Paired-end 300 bp sequencing was conducted on the final pooled library using Illumina MiSeq V3 chemistry at the OncoGenomics Shared Resource Facility of the University of Kentucky Markey Cancer Center.
Molecular sex determination
The sex of birds was initially speculated based on morphology but was not always accurate. Since chicken cells were defecated and coextracted from excreta samples, we then used the extracted excreta DNA as templates to confirm bird sex with Chromo Helicase DNA-binding gene (CHD) following Vucicevic et al. (Reference Vucicevic, Stevanov-Pavlovic, Stevanovic, Bosnjak, Gajic, Aleksic and Stanimirovic2013). Amplification was carried out in 20 μL reactions containing 10 μL of Phire Hot Start II PCR Master Mix (Thermo Scientific), 1 μL of each 10 μM primer from 2550F/2718R primer set, 2 μL DNA template, and 6 μL of PCR water. The thermal protocol was modified from that of Vucicevic et al. (Reference Vucicevic, Stevanov-Pavlovic, Stevanovic, Bosnjak, Gajic, Aleksic and Stanimirovic2013). PCR cycling was initiated at 98 °C for 30 s, followed by 35 cycles of denaturation at 98 °C for 5 s, annealing at 55 °C for 15 s, extension at 72 °C for 15 s, and a final extension step at 72 °C for 60 s (Vucicevic et al., Reference Vucicevic, Stevanov-Pavlovic, Stevanovic, Bosnjak, Gajic, Aleksic and Stanimirovic2013). The PCR product was then visualized on a 2.5% agarose gel. Reactions with unsuccessful amplification were repeated with 0.5 μL of PCR product as a DNA template.
Metabarcoding data processing
Sequence data analysis was performed in QIIME 2 version 2022.11 (Bolyen et al., Reference Bolyen, Rideout, Dillon, Bokulich, Abnet, Al-Ghalith, Alexander, Alm, Arumugam and Asnicar2019), and default parameters were used unless otherwise noted. Phred quality scores greater than 20 (indicating at least 99% base-call accuracy) were required during demultiplexing. Raw sequences were quality filtered using the q2-demux plugin followed by denoising, chimeric sequence removing, singleton removing, denoised paired-end read joining, and sequences dereplicating with DADA2 (Callahan et al., Reference Callahan, McMurdie, Rosen, Han, Johnson and Holmes2016). Amplicon sequence variants (ASVs) were inferred using DADA2, which resolves sequences at single-nucleotide resolution. Taxonomic assignments were performed against custom databases which were developed by Thongjued et al Reference Thongjued, Garcia, Scott, Gonthier and Dupuis2024, using the q2 feature-classifier plugin (Bokulich et al., Reference Bokulich, Kaehler, Rideout, Dillon, Bolyen, Knight, Huttley and Gregory Caporaso2018).
The accuracy of species identification was manually verified with BLAST 2.15.0. Species determinations were made when a query sequence had ≥98% similarity to a record in the National Center for Biotechnology Information (NCBI nucleotide database). Query sequences matching at <98% were assigned to higher taxonomic levels (i.e., genus, family, order). In rare circumstances where a sequence matched multiple species, these sequences were cross-referenced with the Barcode of Life Database (BOLD) for secondary verification. This additional step involved checking biogeographical data and examining recorded photographs to ensure accuracy. To clean the dataset, ASVs that could not be identified to at least family level or ASVs with less than a minimum count fraction of 0.01% were removed from the taxonomic table to avoid possible sequence data contamination (as in Crisol-Martínez et al. Reference Crisol-Martínez, Moreno-Moyano, Wormington, Brown and Stanley2016). Cleaned data sets were then used to assess diet richness for each locus and overall. The frequency of occurrence (FOO) for each diet species was calculated as a percentage using the number of samples that detected a given species divided by the total number of samples tested. For example, if a given species was detected in 10 samples of 100 samples total, then that species would have an FOO of 10%.
Statistical analysis
Statistical analyses were conducted using R Studio version 4.3.0 (R Core Team 2022). The package ‘lme4’ and ‘glmmTMB’ were used for linear mixed-effects models (LMMs) and binomial models, respectively. For LMMs, we applied a square root transformation to dependent variables when necessary to meet assumptions of a Gaussian distribution when model residuals were not normal as tested by the Shapiro–Wilk test. We conducted four main modeling analyses to test relationships between management strategies and pastured-poultry diet. First, we used an LMM to assess the impacts of stocking density, sex, weight gain, breed, and the interaction between weight gain and breed on diet richness across all 3 years. We utilized generalized linear mixed effects models (GLMMs) with a binomial distribution to assess the effect of stocking density, weight gain, and sex on the FOO of the four most common pasture plant and weed species (pigweed [Amaranthus spp.], ragweed [Ambrosia spp.], goosefoot [Chenopodium album], and gallant soldier [Galinsoga parviflora]). Each model included a unique band number of each broiler, block, and year as random effects.
To assess the effect of short-term feed restriction on diet richness, we subset the dataset to only include year 3 (2022) because this year was the only year that contained a short-term feed restriction. We used LMM to assess the effect of short-term feed restriction treatments and included stocking density, sex, and weight gain as additional factors in the model. Additionally, we assessed the impact of the short-term feed restriction on the FOO of the four most common plant species using GLMM with a binomial distribution. For these feed-restriction models, we used the unique band number of each broiler and block as random effects.
To assess the impact of stocking density and year on the FCR (ratio of supplemented feed consumed to weight gained), we estimated the total amount of feed consumed for each flock (each tractor) and the total weight gained for each flock for all treatments in all years. We then used LMM with stocking density and year as fixed effects in the model and block as a random effect.
We used nonmetric multidimensional scaling (NMDS) to visualize the differences in combined arthropod and plant diet community composition between the treatments (high versus low stocking density, male versus female, Cornish Cross versus Red Ranger, feed restricted versus nonfeed restricted). To accomplish this, we used a presence/absence matrix of plant and arthropod diet items for each sample and created a Jaccard-based distance matrix using ‘vegdist’ from the ‘vegan’ package. This distance matrix was then used by the function ‘metaMDS’ from package ‘vegan’ (Oksanen et al., Reference Oksanen, Blanchet, Kindt, Legendre, Minchin, O’hara, Simpson, Solymos, Stevens and Wagner2013) with a parameter of ‘k’, which specifies the number of dimensions for the ordination space, set at 2. The metaMDS function reported a stress value around 0.2 which was considered acceptable for the goodness of fit for the ordination for visualization purposes. In order to test for multivariate homogeneity of group dispersion, we used the permutation-based function ‘betadisper’ from the package ‘vegan’, followed by an ANOVA on the output to interpret the significance of the F statistic, in which the null hypothesis states that there is no difference in dispersion between groups. The ‘adonis2’ function from the ‘vegan’ package was used to perform permutational multivariate analysis of variance (PERMANOVA) to determine whether diet community composition significantly differed across treatments. We set the number of permutations to 9999 for each PERMANOVA.
Results
Sequence descriptive statistics
A total of 258 excreta samples were successfully amplified and created 522 sequencing libraries for ITS2, COI, and positive/negative controls, which were sequenced on a single MiSeq lane. The final library generated 17,232,532 raw read pairs and after quality control filtering, a total of 2,489,885 clean read pairs were retained. The majority loss of the filtered reads at this stage was due to chimeric sequences, a well-known phenomenon in metabarcoding libraries (Bjørnsgaard Aas et al., Reference Bjørnsgaard Aas, Davey and Kauserud2017). The number of filtered sequences from each quality control step is shown in Supplementary Table S3, and cleaned sequences were clustered into 3,051 ASVs for ITS2, and 2,796 for COI. QIIME outputs for both loci are provided in Supplementary Tables S4 and S5.
After strict filtering criteria, the data from 222 excreta samples across 3 years were included in the final dataset for statistical analysis. Overall, we detected plants, arthropods, and fungi, and ASVs were taxonomically assigned to 12 orders and 16 families of plants, and seven orders and 16 families of arthropods (full taxonomy classification provided in Supplementary Table S6). Fungi were ignored for downstream analyses.
Diet richness
For plant diet composition at the family level, Asteraceae was the most abundant family found in 163 out of 222 analyzed excreta samples (73.42%). Other commonly detected families were Amaranthaceae (66.67%), Poaceae (48.65%), and Chenopodiaceae (42.34%) (Fig. 1A). The most common species found in chicken diet were pigweed (Amaranthus spp.; Amaranthaceae), ragweed (Ambrosia trifida; Asteraceae), flax (Linum sp.; Linaceae), gallant soldier (G. parviflora; Asteraceae), and white goosefoot (C. album; Chenopodiaceae) (Supplementary Table S6).
Frequency of occurrence of plant (A) and insect (B) families found in pasture-raised chicken excreta. Sample sizes reflect the number of excreta samples where we detected each family.

For insect diet composition, the most abundant sequences belonged to the family Cecidomyiidae (Diptera; Fig. 1B), Pyroglyphidae (Sarcoptiformes), and Suidasiidae (Sarcoptiformes). For Cecidomyiidae, species identification was unsuccessful for these ASVs given the paucity of sequence records for the family. See Supplementary Table S6 for species identification of other families.
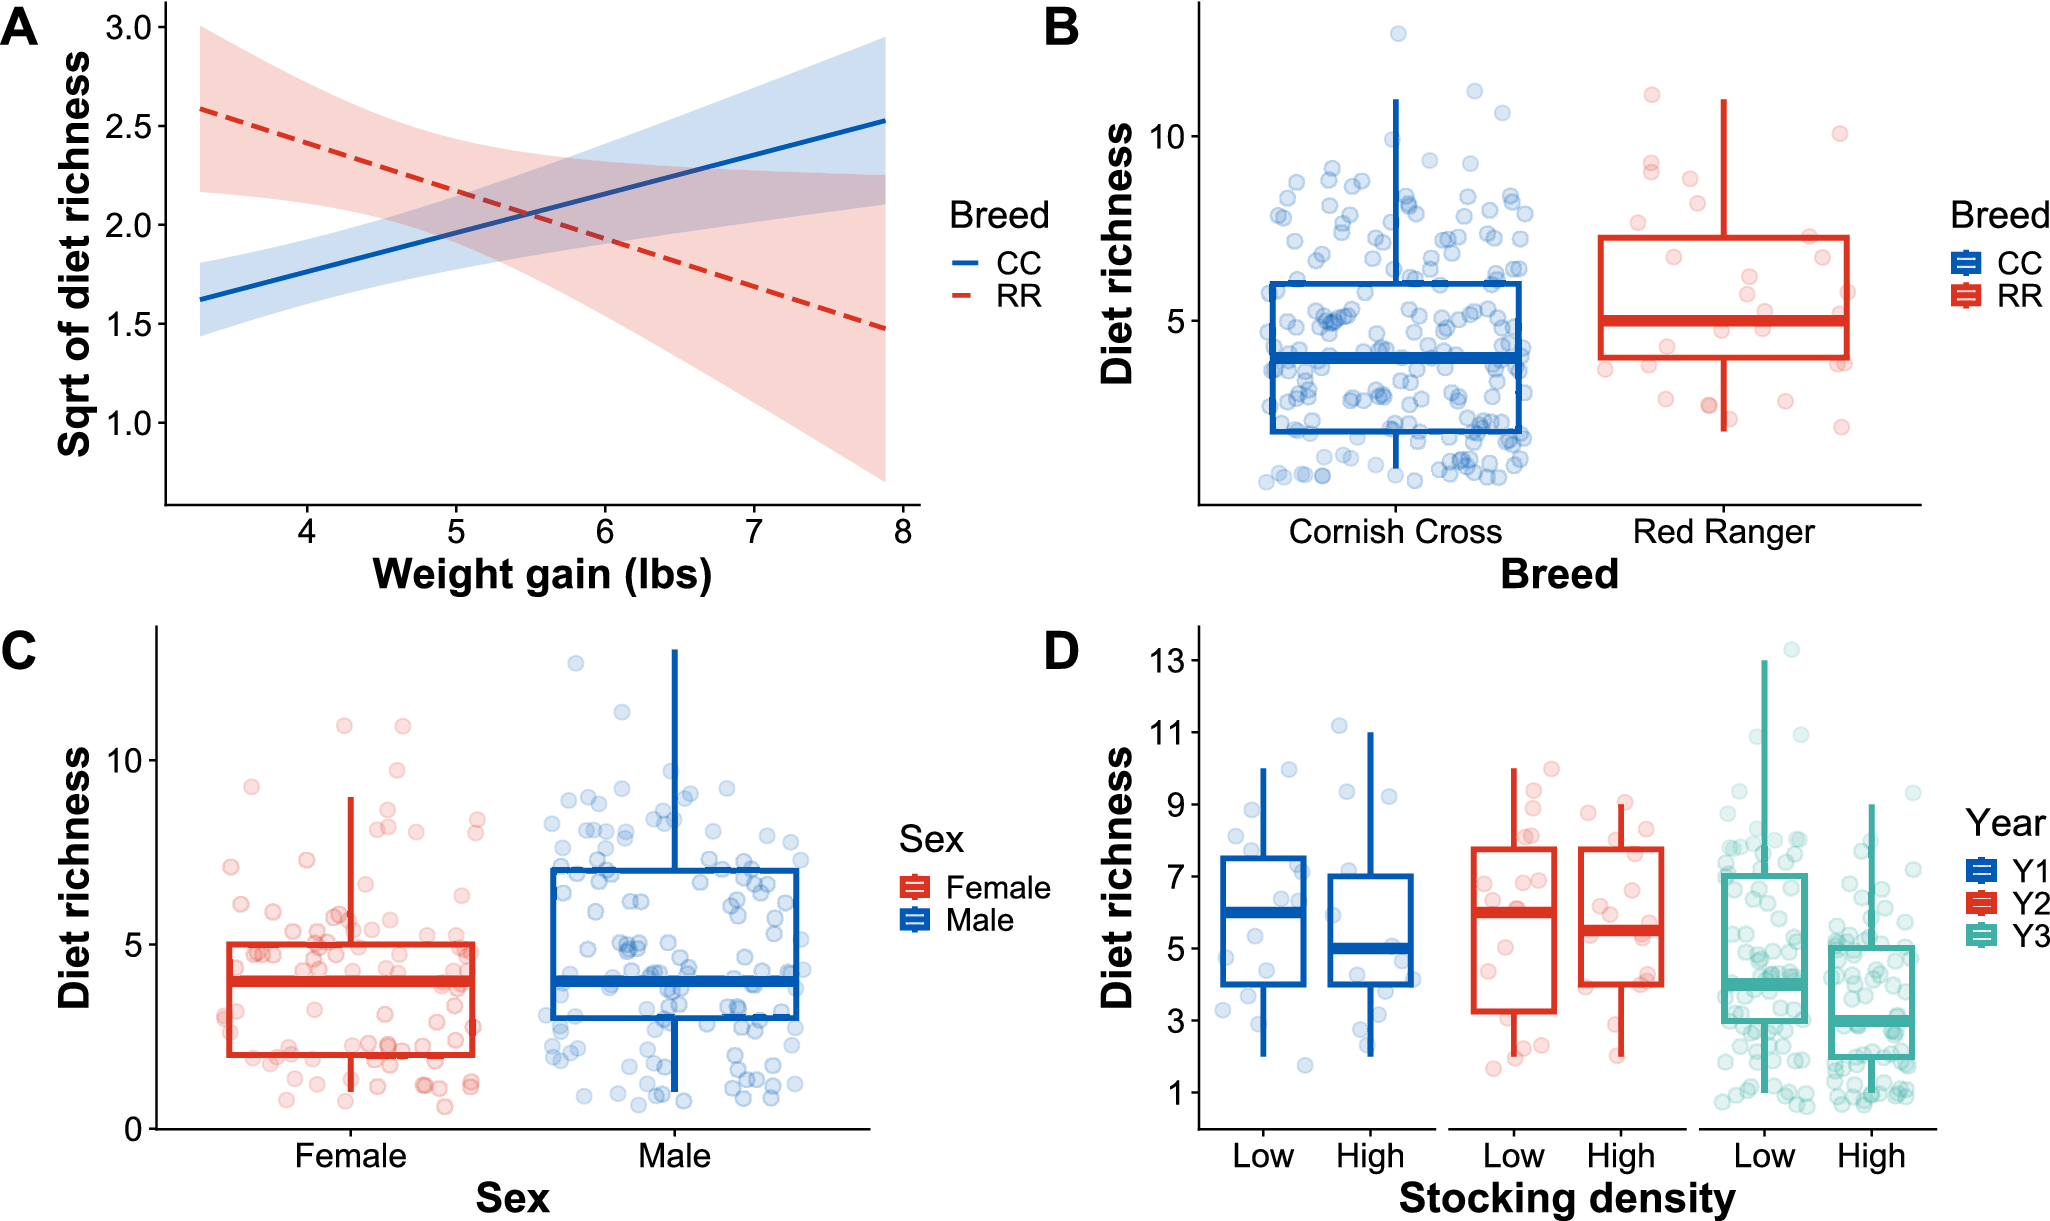
Influence of management strategies on diet richness and chicken performance (3-year analyses)
The LMM revealed significant effects of weight gain, stocking density, and breed on diet richness (Table 2). Across all years, birds in the low-density treatment had higher diet diversity than birds in the high-density treatment (Fig. 2D). Red Ranger birds, in 2020, tended to have a higher diet richness than Cornish Cross birds in 2021 and 2022 (Fig. 2B). There was a significant interaction between weight gain and breed, where diet richness increased with weight gain for Red Rangers but decreased with weight gain for Cornish cross (Fig. 2A; Table 2). Bird sex did not impact diet richness (Fig. 2C; Table 2).
Summary statistics of the linear mixed effects model
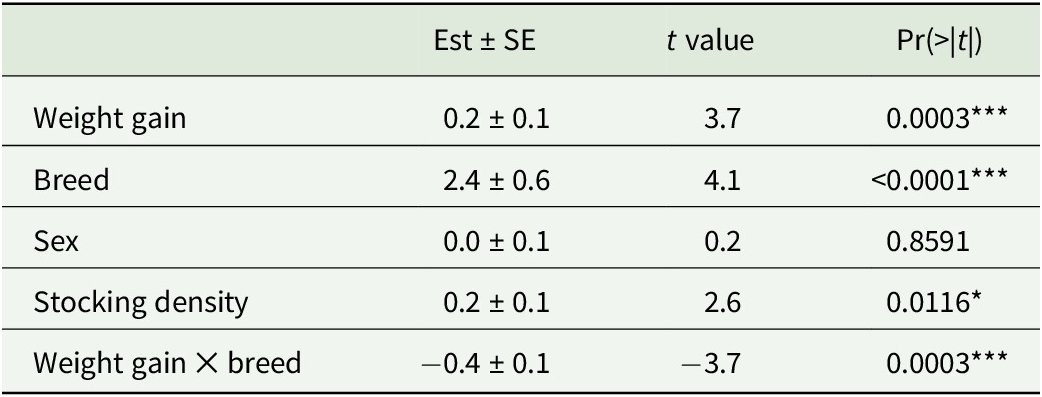
Note: Chicken weight gain and farm management factors (including chicken breed, sex, and stocking density) were treated as explanatory variables while diet richness was the response variable in the model. Individual bird identifiers, block, and sample collecting dates were included as random effects. *p < 0.05; **p < 0.01; ***p < 0.001.
The visualization of linear mixed effects model result. (A) The interaction plot shows the relationship between diet richness (y-axis), chicken weight gain (x-axis), and breed. CC: Cornish Cross breed (solid blue line), RR: Red Ranger breed (dashed red line). (B) Diet richness (y-axis) versus breeds (x-axis). (C) Diet richness (y-axis) versus sex (x-axis) and (D) diet richness (y-axis) versus stocking density (low versus high) across three years of experiments.
Influence of management on the FOO of individual diet items
For the four most common plant species (pigweed, ragweed, goosefoot, and gallant soldier; 85.1%, 64.4%, 40.1%, and 37.4% FOO consumption, respectively), binomial models revealed varying effects of weight gain, stocking density, and sex (Table 3). For pigweed, the birds in low-density treatment had higher FOOs relative to birds in the high-density treatment. For ragweed, birds with lower weight gain rates had higher FOOs than birds with higher weight gain rates. However, for goosefoot, birds with higher weight gain rates had higher FOOs than birds with lower weight gain rates. For gallant soldier, no variable significantly explained variation in FOO.
Summary statistics from binomial model analysis
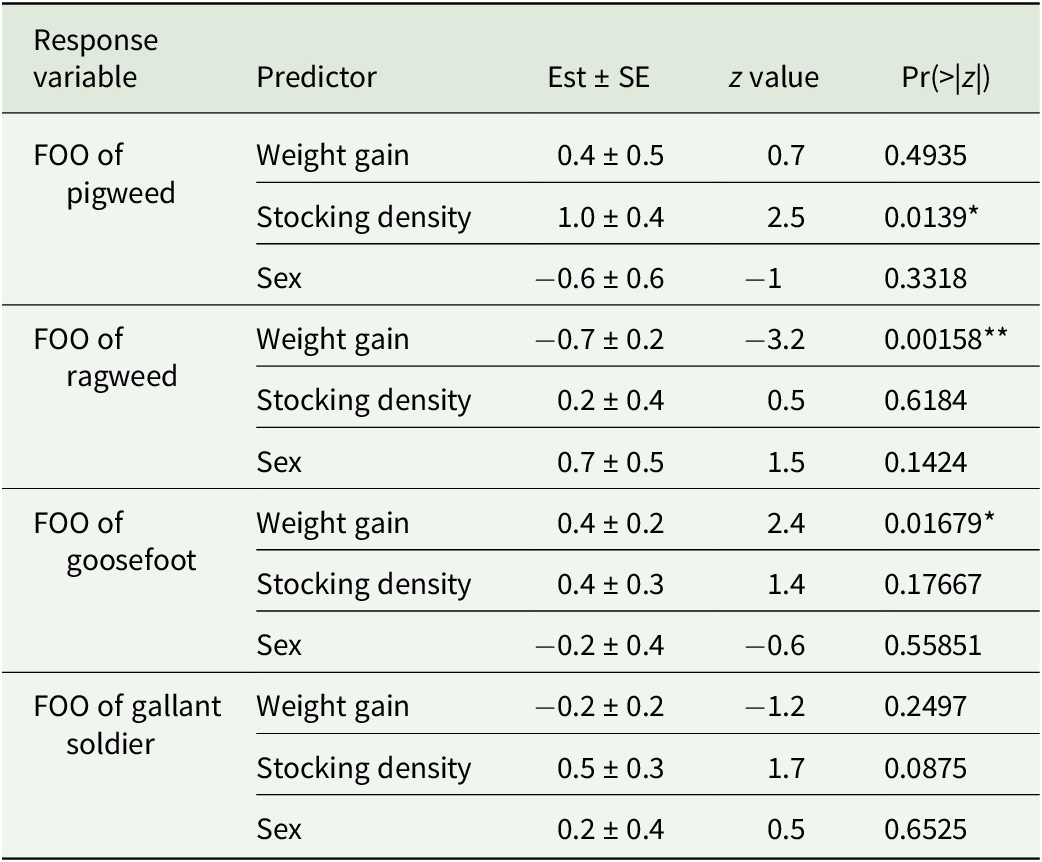
Note: The presence of the four commonly observed plant species, pigweed, ragweed, goosefoot, and gallant soldier were the response variables in these models while weight gain, stocking density, and sex were the explanatory variables. *p < 0.05; **p < 0.01; ***p < 0.001.
Effect of short-term feed restriction on diet richness and on FOO (2022 only)
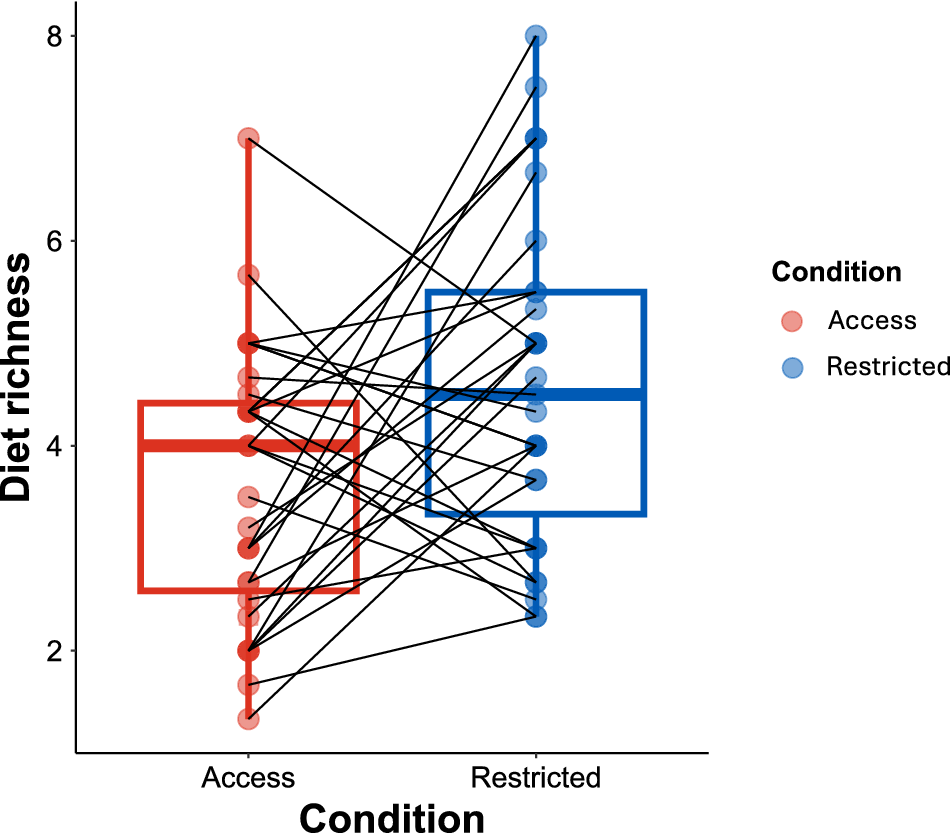
There was a significant effect of feed restriction on diet richness (Fig. 3), in which the feed-restricted birds had more diverse diets compared to the birds that were fed ad libitum (Table 4). For the four most common plant species (pigweed, ragweed, goosefoot, gallant soldier) consumed by pastured broilers, only gallant soldier was consumed more frequently by birds under a feed restriction (Table 5).
Boxplot of paired observations between feed restriction treatment shows diet richness differed between treatments. Each pair of data points represents an individual bird in two different conditions (at different time points, either experiencing feed restriction or not).
Summary statistics of linear mixed effects model obtained from the feed restriction experiment

Note: The feed restriction treatments (restricted or free access to feed), weight gain, sex, and stocking density were included as predictor variables while diet richness was the response variable in the model. The band numbers of experimental birds, block, and sample collecting dates were included as random effects. The breed was not considered in this model since the feed restriction experiment was performed only with Cornish Cross in the third year of the study (2022). *p < 0.05; **p < 0.01; ***p < 0.001.
Summary statistics from binomial model analysis of the feed restriction experiment
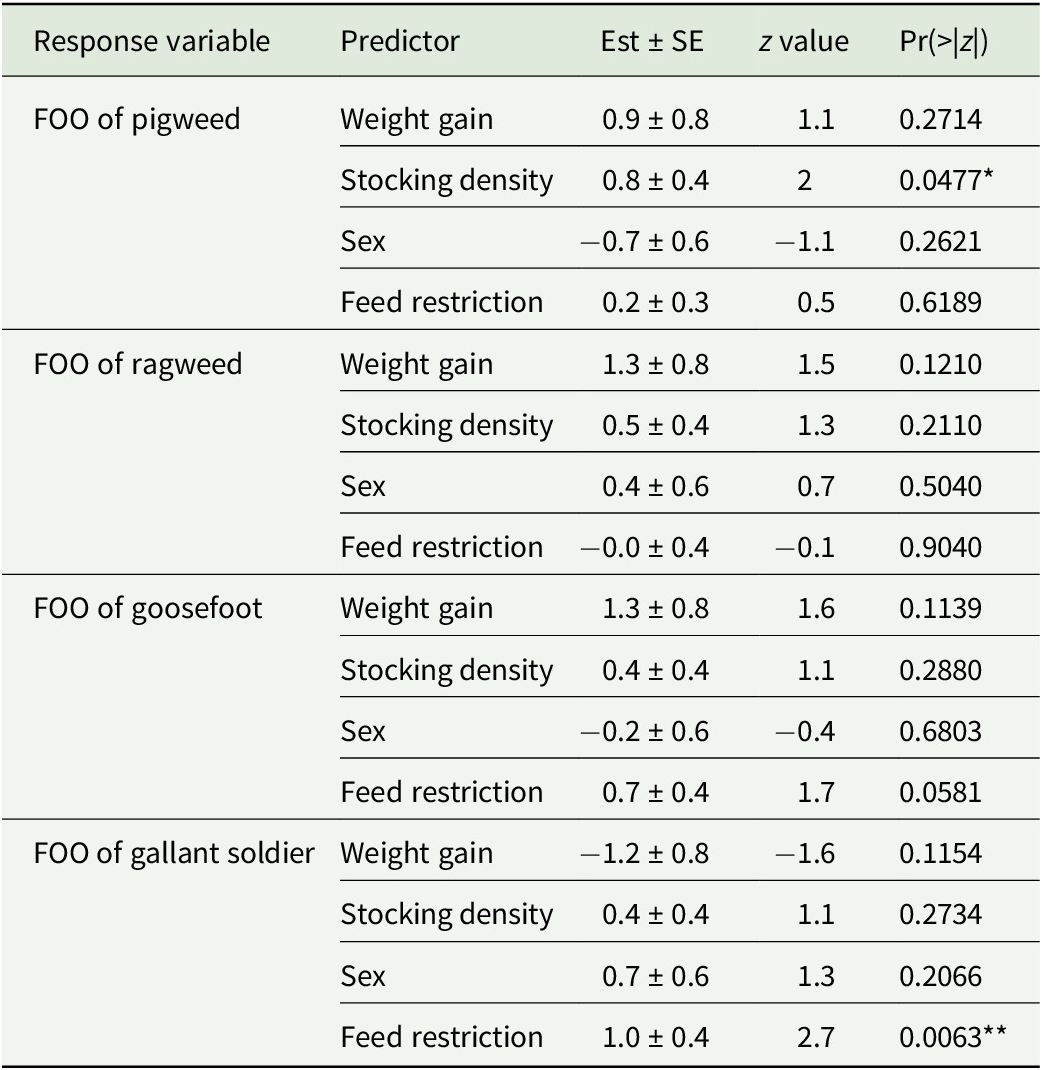
Note: Only excreta samples from 2022 (year 3) were included in this analysis. The model compares the effect of weight gain, stocking density, sex, and feed restriction on the frequency of occurrence of pigweed, ragweed, goosefoot, and gallant soldier. *p < 0.05; **p < 0.01; ***p < 0.001.
Diet community composition
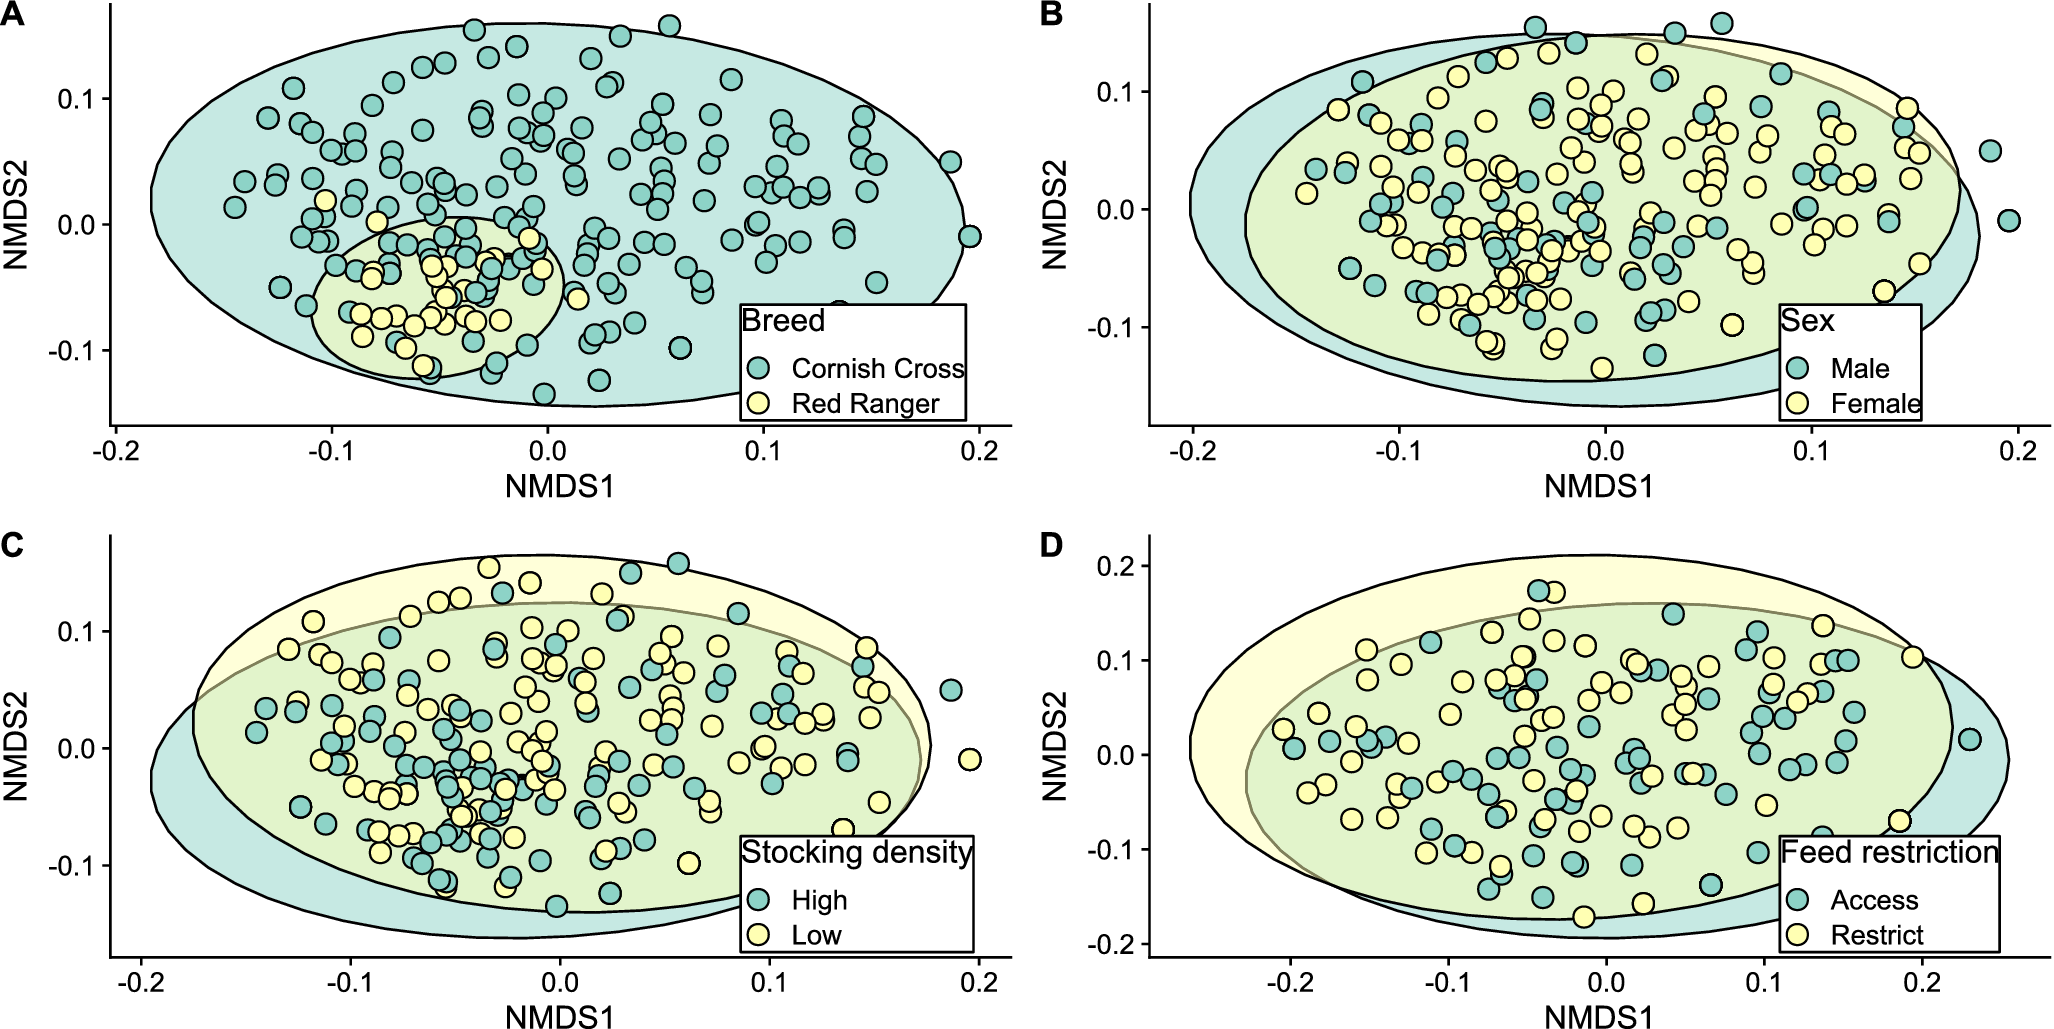
Permutation tests of multivariate homogeneity of group dispersions found heterogeneous dispersion in stocking density (p = 0.037) and breed (p < 0.001) treatment groups but not sex (p = 0.533) or feed restriction (p = 0.103) treatment groups. A PERMANOVA analysis found that broiler diet composition differed between high- and low-density treatments (The adonis test result showed p = 0.04; for years 2020–2022; Fig. 4C). However, there was no difference in diet composition between different sexes (p = 0.384; Fig. 4B) or breeds of birds (p = 1.000 Fig. 4A). In 2022, the diet composition of broilers in the short-term feed restriction treatment differed from the unrestricted treatment group (p = 0.032; Fig. 4D).
Non-metric multidimensional scaling plots show combined plant and arthropod diet community composition comparing between the different treatment of (A) chicken breed, (B) sex, (C) stocking density, and (D) feed restriction. Adonis test confirmed that feed restriction and stocking density influenced diet community composition (p = 0.032 and 0.04, respectively) and ellipses represent a 95% confidence interval of treatment-specific centroids (not-shown). Stress was 0.229 for A, B, and C and 0.194 for D. Number of reduced dimensions was k = 2 for all ordinations.
Effect of management on FCR
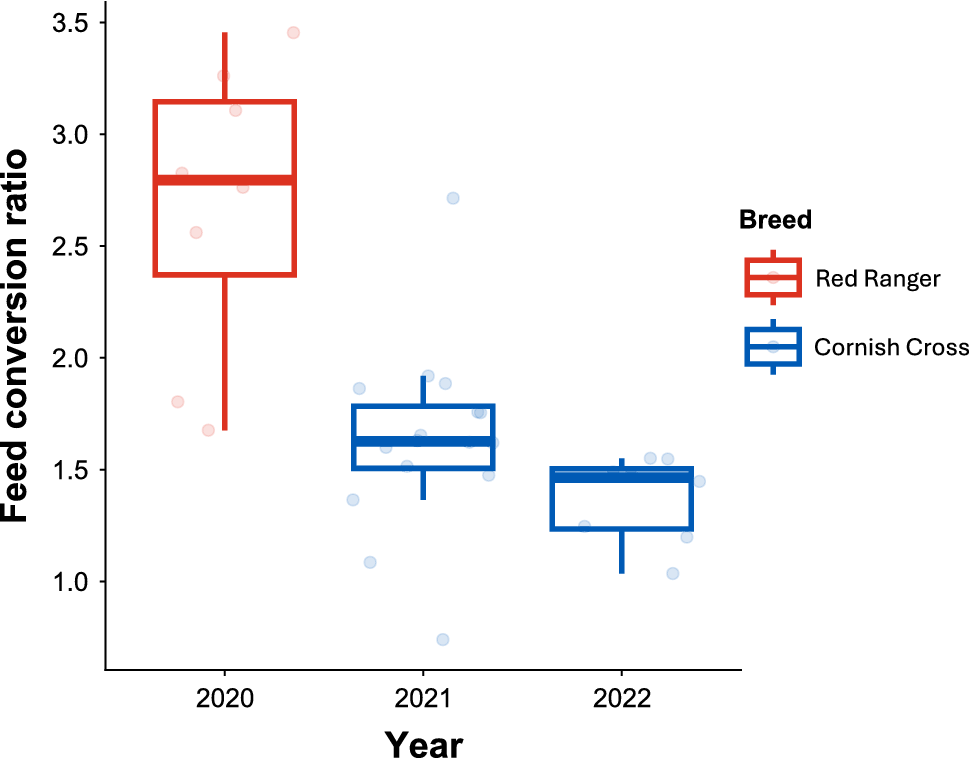
The FCR was impacted by the year of the experiment (F 2,17 = 16, p < 0.001) but not stocking density treatment (F 1,17 = 0.5, p = 0.497). Across years, the FCR of broilers in 2020 (slow-growing broilers; Red Ranger), was 68% (p = 0.0017) and 91% (p = 0.0001) higher than in years 2021 and 2022 (fast-growing broilers; Cornish Cross), respectively (Fig. 5). This suggests the slow-growing broilers in 2020 had lower feed-use efficiency per kg of meat produced relative to fast-growing broilers. There was no difference between the feed conversion ratios of the year 2021 (no-feed restriction) and 2022 (short-term feed restriction; p = 0.4603) for fast-growing broilers, suggesting the short-term feed restriction did not improve or reduce feed-use efficiency.
Box plot shows feed conversion ratio (FCR) comparing between years of experiment. The Red Ranger birds were used for year 2020 and the Cornish Cross birds were used in year 2021 (feed un-restricted) and 2022 (short-term feed restriction).
Discussions
Chickens are omnivorous and have been shown to suppress insect pest populations in organic orchard settings (Clark and Gage, Reference Clark and Gage1996). However, their impact on insect populations in pasture environments is less clear. While it is hypothesized that chickens may negatively impact insect populations through direct consumption or habitat disturbance, the specific mechanisms and dietary preferences of pastured chickens remain poorly understood. To address this knowledge gap, we conducted a study involving broiler chickens introduced to a cover crop pasture. The birds were housed in movable-floorless tractors, enabling them to access fresh vegetation and insects daily. We compared different management strategies, including chicken breed, stocking density, and supplemental feed restriction, to assess their influence on diet composition. The primary finding of this study is that pastured broilers consumed a diversity of pasture plants but few insect species. Slower-growing broiler chickens, reduced poultry density, and short-term feed restriction led to increased diet diversity. However, it was observed that slow-growing broilers had a higher FCR. Moreover, our analysis revealed no evidence to suggest that lowered stocking density or short-term feed restriction resulted in a statistical reduction of FCR or improvement of feed-use efficiency. These outcomes not only contribute to the informed management of pastured poultry but also offer valuable insights into the ecological dynamics of pastured poultry systems and integrated agricultural practices. In the following sections, we discuss insight into pasture-raised broiler diet composition through the lens of DNA metabarcoding-based diet analysis, pertinent management implications and recommendations, and propose avenues for future research.
Plant and arthropod diet composition
Poultry in this study consumed a diverse diet of plants but few arthropod species (Fig. 1). The plant species identified as diet items were those we expected to find, including those purposefully planted as part of the cover crop and common farm weed species. Interestingly, common farm weeds (e.g., pigweed, ragweed, gallant soldier, goosefoot) were consumed more substantially than the planted cover crop species (e.g., teff, clover, cowpea). It has been shown that poultry preference for forage species is dependent on the plant species, the nutritional content, height, and stage of growth of the plant, as well as the nutritional needs of the bird, starvation status, and its foraging instincts (Wood, Reference Wood1956; Salatin, Reference Salatin2004; Horsted, Reference Horsted2006; Singh and Cowieson, Reference Singh and Cowieson2013; Meng et al., Reference Meng, Mao, Guo and Tian2016). In our pasture setting, teff and cowpea thrived and could be over 30 cm in height when the birds were introduced to the pasture; thus, thicker/woodier stems may have made these species less preferred by the poultry, similar to the results from Horsted (Reference Horsted2006) who found preference for shorter forage species.
Garcia et al. (Reference Garcia, Halmos, Thongjued, Dupuis and Gonthier2023) assessed arthropod diversity and cover crop biomass in the same experimental setup as this study for the years 2020 and 2021. Pitfall traps were used to collect ground-dwelling arthropods, and sweep-net sampling was conducted to collect plant-dwelling arthropods in plots previously occupied by chickens. Interestingly, the introduction of broilers to the pasture resulted in a decrease in the abundance of plant-dwelling arthropods. This reduction could be the result of a combination of direct consumption of insects as well as trampling of plant matter and destruction of insect habitats (see Supplementary Fig. S1). However, our finding that broilers consume a low arthropod diet diversity (discussed below) and a higher diversity of pasture plants corroborates the hypothesis that poultry impact plant-dwelling arthropods through the elimination of pasture plants and not through direct consumption (Garcia et al. Reference Garcia, Halmos, Thongjued, Dupuis and Gonthier2023).
Forage plant species have been shown to make up anywhere from 5% to 20% of pastured poultry diets depending on the type and age of poultry, and the quality of forage (Mattocks, Reference Mattocks2002). However, observations from the higher end of that range are the result of foraging on crop species such as clover and alfalfa (Mattocks, Reference Mattocks2002), and most studies comparing poultry performance and pasture intake have been done in free-range areas consisting of grass pasture or monocropping pasture systems (Bassler, Reference Bassler2005; Antell and Ciszuk, Reference Antell and Ciszuk2006; Horsted, Reference Horsted2006; Ponte et al., Reference Ponte, Prates, Crespo, Crespo, Mourão, Alves, Bessa, Chaveiro-Soares, Gama and Ferreira2008a, Reference Ponte, Rosado, Crespo, Crespo, Mourão, Chaveiro-Soares, Bras, Mendes, Gama and Prates2008b; Singh and Cowieson, Reference Singh and Cowieson2013). The consumption of many plant species on pastures also highlights the importance of broilers in weed management, but the explicit study of plant species preferences would elucidate this usefulness.
Unlike plant diet items, arthropod diet items were relatively rare and lacked diversity. Only 18 arthropod species/ASVs were identified in all 3 years of the study, and the majority of those were singleton detections from a single excreta sample. Overall, the families detected here do match our expectations of arthropod diversity in this ecosystem. Garcia et al. (Reference Garcia, Halmos, Thongjued, Dupuis and Gonthier2023) used pitfall traps and sweep net samples to assess arthropod diversity in this setting and found similar family representation as detected here. Although Garcia et al. (Reference Garcia, Halmos, Thongjued, Dupuis and Gonthier2023) did not conduct species-level morphological identifications as part of their study, we did superficially identify the same morphospecies in their samples as we identified molecularly here (Thongjued, Garcia, unpublished).
The most prevalent arthropod detected in the diet of these pastured poultry were gall midges of the family Cecidomyiidae. This family is highly diverse, with >6,600 described species (Dorchin et al., Reference Dorchin, Harris and Stireman2019), but given their small size and difficult identification, there are very few Cecidomyiid DNA barcodes available on NCBI/BOLD that are identified to species. Thus, we were limited to family-level identification for all 79 detections of the family in our data. We hypothesize that most of this consumption was indirect feeding on larvae inside their galls on various cover crops and weed plants. Gall midges are very common in agricultural settings, both in cover crops, e.g., clover, teff, rye grass (Felt, Reference Felt1911; Macdougall, Reference Macdougall1913; Agee and Holdaway, Reference Agee and Holdaway1963), and common farm weed species, e.g., dandelion, ragweed, plantain, goosefoot, and ironweed (Felt, Reference Felt1911; Gagne, Reference Gagne1975; Gagné and Jaschhof, Reference Gagné and Jaschhof2004; Dorchin et al., Reference Dorchin, Harris and Stireman2019). Other commonly detected arthropods included various species of mites (Class Arachnida) and scarab beetles (Coleoptera: Scarabaeidae). Mite diversity in our data was dominated by two species of dust mites and the scaly grain mite (Suidasia nesbitti), and thus, were likely also the result of indirect feeding on mite-infested feed, a recognized problem in poultry production (Ta-Phaisach et al., Reference Ta-Phaisach, Konvipasruang, Sringarm, Chiu, Attasopa and Chanbang2023). Scarab beetles are common in agricultural settings in this region, and morpho-species identification of scarabs collected by Garcia et al. (Reference Garcia, Halmos, Thongjued, Dupuis and Gonthier2023) indicate six species. Interestingly, other prevalent arthropods which we expected to represent major components of chicken diets were generally only detected as singletons, e.g., various pest caterpillars (Spodoptera armyworms), orthopterans (Melanoplus grasshoppers), and hemipterans (Cicadellidae; Forcipata loca and Pentatomidae; Euschistus servus). We also only detected one occurrence of the common house fly Musca domestica, which was the dominant arthropod species found by Garcia et al. (Reference Garcia, Halmos, Thongjued, Dupuis and Gonthier2023), representing 21% of all specimens collected (11,069 of 52,692 specimens).
This discrepancy between plant and arthropod consumption in our data may be explained in several ways. First, it has been shown that when young birds shift from cereal-based feed to natural forage, a transition time of 6–7 weeks is required for physical adaptation of the digestive system (including crop, gizzard, and small intestine) to forage diet (Horsted and Hermansen, Reference Horsted and Hermansen2007). Here, the broilers were placed on pasture for 3–8 weeks, which might not be long enough for the birds to physically adapt to new food resources. Foraging activity in pasture settings is also positively correlated with the age of broilers and early exposure to the pasture/range area (Almeida, Reference Almeida2012; Ferreira et al., Reference Ferreira, Simoni, Germain, Leterrier, Lansade, Collin, Mignon-Grasteau, Le Bihan-Duval, Guettier and Leruste2022), and thus young birds with no exposure to older individuals (from which they might learn more effective foraging behavior) may decrease foraging effectiveness. Finally, given that both feed and forage plants were readily available without excessive effort, optimal foraging theory (the least effort hypothesis) would predict individuals to maximize intake and minimize energy expenditure (Osborne, Reference Osborne1977). Thus, arthropod diet items, which require chasing, scratching, and digging may fall outside the scope of ‘low effort’ food. Additionally, domesticated poultry are less likely to engage in the behavior of contrafreeloading than junglefowl (the ancestor of the modern chicken) (Lindqvist et al., Reference Lindqvist, Zimmerman and Jensen2006), which is an observed behavior where individuals will preferentially select food that requires effort to obtain, when given the choice between that and identical food that is readily available (Lindqvist et al., Reference Lindqvist, Schütz and Jensen2002, Reference Lindqvist, Zimmerman and Jensen2006; Ferreira et al., Reference Ferreira, Simoni, Germain, Leterrier, Lansade, Collin, Mignon-Grasteau, Le Bihan-Duval, Guettier and Leruste2021). Within domesticated varieties, layers are also more prone to contrafreeload than broilers (Lindqvist et al., Reference Lindqvist, Schütz and Jensen2002, Reference Lindqvist, Zimmerman and Jensen2006; Baxter, Reference Baxter2018; Ferreira et al., Reference Ferreira, Simoni, Germain, Leterrier, Lansade, Collin, Mignon-Grasteau, Le Bihan-Duval, Guettier and Leruste2021), which has been proposed to be a byproduct of artificial selection for increased production traits (Lindqvist et al., Reference Lindqvist, Zimmerman and Jensen2006). In the breeds used here, the Red Rangers did have higher diet richness (Table 2; Fig. 2B) and were behaviorally more active than the Cornish Cross broilers, supporting previous findings. Thus, the use of broilers (Cornish Cross) and hybrid breeds (Red Ranger) in our study may predispose these birds to low-energy investment feeding strategies and food items.
Management implications
Alternative poultry production systems are gaining popularity in the United States as they are perceived as improving animal welfare and as a more sustainable option than conventional mass production systems. Producers who integrate poultry into their production systems can potentially increase profits through product diversification, reduced farm input, and ecosystem services that the poultry may provide. Historically, studies examining these alternative production systems have focused on economic and environmental benefits and production such as breeds of the birds (genetics) and forage access (Salatin, Reference Salatin1993; Castellini et al., Reference Castellini, Bosco, Mugnai and Bernardini2002; Fanatico et al., Reference Fanatico, Polson and Born2005, Reference Fanatico, Owens and Emmert2009). However, methods to increase forage utilization are not well-informed, and quantitative diet data for chickens on pasture remain scarce.
Short-term feed restriction can potentially be used to increase pasture use and diet diversity without limiting feed-use efficiency or increasing resource use rate per bird. We showed that a 4-h feed restriction increased fast-growing broiler consumption of pasture diet items (in 2022). Further, of the 3 years of the study, the short-term feed restriction had the greatest feed use efficiency. This is consistent with many studies that have found that feed restriction increases foraging behavior. Girard et al. (Reference Girard, Zuidhof and Bench2017) found that ‘skip-a-day-fed’ pullets exhibited less restless behavior and foraged more, as compared to precision-fed pullets, in which underweight individual birds were provided small individual meals, multiple times per day (Girard et al., Reference Girard, Zuidhof and Bench2017). Dixon et al (Reference Dixon, Brocklehurst, Sandilands, Bateson, Tolkamp and D’Eath2014) found that feed-restricted birds worked harder to reach foraging areas, took less time to reach those areas, and spent more time foraging in those areas than birds with greater access to food (Dixon et al., Reference Dixon, Brocklehurst, Sandilands, Bateson, Tolkamp and D’Eath2014). Short-term feed restriction may also have benefits to metabolic health of fast-growing broilers. In 2021, the Cornish Cross birds were provided with unrestricted access to feed, resulting in excessive consumption and some birds had metabolic health challenges including ascites and heart failure-like symptoms (Julian, Reference Julian2005; Olkowski et al., Reference Olkowski, Wojnarowicz, Nain, Ling, Alcorn and Laarveld2008). However, these issues were mitigated in 2022 by implementing a brief period of feed restriction during the finishing phase. Thus, at least for fast-growing breeds, employing feed restriction appears to increase forage use. Again, a more explicit study with a wider variety of breeds will expand on this management recommendation.
The birds in low-density treatments across 3 years of experiment consumed a higher diversity of diet items from the pasture. This more diverse diet may be due to less competition among individuals in accessing food resources. In addition, low stocking density may reduce stress and the likelihood of aggressive behaviors (e.g., threatening, chasing, pecking, fighting) that can prevent individuals from foraging (Phillips and Heins, Reference Phillips and Heins2021). Sanchez-Casanova et al., (Reference Sanchez-Casanova, Sarmiento-Franco, Segura-Correa and Phillips2019, Reference Sanchez-Casanova, Sarmiento-Franco and Phillips2021) conducted outdoor access experiments with two stocking densities and found that Cornish Cross birds that were given outdoor access with low stocking density foraged more, were significantly heavier, and had a lower FCR than those reared in the high-density group (Sanchez-Casanova et al., Reference Sanchez-Casanova, Sarmiento-Franco, Segura-Correa and Phillips2019, Reference Sanchez-Casanova, Sarmiento-Franco and Phillips2021). Thus, increasing pasture availability for higher stocking density may be an option to increase pasture use without jeopardizing feed-use efficiency. This could be achieved through increased rotational grazing (number of pen movements) in confined pull pens or via increasing access to total pasture in a ‘free-range’ pastured system. In our study, broilers were confined to a pen that was moved throughout the pasture; however, many producers allow broilers to free-range throughout the pasture during the day and only confine broilers to pens at night for protection from predators. Future studies could evaluate the effectiveness of broiler foraging in free-range and confined pens, as well as across a greater variation in the density of birds per pasture area.
Slow-growing broilers are marketed as excellent pasture-raised options with improved foraging (Fanatico et al., Reference Fanatico, Owens and Emmert2009; Ussery, Reference Ussery2011; Spencer, Reference Spencer2013; Fisher, Reference Fisher2016; Tufarelli et al., Reference Tufarelli, Ragni and Laudadio2018); however, they have higher FCR than fast-growing breeds. We used Cornish Cross and Red Ranger breeds as representatives of fast- and slow-growing breeds, with weeks to marketable weight of 6–8 weeks and 10–12 weeks, respectively. Overall, Red Rangers had higher diet richness than Cornish Cross, which supports the previous assumption that slow-growing broiler breeds are better adapted to pasture conditions as they are more active, particularly in foraging. Ultimately, however, we found the slow-growing Red Ranger broilers had higher FCR, and thus may be less cost-effective as compared to fast-growing broilers. It should be noted that the pasture composition differed between years (Table 1), and therefore, the differences observed in diet richness and FCR between breeds may not be due to breed alone. Nonetheless, economic feasibility studies comparing pasture-raised slow-growing and fast-growing broilers have concluded that slow-growing broilers take longer to achieve marketable weight, higher costs per pound of production, lower marketable weights, and higher break-even prices ($/lb) relative to fast-growing broilers (Painter et al., Reference Painter, Myhre, Bary, Cogger and Jemmett2015). This may explain why fast-growing broilers are the most commonly used breed for free-range/pasture-raised broiler production across the United States (Fanatico et al., Reference Fanatico, Polson and Born2005; Conner, Reference Conner2010; Pitesky et al., Reference Pitesky, Thorngren and Niemeier2019), even though they may have health issues caused by the rapid growth (Julian, Reference Julian2005; Fanatico et al., Reference Fanatico, Owens and Emmert2009). Further, in some environments with high humidity and temperatures, slow-growing broilers may be a more ethical consideration, given their more robust capability for growth and survival under these conditions. Given the diversity of breeds used in conventional and alternative poultry operations, this is an area that is ripe for future research and comprehensive evaluation of breed foraging characteristics may highlight other breeds that are more cost-effective via optimal use of pastured environments.
Conclusions
Alternative production systems such as free-range, pasture-raised, and organic have increased in popularity in the United Stated in recent years. Studying the functional ecology and relationships among organisms in this complex system play a key role to inform proper management. In this study, we used DNA metabarcoding diet analysis for the first time to study arthropod and plant diet composition in pasture-raised poultry. In addition to characterizing poultry diet in this system, we assessed the effects of poultry management techniques on diet diversity to identify practices for optimizing pasture utilization, feed use efficiency, and broiler productivity. We found that pastured broilers consumed many cover crop and weed plant families, but the diet richness of insect food items was surprisingly low. The most dominant insect food item was gall midges in the family Cecidomyiidae, which we hypothesize were consumed via galls in/on cover crops. Stocking density, feed restriction, and chicken breed affected diet richness, indicating an influence of those factors on forage utilization/foraging activities in pasture-raised broilers. These results support our hypothesis that certain management techniques can enhance dietary diversity and might be used to potentially offset feed costs. This study serves as a foundation for future investigations into the complex relationships between pasture ecology, poultry behavior, and management practices in alternative production systems. By advancing our understanding of these dynamics, we contribute to the development of more sustainable and efficient pasture-raised poultry productions.
Supplementary material
The supplementary material for this article can be found at http://doi.org/10.1017/S1742170525000092.
Acknowledgments
We are grateful to Poultry Research Specialist, Michael J. Ford for providing chicken samples to use as positive controls in sex determination. We wish to thank Ariana Spina for assistance with DNA extraction and Nat Colten for building chicken tractors, and Nate Haan, Holly Myers, Colby Grant, Alexis Gauger, Elaine Losekamp, Brianna Bazile (Gonthier/Hann lab members) for comments on an early draft of this manuscript, and two anonymous reviewers for their input.
Author contribution
Conceived and designed the experiments: J.R.D. and D.J.G.; performed the experiments: K.T., K.G., V.H., K.F.P.; analyzed the data: K.T., K.G., D.J.G.; contributed reagents/materials/analysis tools: D.J.G. and J.R.D.; wrote the article: K.T., K.G., K.F.P., V.H., J.R.D., and D.J.G.
Funding statement
This research was supported by USDA-NIFA HATCH grants to J.R.D. (Project KY008091) and D.G. (KY008079) and by USDA OREI Grant #2019-51300-30244 awarded to D.G. Sequencing was conducted at the OncoGenomics Shared Resource Facility of the University of Kentucky Markey Cancer Center (P30CA177558).
Competing interests
The authors declare none.


 Open access